Security Effectiveness Framework Study
Security Effectiveness Framework Study
Security Effectiveness Framework Study

You also want an ePaper? Increase the reach of your titles
YUMPU automatically turns print PDFs into web optimized ePapers that Google loves.
<strong>Security</strong> <strong>Effectiveness</strong> <strong>Framework</strong> study<br />
30.00<br />
20.00<br />
10.00<br />
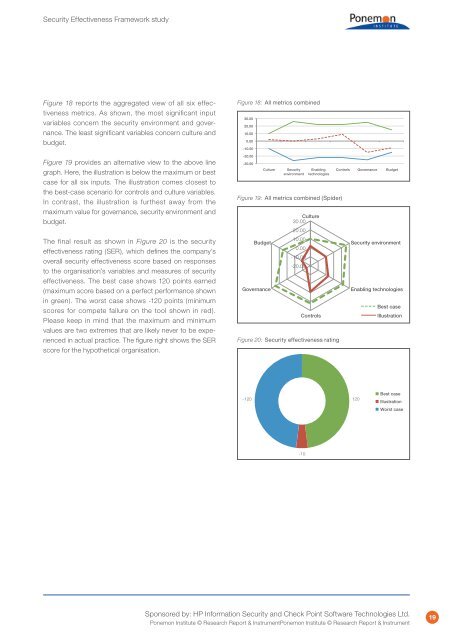
Figure 18 reports the aggregated view of all six effectiveness<br />
metrics. As shown, the most significant input<br />
variables concern the security environment and governance.<br />
The least significant variables concern culture and<br />
budget.<br />
Figure 19 provides an alternative view to the above line<br />
graph. Here, the illustration is below the maximum or best<br />
case for all six inputs. The illustration comes closest to<br />
the best-case scenario for controls and culture variables.<br />
In contrast, the illustration is furthest away from the<br />
maximum value for governance, security environment and<br />
budget.<br />
The final result as shown in Figure 20 is the security<br />
effectiveness rating (SER), which defines the company’s<br />
overall security effectiveness score based on responses<br />
to the organisation’s variables and measures of security<br />
effectiveness. The best case shows 120 points earned<br />
(maximum score based on a perfect performance shown<br />
in green). The worst case shows -120 points (minimum<br />
scores for compete failure on the tool shown in red).<br />
Please keep in mind that the maximum and minimum<br />
values are two extremes that are likely never to be experienced<br />
in actual practice. The figure right shows the SER<br />
score for the hypothetical organisation.<br />
0.00<br />
-10.00<br />
-20.00<br />
-30.00<br />
Figure 18: All metrics combined<br />
30.00<br />
20.00<br />
10.00<br />
0.00<br />
-10.00<br />
Culture<br />
-20.00<br />
-30.00<br />
<strong>Security</strong><br />
environment<br />
Culture<br />
Governance<br />
<strong>Security</strong><br />
environment<br />
Enabling<br />
technologies<br />
Enabling<br />
technologies<br />
Controls Governance Budget<br />
Worst case Illustration Best case<br />
30.00 Culture<br />
30.00 Culture 20.00<br />
Budget<br />
20.0010.00<br />
<strong>Security</strong> environment<br />
0.00<br />
10.00<br />
-10.00<br />
<strong>Security</strong> environment<br />
-20.00<br />
Controls<br />
Controls Governance Budget<br />
Worst case Illustration Best case<br />
Figure 19: All metrics combined (Spider)<br />
Budget<br />
Governance<br />
0.00<br />
-10.00<br />
-20.00<br />
Controls<br />
Figure 20: <strong>Security</strong> effectiveness rating<br />
Enabling technologies<br />
Best case<br />
Illustration<br />
Enabling technologies<br />
Best case<br />
Illustration<br />
-120<br />
120<br />
Best case<br />
Illustration<br />
Worst case<br />
-10<br />
Sponsored by: HP Information <strong>Security</strong> and Check Point Software Technologies Ltd.<br />
Ponemon Institute © Research Report & InstrumentPonemon Institute © Research Report & Instrument<br />
19