

View this Presentation - Penn Virginia Corporation
View this Presentation - Penn Virginia Corporation
View this Presentation - Penn Virginia Corporation

Create successful ePaper yourself
Turn your PDF publications into a flip-book with our unique Google optimized e-Paper software.
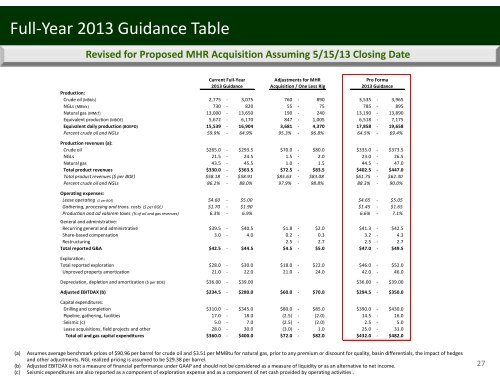
Full‐Year 2013 Guidance Table<br />
Revised for Proposed MHR Acquisition Assuming 5/15/13 Closing Date<br />
Current Full‐Year<br />
2013 Guidance<br />
Adjustments for MHR<br />
Acquisition / One Less Rig<br />
Pro Forma<br />
2013 Guidance<br />
Production:<br />
Crude oil (MBbls) 2,775 ‐ 3,075 760 ‐ 890 3,535 ‐ 3,965<br />
NGLs (MBbls) 730 ‐ 820 55 ‐ 75 785 ‐ 895<br />
Natural gas (MMcf) 13,000 ‐ 13,650 190 ‐ 240 13,190 ‐ 13,890<br />
Equivalent production (MBOE) 5,672 ‐ 6,170 847 ‐ 1,005 6,518 ‐ 7,175<br />
Equivalent daily production (BOEPD) 15,539 ‐ 16,904 3,681 ‐ 4,370 17,858 ‐ 19,658<br />
Percent crude oil and NGLs 59.9% ‐ 64.9% 95.3% ‐ 96.8% 64.5% ‐ 69.4%<br />
Production revenues (a):<br />
Crude oil $265.0 ‐ $293.5 $70.0 ‐ $80.0 $335.0 ‐ $373.5<br />
NGLs 21.5 ‐ 24.5 1.5 ‐ 2.0 23.0 ‐ 26.5<br />
Natural gas 43.5 ‐ 45.5 1.0 ‐ 1.5 44.5 ‐ 47.0<br />
Total product revenues $330.0 ‐ $363.5 $72.5 ‐ $83.5 $402.5 ‐ $447.0<br />
Total product revenues ($ per BOE) $58.18 ‐ $58.91 $85.63 ‐ $83.08 $61.75 ‐ $62.30<br />
Percent crude oil and NGLs 86.2% ‐ 88.0% 97.9% ‐ 98.8% 88.3% ‐ 90.0%<br />
Operating expenses:<br />
Lease operating ($ per BOE) $4.60 ‐ $5.00 $4.65 ‐ $5.05<br />
Gathering, processing and trans. costs ($ per BOE) $1.70 ‐ $1.90 $1.45 ‐ $1.65<br />
Production and ad valorem taxes (% of oil and gas revenues) 6.3% ‐ 6.9% 6.6% ‐ 7.1%<br />
General and administrative:<br />
Recurring general and administrative $39.5 ‐ $40.5 $1.8 ‐ $2.0 $41.3 ‐ $42.5<br />
Share‐based compensation 3.0 ‐ 4.0 0.2 ‐ 0.3 3.2 ‐ 4.3<br />
Restructuring 2.5 ‐ 2.7 2.5 ‐ 2.7<br />
Total reported G&A $42.5 ‐ $44.5 $4.5 ‐ $5.0 $47.0 ‐ $49.5<br />
Exploration:<br />
Total reported exploration $28.0 ‐ $30.0 $18.0 ‐ $22.0 $46.0 ‐ $52.0<br />
Unproved property amortization 21.0 ‐ 22.0 21.0 ‐ 24.0 42.0 ‐ 46.0<br />
Depreciation, depletion and amortization ($ per BOE) $36.00 ‐ $39.00 $36.00 ‐ $39.00<br />
Adjusted EBITDAX (b) $234.5 ‐ $280.0 $60.0 ‐ $70.0 $294.5 ‐ $350.0<br />
Capital expenditures:<br />
Drilling and completion $310.0 ‐ $345.0 $80.0 ‐ $85.0 $390.0 ‐ $430.0<br />
Pipeline, gathering, facilities 17.0 ‐ 18.0 (2.5) ‐ (2.0) 14.5 ‐ 16.0<br />
Seismic (c) 5.0 ‐ 7.0 (2.5) ‐ (2.0) 2.5 ‐ 5.0<br />
Lease acquisitions, field projects and other 28.0 ‐ 30.0 (3.0) ‐ 1.0 25.0 ‐ 31.0<br />
Total oil and gas capital expenditures $360.0 ‐ $400.0 $72.0 ‐ $82.0 $432.0 ‐ $482.0<br />
(a) Assumes average benchmark prices of $90.96 per barrel for crude oil and $3.51 per MMBtu for natural gas, prior to any premium or discount for quality, basin differentials, the impact of hedges<br />
and other adjustments. NGL realized pricing is assumed to be $29.38 per barrel.<br />
(b) Adjusted EBITDAX is not a measure of financial performance under GAAP and should not be considered as a measure of liquidity or as an alternative to net income.<br />
(c) Seismic expenditures are also reported as a component of exploration expense and as a component of net cash provided by operating activities .<br />
27
