Ocean- Atmosphere Interactions During Cyclone Nargis
Ocean- Atmosphere Interactions During Cyclone Nargis
Ocean- Atmosphere Interactions During Cyclone Nargis

You also want an ePaper? Increase the reach of your titles
YUMPU automatically turns print PDFs into web optimized ePapers that Google loves.
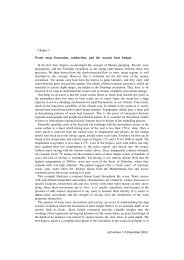
Eos, Vol. 90, No. 7, 17 February 2009<br />
EOS, TRANSACTIONS, AMERICAN GEOPHYSICAL UNION<br />
VOLUME 90 NUMBER 7<br />
17 FEBRUARY 2009<br />
PAGES 53–60<br />
<strong>Ocean</strong>- <strong>Atmosphere</strong> <strong>Interactions</strong><br />
<strong>During</strong> <strong>Cyclone</strong> <strong>Nargis</strong><br />
PAGES 53–54<br />
<strong>Cyclone</strong> <strong>Nargis</strong> (Figure 1a) made landfall<br />
in Myanmar (formerly Burma) on 2 May<br />
2008 with sustained winds of approximately<br />
210 kilometers per hour, equivalent to a category<br />
3– 4 hurricane. In addition, <strong>Nargis</strong><br />
brought approximately 600 millimeters of<br />
rain and a storm surge of 3– 4 meters to the<br />
low- lying and densely populated Irrawaddy<br />
River delta. In its wake, the storm left an estimated<br />
130,000 dead or missing and more<br />
than $10 billion in economic losses. It was<br />
the worst natural disaster to strike the Indian<br />
<strong>Ocean</strong> region since the 26 December 2004<br />
tsunami and the worst recorded natural<br />
disaster ever to affect Myanmar.<br />
The <strong>Nargis</strong> disaster was arguably caused<br />
more by a failure to heed and act on early<br />
warnings than by a failure to observe the<br />
storm’s advance [Webster, 2008]. Nonetheless,<br />
understanding the oceanic and atmospheric<br />
processes that govern the genesis,<br />
intensification, and path of severe tropical<br />
storms can contribute to the development of<br />
improved forecast systems for the protection<br />
of lives and property.<br />
<strong>Nargis</strong> (Urdu for “daffodil”) was spawned<br />
at a time when the international community<br />
was implementing a sustained Indian <strong>Ocean</strong><br />
Observing System ( IndOOS) for the study of<br />
phenomena spanning timescales that range<br />
from synoptic weather events to climate<br />
change [Meyers and Boscolo, 2006]. IndOOS<br />
(see Figure S1, in the electronic supplement<br />
to this Eos i s s ue ( ht t p: // w w w . a g u . o r g /e o s<br />
_elec/)) consists of a constellation of Earthobserving<br />
satellites for key environmental<br />
parameters such as winds, sea surface temperature<br />
(SST), and sea level plus complementary<br />
in situ networks including the Argo<br />
global float array and the Research Moored<br />
Array for African- Asian- Australian Monsoon<br />
Analysis and Prediction (RAMA, [McPhaden<br />
et al., 2009]). This article describes the evolution<br />
of <strong>Nargis</strong> and its effects on the ocean<br />
BY M. J. MCPHADEN, G. R. FOLTZ, T. LEE,<br />
V. S. N. MURTY, M. RAVICHANDRAN, G. A. VECCHI,<br />
J. VIALARD, J. D. WIGGERT, AND L. YU<br />
as captured by elements of this observing<br />
system.<br />
Development of <strong>Nargis</strong><br />
Tropical storms in the Bay of Bengal occur<br />
most frequently in October– December with<br />
a secondary peak in April– May. Relatively<br />
high (28º– 30°C) SSTs, a thermo dynamically<br />
unstable atmosphere, and low tropospheric<br />
wind shears favor these seasons for tropical<br />
storm development. Thus, the timing of <strong>Nargis</strong><br />
was not unusual. Nor was its strength<br />
unprecedented: <strong>Cyclone</strong>s of similar intensity<br />
hit Myanmar in May 1982 and April 2006.<br />
In both instances, landfall was north of the<br />
most densely populated parts of the country.<br />
In mid- April 2008, SSTs in the Bay of Bengal<br />
were 29º– 30°C (Figures 2 and 3) and<br />
tropospheric wind shears were 30% weaker<br />
than normal. Against this backdrop, <strong>Nargis</strong><br />
originated as a tropical depression in<br />
the southeastern Bay of Bengal on 24 April<br />
and then began tracking northwestward<br />
toward India. The depression became nearly<br />
stationary on encountering a region of climatologically<br />
high tropical cyclone heat<br />
potential (Figure 1c), where it intensified to<br />
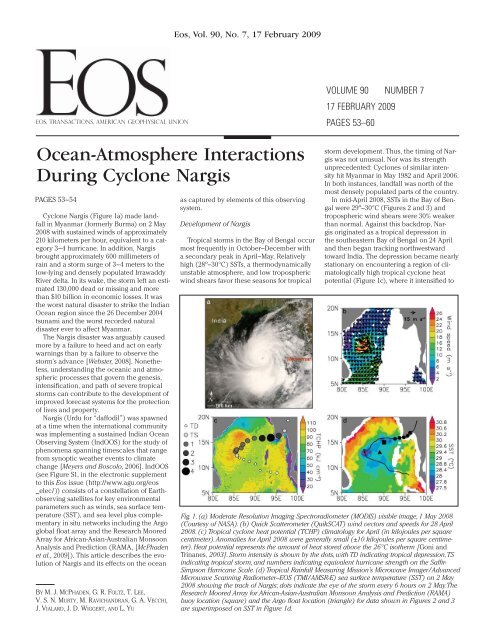
Fig. 1. (a) Moderate Resolution Imaging Spectroradiometer (MODIS) visible image, 1 May 2008<br />
(Courtesy of NASA). (b) Quick Scatterometer (QuikSCAT) wind vectors and speeds for 28 April<br />
2008. (c) Tropical cyclone heat potential ( TCHP) climatology for April (in kilojoules per square<br />
centimeter). Anomalies for April 2008 were generally small (±10 kilojoules per square centimeter).<br />
Heat potential represents the amount of heat stored above the 26°C isotherm [Goni and<br />
Trinanes, 2003]. Storm intensity is shown by the dots, with TD indicating tropical depression, TS<br />
indicating tropical storm, and numbers indicating equivalent hurricane strength on the Saffir-<br />
Simpson Hurricane Scale. (d) Tropical Rainfall Measuring Mission’s Microwave Imager/ Advanced<br />
Microwave Scanning Radiometer– EOS (TMI/ AMSR- E) sea surface temperature (SST) on 2 May<br />
2008 showing the track of <strong>Nargis</strong>; dots indicate the eye of the storm every 6 hours on 2 May. The<br />
Research Moored Array for African- Asian- Australian Monsoon Analysis and Prediction (RAMA)<br />
buoy location (square) and the Argo float location (triangle) for data shown in Figures 2 and 3<br />
are superimposed on SST in Figure 1d.
Eos, Vol. 90, No. 7, 17 February 2009<br />
Fig. 2. Real- time surface meteorological data (approximately every 3 hours) from the 15°N, 90°E<br />
RAMA mooring during the approach of cyclone <strong>Nargis</strong>. Surface turbulent fluxes (latent and sensible)<br />
are estimated using a bulk algorithm. Satellite telemetry of data from the mooring stopped<br />
on 1 May as the storm passed by, though the mooring survived and all internally recorded<br />
subsurface ocean data were recovered in October 2008. Arrows in the top panel indicate wind<br />
speed and direction as per the scale on the left.<br />
tropical storm strength (sustained winds of<br />
63– 117 kilo meters per hour) on 28 April. The<br />
Indian Meteorological Department named<br />
the storm <strong>Nargis</strong> at that point and 9 hours<br />
later upgraded it to a severe (i.e., hurricane<br />
intensity) tropical cyclone. <strong>Nargis</strong> then<br />
veered to the northeast, steered by middle<br />
tropospheric winds that shifted to westerly<br />
in association with the buildup of a highpressure<br />
ridge to the south.<br />
As <strong>Nargis</strong> approached a RAMA mooring<br />
at 15°N, 90°E in late April, surface pressure<br />
dropped, winds intensified, relative humidity<br />
increased, and air temperature decreased<br />
(Figure 2). Turbulent heat loss from the<br />
ocean dramatically increased to more than<br />
600 watts per square meter for one 3- hour<br />
period on 1 May as <strong>Nargis</strong> made its closest<br />
approach to the buoy. This heat loss helped<br />
to cool the surface and also fuel intensification<br />
of the storm (to an equivalent category<br />
3–4 hurricane) on 1 May just before it made<br />
landfall in Myanmar [Lin et al., 2008].<br />
<strong>Ocean</strong> Response to <strong>Nargis</strong><br />
High SSTs that energize tropical storms in<br />
the Bay of Bengal are maintained in part by<br />
a freshwater cap produced from river runoff<br />
and open ocean rainfall. This freshwater<br />
cap creates thin surface mixed layers atop<br />
salinity- stratified “barrier layers” that isolate<br />
the surface from colder waters of the thermocline<br />
(Figure 3). Thin mixed layers have<br />
low heat capacity so that radiant heat from<br />
the Sun can sustain elevated SSTs in the<br />
absence of strong sources of vertical turbulent<br />
mixing.<br />
Argo float data show that the mixed layer<br />
was very thin (~10 meters) and SSTs were<br />
nearly 30°C in the central Bay of Bengal from<br />
late March to mid- April, conditions favorable<br />
for cyclone development (Figure 3). The mixing<br />
up of colder water from the thermocline<br />
at this time was inhibited by low wind speeds<br />
and relatively fresh surface salinities of less<br />
than 33. However, as the storm approached<br />
the location of the Argo float, intensifying<br />
surface winds increased turbulence generation<br />
via mechanical stirring. In addition, anticyclonically<br />
rotating winds to the right of a<br />
moving storm (as seen in Figure 2) resonantly<br />
force inertial oscillations that produce strong<br />
vertical current shears and flow instabilities,<br />
which are an additional source of turbulence<br />
[Price, 1981]. Thus, enhanced vertical mixing<br />
associated with <strong>Nargis</strong> deepened the surface<br />
mixed layer and eroded the barrier layer in<br />
the central Bay. The resulting entrainment of<br />
cold, high- salinity water from the thermocline<br />
lowered SST and increased surface salinity<br />
(Figure 3). Similarly, the diurnal cycle in SST<br />
disappeared at the RAMA mooring (Figure 2)<br />
as surface water heated by the Sun was vigorously<br />
mixed into the upper ocean.<br />
The combined impact of <strong>Nargis</strong> on SST<br />
from enhanced ocean mixing and turbulent<br />
heat loss to the atmosphere was a 2º– 3°C<br />
drop in surface temperature (Figure 1d). The<br />
cooling was most pronounced to the right<br />
of the storm track especially after the storm<br />
intensified and migrated eastward, consistent<br />
with the expectation that inertial oscillations<br />
and thus enhanced vertical mixing are<br />
stronger to the right of a translating storm.<br />
Jason 1 satellite altimeter measurements<br />
indicated that significant wave heights were<br />
highest (3– 4 meters) to the right of the storm<br />
where the winds were strongest (Figure 1b),<br />
which also would have contributed to vertical<br />
mixing and surface cooling. The isolated<br />
temperature minimum (SST ≤ 27.5°C) coincided<br />
with the location where <strong>Nargis</strong> temporarily<br />
stalled and intensified on 28 April.<br />
The hydrographic conditions that isolate<br />
the surface layer from the thermocline in<br />
the central Bay of Bengal also restrict nutrient<br />
input into the surface waters, thus leading<br />
to a persistent deep chlorophyll maximum<br />
and oligotrophic surface waters. Given<br />
the intense vertical mixing generated by<br />
<strong>Nargis</strong>, an injection of nutrients into surface<br />
waters and a subsequent phytoplankton<br />
bloom would be expected within the cool<br />
SST wake, a biological response observed<br />
in past hurricanes. <strong>Ocean</strong> color retrievals<br />
following <strong>Nargis</strong>’s passage were sparse due<br />
to interference from extensive cloud cover.<br />
However, the available Sea- viewing Wide<br />
Field- of- view Sensor ( SeaWiFS) data suggest<br />
up to a threefold increase in chlorophyll<br />
concentrations (to 0.3– 0.5 milligrams<br />
chlorophyll per cubic meter) over normal<br />
conditions.<br />
Science in Service to Society<br />
Although IndOOS is only partially complete,<br />
with some components such as<br />
RAMA a few years from full implementation,<br />
it is already providing unique data<br />
for studies of tropical cyclones like <strong>Nargis</strong>,<br />
ocean- atmosphere interactions associated<br />
with the 30- to 60- day- period Madden- Julian
Eos, Vol. 90, No. 7, 17 February 2009<br />
This is Pacific Marine Environmental Laboratory<br />
contribution 3274 and National Institute<br />
of <strong>Ocean</strong>ography contribution 4481.<br />
References<br />
Goni, G. J., and J. A. Trinanes (2003), <strong>Ocean</strong> thermal<br />
structure monitoring could aid in the intensity<br />
forecast of tropical cyclones, Eos Trans. AGU,<br />
84(51), 573, 577– 578.<br />
Horii, T., H. Hase, I. Ueki, and Y. Masumoto (2008),<br />
<strong>Ocean</strong>ic precondition and evolution of the 2006<br />
Indian <strong>Ocean</strong> dipole, Geophys. Res. Lett., 35,<br />
L03607, doi:10.1029/ 2007GL032464.<br />
Lin, I.- I., C.- H. Chen, I.- F. Pun, W. T. Liu, and C.-C.<br />
Wu (2009), Warm ocean anomaly, air sea fluxes,<br />
and the rapid intensification of tropical cyclone<br />
<strong>Nargis</strong> (2008), Geophys. Res. Lett., 36, L03817,<br />
doi:10.1029/ 2008GL035815.<br />
McPhaden, M. J., G. Meyers, K. Ando, Y. Masumoto,<br />
V. S. N. Murty, M. Ravichandran, F. Syamsudin,<br />
J. Vialard, L. Yu, and W. Yu (2009), RAMA:<br />
The Research Moored Array for African- Asian-<br />
Australian Monsoon Analysis and Prediction,<br />
Bull. Am. Meteorol. Soc., in press.<br />
Meyers, G., and R. Boscolo (2006), The Indian<br />
<strong>Ocean</strong> Observing System (IndOOS), CLIVAR<br />
Exch., 11(4), 2– 3.<br />
Nagura, M., and M. J. McPhaden (2008), The<br />
dynamics of zonal current variations in the central<br />
equatorial Indian <strong>Ocean</strong>, Geophys. Res. Lett.,<br />
35, L23603, doi:10.1029/ 2008GL035961.<br />
Price, J. F. (1981), Upper ocean response to a hurricane,<br />
J. Phys. <strong>Ocean</strong>ogr., 11, 153– 175.<br />
Vialard, J., G. R. Foltz, M. J. McPhaden, J. P. Duvel,<br />
and C. de Boyer Montégut (2008), Strong Indian<br />
<strong>Ocean</strong> sea surface temperature signals associated<br />
with the Madden- Julian Oscillation in late<br />
2007 and early 2008, Geophys. Res. Lett., 35,<br />
L19608, doi:10.1029/ 2008GL035238.<br />
Webster, P. J. (2008), Myanmar’s deadly “daffodil,”<br />
Nat. Geosci., 1, 488– 490.<br />
Author Information<br />
Fig. 3. Argo float temperature (middle) and salinity (bottom) profile data with 3- day average<br />
QuikSCAT winds (top) for mid- March to 1 June 2008. Circles indicate the dates of Argo profiles.<br />
The solid curve plotted over temperature and salinity is a measure of mixed- layer depth based<br />
on a density increase of 0.15 kilograms per cubic meter relative to 5 meters. The dashed curve is<br />
a measure of mixed- layer depth based on a temperature decrease of 0.5°C relative to 5 meters.<br />
The two measures of mixed- layer depth are identical in the absence of salinity stratification; divergence<br />
of the two lines indicates the presence of a salinity- stratified barrier layer separating the<br />
surface mixed layer from the top of the thermocline.<br />
Oscillation [Vialard et al., 2008], year- toyear<br />
changes linked to the Indian <strong>Ocean</strong><br />
dipole [Horii et al., 2008], and Indian<br />
<strong>Ocean</strong> circulation [Nagura and McPhaden,<br />
2008]. Science and technology have a role<br />
to play in mitigating risks related to weather<br />
and climate hazards that plague the Indian<br />
<strong>Ocean</strong> region. Ultimately, one hopes that<br />
the development of IndOOS as part of a<br />
regional early warning system will inform<br />
wise government policies and disaster preparedness<br />
plans to ensure that tragedies<br />
like <strong>Nargis</strong> do not repeat.<br />
Acknowledgments<br />
The authors thank Gustavo Goni for providing<br />
tropical cyclone heat potential data.<br />
Michael J. McPhaden, Pacific Marine Environmental<br />
Laboratory, National <strong>Ocean</strong>ic and Atmospheric<br />
Administration (NOAA), Seattle, Wash.; E-mail:<br />
michael . j . mcphaden@ noaa . gov; Gregory R. Foltz,<br />
Joint Institute for the Study of the <strong>Atmosphere</strong> and<br />
<strong>Ocean</strong>, University of Washington, Seattle; Tony Lee,<br />
Jet Propulsion Laboratory, Pasadena, Calif.; V. S. N.<br />
Murty, Regional Center, National Institute of <strong>Ocean</strong>ography,<br />
Visakhapatnam, India; M. Ravichandran,<br />
Indian National Center for <strong>Ocean</strong> Information Services,<br />
Hyderabad, India; Gabriel A. Vecchi, Geophysical<br />
Fluid Dynamics Laboratory, NOAA, Princeton,<br />
N. J.; Jerome Vialard, Institut de Recherche pour le<br />
Développement/ Laboratoire d’Océanographie et du<br />
Climat: Expérimentation et Approches Numériques,<br />
Paris, France; Jerry D. Wiggert, Department of Marine<br />
Science, University of Southern Mississippi, Stennis<br />
Space Center; and Lisan Yu, Woods Hole <strong>Ocean</strong>ographic<br />
Institution, Woods Hole, Mass.