

1oKlU4X
1oKlU4X
1oKlU4X

You also want an ePaper? Increase the reach of your titles
YUMPU automatically turns print PDFs into web optimized ePapers that Google loves.
To Increase Employment Rates For Young Black Men In London 11<br />
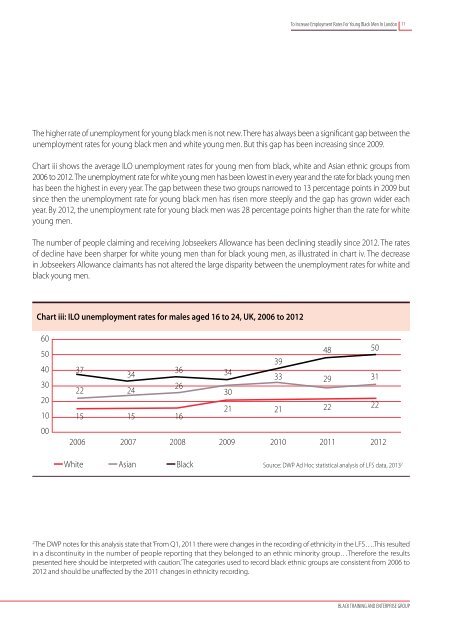
The higher rate of unemployment for young black men is not new. There has always been a significant gap between the<br />
unemployment rates for young black men and white young men. But this gap has been increasing since 2009.<br />
Chart iii shows the average ILO unemployment rates for young men from black, white and Asian ethnic groups from<br />
2006 to 2012. The unemployment rate for white young men has been lowest in every year and the rate for black young men<br />
has been the highest in every year. The gap between these two groups narrowed to 13 percentage points in 2009 but<br />
since then the unemployment rate for young black men has risen more steeply and the gap has grown wider each<br />
year. By 2012, the unemployment rate for young black men was 28 percentage points higher than the rate for white<br />
young men.<br />
The number of people claiming and receiving Jobseekers Allowance has been declining steadily since 2012. The rates<br />
of decline have been sharper for white young men than for black young men, as illustrated in chart iv. The decrease<br />
in Jobseekers Allowance claimants has not altered the large disparity between the unemployment rates for white and<br />
black young men.<br />
Chart iii: ILO unemployment rates for males aged 16 to 24, UK, 2006 to 2012<br />
60<br />
50<br />
40<br />
30<br />
20<br />
10<br />
00<br />
48<br />
50<br />
37<br />
34<br />
36<br />
34<br />
22<br />
24<br />
26<br />
30<br />
39<br />
33<br />
29<br />
31<br />
21<br />
21<br />
22<br />
22<br />
15<br />
15<br />
16<br />
2006 2007 2008 2009 2010 2011 2012<br />
White Asian Black Source: DWP Ad Hoc statistical analysis of LFS data, 2013 2<br />
2<br />
The DWP notes for this analysis state that ‘From Q1, 2011 there were changes in the recording of ethnicity in the LFS….This resulted<br />
in a discontinuity in the number of people reporting that they belonged to an ethnic minority group…Therefore the results<br />
presented here should be interpreted with caution.’ The categories used to record black ethnic groups are consistent from 2006 to<br />
2012 and should be unaffected by the 2011 changes in ethnicity recording.<br />
BLACK TRAINING AND ENTERPRISE GROUP