RL-CS-007b-Guideline Approval procedure LQP1-3
RL-CS-007b-Guideline Approval procedure LQP1-3
RL-CS-007b-Guideline Approval procedure LQP1-3

Create successful ePaper yourself
Turn your PDF publications into a flip-book with our unique Google optimized e-Paper software.
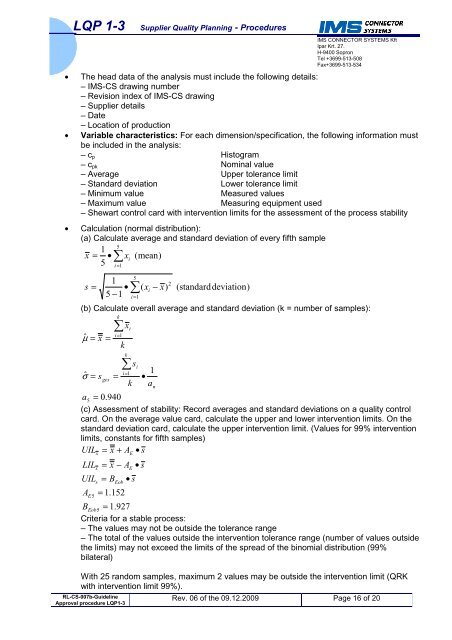
LQP 1-3 Supplier Quality Planning - Procedures<br />
<strong>RL</strong>-<strong>CS</strong>-<strong>007b</strong>-<strong>Guideline</strong><br />
<strong>Approval</strong> <strong>procedure</strong> <strong>LQP1</strong>-3<br />
IMS CONNECTOR SYSTEMS Kft<br />
Ipar Krt. 27.<br />
H-9400 Sopron<br />
Tel +3699-513-508<br />
Fax+3699-513-534<br />
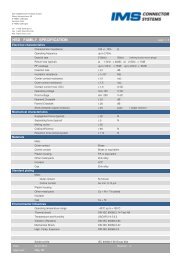
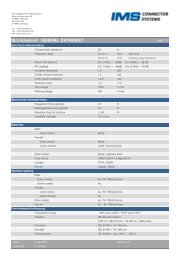
• The head data of the analysis must include the following details:<br />
– IMS-<strong>CS</strong> drawing number<br />
– Revision index of IMS-<strong>CS</strong> drawing<br />
– Supplier details<br />
– Date<br />
– Location of production<br />
• Variable characteristics: For each dimension/specification, the following information must<br />
be included in the analysis:<br />
– c p Histogram<br />
– c pk Nominal value<br />
– Average Upper tolerance limit<br />
– Standard deviation Lower tolerance limit<br />
– Minimum value Measured values<br />
– Maximum value Measuring equipment used<br />
– Shewart control card with intervention limits for the assessment of the process stability<br />
• Calculation (normal distribution):<br />
(a) Calculate average and standard deviation of every fifth sample<br />
5<br />
1<br />
x = • ∑ xi<br />
(mean)<br />
5<br />
s =<br />
i = 1<br />
5<br />
1<br />
• ∑(<br />
xi<br />
5 −1<br />
i = 1<br />
− x)<br />
2<br />
(standarddeviation)<br />
(b) Calculate overall average and standard deviation (k = number of samples):<br />
ˆ µ = x =<br />
ˆ σ = s<br />
ges<br />
∑<br />
i=<br />
1<br />
=<br />
k<br />
k<br />
x<br />
k<br />
i<br />
∑<br />
i=<br />
1<br />
k<br />
s<br />
i<br />
1<br />
•<br />
a<br />
n<br />
a5<br />
= 0.940<br />
(c) Assessment of stability: Record averages and standard deviations on a quality control<br />
card. On the average value card, calculate the upper and lower intervention limits. On the<br />
standard deviation card, calculate the upper intervention limit. (Values for 99% intervention<br />
limits, constants for fifth samples)<br />
UIL = x + A • s<br />
LILx<br />
= x − AE<br />
• s<br />
UILs<br />
= BEob<br />
• s<br />
A = 1.152<br />
E5<br />
x<br />
E<br />
BEob5<br />
= 1.927<br />
Criteria for a stable process:<br />
– The values may not be outside the tolerance range<br />
– The total of the values outside the intervention tolerance range (number of values outside<br />
the limits) may not exceed the limits of the spread of the binomial distribution (99%<br />
bilateral)<br />
With 25 random samples, maximum 2 values may be outside the intervention limit (QRK<br />
with intervention limit 99%).<br />
Rev. 06 of the 09.12.2009 Page 16 of 20