Comprehensive Annual Financial Report - City of Cerritos
Comprehensive Annual Financial Report - City of Cerritos
Comprehensive Annual Financial Report - City of Cerritos

Create successful ePaper yourself
Turn your PDF publications into a flip-book with our unique Google optimized e-Paper software.
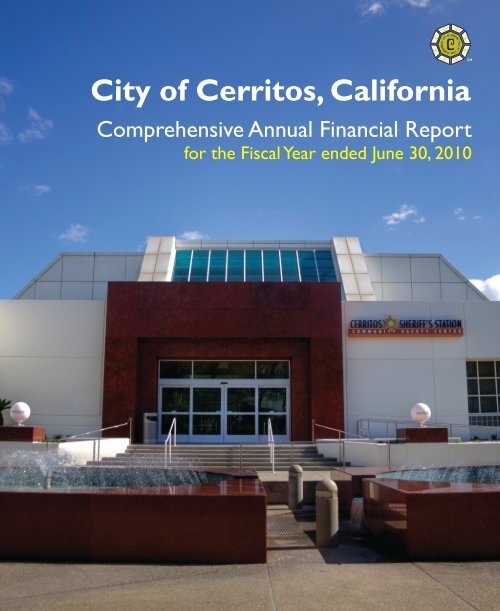
<strong>City</strong> <strong>of</strong> <strong>Cerritos</strong>, California<br />
<strong>Comprehensive</strong> <strong>Annual</strong> <strong>Financial</strong> <strong>Report</strong><br />
for the Fiscal Year ended June 30, 2010
CITY OF CERRITOS, CALIFORNIA<br />
COMPREHENSIVE ANNUAL<br />
FINANCIAL REPORT<br />
WITH REPORT ON AUDIT<br />
BY INDEPENDENT<br />
CERTIFIED PUBLIC ACCOUNTANTS<br />
FISCAL YEAR ENDED JUNE 30, 2010<br />
Prepared by:<br />
Administrative Services Department<br />
Denise D. Manoogian, Director <strong>of</strong> Administrative Services<br />
Nita McKay, Finance Manager
<strong>City</strong> <strong>of</strong> <strong>Cerritos</strong><br />
<strong>Comprehensive</strong> <strong>Annual</strong> <strong>Financial</strong> <strong>Report</strong><br />
For the year ended June 30, 2010<br />
Table <strong>of</strong> Contents<br />
Page<br />
INTRODUCTORY SECTION<br />
<strong>City</strong> Manager and Director <strong>of</strong> Administrative Services Letter <strong>of</strong> Transmittal ................................................. i<br />
Principal Officials ...................................................................................................................................................... v<br />
Organization Chart.................................................................................................................................................... vi<br />
GFOA Certificate <strong>of</strong> Achievement for Excellence in <strong>Financial</strong> <strong>Report</strong>ing ........................................................ vii<br />
FINANCIAL SECTION<br />
Independent Auditors’ <strong>Report</strong> ............................................................................................................................... 1<br />
Management’s Discussion and Analysis (Unaudited) ...................................................................................... 3<br />
Basic <strong>Financial</strong> Statements:<br />
Government-wide <strong>Financial</strong> Statements:<br />
Statement <strong>of</strong> Net Assets ............................................................................................................................... 17<br />
Statement <strong>of</strong> Activities ................................................................................................................................. 18<br />
Fund <strong>Financial</strong> Statements:<br />
Governmental Fund <strong>Financial</strong> Statements:<br />
Balance Sheet .......................................................................................................................................... 22<br />
Reconciliation <strong>of</strong> the Governmental Funds Balance Sheet<br />
to the Government-Wide Statement <strong>of</strong> Net Assets ..................................................................... 23<br />
Statement <strong>of</strong> Revenues, Expenditures and<br />
Changes in Fund Balances ............................................................................................................. 24<br />
Reconciliation <strong>of</strong> the Governmental Funds Statement <strong>of</strong> Revenues,<br />
Expenditures and Changes in Fund Balances to the Government-Wide<br />
Statement <strong>of</strong> Activities and Changes in Net Assets ................................................................... 25<br />
Proprietary Fund <strong>Financial</strong> Statements:<br />
Statement <strong>of</strong> Net Assets ........................................................................................................................ 28<br />
Statement <strong>of</strong> Revenues, Expenses and Changes in Net Assets ....................................................... 29<br />
Statement <strong>of</strong> Cash Flows ....................................................................................................................... 30<br />
Notes to Basic <strong>Financial</strong> Statements ............................................................................................................... 31
<strong>City</strong> <strong>of</strong> <strong>Cerritos</strong><br />
<strong>Comprehensive</strong> <strong>Annual</strong> <strong>Financial</strong> <strong>Report</strong><br />
For the year ended June 30, 2010<br />
Table <strong>of</strong> Contents, Continued<br />
Page<br />
FINANCIAL SECTION, Continued<br />
Required Supplementary Information (Unaudited) ........................................................................................ 75<br />
Notes to Required Supplementary Information ............................................................................................. 76<br />
Budgetary Comparison Schedule:<br />
General Fund ................................................................................................................................................. 77<br />
Schedule <strong>of</strong> Funding Progress:<br />
Defined Pension Plan ................................................................................................................................... 78<br />
Other Post Employment Benefits ............................................................................................................... 78<br />
Supplementary Information:<br />
Non-Major Governmental Funds:<br />
Combining Balance Sheet ............................................................................................................................ 82<br />
Combining Statement <strong>of</strong> Revenues, Expenditures and Changes in Fund Balances ........................... 86<br />
Schedule <strong>of</strong> Revenues, Expenditures and Changes in Fund Balances – Budget and Actual:<br />
Street Improvements Special Revenue Fund ..................................................................................... 90<br />
Traffic Congestion Special Revenue Fund ......................................................................................... 91<br />
Drainage Special Revenue Fund .......................................................................................................... 92<br />
Sewer Special Revenue Fund ............................................................................................................... 93<br />
SB 821 Special Revenue Fund ............................................................................................................... 94<br />
Proposition “A” Special Revenue Fund ............................................................................................. 95<br />
Proposition “C” Special Revenue Fund .............................................................................................. 96<br />
Assessment District #6 Special Revenue Fund .................................................................................. 97<br />
Los Coyotes Lighting District Special Revenue Fund ...................................................................... 98<br />
Local Law Enforcement Grants Special Revenue Fund ................................................................... 99<br />
COPS Grants Special Revenue Fund .................................................................................................. 100<br />
Library Grants Special Revenue Fund ................................................................................................ 101<br />
Environmental Grant Special Revenue Fund .................................................................................... 102<br />
AQMD Special Revenue Fund ............................................................................................................. 103<br />
Measure “R” Special Revenue Fund ................................................................................................... 104<br />
Internal Service Funds:<br />
Combining Statement <strong>of</strong> Net Assets .......................................................................................................... 106<br />
Combining Statement <strong>of</strong> Revenues, Expenses and Changes in Net Assets ......................................... 107<br />
Combining Statement <strong>of</strong> Cash Flows ........................................................................................................ 108
<strong>City</strong> <strong>of</strong> <strong>Cerritos</strong><br />
<strong>Comprehensive</strong> <strong>Annual</strong> <strong>Financial</strong> <strong>Report</strong><br />
For the year ended June 30, 2010<br />
Table <strong>of</strong> Contents, Continued<br />
Page<br />
STATISTICAL SECTION (Unaudited)<br />
Description <strong>of</strong> Statistical Section Contents ............................................................................................................ 109<br />
<strong>Financial</strong> Trends:<br />
Net Assets by Component – Last Eight Fiscal Years ..................................................................................... 110<br />
Changes in Net Assets – Expenses and Program Revenues - Last Eight Fiscal Years .............................. 112<br />
Changes in Net Assets – General Revenues - Last Eight Fiscal Years ......................................................... 114<br />
Fund Balances <strong>of</strong> Governmental Funds - Last Eight Fiscal Years ................................................................ 116<br />
Changes in Fund Balances <strong>of</strong> Governmental Funds - Last Eight Fiscal Years ........................................... 118<br />
Governmental Activities Revenues by Sources - Last Ten Fiscal Years ...................................................... 120<br />
Revenue Capacity:<br />
Assessed Value <strong>of</strong> Taxable Property - Last Ten Fiscal Years ........................................................................ 122<br />
Property Tax Rates – All Direct and Overlapping Governments – Last Ten Fiscal Years ....................... 124<br />
Ten Largest Secured Taxpayers – Current Year and Nine Years Ago ........................................................ 125<br />
Property Tax Levies and Collections - Last Ten Fiscal Years ....................................................................... 126<br />
Debt Capacity:<br />
Ratios <strong>of</strong> Outstanding Debt by Type - Last Eight Fiscal Years ..................................................................... 128<br />
Schedule <strong>of</strong> Direct and Overlapping Bonded Debt ........................................................................................ 130<br />
Legal Debt Margin Information- Last Eight Fiscal Years .............................................................................. 132<br />
Demographic and Economic Information:<br />
Demographic and Economic Statistics - Last Eight Fiscal Years .................................................................. 134<br />
Principal Employers – Current Year and Eight Years Ago ........................................................................... 135<br />
Operating Information:<br />
Full-Time and Part-Time <strong>City</strong> Employees by Function - Last Eight Fiscal Years ...................................... 136<br />
Operating Indicators by Function - Last Eight Fiscal Years .......................................................................... 137<br />
Capital Asset Statistics by Function - Last Eight Fiscal Years ...................................................................... 138
dI<br />
nvDcOIN)mIDMMM<br />
800Z LclI-916 (19c) :xvi. ico-o (g)<br />
oclc-coLo6 viioiiiv ‘soiini• ocic xog oi<br />
fl}JAV auwooi ciii )i2JhJ2D DIAID<br />
December 2, 2010<br />
Honorable Mayor, Members <strong>of</strong> the <strong>City</strong> Council, and Citizens <strong>of</strong> the <strong>City</strong> <strong>of</strong> <strong>Cerritos</strong><br />
It is our pleasure to present the <strong>Comprehensive</strong> <strong>Annual</strong> <strong>Financial</strong> <strong>Report</strong> (CAFR) <strong>of</strong> the <strong>City</strong><br />
<strong>of</strong> <strong>Cerritos</strong> (the <strong>City</strong>) for the fiscal year ended June 30, 2010.<br />
This report consists <strong>of</strong> management’s representations concerning the finances <strong>of</strong> the <strong>City</strong> <strong>of</strong><br />
<strong>Cerritos</strong>. Management assumes the responsibility for the accuracy <strong>of</strong> the presented data,<br />
the completeness and fairness <strong>of</strong> the presentation and all disclosures. To provide a<br />
reasonable basis for making these representations, management has established a<br />
comprehensive internal control framework that is designed both to protect the <strong>City</strong>’s assets<br />
from loss, theft, or misuse and to compile sufficient reliable information for the preparation<br />
<strong>of</strong> the <strong>City</strong>’s financial statements in conformity with generally accepted accounting principles<br />
(GAAP). Because the costs <strong>of</strong> internal controls should not outweigh their benefits, internal<br />
controls have been designed to provide reasonable rather than absolute assurance that the<br />
financial statements will be free from material misstatements.<br />
The <strong>City</strong>’s financial statements have been audited by Caporicci & Larson, Inc., a subsidiary<br />
<strong>of</strong> Marcum, LLP, a firm <strong>of</strong> certified public accountants. The auditors have issued an<br />
unqualified opinion on these financial statements. Such an opinion states that the auditors<br />
feel the <strong>City</strong> followed all accounting rules appropriately and that the financial reports are an<br />
accurate representation <strong>of</strong> the <strong>City</strong>’s financial condition. Their report is located at the front<br />
<strong>of</strong> the financial section <strong>of</strong> this report.<br />
Management’s discussion and analysis (MD&A) immediately follows the independent<br />
auditor’s report and provides a narrative introduction, overview, and analysis <strong>of</strong> the basic<br />
financial statements. This letter <strong>of</strong> transmittal is designed to complement the MD&A and<br />
should be read in conjunction with it.<br />
Pr<strong>of</strong>ile <strong>of</strong> the <strong>City</strong> <strong>of</strong> <strong>Cerritos</strong><br />
The <strong>City</strong> <strong>of</strong> <strong>Cerritos</strong> is located approximately 20 miles southeast <strong>of</strong> Los Angeles along the<br />
border <strong>of</strong> Orange County. Beginning as an unincorporated area known for its strawberry<br />
farms and dairy operations, the <strong>City</strong> experienced a major transformation into a more urban<br />
environment beginning in the late 1960s. In 1973, a unique and innovative General Plan<br />
was adopted, which has guided development in a master planned fashion to create a parklike<br />
community with balanced development. Today the <strong>City</strong> is a progressive, affluent<br />
community with a highly educated and ethnically diverse population.<br />
The <strong>City</strong> is home to over 50,000 residents and several large business organizations.<br />
<strong>Cerritos</strong> enjoys the distinction <strong>of</strong> being a large sales tax generator, resulting in significant<br />
revenues to support <strong>City</strong> operations.<br />
i
<strong>City</strong> <strong>of</strong> <strong>Cerritos</strong><br />
ORGANIZATIONAL CHART<br />
RESIDENTS OF CERRITOS<br />
CITY COUNCIL<br />
REDEVELOPMENT AGENCY<br />
ECONOMIC DEVELOPMENT<br />
COMMISSION<br />
FINE ARTS & HISTORICAL<br />
COMMISSION<br />
PARKS & RECREATION<br />
COMMISSION<br />
PLANNING<br />
COMMISSION<br />
PROPERTY PRESERVATION<br />
COMMISSION<br />
CITY ATTORNEY CITY MANAGER/EXECUTIVE DIRECTOR CITY CLERK/TREASURER<br />
COMMUNITY<br />
DEVELOPMENT<br />
PUBLIC WORKS<br />
WATER AND<br />
POWER<br />
COMMUNITY AND<br />
SAFETY SERVICES<br />
ADMINISTRATIVE<br />
SERVICES<br />
THEATER<br />
Geographic Information<br />
Systems<br />
Engineering<br />
Water<br />
Operations<br />
Community Participation/<br />
Senior Center<br />
Communications<br />
Business Management<br />
Advance Planning<br />
Environmental<br />
Services<br />
Reclaimed Water<br />
Operations<br />
Recreation Services<br />
Finance/Water Billing<br />
Performance Marketing<br />
and Sales<br />
Redevelopment Team<br />
General<br />
Maintenance<br />
Electric Utility<br />
Operations<br />
Community Safety<br />
Human Resources/<br />
Risk Management<br />
Performance Management<br />
Front <strong>of</strong> House<br />
Current Planning Parks/Trees Maintenance<br />
Code Enforcement<br />
Support Services<br />
Operations and Security<br />
Municipal Library<br />
Special Event Services<br />
Management Information Systems<br />
Ticket Office<br />
vi
vii
This page intentionally left blank.<br />
viii
-<br />
I UJODidD1-3MMM<br />
SSUVJUflOO3V 3flqncJ pd7ftJ.1d3<br />
JJ7 Wfl3JVWJO Csvzpsqn V<br />
DUI ‘UOSJWJ 29 !DDPOdtD<br />
rio<br />
INDEPENDENT AUDITORS’ REPORT<br />
Honorable Mayor and<br />
Members <strong>of</strong> the <strong>City</strong> Council<br />
<strong>City</strong> <strong>of</strong> <strong>Cerritos</strong><br />
<strong>Cerritos</strong>, California<br />
We have audited the accompanying financial statements <strong>of</strong> the governmental activities, the businesstype<br />
activities, each major fund, and the aggregate remaining fund information <strong>of</strong> the <strong>City</strong> <strong>of</strong> <strong>Cerritos</strong>,<br />
California (<strong>City</strong>), as <strong>of</strong> and for the year ended June 30, 2010, which collectively comprise the <strong>City</strong>’s<br />
basic financial statements as listed in the foregoing table <strong>of</strong> contents. These basic financial statements<br />
are the responsibility <strong>of</strong> the <strong>City</strong>’s management. Our responsibility is to express an opinion on these<br />
basic financial statements based on our audit.<br />
We conducted our audit in accordance with auditing standards generally accepted in the United States<br />
<strong>of</strong> America and the standards applicable to financial audits contained in Government Auditing Standards,<br />
issued by the Comptroller General <strong>of</strong> the United States. Those standards require that we plan and<br />
perform the audit to obtain reasonable assurance about whether the basic financial statements are free<br />
<strong>of</strong> material misstatement. An audit includes consideration <strong>of</strong> internal control over financial reporting<br />
as a basis for designing audit procedures that are appropriate in the circumstances but not for the<br />
purpose <strong>of</strong> expressing an opinion on the effectiveness <strong>of</strong> the <strong>City</strong>’s internal control over financial<br />
reporting. Accordingly, we express no such opinion. An audit includes examining, on a test basis,<br />
evidence supporting the amounts and disclosures in the financial statements. An audit also includes<br />
assessing the accounting principles used and significant estimates made by management, as well as<br />
evaluating the overall basic financial statement presentation. We believe that our audit provides a<br />
reasonable basis for our opinions.<br />
In our opinion, the basic financial statements referred to above present fairly, in all material respects,<br />
the respective financial position <strong>of</strong> the governmental activities, the business-type activities, each major<br />
fund, and the aggregate remaining fund information <strong>of</strong> the <strong>City</strong> as <strong>of</strong> June 30, 2010, and the respective<br />
changes in financial position and cash flows, where applicable, there<strong>of</strong> for the year then ended in<br />
conformity with accounting principles generally accepted in the United States <strong>of</strong> America.<br />
In accordance with Government Auditing Standards, we have also issued our report dated<br />
December 2, 2010 on our consideration <strong>of</strong> the <strong>City</strong>’s internal control over financial reporting and on our<br />
tests <strong>of</strong> its compliance with certain provisions <strong>of</strong> laws, regulations, contracts, and grants. The purpose<br />
<strong>of</strong> that report is to describe the scope <strong>of</strong> our testing <strong>of</strong> internal control over financial reporting and<br />
compliance and the results <strong>of</strong> that testing, and not to provide an opinion on the internal control over<br />
financial reporting or on compliance. That report is an integral part <strong>of</strong> an audit performed in<br />
accordance with Government Auditing Standards and should be read in conjunction with this report in<br />
considering the results <strong>of</strong> our audit.
Honorable Mayor and<br />
Members <strong>of</strong> the <strong>City</strong> Council<br />
<strong>City</strong> <strong>of</strong> <strong>Cerritos</strong><br />
<strong>Cerritos</strong>, California<br />
Page 2<br />
The accompanying Required Supplementary Information, such as Management’s Discussion and<br />
Analysis, budgetary comparison information and other information, is not a required part <strong>of</strong> the basic<br />
financial statements, but is supplementary information required by the Governmental Accounting<br />
Standards Board. We have applied certain limited procedures, which consisted principally <strong>of</strong> inquiries<br />
<strong>of</strong> management regarding the methods <strong>of</strong> measurement and presentation <strong>of</strong> the Required<br />
Supplementary Information. However, we did not audit the information and express no opinion on<br />
the Required Supplementary Information.<br />
Our audit was conducted for the purpose <strong>of</strong> forming opinions on the financial statements that<br />
collectively comprise the <strong>City</strong>’s basic financial statements. The accompanying Supplementary<br />
Information is presented for purpose <strong>of</strong> additional analysis and is not a required part <strong>of</strong> the basic<br />
financial statements. The Supplementary Information has been subjected to the auditing procedures<br />
applied in the audit <strong>of</strong> the basic financial statements and, in our opinion, is fairly stated in all material<br />
respects in relation to the basic financial statements taken as a whole. The Introductory and Statistical<br />
Sections have not been subjected to the auditing procedures applied in the audit <strong>of</strong> the basic financial<br />
statements and, accordingly, we express no opinion on them.<br />
Caporicci & Larson, Inc.<br />
A Subsidiary <strong>of</strong> Marcum LLP<br />
Certified Public Accountants<br />
Irvine, California<br />
December 2, 2010<br />
2
CITY OF CERRITOS, CALIFORNIA<br />
Management’s Discussion and Analysis<br />
Year Ended June 30, 2010<br />
As Management <strong>of</strong> the <strong>City</strong> <strong>of</strong> <strong>Cerritos</strong>, California (<strong>City</strong>), we <strong>of</strong>fer readers <strong>of</strong> the <strong>City</strong>’s financial<br />
statements this narrative overview and analysis <strong>of</strong> the financial activities <strong>of</strong> the <strong>City</strong> for the fiscal year<br />
ended June 30, 2010. We encourage readers to consider the information presented here in conjunction<br />
with the accompanying letter <strong>of</strong> transmittal at the front <strong>of</strong> this report, and the basic financial<br />
statements, which follow this section.<br />
FINANCIAL HIGHLIGHTS<br />
<br />
<br />
<br />
<br />
The <strong>City</strong>’s assets exceeded its liabilities at June 30, 2010 by $327.5 million. This amount is<br />
referred to as the net assets <strong>of</strong> the <strong>City</strong>. Of this amount, $169.7 million is invested in capital<br />
assets net <strong>of</strong> related debt, $31.6 million is restricted and $126.2 million is unrestricted. The<br />
unrestricted amount may be used to meet the <strong>City</strong>’s ongoing obligations to citizens and<br />
creditors.<br />
The <strong>City</strong>’s net assets decreased $16.1 million, expenses exceeding revenues by this amount.<br />
This decrease is attributable to the mandatory payment <strong>of</strong> $11.8 million to the State <strong>of</strong><br />
California for the <strong>City</strong>’s share <strong>of</strong> the Supplemental Educational Revenue Augmentation Fund<br />
(SERAF), Other Post Employment Benefits (OPEB) contribution <strong>of</strong> $2.0 million and general<br />
liability claims <strong>of</strong> $1.9 million.<br />
Governmental funds for the <strong>City</strong> reported combined fund balances <strong>of</strong> $148.6 million. Of this<br />
amount, $104.6 million is reserved while $44.0 million is unreserved, or available for spending<br />
at the <strong>City</strong>’s discretion.<br />
As <strong>of</strong> June 30, 2010, the unreserved fund balance <strong>of</strong> the General Fund, the <strong>City</strong>’s chief<br />
operating fund, was $80.5 million, or 141.5% <strong>of</strong> General Fund expenditures. This unreserved<br />
fund balance is available for future appropriation.<br />
OVERVIEW OF THE FINANCIAL STATEMENTS<br />
This discussion and analysis is intended to serve as an introduction to the <strong>City</strong>’s basic financial<br />
statements, which consist <strong>of</strong> three components: 1) government-wide financial statements, 2) fund<br />
financial statements and 3) notes to the basic financial statements. This report also contains<br />
supplementary information in addition to the basic financial statements.<br />
Government-wide <strong>Financial</strong> Statements<br />
The government-wide financial statements are designed to provide readers with a broad overview <strong>of</strong><br />
the <strong>City</strong>’s finances, in a manner similar to a private-sector business.<br />
The Statement <strong>of</strong> Net Assets presents information on all <strong>of</strong> the <strong>City</strong>’s assets and liabilities, with the<br />
difference between the two reported as net assets. Over time, increases or decreases in net assets may<br />
serve as a useful indicator <strong>of</strong> whether the financial position <strong>of</strong> the <strong>City</strong> is improving or deteriorating.<br />
3
OVERVIEW OF THE FINANCIAL STATEMENTS (CONTINUED)<br />
Government-wide <strong>Financial</strong> Statements (Continued)<br />
The Statement <strong>of</strong> Activities presents information on how the <strong>City</strong>’s net assets changed during the fiscal<br />
year. All changes in net assets are reported as soon as the underlying event giving rise to the change<br />
occurs, regardless <strong>of</strong> the timing <strong>of</strong> the related cash flows. Therefore, revenues and expenses are<br />
reported in this statement for some items that will only result in cash flows in future fiscal periods (for<br />
example, uncollected taxes and earned but unused employee leaves).<br />
Both <strong>of</strong> the government-wide financial statements distinguish functions <strong>of</strong> the <strong>City</strong> that are principally<br />
supported by taxes and intergovernmental revenues (governmental activities) from other functions that<br />
are intended to recover all or a significant portion <strong>of</strong> their costs through user fees and charges<br />
(business-type activities). The governmental activities <strong>of</strong> the <strong>City</strong> <strong>of</strong> <strong>Cerritos</strong> include legislative and<br />
administration, community development, public works, water and power, community and safety<br />
services, administrative services and the theater (<strong>Cerritos</strong> Center for the Performing Arts). The<br />
business-type activities <strong>of</strong> the <strong>City</strong> include water operations, reclaimed water, and electric utility.<br />
The government-wide financial statements include not only the <strong>City</strong> <strong>of</strong> <strong>Cerritos</strong> itself (known as the<br />
primary government), but also the activities <strong>of</strong> the <strong>Cerritos</strong> Redevelopment Agency (Agency) and the<br />
<strong>Cerritos</strong> Public Financing Authority (Authority), a joint powers authority formed by the <strong>City</strong> and the<br />
Agency to issue bonds for the construction <strong>of</strong> major capital facilities. The <strong>City</strong> is financially<br />
accountable for both <strong>of</strong> these legally separate entities, which are referred to as blended component<br />
units. The Agency and Authority function for all practical purposes as departments <strong>of</strong> the <strong>City</strong>, and<br />
therefore, these blended component units have been included in these financial statements as an<br />
integral part <strong>of</strong> the primary government.<br />
Fund <strong>Financial</strong> Statements<br />
A fund is a grouping <strong>of</strong> related accounts that is used to maintain control over resources that have been<br />
segregated for specific activities or objectives. The <strong>City</strong> <strong>of</strong> <strong>Cerritos</strong>, like other state and local<br />
governments, uses fund accounting to ensure and demonstrate compliance with finance-related legal<br />
requirements. All <strong>of</strong> the funds <strong>of</strong> the <strong>City</strong> can be divided into two categories: governmental funds and<br />
proprietary funds.<br />
<br />
Governmental Funds<br />
Governmental funds are used to account for essentially the same functions reported as<br />
governmental activities in the government-wide financial statements. However, unlike the<br />
government-wide financial statements, governmental fund financial statements focus on<br />
near-term inflows and outflows <strong>of</strong> spendable resources, as well as on balances <strong>of</strong> spendable<br />
resources available at the end <strong>of</strong> the fiscal year. Such information may be useful in evaluating<br />
the <strong>City</strong>’s near-term financing requirements.<br />
Because the focus <strong>of</strong> governmental funds is narrower than that <strong>of</strong> the government-wide<br />
financial statements, it is useful to compare the information presented for governmental funds<br />
with similar information presented for governmental activities in the government-wide<br />
financial statements. By doing so, readers may better understand the long-term impact <strong>of</strong> the<br />
<strong>City</strong>’s near-term financing decisions. Both the governmental fund balance sheet and the<br />
governmental fund statement <strong>of</strong> revenues, expenditures and changes in fund balances provide a<br />
reconciliation to facilitate this comparison between governmental funds and governmental<br />
activities.<br />
4
OVERVIEW OF THE FINANCIAL STATEMENTS (CONTINUED)<br />
Fund <strong>Financial</strong> Statements (Continued)<br />
<br />
Governmental Funds (Continued)<br />
The <strong>City</strong> <strong>of</strong> <strong>Cerritos</strong> maintains nineteen individual governmental funds. Information is<br />
presented separately in the governmental fund balance sheet and in the governmental fund<br />
statement <strong>of</strong> revenues, expenditures and changes in fund balances for the General Fund,<br />
Redevelopment Agency Debt Service Fund and Redevelopment Agency Capital Projects Fund,<br />
each <strong>of</strong> which are considered to be major funds. Data from the other sixteen governmental<br />
funds are combined into a single, aggregated presentation. Individual fund data for each <strong>of</strong><br />
these nonmajor governmental funds is provided in the form <strong>of</strong> combining statements elsewhere<br />
in this report.<br />
The <strong>City</strong> <strong>of</strong> <strong>Cerritos</strong> adopts an annual appropriated budget for the General Fund and all Special<br />
Revenue Funds. A budgetary comparison statement has been provided for each <strong>of</strong> these funds<br />
to demonstrate compliance with these budgets.<br />
<br />
Proprietary Funds<br />
The <strong>City</strong> <strong>of</strong> <strong>Cerritos</strong> maintains two different types <strong>of</strong> proprietary funds. Enterprise funds are<br />
used to report the same functions presented as business-type activities in the government-wide<br />
financial statements. The <strong>City</strong> uses enterprise funds to account for its water, reclaimed water<br />
and electric utility activities. Internal service funds are accounting devices used to accumulate<br />
and allocate costs internally among the <strong>City</strong>’s various functions. The <strong>City</strong> uses an internal<br />
service fund to account for its equipment maintenance and replacement activities. Because the<br />
internal service fund provides services that predominantly benefit governmental rather than<br />
business-type functions, it has been included within governmental activities in the governmentwide<br />
financial statements.<br />
Proprietary funds provide the same type <strong>of</strong> information as the government-wide financial<br />
statements, only in more detail. The proprietary fund financial statements provide separate<br />
information for the Water Fund, Reclaimed Water Fund and Electric Utility Fund, which are<br />
considered major funds <strong>of</strong> the <strong>City</strong>. Conversely, the internal service fund is shown as a<br />
separate reporting category on the Proprietary Funds reports and in the Supplementary<br />
Information section <strong>of</strong> this report.<br />
Notes to the Basic <strong>Financial</strong> Statements<br />
The notes to the basic financial statements provide additional information that is essential to a full<br />
understanding <strong>of</strong> the data provided in the government-wide and fund financial statements.<br />
Other Information<br />
The combining statements, referred to earlier in connection with other governmental funds and the<br />
internal service fund, are presented in Supplementary Information.<br />
5
GOVERNMENT-WIDE FINANCIAL ANALYSIS<br />
The following table summarizes the Statement <strong>of</strong> Net Assets for fiscal years ending June 30, 2010 and<br />
June 30, 2009.<br />
<strong>City</strong> <strong>of</strong> <strong>Cerritos</strong> Net Assets<br />
(in millions)<br />
Governmental Activities Business-Type Activities Total<br />
2010 2009 2010 2009 2010 2009<br />
Cash and investments $ 157.2 $ 182.6 $ 4.1 $ 5.4 $ 161.3 $ 188.0<br />
Other Assets 20.8 20.1 (4.1) (2.9) 16.7 17.2<br />
Capital Assets 298.1 291.4 40.4 41.9 338.5 333.3<br />
Total Assets 476.1 494.1 40.4 44.4 516.5 538.5<br />
Other Liabilities 11.5 15.0 1.1 0.3 12.6 15.3<br />
Long term liabilities outstanding 176.2 179.6 0.2 - 176.4 179.6<br />
Total Liabilities 187.7 194.6 1.3 0.3 189.0 194.9<br />
Net Assets<br />
Invested in capital assets,<br />
net <strong>of</strong> related debt 129.3 108.3 40.4 41.9 169.7 150.2<br />
Restricted 31.6 32.9 - - 31.6 32.9<br />
Unrestricted 127.5 158.3 (1.3) 2.2 126.2 160.5<br />
Total net assets $ 288.4 $ 299.5 $ 39.1 $ 44.1 $ 327.5 $ 343.6<br />
As noted earlier, net assets may serve over time as a useful indicator <strong>of</strong> a government’s financial<br />
position. In the case <strong>of</strong> the <strong>City</strong> <strong>of</strong> <strong>Cerritos</strong>, net assets were $327.5 million as <strong>of</strong> June 30, 2010. Net<br />
assets decreased $16.1 million, or 4.7%, during fiscal year 2009-10. Assets decreased 4.1% and<br />
liabilities decreased 3.0% when compared to June 30, 2009.<br />
The largest portion <strong>of</strong> the <strong>City</strong>’s net assets at June 30, 2010 ($169.7 million, or 51.8% <strong>of</strong> total net<br />
assets) reflects its investment in capital assets (e.g., land, infrastructure, buildings, machinery and<br />
equipment) less any related debt used to acquire those assets that is still outstanding. The <strong>City</strong> uses<br />
these capital assets to provide services to citizens; consequently, these assets are not available for<br />
future spending. Although the <strong>City</strong>’s investment in its capital assets is reported net <strong>of</strong> related debt, it<br />
should be noted that the resources needed to repay this debt must be provided from other sources, since<br />
the capital assets themselves cannot be used to liquidate these liabilities.<br />
The increase in governmental activities investment in capital assets is attributable to the <strong>City</strong> acquiring<br />
land and the completion <strong>of</strong> an expansion to the Sheriff’s station. The decrease in business-type<br />
activities was due to normal depreciation <strong>of</strong> existing capital assets with no significant purchases. The<br />
restricted portion <strong>of</strong> the <strong>City</strong>’s net assets 9.6%) represents resources that are subject to external<br />
restrictions on how they may be used. These restricted net assets decreased $1.3 million due to<br />
amounts that were spent related to capital projects. The remaining balance <strong>of</strong> unrestricted net assets <strong>of</strong><br />
$126.2 million may be used to meet the government’s ongoing obligations to citizens and creditors.<br />
Cash and investments decreased 14.2%, or $26.7 million when compared to the previous fiscal year.<br />
This decrease is directly linked to the State <strong>of</strong> California mandated payment <strong>of</strong> $11.8 million for the<br />
<strong>City</strong>’s share <strong>of</strong> the Supplemental Educational Revenue Augmentation Fund (SERAF), the <strong>City</strong>’s share<br />
<strong>of</strong> improvements to the <strong>Cerritos</strong> Mall in the amount <strong>of</strong> $4.0 million and the purchase <strong>of</strong> land in the<br />
amount <strong>of</strong> $7.0 million, which resulted in the increase to the <strong>City</strong>’s investment in capital assets, as<br />
previously described.<br />
6
GOVERNMENT-WIDE FINANCIAL ANALYSIS (CONTINUED)<br />
As noted in the following table, the <strong>City</strong>’s net assets declined by $16.1 million during the current fiscal<br />
year. The fiscal year 2009-10 decline in net assets compares to the fiscal year 2008-09 decrease <strong>of</strong><br />
$16.0 million.<br />
<strong>City</strong> <strong>of</strong> <strong>Cerritos</strong> Change in Net Assets<br />
(in millions)<br />
Governmental Activities Business-type activities Total<br />
2010 2009 2010 2009 2010 2009<br />
Revenues<br />
Program revenues:<br />
Charges for services $ 12.1 $ 12.5 $ 12.4 $ 15.3 $ 24.5 $ 27.8<br />
Operating grants and contributions 11.3 10.0 - - 11.3 10.0<br />
Capital grants and contributions 0.6 0.2 0.1 0.1 0.7 0.3<br />
General revenues:<br />
Taxes 58.5 63.6 - - 58.5 63.6<br />
Investment income 20.6 18.3 0.1 0.1 20.7 18.4<br />
Miscellaneous 1.1 0.2 - - 1.1 0.2<br />
Total revenues 104.2 104.8 12.6 15.5 116.8 120.3<br />
Expenses:<br />
Legislative and administration 24.0 12.2 - - 24.0 12.2<br />
Community development 9.6 7.5 - - 9.6 7.5<br />
Public works 17.6 24.0 - - 17.6 24.0<br />
Water and power 0.5 1.5 - - 0.5 1.5<br />
Community and safety services 23.2 24.7 - - 23.2 24.7<br />
Administrative services 12.4 16.5 - - 12.4 16.5<br />
<strong>Cerritos</strong> Center for the Performing Arts 10.8 12.6 - - 10.8 12.6<br />
Unallocated infrastructure depreciation 1.1 1.0 - - 1.1 1.0<br />
Interest expense 16.1 16.8 - - 16.1 16.8<br />
Water - - 9.7 9.0 9.7 9.0<br />
Reclaimed water - - 1.4 1.3 1.4 1.3<br />
Electric Utility - - 6.5 9.2 6.5 9.2<br />
Total expenses 115.3 116.8 17.6 19.5 132.9 136.3<br />
Change in net assets<br />
before transfers (11.1) (12.0) (5.0) (4.0) (16.1) (16.0)<br />
Transfers - 4.2 - (4.2) - -<br />
Change in net assets (11.1) (7.8) (5.0) (8.2) (16.1) (16.0)<br />
Net assets, beginning <strong>of</strong> year 299.5 307.3 44.1 52.3 343.6 359.6<br />
Net assets, end <strong>of</strong> year $ 288.4 $ 299.5 $ 39.1 $ 44.1 $ 327.5 $ 343.6<br />
The <strong>City</strong>’s total revenues were $116.8 million in FY 2009-10, while the total cost <strong>of</strong> all programs and<br />
services was $132.9 million. Revenues decreased by $3.5 million, or 2.9%, from the prior year levels<br />
and expenses decreased $3.4 million, or 2.5% when compared to FY 2008-09.<br />
Approximately 50.1% <strong>of</strong> all revenues this past year came from some form <strong>of</strong> tax (down from 52.9% in<br />
FY 2008-09).<br />
7
GOVERNMENT-WIDE FINANCIAL ANALYSIS (CONTINUED)<br />
Governmental Activities<br />
Revenues associated with governmental activities<br />
decreased $0.6 million compared to FY 2008-09 primarily<br />
due to the economic recession. Although tax revenues<br />
declined, specifically in the areas <strong>of</strong> sales taxes and tax<br />
increment revenues ($5.0 million), other revenue sources<br />
increased when compared to one year ago. The increases<br />
in operating and capital grant revenues included police<br />
grants, library grants, and $0.5 million in American<br />
Recovery and Reinvestment Act (ARRA) grant funds for a<br />
major street improvement project.<br />
Expenses associated with governmental activities<br />
decreased $1.5 million compared to one year earlier. With<br />
the economic downturn and declines in the <strong>City</strong>’s core<br />
revenue sources, all <strong>City</strong> departments were charged with<br />
reducing operating expenses to maintain a balanced<br />
budget. The only areas which show increases are<br />
legislative and administration, detailing the mandatory<br />
SERAF payment to the State <strong>of</strong> California, and<br />
community development.<br />
Motor vehicle<br />
taxes<br />
4%<br />
Franchise<br />
taxes<br />
1%<br />
Sales taxes<br />
17%<br />
Property<br />
taxes<br />
33%<br />
Unallocated<br />
infrastructure<br />
depreciation<br />
1%<br />
<strong>Cerritos</strong><br />
Center for the<br />
Performing<br />
Arts<br />
10%<br />
Administrative<br />
Services<br />
11%<br />
Revenue Sources<br />
Fiscal Year Ended June 30, 2010<br />
Capital grants<br />
and<br />
contributions<br />
1%<br />
Charges for<br />
services<br />
12%<br />
Transient<br />
occupancy<br />
taxes<br />
FINANCIAL ANALYSIS OF THE CITY’S FUNDS<br />
As noted earlier, the <strong>City</strong> <strong>of</strong> <strong>Cerritos</strong> uses fund accounting to ensure and demonstrate compliance with<br />
finance-related legal requirements.<br />
Governmental Funds<br />
The focus <strong>of</strong> the <strong>City</strong>’s governmental funds is to provide information on near-term inflows, outflows,<br />
and balances <strong>of</strong> spendable resources. Such information is useful in assessing the <strong>City</strong>’s financing<br />
requirements. In particular, unreserved fund balance may serve as a useful measure <strong>of</strong> a government’s<br />
net resources available for spending at the end <strong>of</strong> the fiscal year.<br />
At the end <strong>of</strong> the current fiscal year, the <strong>City</strong>’s governmental funds reported combined ending fund<br />
balances <strong>of</strong> $148.6 million, a decrease <strong>of</strong> $22.6 million from the prior year. Approximately $44.0<br />
million constitutes unreserved fund balance, which is available for spending at the <strong>City</strong>’s discretion.<br />
The remainder <strong>of</strong> fund balance is reserved to indicate that it is not available for new spending because<br />
it has already been committed 1) for long-term receivables ($101.8 million) from the <strong>Cerritos</strong><br />
Redevelopment Agency and the Electric Utility Fund, 2) for inventories and deposits ($0.8 million),<br />
and 3) for land held for resale ($2.0 million).<br />
The General Fund is the main operating fund <strong>of</strong> the <strong>City</strong>. At the end <strong>of</strong> the current fiscal year,<br />
unreserved fund balance <strong>of</strong> the General Fund was $80.5 million, which represents 141.5% <strong>of</strong> General<br />
Fund expenditures, excluding transfers. Reserved amounts include $101.8 million for long-term<br />
receivables and $0.8 million for inventories and deposits. Unreserved fund balance includes<br />
designations for Arts Center programs ($10.0 million), asset replacement ($0.7 million), and self<br />
insurance ($1.0 million).<br />
The <strong>City</strong>’s General Fund balance increased $1.7 million during the fiscal year compared to a budgeted<br />
increase <strong>of</strong> $0.3 million. Although revenues (including transfers in) completed the fiscal year $1.9<br />
million less than the adjusted budget, departmental expenditures (including transfers out) were under<br />
budget by $3.3 million, resulting in the $1.4 million variance from budgeted to actual fund balance.<br />
The <strong>City</strong> <strong>of</strong> <strong>Cerritos</strong> has two other governmental funds that qualify as major funds. The<br />
Redevelopment Agency Debt Service Fund ended the fiscal year with a deficit fund balance <strong>of</strong> $66.1<br />
million. The deficit fund balance increased $22.9 million during the fiscal year due to the mandatory<br />
SERAF payment to the State <strong>of</strong> California ($11.8 million) and the increased transfer to the Capital<br />
Projects Fund ($11.7 million). The Redevelopment Agency Capital Projects Fund completed fiscal<br />
year 2009-10 with an ending fund balance <strong>of</strong> $25.3 million. Of this ending fund balance, $2.0 million<br />
is reserved for land held for resale. The remaining fund balance <strong>of</strong> $23.3 million is unreserved. The<br />
increase <strong>of</strong> $0.3 million in fund balance from the previous fiscal year is due to the increase in the<br />
transfer from the Debt Service Fund.<br />
Proprietary Funds<br />
The <strong>City</strong>’s proprietary funds provide the same type <strong>of</strong> information found in the government-wide<br />
financial statements, but in more detail.<br />
The <strong>City</strong>’s major proprietary funds are the Water, Reclaimed Water and Electric Utility Funds. Net<br />
assets <strong>of</strong> the Water, Reclaimed Water, and Electric Utility Funds at the end <strong>of</strong> the fiscal year amounted<br />
to $25.4 million, $7.5 million, and $6.1 million, respectively. The total change in net assets <strong>of</strong> these<br />
9
FINANCIAL ANALYSIS OF THE CITY’S FUNDS (CONTINUED)<br />
Proprietary Funds (Continued)<br />
funds was ($2.6) million, ($0.5) million, and ($1.9) million. In total, net assets for all major funds<br />
decreased $5.0 million from the previous year.<br />
Operating expenses exceeded operating revenues in each <strong>of</strong> the major proprietary funds resulted in a<br />
decline in net assets. The <strong>City</strong> has not implemented a rate increase in the past four years, calling upon<br />
existing net assets to subsidize operations.<br />
GENERAL FUND BUDGETARY HIGHLIGHTS<br />
During the fiscal year, there was a $1.3 million decrease in appropriations between the original and<br />
final amended budget. <strong>City</strong> management mandated budget reductions within all departmental budgets<br />
due to the effects <strong>of</strong> the economic recession on the <strong>City</strong>’s major revenue streams. All line items were<br />
reviewed with special emphasis on necessary expenditures, while items such as travel, training, and<br />
supplies were reduced.<br />
As stated above, the decrease in appropriations was necessary because <strong>of</strong> the decline in the <strong>City</strong>’s<br />
major revenue sources, primarily sales tax revenue declining $3.4 million, or 16.7% from the prior<br />
fiscal year.<br />
CAPITAL ASSET AND DEBT ADMINISTRATION<br />
Capital Assets<br />
The <strong>City</strong> <strong>of</strong> <strong>Cerritos</strong>’ investment in capital assets for its governmental and business-type activities as <strong>of</strong><br />
June 30, 2010, amounts to $338.5 million (net <strong>of</strong> accumulated depreciation) an increase <strong>of</strong> $5.2 million<br />
from the prior fiscal year. This investment in capital assets includes land, streets, water, sewer and<br />
storm drain systems, buildings and improvements, machinery and equipment, vehicles, public works <strong>of</strong><br />
art, parking structures, and electric rights.<br />
The following table presents the capital assets <strong>of</strong> the <strong>City</strong> <strong>of</strong> <strong>Cerritos</strong> at June 30, 2010.<br />
<strong>City</strong> <strong>of</strong> <strong>Cerritos</strong> Capital Assets<br />
(in millions)<br />
Governmental activities Business-type activities Total<br />
2010 2009 2010 2009 2010 2009<br />
Land $ 84.0 $ 77.0 $ - $ - $ 84.0 $ 77.0<br />
Parking structure rights 3.8 3.8 - - 3.8 3.8<br />
Right-<strong>of</strong>-way 49.2 49.2 - - 49.2 49.2<br />
Public art 4.4 4.4 - - 4.4 4.4<br />
Trees 1.4 1.4 - - 1.4 1.4<br />
Construction in progress 0.2 2.4 - 1.0 0.2 3.4<br />
Buildings and structures 126.0 124.2 3.2 3.3 129.2 127.5<br />
Improvements other<br />
than buildings 4.3 4.4 - - 4.3 4.4<br />
Infrastructure/water mains<br />
and lines 21.7 21.2 22.3 22.1 44.0 43.3<br />
Water rights - - 1.8 1.9 1.8 1.9<br />
Electric Rights - - 11.8 12.2 11.8 12.2<br />
Furniture and equipment 3.1 3.4 1.3 1.4 4.4 4.8<br />
Total $ 298.1 $ 291.4 $ 40.4 $ 41.9 $ 338.5 $ 333.3<br />
10
CAPITAL ASSET AND DEBT ADMINISTRATION (CONTINUED)<br />
Capital Assets (Continued)<br />
Major capital asset events during the fiscal year included the following:<br />
<br />
<br />
<br />
Purchase <strong>of</strong> property located on the Northwest corner <strong>of</strong> Studebaker Road and 183 rd Street in<br />
the amount <strong>of</strong> $7.0 million;<br />
Completion <strong>of</strong> the Sheriff Station expansion amounting to $6.5 million;<br />
The Bloomfield Avenue resurfacing project was completed in the amount <strong>of</strong> $1.1 million.<br />
Besides utilizing highway users’ tax revenues to complete this project, the <strong>City</strong> received $0.5<br />
million in ARRA funding for the completion <strong>of</strong> this resurfacing.<br />
Detailed information relating to capital assets can be found in Note 7 to the basic financial statements.<br />
Long-term debt<br />
At the end <strong>of</strong> the current fiscal year, the <strong>City</strong> had total debt outstanding <strong>of</strong> $176.2 million. The<br />
majority <strong>of</strong> this debt is Redevelopment Agency revenue bonds ($168.8 million). Additions to the<br />
<strong>City</strong>’s long-term debt included $2.0 million <strong>of</strong> OPEB obligation and $1.9 million in general liability<br />
claims payable.<br />
<strong>City</strong> <strong>of</strong> <strong>Cerritos</strong> Long-Term Debt<br />
(in millions)<br />
2010 2009<br />
Los <strong>Cerritos</strong>-Revenue Bonds $ 39.8 $ 42.3<br />
Los Coyotes-Revenue Bonds 127.4 132.1<br />
Add Deferred Amounts 1.6 1.7<br />
Subtotal – Revenue Bonds 168.8 176.1<br />
Note Payable 1.0 1.0<br />
Compensated Absences 2.5 2.5<br />
Net OPEB Obligation 2.0 -<br />
Claims Payable-General Liability 1.9 -<br />
Total Long-Term Debt $ 176.2 $ 179.6<br />
Detailed information relating to long-term debt can be found in Note 9 to the basic financial<br />
statements.<br />
ECONOMIC FACTORS AND NEXT YEAR’S BUDGET<br />
S<strong>of</strong>tness in the real estate market along with a tightening in the credit market continues to have an<br />
adverse effect on the local Southern California economy. Key sectors <strong>of</strong> the economy that continue to<br />
be affected include technology, entertainment and certain durable goods. Rising costs <strong>of</strong> raw materials<br />
along with unemployment concerns has slowed remodeling and reconstruction <strong>of</strong> housing within the<br />
<strong>City</strong> <strong>of</strong> <strong>Cerritos</strong>.<br />
The <strong>City</strong> <strong>of</strong> <strong>Cerritos</strong> has been able to maintain its levels <strong>of</strong> service to the community by positioning<br />
itself to withstand fluctuations in the economic environment. The combined tax revenues, particularly<br />
sales tax and income from investments and ground leases have made it possible to progress with the<br />
planned level <strong>of</strong> development while maintaining a high degree <strong>of</strong> financial stability.<br />
11
ECONOMIC FACTORS AND NEXT YEAR’S BUDGET (CONTINUED)<br />
The <strong>City</strong>’s ability to maintain a positive business climate was evidenced with the completion <strong>of</strong> the<br />
new Nordstrom Department store along with a new Kia dealership at the <strong>Cerritos</strong> Auto Square. These<br />
accomplishments are strong examples <strong>of</strong> the <strong>City</strong>’s continued ability to generate significant ground<br />
rent, sales tax and tax increment revenues.<br />
Despite the challenging economic environment, careful management <strong>of</strong> expenditures will enable the<br />
<strong>City</strong> to maintain its ability to fund current levels <strong>of</strong> services to its residents without the need to use its<br />
reserves. The <strong>City</strong> has, in the past, used unreserved fund balance for specific capital projects, but<br />
continues to take a cautious approach to spending in light <strong>of</strong> the ongoing California budget crisis.<br />
Management is confident that the <strong>City</strong> can sustain and build upon its current reserves while satisfying<br />
the funding needs <strong>of</strong> future capital projects and operations. Future planned capital projects include the<br />
installation <strong>of</strong> photovoltaic solar panels at the Corporate Yard and ongoing street improvement<br />
projects.<br />
The recent fluctuations in revenues, continuing demand for the <strong>City</strong>’s service levels, and potential<br />
revenue reductions from the State’s actions to eliminate the State budget deficit continue to be taken<br />
into account by the <strong>City</strong> in budgeting its expenses for the upcoming year. The <strong>City</strong> <strong>of</strong> <strong>Cerritos</strong><br />
continues to adopt a budget that not only serves as a financial plan, but also a communication device,<br />
policy tool and operations guide for the <strong>City</strong> Council and the citizens <strong>of</strong> <strong>Cerritos</strong>.<br />
REQUESTS FOR INFORMATION<br />
This financial report is designed to provide the <strong>City</strong> <strong>of</strong> <strong>Cerritos</strong> citizens, taxpayers, customers,<br />
investors, and creditors with a general overview <strong>of</strong> the <strong>City</strong>’s finances and to illustrate the <strong>City</strong>’s<br />
accountability for the money it receives. If you have questions about this report or need additional<br />
financial information, contact the <strong>City</strong>’s Administrative Services Department at the <strong>City</strong> <strong>of</strong> <strong>Cerritos</strong>,<br />
18125 Bloomfield Avenue, <strong>Cerritos</strong>, CA 90703, or call (562) 860-0311 or visit our website at<br />
www.ci.cerritos.us.<br />
12
BASIC FINANCIAL STATEMENTS<br />
13
This page intentionally left blank.<br />
14
GOVERNMENT-WIDE FINANCIAL STATEMENTS<br />
15
This page intentionally left blank.<br />
16
<strong>City</strong> <strong>of</strong> <strong>Cerritos</strong><br />
Statement <strong>of</strong> Net Assets<br />
June 30, 2010<br />
ASSETS<br />
Governmental Business-Type<br />
Activities Activities Total<br />
Cash and investments $ 130,461,058 $ 4,133,401 $ 134,594,459<br />
Restricted assets:<br />
Cash 9,959,056 - 9,959,056<br />
Investments with fiscal agents 16,826,527 - 16,826,527<br />
Accounts receivable 6,117,358 1,640,279 7,757,637<br />
Interest receivable 328,090 9,593 337,683<br />
Internal balances 8,316,367 (8,316,367) -<br />
Other receivables 1,791,336 - 1,791,336<br />
Prepaid expenses 814,865 2,581,274 3,396,139<br />
Inventories 23,883 - 23,883<br />
Land held for resale or lease 1,953,330 - 1,953,330<br />
Unamortized bond issue costs 1,407,931 - 1,407,931<br />
Capital assets:<br />
Nondepreciable 142,944,636 - 142,944,636<br />
Depreciable, net 155,114,206 40,406,258 195,520,464<br />
Total Assets 476,058,643 40,454,438 516,513,081<br />
LIABILITIES<br />
Accounts payable and accrued liabilities 4,722,875 979,909 5,702,784<br />
Accrued salaries and benefits 1,579,966 73,440 1,653,406<br />
Interest payable 1,718,465 - 1,718,465<br />
Unearned revenue 2,223,836 - 2,223,836<br />
Due to other agencies 776,000 - 776,000<br />
Deposits payable 399,716 56,632 456,348<br />
Noncurrent liabilities:<br />
Due within one year 8,340,500 64,484 8,404,984<br />
Due in more than one year 167,870,465 193,453 168,063,918<br />
Total Liabilities 187,631,823 1,367,918 188,999,741<br />
NET ASSETS<br />
Invested in capital assets, net <strong>of</strong> related debt 129,318,648 40,406,258 169,724,906<br />
Restricted for:<br />
Street and sewer related purposes 4,423,142 - 4,423,142<br />
Transportation related purposes 1,254,083 - 1,254,083<br />
Assessment districts 105,662 - 105,662<br />
Miscellaneous grants 492,474 - 492,474<br />
Asset replacement 25,275,197 - 25,275,197<br />
Unrestricted 127,557,614 (1,319,738) 126,237,876<br />
Total Net Assets $ 288,426,820 $ 39,086,520 $ 327,513,340<br />
See accompanying Notes to Basic <strong>Financial</strong> Statements.<br />
17
<strong>City</strong> <strong>of</strong> <strong>Cerritos</strong><br />
Statement <strong>of</strong> Activities<br />
For the Year Ended June 30, 2010<br />
Program Revenues<br />
Operating<br />
Capital<br />
Charges for Grants and Grants and<br />
Functions/Programs Expenses Services Contributions Contributions<br />
Governmental Activities:<br />
Legislative and Administration $ 24,023,012 $ 8,990 $ 4,355,058 $<br />
-<br />
Community Development 9,634,162 1,472,210 1,696,862 -<br />
Public Works 17,574,871 924,062 2,943,244 -<br />
Water and Power 503,095 8,200 - -<br />
Community and Safety Services 23,219,777 3,724,638 265,931 367,744<br />
Administrative Services 12,431,539 1,313,723 2,020,775 -<br />
<strong>Cerritos</strong> Center for the Performing Arts 10,795,353 4,620,793 16,000 246,046<br />
Unallocated infrastructure depreciation 1,051,981 - - -<br />
Interest and fiscal charges 16,114,428 - - -<br />
Total Governmental Activities 115,348,218 12,072,616 11,297,870 613,790<br />
Business-Type Activities:<br />
Water 9,690,959 7,032,634 - 109,677<br />
Reclaimed Water 1,351,283 698,021 - -<br />
Electric Utility 6,524,284 4,637,710 - -<br />
Total Business-Type Activities 17,566,526 12,368,365 - 109,677<br />
Total $ 132,914,744 $ 24,440,981 $ 11,297,870 $ 723,467<br />
General Revenues:<br />
Taxes:<br />
Sales taxes<br />
Property taxes<br />
Motor vehicle taxes<br />
Franchise taxes<br />
Transient occupancy taxes<br />
Other taxes<br />
Investment and rental income<br />
Miscellaneous<br />
Total General Revenues<br />
Changes in Net Assets<br />
Net Assets - Beginning <strong>of</strong> Year<br />
Net Assets - End <strong>of</strong> Year<br />
See accompanying Notes to Basic <strong>Financial</strong> Statements.<br />
18
Net (Expense) Revenue and<br />
Changes in Net Assets<br />
Governmental Business-Type<br />
Activities Activities Total<br />
$ (19,658,964) $ - $ (19,658,964)<br />
(6,465,090) - (6,465,090)<br />
(13,707,565) - (13,707,565)<br />
(494,895) - (494,895)<br />
(18,861,464) - (18,861,464)<br />
(9,097,041) - (9,097,041)<br />
(5,912,514) - (5,912,514)<br />
(1,051,981) - (1,051,981)<br />
(16,114,428) - (16,114,428)<br />
(91,363,942) - (91,363,942)<br />
- (2,548,648) (2,548,648)<br />
- (653,262) (653,262)<br />
- (1,886,574) (1,886,574)<br />
- (5,088,484) (5,088,484)<br />
$ (91,363,942) $ (5,088,484) $ (96,452,426)<br />
17,166,138 - 17,166,138<br />
34,842,837 - 34,842,837<br />
4,382,067 - 4,382,067<br />
1,498,545 - 1,498,545<br />
356,119 - 356,119<br />
286,895 - 286,895<br />
20,581,624 97,855 20,679,479<br />
1,132,936 - 1,132,936<br />
80,247,161 97,855 80,345,016<br />
(11,116,781) (4,990,629) (16,107,410)<br />
299,543,601 44,077,149 343,620,750<br />
$ 288,426,820 $ 39,086,520 $ 327,513,340<br />
19
This page intentionally left blank.<br />
20
FUND FINANCIAL STATEMENTS<br />
21
<strong>City</strong> <strong>of</strong> <strong>Cerritos</strong><br />
Balance Sheet<br />
Governmental Funds<br />
June 30, 2010<br />
Redevelopment Redevelopment<br />
Agency Agency Nonmajor Total<br />
Debt Service Capital Projects Governmental Governmental<br />
General Fund Fund Funds Funds<br />
ASSETS<br />
Cash and investments $ 71,311,235 $ 23,269,018 $ 13,952,937 $ 6,426,461 $ 114,959,651<br />
Restricted assets:<br />
Cash 9,959,056 - - - 9,959,056<br />
Investments with fiscal agents - 16,826,527 - - 16,826,527<br />
Receivables:<br />
Accounts 4,736,415 - 189,836 1,191,107 6,117,358<br />
Notes - - 2,395,506 - 2,395,506<br />
Interest 197,273 54,702 25,222 14,915 292,112<br />
Other 1,945 1,781,338 - 8,053 1,791,336<br />
Due from other funds 3,691,630 - - - 3,691,630<br />
Prepaid expenses 814,315 - - 550 814,865<br />
Inventories 23,883 - - - 23,883<br />
Land held for resale or lease - - 1,953,330 - 1,953,330<br />
Advances to other funds 101,784,752 - 11,812,007 - 113,596,759<br />
Total Assets $ 192,520,504 $ 41,931,585 $ 30,328,838 $ 7,641,086 $ 272,422,013<br />
LIABILITIES AND<br />
FUND BALANCES<br />
Liabilities:<br />
Accounts payable and accrued liabilities $ 3,310,931 $ - $ 649,891 $ 717,983 $ 4,678,805<br />
Accrued salaries and benefits 1,527,806 - - 52,160 1,579,966<br />
Deferred revenue 4,222,810 - 2,628,772 565,475 7,417,057<br />
Deposits payable 358,883 - 40,833 - 399,716<br />
Due to other funds - 1,796,734 1,734,145 29,136 3,560,015<br />
Due to other agencies - 776,000 - - 776,000<br />
Advances from other funds - 105,412,007 - - 105,412,007<br />
Total Liabilities 9,420,430 107,984,741 5,053,641 1,364,754 123,823,566<br />
Fund Balances:<br />
Reserved:<br />
General fund 102,622,950 - - - 102,622,950<br />
Land held for resale or lease - - 1,953,330 - 1,953,330<br />
Unreserved, designated for, reported in:<br />
General fund 11,659,056 - - - 11,659,056<br />
Special revenue funds - - - 6,275,361 6,275,361<br />
Capital projects funds - - 23,321,867 971 23,322,838<br />
Unreserved, undesignated 68,818,068 (66,053,156) - - 2,764,912<br />
Total Fund Balances 183,100,074 (66,053,156) 25,275,197 6,276,332 148,598,447<br />
Total Liabilities and<br />
Fund Balances $ 192,520,504 $ 41,931,585 $ 30,328,838 $ 7,641,086 $ 272,422,013<br />
See accompanying Notes to Basic <strong>Financial</strong> Statements.<br />
22
<strong>City</strong> <strong>of</strong> <strong>Cerritos</strong><br />
Reconciliation <strong>of</strong> the Governmental Funds Balance Sheet<br />
to the Government-Wide Statement <strong>of</strong> Net Assets<br />
June 30, 2010<br />
Total Fund Balances - Total Governmental Funds $ 148,598,447<br />
Amounts reported for governmental activities in the statement <strong>of</strong> net assets are different because:<br />
Capital assets used in governmental activities are not financial resources and therefore are not<br />
reported in governmental funds.<br />
Cost $ 405,086,194<br />
Less: Accumulated depreciation (107,027,352)<br />
298,058,842<br />
Revenue earned but not available to pay for current period expenditures for governmental funds<br />
is deferred.<br />
2,797,715<br />
Internal service funds are used by management to charge the costs <strong>of</strong> various city activities to<br />
individual government. The assets and liabilities <strong>of</strong> the internal service funds are included in<br />
the statement <strong>of</strong> net assets.<br />
15,493,315<br />
Long-term liabilities applicable to the <strong>City</strong> governmental activities are not due and payable in<br />
the current period and accordingly are not reported as fund liabilities. All liabilities, both<br />
current and long-term, are reported in the Statement <strong>of</strong> Net Assets:<br />
Tax allocation bonds payable $ (167,152,500)<br />
Note payable (1,025,000)<br />
Compensated absences payable (2,512,435)<br />
Claims payable (1,917,561)<br />
OPEB liabilities (2,015,775)<br />
Unamortized bond premium (4,293,775)<br />
Unamortized deferred charge on refunding <strong>of</strong> bonds 1,843,196<br />
Unamortized bond discount 862,885<br />
Unamortized issuance cost 1,407,931<br />
(174,803,034)<br />
Accrued interest payable for the interest due on long-term liabilities has not been reported in the<br />
governmental funds.<br />
(1,718,465)<br />
Net Assets <strong>of</strong> Governmental Activities $ 288,426,820<br />
See accompanying Notes to Basic <strong>Financial</strong> Statements.<br />
23
<strong>City</strong> <strong>of</strong> <strong>Cerritos</strong><br />
Statement <strong>of</strong> Revenues, Expenditures and Changes in Fund Balances<br />
Governmental Funds<br />
For the Year Ended June 30, 2010<br />
REVENUES:<br />
Redevelopment Redevelopment<br />
Agency Agency Nonmajor Total<br />
Debt Service Capital Projects Governmental Governmental<br />
General Fund Fund Funds Funds<br />
Property, sales, and other taxes $ 20,507,251 $ 32,144,708 $ - $ - $ 52,651,959<br />
Licenses and permits 1,913,968 - - - 1,913,968<br />
Fines and forfeitures 1,103,441 - - - 1,103,441<br />
Investment and rental income 16,468,213 580,417 2,583,324 136,365 19,768,319<br />
Revenues from other agencies 10,976,983 - - 5,637,027 16,614,010<br />
Current fees and services 6,932,698 - - 157,320 7,090,018<br />
Franchises 1,498,545 - - 6,307 1,504,852<br />
Other revenues 1,706,500 - 32,392 109,183 1,848,075<br />
Total Revenues 61,107,599 32,725,125 2,615,716 6,046,202 102,494,642<br />
EXPENDITURES:<br />
Current:<br />
Legislative and Administration 2,707,891 13,656,362 4,982,491 11,140 21,357,884<br />
Community Development 2,864,679 - - 1,793,123 4,657,802<br />
Public Works 10,908,071 - - 5,219,166 16,127,237<br />
Water and Power 73,683 - - 32,140 105,823<br />
Community and Safety Services 21,217,358 - - 134,604 21,351,962<br />
Administrative Services 10,317,186 - - 329,302 10,646,488<br />
<strong>Cerritos</strong> Center for the Performing Arts 8,781,832 - - - 8,781,832<br />
Capital outlay - - 15,753,370 2,780,479 18,533,849<br />
Debt service:<br />
Principal retirement - 7,260,000 - - 7,260,000<br />
Interest - 16,261,275 - - 16,261,275<br />
Total Expenditures 56,870,700 37,177,637 20,735,861 10,299,954 125,084,152<br />
REVENUES OVER<br />
(UNDER) EXPENDITURES 4,236,899 (4,452,512) (18,120,145) (4,253,752) (22,589,510)<br />
OTHER FINANCING SOURCES (USES):<br />
Transfers in 2,000,000 - 18,428,942 5,130,074 25,559,016<br />
Transfers out (4,581,877) (18,428,942) - (2,548,197) (25,559,016)<br />
Total Other Financing Sources (Uses) (2,581,877) (18,428,942) 18,428,942 2,581,877 -<br />
Net Change in Fund Balances 1,655,022 (22,881,454) 308,797 (1,671,875) (22,589,510)<br />
FUND BALANCES:<br />
Beginning <strong>of</strong> Year 181,445,052 (43,171,702) 24,966,400 7,948,207 171,187,957<br />
End <strong>of</strong> Year $ 183,100,074 $ (66,053,156) $ 25,275,197 $ 6,276,332 $ 148,598,447<br />
See accompanying Notes to Basic <strong>Financial</strong> Statements.<br />
24
<strong>City</strong> <strong>of</strong> <strong>Cerritos</strong><br />
Reconciliation <strong>of</strong> the Governmental Funds Statement <strong>of</strong> Revenues, Expenditures and Changes<br />
in Fund Balances to the Government-Wide Statement <strong>of</strong> Activities<br />
For the Year Ended June 30, 2010<br />
Net Change in Fund Balance - Total Governmental Funds: $ (22,589,510)<br />
Amounts reported for governmental activities in the Statement <strong>of</strong> Activities are different because:<br />
Governmental funds report capital outlays as expenditures. However, in the Statement <strong>of</strong> Activities the cost<br />
<strong>of</strong> these assets is allocated over their estimated useful lives and reported as depreciation expense.<br />
Capital outlays $ 18,533,849<br />
Less: Capital outlay related to repair and maintenance (5,180,543)<br />
Disposition <strong>of</strong> capital assets (23,067)<br />
Depreciation expense (6,651,779)<br />
6,678,460<br />
Revenue in the Statement <strong>of</strong> Activities that does not provide current financial resources is not reported as<br />
revenue in governmental funds.<br />
1,736,795<br />
Internal service funds are used by management to charge the costs <strong>of</strong> certain activities, such as equipment<br />
replacement and inventory usage fees to individual funds. The change in net assets <strong>of</strong> internal service funds<br />
is reported within governmental activities.<br />
(400,950)<br />
The issuance <strong>of</strong> long-term liabilities provides current financial resources to governmental funds, while the<br />
repayment <strong>of</strong> the principal <strong>of</strong> long-term liabilities consumes the current financial resources <strong>of</strong> governmental<br />
funds. Neither transaction, however, has any effect on net assets. Also, governmental funds report the effect<br />
<strong>of</strong> issuance costs, premiums, discounts, and similar items when debt is first issued, whereas these amounts<br />
are deferred and amortized in the statement <strong>of</strong> activities. This amount is the net effect <strong>of</strong> these differences in<br />
the treatment <strong>of</strong> long-term liabilities and related items.<br />
Debt issued or incurred:<br />
Principal payments $ 7,260,000<br />
Change in compensated absences payable (15,087)<br />
Change in claim payable (1,917,561)<br />
Change in OPEB liabilities (2,015,775) 3,311,577<br />
Some expenses reported in the Statement <strong>of</strong> Activities do not require the use <strong>of</strong> current financial resources<br />
and therefore are not reported as expenditures in the governmental funds.<br />
Accrued interest 144,135<br />
Amortization <strong>of</strong> bond premium 306,699<br />
Amortization <strong>of</strong> deferred charge on refunding (141,785)<br />
Amortization <strong>of</strong> bond discount (61,635)<br />
Amortization <strong>of</strong> issuance costs (100,567) 146,847<br />
Change in Net Assets <strong>of</strong> Governmental Activities $ (11,116,781)<br />
See accompanying Notes to Basic <strong>Financial</strong> Statements.<br />
25
This page intentionally left blank.<br />
26
PROPRIETARY FUND FINANCIAL STATEMENTS<br />
27
<strong>City</strong> <strong>of</strong> <strong>Cerritos</strong><br />
Statement <strong>of</strong> Net Assets<br />
Proprietary Funds<br />
June 30, 2010<br />
Governmental<br />
Business-Type Activities - Enterprise Funds<br />
Activities -<br />
Water Reclaimed Electric Total Enterprise Internal<br />
Fund Water Utility Funds Service Funds<br />
ASSETS<br />
Current Assets:<br />
Cash and investments $ 4,107,021 $ - $ 26,380 $ 4,133,401 $ 15,501,407<br />
Accounts receivable 1,015,256 143,755 481,268 1,640,279 -<br />
Interest receivable 9,532 - 61 9,593 35,978<br />
Prepaid expenses 38,580 3,930 2,538,764 2,581,274 -<br />
Total Current Assets 5,170,389 147,685 3,046,473 8,364,547 15,537,385<br />
Noncurrent Assets:<br />
Capital assets:<br />
Construction in progress - - - - -<br />
Building and structures 4,947,697 1,315,000 - 6,262,697 -<br />
Water mains and lines 27,788,342 13,068,932 - 40,857,274 -<br />
Equipment 4,023,715 120,278 - 4,143,993 -<br />
Water rights acquired 2,259,378 - - 2,259,378 -<br />
Electric utility rights acquired - - 14,105,000 14,105,000 -<br />
Accumulated depreciation (17,921,130) (6,950,121) (2,350,833) (27,222,084) -<br />
Total Noncurrent Assets 21,098,002 7,554,089 11,754,167 40,406,258 -<br />
Total Assets 26,268,391 7,701,774 14,800,640 48,770,805 15,537,385<br />
LIABILITIES<br />
Current Liabilities:<br />
Accounts payable 473,770 14,980 491,159 979,909 44,070<br />
Accrued salaries and benefits 66,290 7,150 73,440 -<br />
Deposits payable 56,632 - - 56,632 -<br />
Due to other funds - 131,615 - 131,615 -<br />
Compensated absences 64,484 - - 64,484 -<br />
Total Current Liabilities 661,176 153,745 491,159 1,306,080 44,070<br />
Noncurrent Liabilities:<br />
Advance from other funds - - 8,184,752 8,184,752 -<br />
Compensated absences 193,453 - - 193,453 -<br />
Total Noncurrent Liabilities 193,453 - 8,184,752 8,378,205 -<br />
Total Liabilities 854,629 153,745 8,675,911 9,684,285 44,070<br />
NET ASSETS<br />
Invested in capital assets 21,098,002 7,554,089 11,754,167 40,406,258 -<br />
Unrestricted 4,315,760 (6,060) (5,629,438) (1,319,738) 15,493,315<br />
Total Net Assets $ 25,413,762 $ 7,548,029 $ 6,124,729 $ 39,086,520 $ 15,493,315<br />
See accompanying Notes to Basic <strong>Financial</strong> Statements.<br />
28
<strong>City</strong> <strong>of</strong> <strong>Cerritos</strong><br />
Statement <strong>of</strong> Revenues, Expenses and Changes in Net Assets<br />
Proprietary Funds<br />
For the Year Ended June 30, 2010<br />
Governmental<br />
Business-Type Activities - Enterprise Funds<br />
Activities -<br />
Water Reclaimed Electric Total Enterprise Internal<br />
Fund Water Utility Funds Service Funds<br />
OPERATING REVENUES:<br />
Sales <strong>of</strong> water:<br />
Regular $ 5,631,671 $ 698,021 $ - $ 6,329,692 $<br />
-<br />
Wholesale 1,142,858 - - 1,142,858 -<br />
Sales <strong>of</strong> electricity:<br />
Regular - - 3,532,311 3,532,311 -<br />
Resale - - 430 430 -<br />
Gas sales - - 245,160 245,160 -<br />
Fire lines 241,557 - - 241,557 -<br />
Charges for services 16,314 - - 16,314 -<br />
Other agency contribution - - 859,809 859,809 -<br />
Other revenues 234 - - 234 -<br />
Total Operating Revenues 7,032,634 698,021 4,637,710 12,368,365 -<br />
OPERATING EXPENSES:<br />
Management 2,557,940 306,010 172,090 3,036,040 -<br />
Production and distribution 4,767,936 48,380 - 4,816,316 -<br />
Operations 922,710 611,590 5,005,091 6,539,391 -<br />
Inspections 362,390 43,660 - 406,050 -<br />
Billings and collection 282,658 31,960 - 314,618 -<br />
Administrative costs - - - - 745,760<br />
Depreciation 797,325 309,683 470,166 1,577,174 -<br />
Total Operating Expenses 9,690,959 1,351,283 5,647,347 16,689,589 745,760<br />
OPERATING INCOME (LOSS) (2,658,325) (653,262) (1,009,637) (4,321,224) (745,760)<br />
NONOPERATING REVENUES (EXPENSES):<br />
Investment income 97,579 - 276 97,855 344,810<br />
Interest expense - - (876,937) (876,937) -<br />
Gain (loss) on sale <strong>of</strong> equipment - - - - -<br />
Total Nonoperating Revenues (Expenses) 97,579 - (876,661) (779,082) 344,810<br />
INCOME (LOSS) BEFORE CAPITAL<br />
CONTRIBUTIONS AND TRANSFERS (2,560,746) (653,262) (1,886,298) (5,100,306) (400,950)<br />
CAPITAL CONTRIBUTIONS AND TRANSFERS:<br />
Capital contributions 109,677 - - 109,677 -<br />
Transfers in - 137,299 - 137,299 -<br />
Transfers out (137,299) - - (137,299) -<br />
Total Capital Contributions and Transfers (27,622) 137,299 - 109,677 -<br />
Change in Net Assets (2,588,368) (515,963) (1,886,298) (4,990,629) (400,950)<br />
NET ASSETS:<br />
Beginning <strong>of</strong> the Year 28,002,130 8,063,992 8,011,027 44,077,149 15,894,265<br />
End <strong>of</strong> the Year $ 25,413,762 $ 7,548,029 $ 6,124,729 $ 39,086,520 $ 15,493,315<br />
See accompanying Notes to Basic <strong>Financial</strong> Statements.<br />
29
<strong>City</strong> <strong>of</strong> <strong>Cerritos</strong><br />
Statement <strong>of</strong> Cash Flows<br />
Proprietary Funds<br />
For the Year Ended June 30, 2010<br />
Governmental<br />
Business-Type Activities Enterprise Funds<br />
Activities -<br />
Water Reclaimed Electric Total Enterprise Internal<br />
Fund Water Utility Funds Service Funds<br />
CASH FLOWS FROM OPERATING ACTIVITIES:<br />
Cash received from customers $ 7,104,916 $ 750,556 $ 4,975,735 $ 12,831,207 $<br />
-<br />
Cash paid to other suppliers <strong>of</strong> goods or services (5,873,764) (720,610) (4,777,481) (11,371,855) (416,000)<br />
Cash paid to employees (2,498,705) (298,860) (172,090) (2,969,655) (285,690)<br />
Net Cash Provided by<br />
(Used for) Operating Activities (1,267,553) (268,914) 26,164 (1,510,303) (701,690)<br />
CASH FLOWS FROM NONCAPITAL<br />
FINANCING ACTIVITIES:<br />
Transfers from/(to) other funds (137,299) 137,299 - - -<br />
Cash advances from other funds - 131,615 876,938 1,008,553 -<br />
Net Cash Provided by (Used for)<br />
Noncapital Financing Activities (137,299) 268,914 876,938 1,008,553 -<br />
CASH FLOWS FROM CAPITAL AND<br />
RELATED FINANCING ACTIVITIES:<br />
Acquisition <strong>of</strong> capital assets (71,011) - (876,937) (947,948) -<br />
Capital contributions - cash 109,677 - - 109,677 -<br />
Net Cash Provided by (Used for)<br />
Capital and Related Financing Activities 38,666 - (876,937) (838,271) -<br />
CASH FLOWS FROM INVESTING ACTIVITIES:<br />
Interest income received 88,047 - 215 88,262 308,832<br />
Net Cash Provided by (Used for)<br />
Investing Activities 88,047 - 215 88,262 308,832<br />
Net Increase (Decrease) in<br />
Cash and Cash Equivalents (1,278,139) - 26,380 (1,251,759) (392,858)<br />
CASH AND CASH EQUIVALENTS:<br />
Beginning <strong>of</strong> Year 5,385,160 - - 5,385,160 15,894,265<br />
End <strong>of</strong> Year $ 4,107,021 $ - $ 26,380 $ 4,133,401 $ 15,501,407<br />
RECONCILIATION OF OPERATING<br />
INCOME (LOSS) TO NET CASH PROVIDED BY<br />
(USED FOR) OPERATING ACTIVITIES:<br />
Operating income (loss) $ (2,658,325) $ (653,262) $ (1,009,637) $ (4,321,224) $ (745,760)<br />
Adjustments to reconcile operating income to net cash<br />
provided by (used for) operating activities:<br />
Depreciation expense 797,325 309,683 470,166 1,577,174 -<br />
Change in assets and liabilities:<br />
(Increase) decrease in accounts receivable 110,862 56,465 338,025 505,352 -<br />
(Increase) decrease in prepaid expenses (38,580) (3,930) (251,559) (294,069) -<br />
(Increases) decrease in inventories - - - - -<br />
(Increase) decrease in other receivables - - - - -<br />
Increase (decrease) in accounts payable 458,780 14,980 479,169 952,929 44,070<br />
Increase (decrease) in accrued salaries and benefits (198,702) 7,150 - (191,552) -<br />
Increase (decrease) in deposits payable 3,150 - - 3,150 -<br />
Increase (decrease) in compensated absences 257,937 - - 257,937 -<br />
Net Cash Provided by<br />
(Used for) Operating Activities $ (1,267,553) $ (268,914) $ 26,164 $ (1,510,303) $ (701,690)<br />
See accompanying Notes to Basic <strong>Financial</strong> Statements.<br />
30
<strong>City</strong> <strong>of</strong> <strong>Cerritos</strong><br />
Index to Notes to Basic <strong>Financial</strong> Statements<br />
For the year ended June 30, 2010<br />
1. SUMMARY OF SIGNIFICANT ACCOUNTING POLICIES ·················································· 33<br />
A. <strong>Financial</strong> <strong>Report</strong>ing Entity ···························································································· 33<br />
B. Basis <strong>of</strong> Accounting and Measurement Focus ··································································· 34<br />
C. Use <strong>of</strong> Restricted/Unrestricted Net Assets ······································································· 37<br />
D. Cash and Cash Equivalents ·························································································· 37<br />
E. Investments ··············································································································· 37<br />
F. Inventories ················································································································ 37<br />
G. Capital Assets ············································································································ 37<br />
H. Land Held for Resale or Lease ······················································································· 38<br />
I. Compensated Absences Payable ···················································································· 38<br />
J. Claims and Judgments ································································································· 39<br />
K. Property Taxes ··········································································································· 39<br />
L. Estimates ·················································································································· 39<br />
2. CASH AND INVESTMENTS ··························································································· 40<br />
A. Deposits ··················································································································· 40<br />
B. Investments ··············································································································· 41<br />
C. Investments Authorized by Debt Agreements ·································································· 41<br />
D. Risk Disclosures ········································································································· 42<br />
E. Investments in State Investment Pool ·············································································· 44<br />
3. PREPAID EXPENSES ······································································································ 44<br />
4. NOTES RECEIVABLE ····································································································· 45<br />
5. INTERFUND TRANSACTIONS ······················································································· 45<br />
A. Government-Wide <strong>Financial</strong> Statements ·········································································· 45<br />
B. Fund <strong>Financial</strong> Statements ···························································································· 45<br />
6. LAND HELD FOR RESALE OR LEASE ·············································································· 47<br />
7. CAPITAL ASSETS ·········································································································· 49<br />
8. DEFERRED/UNEARNED REVENUE ················································································· 51<br />
Page<br />
31
<strong>City</strong> <strong>of</strong> <strong>Cerritos</strong><br />
Index to Notes to Basic <strong>Financial</strong> Statements, Continued<br />
For the year ended June 30, 2010<br />
9. LONG TERM DEBT ········································································································ 52<br />
A. Los <strong>Cerritos</strong> Redevelopment Project 1993 Revenue Bonds, Series B ······································· 53<br />
B. Los <strong>Cerritos</strong> Redevelopment Project 2002 Tax Allocation Revenue Bonds, Series A ·················· 53<br />
C. Los <strong>Cerritos</strong> Redevelopment Project 2002 Tax Allocation Revenue Bonds, Series B ··················· 54<br />
D. Los <strong>Cerritos</strong> and Los Coyotes Redevelopment Project-Magnolia Power Project B,<br />
Series 2003 Revenue Bonds ··························································································· 55<br />
E. Los Coyotes Redevelopment Project 1993 Revenue Bonds, Series A ······································ 56<br />
F. Los Coyotes Redevelopment Project 1993 Revenue Bonds, Series B ······································· 57<br />
G. Los Coyotes Redevelopment Project 1998 Tax Allocation Bonds, Series A ······························· 58<br />
H. Los Coyotes Redevelopment Project 2002 Tax Allocation Revenue Bonds, Series A ·················· 58<br />
I. Los Coyotes Redevelopment Project 2002 Tax Allocation Revenue Bonds, Series B ··················· 59<br />
J. Los <strong>Cerritos</strong> and Los Coyotes Redevelopment Project-Magnolia Power Project B,<br />
Series 2003 Revenue Bonds ·························································································· 60<br />
K. Los <strong>Cerritos</strong> Redevelopment Project-Note Payable ···························································· 62<br />
L. Compensated Absences ······························································································· 62<br />
M. Net OPEB Obligation ·································································································· 62<br />
N. Claims Payable – General Liability ················································································· 62<br />
10. RESERVES AND DESIGNATIONS OF FUND BALANCES ·················································· 63<br />
11. RETIREMENT PLAN ······································································································ 64<br />
A. Defined Benefit Pension Plan ························································································ 64<br />
B. Post-Retirement Health Care Benefits ············································································· 66<br />
C. Other Defined Contribution Plans ·················································································· 68<br />
12. LIABILITY, PROPERTY AND WORKERS’ COMPENSATION PROTECTION ························ 68<br />
A. Description <strong>of</strong> Self-Insurance Pool Pursuant to Joint Powers Agreement ································ 68<br />
B. Self-Insurance Programs <strong>of</strong> the Authority ········································································ 69<br />
C. Purchased Insurance ··································································································· 69<br />
D. Adequacy <strong>of</strong> Protection ······························································································· 70<br />
E. Retroactive Deposit ····································································································· 70<br />
13. OTHER REQUIRED DISCLOSURES ················································································· 71<br />
A. Deficit Fund Balances ·································································································· 71<br />
B. Excess Expenditures over Appropriations ········································································ 72<br />
14. COMMITMENTS AND CONTINGENCIES ······································································· 72<br />
A. Lawsuits ··················································································································· 72<br />
B. Contract with Los Angeles County Sheriff’s Department ···················································· 72<br />
C. $5,640,000 Tax Allocation Bonds arrangement with Commonwealth Cousins I, LLC ················· 73<br />
D. Electric Utility ··········································································································· 73<br />
15. LEASE INCOME UNDER OPERATING LEASES ································································ 73<br />
16. PROPROSITION 1A BORROWING BY THE STATE OF CALIFORNIA ·································· 74<br />
17. SUBSEQUENT EVENT ··································································································· 74<br />
Page<br />
32
<strong>City</strong> <strong>of</strong> <strong>Cerritos</strong><br />
Notes to Basic <strong>Financial</strong> Statements<br />
For the year ended June 30, 2010<br />
1. SUMMARY OF SIGNIFICANT ACCOUNTING POLICIES<br />
The basic financial statements <strong>of</strong> the <strong>City</strong> <strong>of</strong> <strong>Cerritos</strong>, California, (<strong>City</strong>) have been prepared in conformity<br />
with generally accepted accounting principles (GAAP) as applied to governmental agencies. The<br />
Governmental Accounting Standards Boards (GASB) is the accepted standard setting body for establishing<br />
governmental accounting and financial reporting principles. The following is a summary <strong>of</strong> the significant<br />
policies:<br />
A. <strong>Financial</strong> <strong>Report</strong>ing Entity<br />
The <strong>City</strong> <strong>of</strong> <strong>Cerritos</strong> was incorporated on April 26, 1956 as a charter city under the laws <strong>of</strong> the State <strong>of</strong><br />
California and enjoys all the rights and privileges allowed by its charter. The <strong>City</strong> is governed by an elected<br />
five-member council.<br />
As required by generally accepted accounting principles (GAAP), the accompanying financial statements<br />
present the <strong>City</strong> and its component units. GASB Statement No. 14, The <strong>Financial</strong> <strong>Report</strong>ing Entity, defines<br />
component units as legally separate entities that meet any one <strong>of</strong> the following tests:<br />
<br />
<br />
<br />
The <strong>City</strong> appoints the voting majority <strong>of</strong> the board <strong>of</strong> the potential component unit and:<br />
o<br />
o<br />
is able to impose its will on the component unit and/or<br />
is in a relationship <strong>of</strong> financial benefit or burden with the potential component unit.<br />
The potential component unit is fiscally dependent upon the <strong>City</strong>.<br />
The financial statements <strong>of</strong> the <strong>City</strong> would be misleading if data from the potential component units<br />
were omitted.<br />
Management determined that the following component units should be blended based on the criteria<br />
above:<br />
<strong>Cerritos</strong> Redevelopment Agency - The <strong>Cerritos</strong> Redevelopment Agency (Agency) was activated in<br />
November, 1969 pursuant to the State <strong>of</strong> California Health and Safety Code, Section 33000 entitled<br />
“Community Development Law”. The primary purpose <strong>of</strong> the Agency is to eliminate physically and<br />
economically blighted areas by encouraging the development <strong>of</strong> residential, commercial, industrial,<br />
recreational and public facilities. The Agency has undertaken the Los <strong>Cerritos</strong> Redevelopment Project,<br />
encompassing approximately 940 acres, and the Los Coyotes Redevelopment Project that covers 1,615<br />
acres in the eastern section <strong>of</strong> the <strong>City</strong>. The Agency, through the two project areas, has constructed<br />
various facilities that are being utilized by the <strong>City</strong>.<br />
<strong>Cerritos</strong> Public Financing Authority - The <strong>Cerritos</strong> Public Financing Authority (Authority) was formed<br />
pursuant to a Joint Exercise <strong>of</strong> Powers Agreement, dated May 18, 1993 by and between the <strong>City</strong> and the<br />
Agency. The purpose <strong>of</strong> the Authority is to provide financing for public improvements and capital<br />
expenditures and for the repayment <strong>of</strong> existing debt.<br />
These component units are included in the primary government because <strong>of</strong> the significance <strong>of</strong> their<br />
financial or operational relationship and due to the same governing body as the <strong>City</strong>.<br />
The Agency issues separate component unit financial statements and these can be obtained from the <strong>City</strong>’s<br />
Administrative Services Department located at 18125 Bloomfield Avenue, <strong>Cerritos</strong>, California 90703.<br />
Separate financial statements are not prepared for the Authority.<br />
33
<strong>City</strong> <strong>of</strong> <strong>Cerritos</strong><br />
Notes to Basic <strong>Financial</strong> Statements, Continued<br />
For the year ended June 30, 2010<br />
1. SUMMARY OF SIGNIFICANT ACCOUNTING POLICIES, Continued<br />
B. Basis <strong>of</strong> Accounting and Measurement Focus<br />
The accounts <strong>of</strong> the <strong>City</strong> are organized on the basis <strong>of</strong> funds, each <strong>of</strong> which is considered a separate<br />
accounting entity. The operations <strong>of</strong> each fund are accounted for in a separate set <strong>of</strong> self-balancing accounts<br />
that comprise its assets, liabilities, fund equity, revenues, and expenditures or expenses, as appropriate.<br />
<strong>City</strong> resources are allocated to and accounted for in individual funds based upon the purpose for which<br />
they are to be spent and the means by which spending activities are controlled.<br />
Government-Wide <strong>Financial</strong> Statements<br />
The <strong>City</strong>’s Government-Wide <strong>Financial</strong> Statements include a Statement <strong>of</strong> Net Assets and a Statement <strong>of</strong><br />
Activities. These statements present summaries <strong>of</strong> Governmental and Business-Type Activities for the <strong>City</strong><br />
accompanied by a total column.<br />
The Government-Wide <strong>Financial</strong> Statements are presented on an “economic resources” measurement focus<br />
and the accrual basis <strong>of</strong> accounting. Accordingly, all <strong>of</strong> the <strong>City</strong>’s assets and liabilities, including capital<br />
assets, as well as infrastructure assets, and long-term liabilities, are included in the accompanying<br />
Statement <strong>of</strong> Net Assets. The Statement <strong>of</strong> Activities presents changes in net assets. Under the accrual basis<br />
<strong>of</strong> accounting, revenues are recognized in the period in which they are earned while expenses are<br />
recognized in the period in which the liability is incurred. The types <strong>of</strong> transactions reported as program<br />
revenues for the <strong>City</strong> are reported in three categories: 1) charges for services, 2) operating grants and<br />
contributions, and 3) capital grants and contributions.<br />
Certain eliminations have been made as prescribed by GASB Statement No. 34 in regards to interfund<br />
activities, payables and receivables including the corresponding deferred revenues. All internal balances in<br />
the Statement <strong>of</strong> Net Assets have been eliminated except those representing balances between the<br />
governmental activities and the business-type activities, which are presented as internal balances and<br />
eliminated in the total primary government column. In the Statement <strong>of</strong> Activities, internal service fund<br />
transactions have been eliminated. However, transactions between governmental and business-type<br />
activities have not been eliminated. The following interfund activities have been eliminated:<br />
<br />
<br />
<br />
Due to and from other funds<br />
Advances to and from other funds<br />
Transfers in and out<br />
The <strong>City</strong> applies all applicable GASB pronouncements (including all NCGA Statements and Interpretations<br />
currently in effect) as well as the following pronouncements issued on or before November 30, 1989, to the<br />
business-type activities, unless those pronouncements conflict with or contradict GASB pronouncements:<br />
<strong>Financial</strong> Accounting Standards Board (FASB) Statements and Interpretations, Accounting Principles Board<br />
(APB) Opinions, and Accounting Research Bulletins (ARB) <strong>of</strong> the Committee on Accounting Procedure.<br />
The <strong>City</strong> applies all applicable FASB Statements and Interpretations issued after November 30, 1989, except<br />
those that conflict with or contradict GASB pronouncements.<br />
34
<strong>City</strong> <strong>of</strong> <strong>Cerritos</strong><br />
Notes to Basic <strong>Financial</strong> Statements, Continued<br />
For the year ended June 30, 2010<br />
1. SUMMARY OF SIGNIFICANT ACCOUNTING POLICIES, Continued<br />
B. Basis <strong>of</strong> Accounting and Measurement Focus, Continued<br />
Governmental Fund <strong>Financial</strong> Statements<br />
Governmental Fund <strong>Financial</strong> Statements include a Balance Sheet and a Statement <strong>of</strong> Revenues,<br />
Expenditures and Changes in Fund Balance for all major governmental funds and nonmajor funds<br />
aggregated. An accompanying schedule is presented to reconcile and explain the differences in net assets as<br />
presented in these statements to the net assets presented in the Government-Wide financial statements. The<br />
<strong>City</strong> has presented all major funds that met the qualifications for major fund reporting.<br />
All governmental funds are accounted for on a spending or "current financial resources" measurement<br />
focus and the modified accrual basis <strong>of</strong> accounting. Accordingly, only current assets and current liabilities<br />
are included on the Balance Sheets. The Statement <strong>of</strong> Revenues, Expenditures and Changes in Fund Balance<br />
presents increases (revenues and other financing sources) and decreases (expenditures and other financing<br />
uses) in net current assets. Under the modified accrual basis <strong>of</strong> accounting, revenues are recognized in the<br />
accounting period in which they become both measurable and available to finance expenditures <strong>of</strong> the<br />
current period.<br />
Revenues are recorded when received in cash, except that revenues subject to accrual (generally 60 days<br />
after year-end) are recognized when due. The primary revenue sources, which have been treated as<br />
susceptible to accrual by the <strong>City</strong>, are property taxes, sales taxes, taxpayer-assessed tax revenues (transient<br />
occupancy taxes, franchise taxes, etc.), certain grant revenues and earnings on investments. Expenditures<br />
are recorded in the accounting period in which the related fund liability is incurred.<br />
Deferred revenues arise when potential revenues do not meet both the “measurable” and “available” criteria<br />
for recognition in the current period. Deferred revenues also arise when the government receives resources<br />
before it has a legal claim to them, as when grant monies are received prior to incurring qualifying<br />
expenditures. In subsequent periods when both revenue recognition criteria are met or when the<br />
government has a legal claim to the resources, the deferred revenue is removed from the balance sheet and<br />
revenue is recognized.<br />
Reconciliation <strong>of</strong> the Fund <strong>Financial</strong> Statements to the Government-Wide <strong>Financial</strong> Statements is provided<br />
to explain the differences created by the integrated approach <strong>of</strong> GASB Statement No. 34.<br />
Proprietary Fund <strong>Financial</strong> Statements<br />
Proprietary Fund <strong>Financial</strong> Statements include a Statement <strong>of</strong> Net Assets, a Statement <strong>of</strong> Revenues,<br />
Expenses and Changes in Net Assets, and a Statement <strong>of</strong> Cash Flows for each major proprietary fund.<br />
Proprietary funds are accounted for using the "economic resources" measurement focus and the accrual<br />
basis <strong>of</strong> accounting. Accordingly, all assets and liabilities (whether current or noncurrent) are included on<br />
the Statement <strong>of</strong> Net Assets. The Statement <strong>of</strong> Revenues, Expenses and Changes in Net Assets presents<br />
increases (revenues) and decreases (expenses) in total net assets. Under the accrual basis <strong>of</strong> accounting,<br />
revenues are recognized in the period in which they are earned while expenses are recognized in the period<br />
in which the liability is incurred. In these funds, receivables have been recorded as revenue and provisions<br />
have been made for uncollectible amounts.<br />
35
<strong>City</strong> <strong>of</strong> <strong>Cerritos</strong><br />
Notes to Basic <strong>Financial</strong> Statements, Continued<br />
For the year ended June 30, 2010<br />
1. SUMMARY OF SIGNIFICANT ACCOUNTING POLICIES, Continued<br />
B. Basis <strong>of</strong> Accounting and Measurement Focus, Continued<br />
Proprietary Fund <strong>Financial</strong> Statements, Continued<br />
Proprietary funds distinguish operating revenues and expenses from nonoperating items. Operating<br />
revenues and expenses generally result from providing services and producing and delivering goods in<br />
connection with a proprietary fund’s principal ongoing operations. The principal operating revenues <strong>of</strong> the<br />
proprietary funds are charges to customers for sales and services. Operating expenses for the proprietary<br />
funds include the cost <strong>of</strong> sales and services, administrative expenses and depreciation on capital assets. All<br />
revenues and expenses not meeting this definition are reported as nonoperating revenues and expenses.<br />
The <strong>City</strong> reports the following major governmental funds:<br />
The General Fund is the general operating fund <strong>of</strong> the <strong>City</strong>. All general tax revenues and other receipts<br />
not allocated by law or contractual agreement to other funds are accounted for in this fund.<br />
Expenditures <strong>of</strong> this fund include general operating costs not paid through other funds.<br />
The Redevelopment Agency Debt Service Fund is used to account for tax increment revenue and related<br />
interest income. Tax increment is property tax revenue based on the increase in valuation <strong>of</strong> the project<br />
areas over the “frozen” base year. This fund is used for the repayment <strong>of</strong> principal and interest on the<br />
indebtedness <strong>of</strong> the Agency.<br />
The Redevelopment Agency Capital Projects Fund is used to account for advances from the <strong>City</strong> <strong>of</strong><br />
<strong>Cerritos</strong>, bond proceeds available for project improvements, a portion <strong>of</strong> tax increment revenues set<br />
aside for low/moderate income housing projects, interest income on invested funds and certain<br />
miscellaneous income. The funds are expended primarily for administrative expenses and<br />
redevelopment project costs.<br />
The <strong>City</strong> reports the following major proprietary funds:<br />
The Water Fund is used to account for the provision <strong>of</strong> water to the residents and businesses <strong>of</strong> the <strong>City</strong>.<br />
All activities necessary to provide such services are accounted for in this fund including, but not limited<br />
to, administration, operations, maintenance, construction, and financing.<br />
The Reclaimed Water Fund is used to account for the construction, operations, and maintenance <strong>of</strong> the<br />
<strong>City</strong> owned reclaimed wastewater system.<br />
The Electric Utility Fund is used to account for provided retail electricity provided by the <strong>City</strong>. Initially,<br />
major accounts for both the <strong>City</strong> and the ABC Unified School District were served. Additional accounts<br />
have been added since inception to utilize the full output <strong>of</strong> the Magnolia plant allocated to <strong>Cerritos</strong>. All<br />
activities necessary to provide such services are accounted for in this fund including, but not limited to,<br />
administration, operations, maintenance, construction financing and related debt service.<br />
36
<strong>City</strong> <strong>of</strong> <strong>Cerritos</strong><br />
Notes to Basic <strong>Financial</strong> Statements, Continued<br />
For the year ended June 30, 2010<br />
1. SUMMARY OF SIGNIFICANT ACCOUNTING POLICIES, Continued<br />
B. Basis <strong>of</strong> Accounting and Measurement Focus, Continued<br />
Additionally, the <strong>City</strong> reports the following fund types:<br />
The Special Revenue Funds are used to account for the proceeds <strong>of</strong> specific revenue sources that are<br />
legally restricted or otherwise designated for specific purposes.<br />
The Capital Projects Fund is used to account for financial resources used for the acquisition or<br />
construction <strong>of</strong> major capital facilities not accounted for in other funds.<br />
The Equipment Replacement Fund, an Internal Service Fund, is used to account for the regular<br />
maintenance and replacement <strong>of</strong> the <strong>City</strong>’s capital equipment and <strong>of</strong>fice equipment inventory.<br />
C. Use <strong>of</strong> Restricted/Unrestricted Net Assets<br />
When an expense is incurred for purposes for which both restricted and unrestricted net assets are<br />
available, the <strong>City</strong>’s policy is to apply restricted net assets first, then unrestricted net assets as they are<br />
needed.<br />
D. Cash and Cash Equivalents<br />
A substantial portion <strong>of</strong> the <strong>City</strong>’s investments are in short-term liquid instruments, with original maturities<br />
<strong>of</strong> three months or less (excluding fiscal agent investments). The Enterprise and Internal Service Funds<br />
participate in the pooling <strong>of</strong> <strong>City</strong>-wide cash and investments. Amounts from the pool are available to these<br />
funds on demand. As a result, the cash and investments <strong>of</strong> the Enterprise and Internal Service Funds are<br />
considered to be cash and cash equivalents for Statement <strong>of</strong> Cash Flow purposes. The Statement <strong>of</strong> Cash<br />
Flows is presented using the direct method.<br />
E. Investments<br />
Investments are stated at fair value (quoted market price or best available estimate there<strong>of</strong>).<br />
F. Inventories<br />
Inventories are valued at average cost. Inventories in the General Fund are recorded based on the<br />
consumption (capitalization) method and are <strong>of</strong>fset by a fund balance reserve.<br />
G. Capital Assets<br />
Capital assets (including infrastructure) are recorded at cost where historical records are available and at an<br />
estimated original cost where no historical records exist. Contributed capital assets are valued at their<br />
estimated fair market value at the date <strong>of</strong> contribution. Generally, capital asset purchases in excess <strong>of</strong> $2,500<br />
are capitalized if they have an expected useful life <strong>of</strong> 1 year or more.<br />
37
<strong>City</strong> <strong>of</strong> <strong>Cerritos</strong><br />
Notes to Basic <strong>Financial</strong> Statements, Continued<br />
For the year ended June 30, 2010<br />
1. SUMMARY OF SIGNIFICANT ACCOUNTING POLICIES, Continued<br />
G. Capital Assets, Continued<br />
Capital assets include additions to public domain (infrastructure), certain improvements including<br />
pavement, curb and gutter, sidewalks, traffic control devices, street lights, sewers, bridges and right-<strong>of</strong>-way<br />
corridors within the <strong>City</strong>. The <strong>City</strong> has valued and recorded all infrastructure asset data as <strong>of</strong> June 30, 2010.<br />
In June 1999, the Governmental Accounting Standards Board (GASB) issued Statement No. 34 which<br />
requires the inclusion <strong>of</strong> infrastructure capital assets in local governments’ basic financial statements. For<br />
infrastructure systems, the <strong>City</strong> elected to use the “Basic Approach” as defined by GASB Statement No. 34<br />
for infrastructure reporting.<br />
The costs <strong>of</strong> normal maintenance and repairs that do not add to the value <strong>of</strong> the asset or materially extend<br />
assets lives are not capitalized.<br />
Major outlays for capital assets and improvements are capitalized as projects are constructed. Interest<br />
incurred during the construction phase <strong>of</strong> the capital assets <strong>of</strong> business-type activities is included as part <strong>of</strong><br />
the capitalized value <strong>of</strong> the assets constructed.<br />
Capital assets used in operations are depreciated over their estimated useful lives using the straight-line<br />
method. The lives used for depreciation purposes <strong>of</strong> each capital asset class are:<br />
Buildings<br />
Improvements other than buildings<br />
Water mains and lines<br />
Water rights<br />
Vehicles<br />
Machinery and equipment<br />
Office furniture, computers and equipment<br />
Leased property<br />
Infrastructure<br />
40 years<br />
10 to 40 years<br />
65 years<br />
40 years<br />
5 to 15 years<br />
5 to 15 years<br />
3 to 15 years<br />
5 to 10 years<br />
20 to 75 years<br />
H. Land Held For Resale or Lease<br />
Land held for resale or lease is carried in the Redevelopment Agency Capital Projects Fund at the lower <strong>of</strong><br />
cost or market value at acquisition.<br />
I. Compensated Absences Payable<br />
In governmental funds vacation and sick leave are recorded as expenditures in the year paid. Accordingly,<br />
the entire unpaid liability for the governmental funds is recorded as a long-term obligation in the<br />
government-wide financial statements only.<br />
Unpaid compensated absences in proprietary funds are recorded as a liability in those funds as the vested<br />
benefits accrue to the employees.<br />
38
<strong>City</strong> <strong>of</strong> <strong>Cerritos</strong><br />
Notes to Basic <strong>Financial</strong> Statements, Continued<br />
For the year ended June 30, 2010<br />
1. SUMMARY OF SIGNIFICANT ACCOUNTING POLICIES, Continued<br />
J. Claims and Judgments<br />
When it is probable that a claim or judgment liability has been incurred at year end, and the amount <strong>of</strong> the<br />
loss can be reasonably estimated, the <strong>City</strong> records the estimated loss, net <strong>of</strong> any insurance coverage. The<br />
<strong>City</strong> is a member <strong>of</strong> the California Joint Powers Insurance Authority (CJPIA). The <strong>City</strong> believes that its<br />
deposits with the CJPIA are adequate to cover all claims, including claims incurred but not reported.<br />
K. Property Taxes<br />
Under California law, property taxes are assessed and collected by the counties up to 1% <strong>of</strong> assessed value,<br />
plus other increases approved by the voters. The property taxes go into a pool, with the County, and are<br />
then allocated to the cities based on complex formulas. The following are annual dates pertaining to<br />
property taxes:<br />
Lien Date January 1<br />
Levy Date June 30<br />
Due Dates November 1 and February 1<br />
Delinquency Dates December 10 and April 10<br />
L. Estimates<br />
The preparation <strong>of</strong> the basic financial statements in conformity with accounting principles generally<br />
accepted in the United States <strong>of</strong> America requires management to make estimates and assumptions that<br />
affect certain reported amounts and disclosures. Accordingly, actual results could differ from those<br />
estimates.<br />
2. CASH AND INVESTMENTS<br />
The <strong>City</strong> maintains a cash and investment pool, which includes cash balances and authorized investments<br />
<strong>of</strong> all funds. The <strong>City</strong> has the following cash and investments at June 30:<br />
Government-Wide<br />
Statement <strong>of</strong> Net Assets<br />
Governmental Business-Type<br />
Activities Activities<br />
Total<br />
Cash and Investments $ 130,461,058 $ 4,133,401 $ 134,594,459<br />
Restricted Cash and Investments:<br />
Cash 9,959,056 - 9,959,056<br />
Investments with fiscal agents 16,826,527 - 16,826,527<br />
Total $ 157,246,641 $ 4,133,401 $ 161,380,042<br />
39
<strong>City</strong> <strong>of</strong> <strong>Cerritos</strong><br />
Notes to Basic <strong>Financial</strong> Statements, Continued<br />
For the year ended June 30, 2010<br />
2. CASH AND INVESTMENTS, Continued<br />
The <strong>City</strong>’s Cash and Investments at June 30 in more detail:<br />
Cash and cash equivalents:<br />
Petty cash $ 11,785<br />
Demand deposits 1,303,571<br />
Total cash and cash equivalents 1,315,356<br />
Investments:<br />
Local Agency Investment Fund 83,016,653<br />
Federal Agency Issues 65,094,446<br />
Corporate Obligations 3,001,495<br />
Certificates <strong>of</strong> Deposits 300,000<br />
Investment Contracts 3,206,533<br />
Money Market Mutual Funds 5,445,559<br />
Total investments 160,064,686<br />
Total cash and investments $ 161,380,042<br />
A. Deposits<br />
The carrying amounts <strong>of</strong> the <strong>City</strong>’s demand deposits were $1,303,571 at June 30, 2010. Bank balances before<br />
reconciling items were $2,198,685 at that date, the total amount <strong>of</strong> which was collateralized or insured with<br />
securities held by the pledging financial institutions in the <strong>City</strong>’s name as discussed below.<br />
The California Government Code requires California banks and savings and loan associations to secure the<br />
<strong>City</strong>’s cash deposits by pledging securities as collateral. This Code states that collateral pledged in this<br />
manner shall have the effect <strong>of</strong> perfecting a security interest in such collateral superior to those <strong>of</strong> a general<br />
creditor. Thus, collateral for cash deposits is considered to be held in the <strong>City</strong>'s name.<br />
The market value <strong>of</strong> pledged securities must equal at least 110% <strong>of</strong> the <strong>City</strong>'s cash deposits. California law<br />
also allows institutions to secure city deposits by pledging first trust deed mortgage notes having a value <strong>of</strong><br />
150% <strong>of</strong> the <strong>City</strong>’s total cash deposits. The <strong>City</strong> may waive collateral requirements for cash deposits, which<br />
are fully insured up to $250,000 by the Federal Deposit Insurance Corporation. The <strong>City</strong>, however, has not<br />
waived the collateralization requirements.<br />
40
<strong>City</strong> <strong>of</strong> <strong>Cerritos</strong><br />
Notes to Basic <strong>Financial</strong> Statements, Continued<br />
For the year ended June 30, 2010<br />
2. CASH AND INVESTMENTS, Continued<br />
B. Investments<br />
The table below identifies the investment types that are authorized for the <strong>City</strong> by the California<br />
Government Code (or the <strong>City</strong>’s investment policy, where more restrictive). The table also identifies certain<br />
provisions <strong>of</strong> the California Government Code (or the <strong>City</strong>’s investment policy, where more restrictive) that<br />
address interest rate risk, credit risk, and concentration <strong>of</strong> credit risk. This table does not address<br />
investments <strong>of</strong> debt proceeds held by bond trustee that are governed by the provisions <strong>of</strong> debt agreements<br />
<strong>of</strong> the <strong>City</strong>, rather than the general provisions <strong>of</strong> the California Government Code or the <strong>City</strong>’s investment<br />
policy.<br />
Maximum Maximum<br />
Maximum Percentage Investment<br />
Authorized Investment Type Maturity <strong>of</strong> Portfolio * in One Issuer<br />
United States Treasury Obligations 5 years No Limit No Limit<br />
U.S. Government Sponsored<br />
Enterprise Securities 5 years No Limit No Limit<br />
Banker's Acceptances 180 days 40% 10%<br />
Commercial Paper 270 days 40% 10%<br />
Negotiable Certificates <strong>of</strong> Deposit 5 years 30% 10%<br />
Repurchase Agreements 1 year No Limit No Limit<br />
Medium-Term Corporate Notes 5 years 30% 10%<br />
Money Market Mutual Funds N/A 20% No Limit<br />
Local Agency Investment Fund (LAIF) N/A No Limit $ 50,000,000<br />
N/A - Not Applicable<br />
* Excluding amounts held by bond trustees that are not subject to California Government Code restrictions.<br />
C. Investments Authorized by Debt Agreements<br />
Investment <strong>of</strong> debt proceeds held by a bond trustee are governed by provisions <strong>of</strong> the debt agreements,<br />
rather than the general provisions <strong>of</strong> the California Government Code or the <strong>City</strong>’s investment policy.<br />
Investments authorized for funds held by the bond trustee include U.S. Treasury Obligations, U.S.<br />
Government Sponsored Enterprise Securities, Money Market Mutual Funds and Investment Contracts.<br />
There were no limitations on the maximum amount that can be invested in one issuer, maximum<br />
percentage allowed or the maximum maturity <strong>of</strong> an investment.<br />
41
<strong>City</strong> <strong>of</strong> <strong>Cerritos</strong><br />
Notes to Basic <strong>Financial</strong> Statements, Continued<br />
For the year ended June 30, 2010<br />
2. CASH AND INVESTMENTS, Continued<br />
D. Risk Disclosures<br />
Interest Rate Risk – The <strong>City</strong>’s investment policy manages exposure to interest rate risk by purchasing a<br />
combination <strong>of</strong> shorter term and longer term investments and by timing cash flows from maturities so that<br />
a portion <strong>of</strong> the portfolio is maturing or coming close to maturity evenly over time as necessary to provide<br />
the cash flow and liquidity needed for operations. The policy limits investment maturities as a means <strong>of</strong><br />
managing its exposure to fair value losses arising from fluctuating interest rates. Information about the<br />
sensitivity <strong>of</strong> the fair values <strong>of</strong> the <strong>City</strong>’s investments (including investments held by bond trustees) to<br />
market interest rate fluctuations is provided by the following table that shows the distribution <strong>of</strong> the <strong>City</strong>’s<br />
investments at maturity:<br />
Remaining Maturity (in Months)<br />
12 Months 13 - 24 25 - 60<br />
Investment Type or Less Months Months Total<br />
Local Agency Investment Fund (LAIF) $ 83,016,653 $ - $ - $ 83,016,653<br />
Federal Home Loan Bank (FHLB) - - 19,194,687 19,194,687<br />
Federal National Mortgage Association (FNMA) - - 8,322,094 8,322,094<br />
Federal Home Loan Mortgage Corporation (FHLMC) - - 17,093,496 17,093,496<br />
Federal Farm Credit Bank (FFCB) - 2,001,250 18,481,656 20,482,906<br />
Government Nat'l Mortgage Association (GNMA) - - 1,263 1,263<br />
Long Term Corporate Note (LTN) - - 41,667 41,667<br />
Certificates <strong>of</strong> Deposit 200,000 100,000 - 300,000<br />
Medium Term Corporate Notes (MTN) - - 2,959,828 2,959,828<br />
Investment Contracts - - 3,206,533 3,206,533<br />
Money Market Mutual Funds 5,445,559 - - 5,445,559<br />
Total $ 88,662,212 $ 2,101,250 $ 69,301,224 $ 160,064,686<br />
42
<strong>City</strong> <strong>of</strong> <strong>Cerritos</strong><br />
Notes to Basic <strong>Financial</strong> Statements, Continued<br />
For the year ended June 30, 2010<br />
2. CASH AND INVESTMENTS, Continued<br />
D. Risk Disclosures, Continued<br />
Credit Risk – Generally, credit risk is the risk that an issuer <strong>of</strong> an investment will not fulfill its obligation to<br />
the holder <strong>of</strong> the investment. This is measured by the assignment <strong>of</strong> a rating by a nationally recognized<br />
statistical rating organization. Presented below is the minimum rating required by (where applicable) the<br />
California Government Code, the <strong>City</strong>’s investment policy, or debt agreements, and the actual rating at time<br />
<strong>of</strong> purchase for each investment type:<br />
Total Minimum Not<br />
as <strong>of</strong> Legal Required<br />
Investment Type June 30, 2010 Rating AAA Other Unrated to be Rated<br />
LAIF $ 83,016,653 N/A $ - $ - $ - $ 83,016,653<br />
FHLB 19,194,687 N/A 19,194,687 - - -<br />
FNMA 8,322,094 N/A 8,322,094 - - -<br />
FHLMC 17,093,496 N/A 17,093,496 - - -<br />
FFCB 20,482,906 N/A 20,482,906 - - -<br />
GNMA 1,263 N/A 1,263 - - -<br />
LTN 41,667 N/A - - 41,667 -<br />
Certificates <strong>of</strong> deposit 300,000 A-1/P-1 - - 300,000 -<br />
MTN 2,959,828 A - 2,959,828 - -<br />
Investment Contracts 3,206,533 N/A 3,206,533 - - -<br />
Money Market<br />
Mutual Funds 5,445,559 N - - 5,445,559 -<br />
Total $ 160,064,686<br />
$ 68,300,979 $ 2,959,828 $ 5,787,226 $ 83,016,653<br />
N/A - Not Applicable<br />
The actual ratings at time <strong>of</strong> purchase for the Medium Term Corporate Notes (MTN) are as follows:<br />
Other:<br />
A+ 2,149,828<br />
A 810,000<br />
Total other $ 2,959,828<br />
Custodial Credit Risk – For deposits, custodial credit risk is the risk that, in the event <strong>of</strong> the failure <strong>of</strong> a<br />
deposit financial institution, a government will not be able to recover its deposits or will not be able to<br />
recover collateral securities that are in the possession <strong>of</strong> an outside party. For an investment, custodial<br />
credit risk is the risk that, in the event <strong>of</strong> the failure <strong>of</strong> the counterparty, the <strong>City</strong> will not be able to recover<br />
the value <strong>of</strong> its investments or collateral securities that are in the possession <strong>of</strong> an outside party. The <strong>City</strong>’s<br />
investment policy does not contain legal or policy requirements that would limit the exposure to custodial<br />
credit risk for deposits or investments, other than the provision for deposits stated in Note 2A. At June 30,<br />
2010, $1,948,685 <strong>of</strong> the <strong>City</strong>’s deposits with financial institutions in excess <strong>of</strong> federal depository insurance<br />
limits was held in uncollateralized accounts.<br />
43
<strong>City</strong> <strong>of</strong> <strong>Cerritos</strong><br />
Notes to Basic <strong>Financial</strong> Statements, Continued<br />
For the year ended June 30, 2010<br />
2. CASH AND INVESTMENTS, Continued<br />
E. Investments in State Investment Pool<br />
The <strong>City</strong> is a participant in LAIF which is regulated by California Government Code Section 16429 under<br />
the oversight <strong>of</strong> the Treasurer <strong>of</strong> the State <strong>of</strong> California. The <strong>City</strong>’s investments with LAIF at June 30, 2010,<br />
included a portion <strong>of</strong> pool funds invested in Structured Notes and Asset-Backed Securities:<br />
Structured Notes: debt securities (other than asset-backed securities) whose cash flow characteristics<br />
(coupon rate, redemption amount, or stated maturity) depend upon one or more indices and/or that have<br />
embedded forwards or options.<br />
Asset-Backed Securities: generally mortgage-backed securities that entitle their purchasers to receive a share<br />
<strong>of</strong> the cash flows from a pool <strong>of</strong> assets such as principal and interest repayments from a pool <strong>of</strong> mortgages<br />
(for example, Collateralized Mortgage Obligations) or credit card receivables.<br />
As <strong>of</strong> June 30, 2010, the <strong>City</strong> had $83,016,653 invested in LAIF, which had invested 5.42% <strong>of</strong> the pool<br />
investment funds in Structured Notes and Asset-Backed securities as compared to 14.71% in the previous<br />
year.<br />
3. PREPAID EXPENSES<br />
Prepaid expenses consisted <strong>of</strong> the following at June 30, 2010:<br />
Rate Stablization $ 480,395<br />
Electric Utility Fund Reserve 2,538,764<br />
Other 376,980<br />
Total 3,396,139<br />
The Electric Utility Fund has prepaid expenses representing payments for the <strong>City</strong>’s share <strong>of</strong> fuel reserves,<br />
capital reserves and debt service reserves relating to the operations <strong>of</strong> the Magnolia Power Plant. Prepaid<br />
expenses as <strong>of</strong> June 30, 2010 for this Fund consisted <strong>of</strong> the following:<br />
Fuel reserves $ 651,211<br />
Capital reserves 1,492,055<br />
Debt service reserves 395,498<br />
Total 2,538,764<br />
44
<strong>City</strong> <strong>of</strong> <strong>Cerritos</strong><br />
Notes to Basic <strong>Financial</strong> Statements, Continued<br />
For the year ended June 30, 2010<br />
4. NOTES RECEIVABLE<br />
Notes receivable consisted <strong>of</strong> the following at June 30, 2010:<br />
Balance<br />
Balance<br />
June 30, 2009 Additions Deletions June 30, 2010<br />
Residential Assistance Program $ 2,040,000 $ - $ - $ 2,040,000<br />
Residental Loan Program 314,356 41,150 - 355,506<br />
Total $ 2,354,356 $ 41,150 $ - $ 2,395,506<br />
5. INTERFUND TRANSACTIONS<br />
A. Governmental-Wide <strong>Financial</strong> Statements<br />
At June 30, 2010, the <strong>City</strong> had the following internal receivable and payable:<br />
Internal Receivable<br />
Governmental<br />
Internal Payable Activities<br />
Business-Type Activities $<br />
8,316,367<br />
B. Fund <strong>Financial</strong> Statements<br />
Due To and Due From Other Funds - At June 30, 2010, the <strong>City</strong> had the following due to/from other funds:<br />
Due from Other funds<br />
Due to Other Funds<br />
Governmental Funds<br />
General<br />
Governmental Funds:<br />
Redevelopment Agency Debt Service Fund $<br />
1,796,734<br />
Redevelopment Agency Capital Projects Fund 1,734,145<br />
Nonmajor Governmental Funds 29,136<br />
Enterprise Fund:<br />
Reclaimed Water Funds 131,615<br />
Total $<br />
3,691,630<br />
The interfund amount between the General Fund and the Redevelopment Agency Funds are for<br />
administrative expenditures paid by the General Fund on behalf <strong>of</strong> the Agency. All amounts were repaid to<br />
the General Fund by August 31, 2010.<br />
45
<strong>City</strong> <strong>of</strong> <strong>Cerritos</strong><br />
Notes to Basic <strong>Financial</strong> Statements, Continued<br />
For the year ended June 30, 2010<br />
5. INTERFUND TRANSACTIONS, Continued<br />
B. Fund <strong>Financial</strong> Statements, Continued<br />
Advances To/From Other Funds - At June 30, 2010, the <strong>City</strong> had the following advances to/from other<br />
funds:<br />
Advances to Other Funds<br />
Governmental Funds<br />
Redevelopment<br />
Agency<br />
General Capital Projects<br />
Advances from Other Funds Fund Fund Total<br />
Governmental Funds:<br />
Redevelopment Agency Debt Service Fund $ 93,600,000 $ 11,812,007 $ 105,412,007<br />
Enterprise Fund:<br />
Electric Utility Enterprise Fund 8,184,752 - 8,184,752<br />
Total $ 101,784,752 $ 11,812,007 $ 113,596,759<br />
Advances from the General Fund to the Redevelopment Agency were provided to fund capital<br />
improvement projects in both the Los <strong>Cerritos</strong> and Los Coyotes projects areas. Interest on the outstanding<br />
balance on advances payable <strong>of</strong> $93,600,000 is charged at an annual rate <strong>of</strong> 8% to the Agency. The Agency<br />
remits the interest payment to the <strong>City</strong> on a quarterly basis. All payments to the <strong>City</strong> for the interest on<br />
advances payable were paid by August 31, 2010.<br />
Advances made to the Electric Utility Enterprise Fund in the amount <strong>of</strong> $8,184,752 from the General Fund<br />
were used for initial working capital. Interest on the outstanding balance on advances payable is charged at<br />
an annual rate <strong>of</strong> 12% to the Electric Utility Enterprise Fund. As <strong>of</strong> June 30, 2010, interest in the amount <strong>of</strong><br />
$876,938 was incurred and added to the outstanding loan balance.<br />
Advances from the Low and Moderate Income Housing Capital Project Fund to the Los <strong>Cerritos</strong> and Los<br />
Coyotes Redevelopment Agency Debt Service Funds were used to make the payment for the Agency’s<br />
share <strong>of</strong> the Supplemental Educational Revenue Augmentation Fund (SERAF) due to the State <strong>of</strong> California.<br />
No interest is charged on the outstanding balance on advances payable <strong>of</strong> $11,812,007. The Debt Service<br />
Funds remit the interest payments to the Low and Moderate Income Housing Fund on a quarterly basis.<br />
46
<strong>City</strong> <strong>of</strong> <strong>Cerritos</strong><br />
Notes to Basic <strong>Financial</strong> Statements, Continued<br />
For the year ended June 30, 2010<br />
5. INTERFUND TRANSACTIONS, Continued<br />
B. Fund <strong>Financial</strong> Statements, Continued<br />
Transfers - At June 30, 2010, the <strong>City</strong> had the following transfers in/out:<br />
Transfers In<br />
Governmental Funds<br />
Enterprise Fund<br />
Redevelopment Nonmajor Reclaimed<br />
General Agency Governmental Water<br />
Transfers Out Fund Capital Projects Funds Enterprise Total<br />
Governmental Funds:<br />
General Fund $ - $ - $ 4,581,877 $ - $ 4,581,877<br />
Redevelopment Agency Debt Service - 18,428,942 - - 18,428,942<br />
Nonmajor Governmental Funds 2,000,000 - 548,197 - 2,548,197<br />
Enterprise Fund:<br />
Water - - - 137,299 137,299<br />
Total $ 2,000,000 $ 18,428,942 $ 5,130,074 $ 137,299 $ 25,696,315<br />
During the year, the General Fund transferred $4,581,877 to the Nonmajor Governmental Funds related to<br />
certain capital projects costs and administrative costs within the funds.<br />
Transfers in the Redevelopment Agency Funds relate to the 20% set aside <strong>of</strong> tax increment revenues <strong>of</strong><br />
$18,428,942 from the Debt Service Funds to the Capital Projects Low and Moderate Income Housing Fund.<br />
Transfer in the amount <strong>of</strong> $2,000,000 was transferred from the Sewer Fund to the General Fund for the<br />
maintenance and reconstruction <strong>of</strong> the sewer systems. In addition, the transfer <strong>of</strong> $548,197 between the<br />
Nonmajor Governmental Funds relates to the funding <strong>of</strong> transportation related costs between the<br />
Proposition “A” and Proposition “C” funds.<br />
Transfer from the Water Fund <strong>of</strong> $137,299 to the Reclaimed Water Fund is for operations.<br />
6. LAND HELD FOR RESALE OR LEASE<br />
Land held for resale or lease consisted <strong>of</strong> the following at June 30, 2010:<br />
Project Area Agency Project Amount<br />
Los <strong>Cerritos</strong> - 17501 Studebaker Road Commercial Property $ 586,948<br />
Los <strong>Cerritos</strong> - 17423 Studebaker Road Commercial Property 1,366,382<br />
Total $ 1,953,330<br />
In September 2005, the Los <strong>Cerritos</strong> Capital Project Area acquired property for $1,205,662 and provided a<br />
note in the amount <strong>of</strong> $1,025,000 payable in ten years. Interest on the note is capitalized as Land Held for<br />
Resale or Lease in the year it is incurred. Capitalized interest in fiscal year 2009-10 was $36,900. (See Note<br />
9K)<br />
47
<strong>City</strong> <strong>of</strong> <strong>Cerritos</strong><br />
Notes to Basic <strong>Financial</strong> Statements, Continued<br />
For the year ended June 30, 2010<br />
6. LAND HELD FOR RESALE OR LEASE, Continued<br />
In addition, the Los <strong>Cerritos</strong> Capital Project Area purchased property on the corner <strong>of</strong> Studebaker Road and<br />
183 rd Street in the amount <strong>of</strong> $7 million. The property was leased to a new auto dealership. This purchase<br />
increased the Agency’s portfolio <strong>of</strong> property holdings and will generate additional revenue in the form <strong>of</strong><br />
ground rents and sales tax.<br />
The <strong>Cerritos</strong> Towne Center property has been developed under a disposition and development agreement<br />
with a developer. Office buildings, a hotel, and a community theater are included in this development<br />
project. Upon completion <strong>of</strong> each project, the land is being leased to the developer. Lease contracts and<br />
agreements showed there were a total <strong>of</strong> eighteen leases entered into with twelve <strong>of</strong> the leases related to the<br />
portion <strong>of</strong> the Towne Center property. (See Note 15)<br />
Each <strong>of</strong> the Senior Housing property sites have been developed under disposition and development<br />
agreements with a developer. During the construction <strong>of</strong> each project, the land was transferred to the<br />
developer under covenants restricting usage <strong>of</strong> the property for low and moderate income housing.<br />
In fiscal year 2008, two parcels <strong>of</strong> property were purchased in the amount <strong>of</strong> $14,571,561. In an innovative<br />
partnership, the Agency is working with the ABC Unified School District in the construction <strong>of</strong> a fifth<br />
affordable housing project. As proposed, current district <strong>of</strong>fices will move to the purchased property, which<br />
will be renovated to accommodate district needs. Meanwhile, the new affordable housing project, complete<br />
with a new park and senior center to compliment the new units will be constructed on the site currently<br />
occupied by the school district. The Los Angeles County Superior Court released a ruling on December 4,<br />
2008 that approved the project, which will commence when all legal requirements are secured and all<br />
necessary clarifications are finalized. The two parcels were transferred to the <strong>City</strong>’s capital assets account<br />
per the development agreement with the District. Additionally, the Agency is committed in the amount <strong>of</strong><br />
approximately $5 million for future improvements and relocation costs associated with this development<br />
agreement.<br />
48
<strong>City</strong> <strong>of</strong> <strong>Cerritos</strong><br />
Notes to Basic <strong>Financial</strong> Statements, Continued<br />
For the year ended June 30, 2010<br />
7. CAPITAL ASSETS<br />
The following is a summary <strong>of</strong> capital assets for the governmental activities:<br />
Governmental Activities<br />
Balance<br />
Balance<br />
July 1, 2009 Additions Deletions June 30, 2010<br />
Capital assets, not being depreciated:<br />
Land $ 76,955,827 $ 7,007,380 $ - $ 83,963,207<br />
Parking structure rights 3,760,000 - - 3,760,000<br />
Right-<strong>of</strong>-way 49,184,582 - - 49,184,582<br />
Public art 4,428,314 - - 4,428,314<br />
Trees 1,367,878 8,475 (6,336) 1,370,017<br />
Construction in progress 2,368,918 - (2,130,402) 238,516<br />
Total capital assets, not being depreciated 138,065,519 7,015,855 (2,136,738) 142,944,636<br />
Capital assets, being depreciated:<br />
Buildings 183,582,024 6,503,534 - 190,085,558<br />
Improvements other than buildings 5,017,486 44,392 (5,000) 5,056,878<br />
Furniture and equipment 22,677,536 431,112 (329,489) 22,779,159<br />
Infrastructure 42,774,382 1,488,815 (43,234) 44,219,963<br />
Total capital assets, being depreciated 254,051,428 8,467,853 (377,723) 262,141,558<br />
Less accumulated depreciation for:<br />
Buildings (59,364,435) (4,733,408) - (64,097,843)<br />
Improvements other than buildings (613,036) (154,460) 1,156 (766,340)<br />
Furniture and equipment (19,276,435) (711,930) 329,489 (19,658,876)<br />
Infrastructure (21,482,659) (1,051,981) 30,347 (22,504,293)<br />
Total accumulated depreciation (100,736,565) (6,651,779) 360,992 (107,027,352)<br />
Total capital assets, being depreciated, net 153,314,863 1,816,074 (16,731) 155,114,206<br />
Governmental activities capital assets, net $ 291,380,382 $ 8,831,929 $ (2,153,469) $ 298,058,842<br />
Depreciation expense was charged to functions/programs <strong>of</strong> governmental activities for the fiscal year<br />
ended June 30, 2010 as follows:<br />
Legislative and Administrative $ 556,557<br />
Community Development 77,903<br />
Public Works 167,878<br />
Water and Power 49,672<br />
Community and Safety Services 1,371,694<br />
Administrative Services 1,702,208<br />
<strong>Cerritos</strong> Center for the Performing Arts 1,673,886<br />
Unallocated infrastructure depreciation 1,051,981<br />
Total depreciation expense $ 6,651,779<br />
49
<strong>City</strong> <strong>of</strong> <strong>Cerritos</strong><br />
Notes to Basic <strong>Financial</strong> Statements, Continued<br />
For the year ended June 30, 2010<br />
7. CAPITAL ASSETS, Continued<br />
The following is a summary <strong>of</strong> capital assets for the business-type activities:<br />
Business-Type Activities<br />
Balance<br />
Balance<br />
July 1, 2009 Additions Deletions June 30, 2010<br />
Capital assets, not being depreciated:<br />
Construction in progress $ 984,348 $ - $ (984,348) $<br />
-<br />
Total capital assets, not being depreciated 984,348 - (984,348) -<br />
Capital assets, being depreciated:<br />
Buildings and structures 6,262,697 - - 6,262,697<br />
Water mains and lines 39,934,320 1,000,695 (77,741) 40,857,274<br />
Equipment 4,037,943 106,050 - 4,143,993<br />
Water rights acquired 2,259,378 - - 2,259,378<br />
Electric utility rights acquired 14,105,000 - - 14,105,000<br />
Total capital assets, being depreciated 66,599,338 1,106,745 (77,741) 67,628,342<br />
Less accumulated depreciation for:<br />
Buildings and structures (2,935,939) (124,333) - (3,060,272)<br />
Water mains and lines (17,830,477) (756,841) 26,355 (18,560,963)<br />
Equipment (2,628,791) (169,350) - (2,798,141)<br />
Water rights acquired (395,391) (56,484) - (451,875)<br />
Electric utility rights acquired (1,880,667) (470,166) - (2,350,833)<br />
Total accumulated depreciation (25,671,265) (1,577,174) 26,355 (27,222,084)<br />
Total capital assets, being depreciated, net 40,928,073 (470,429) (51,386) 40,406,258<br />
Business-type activities capital assets, net $ 41,912,421 $ (470,429) $ (1,035,734) $ 40,406,258<br />
Depreciation expense for business-type activities for the fiscal year ended June 30, 2010 was charged as<br />
follows:<br />
Water $ 797,325<br />
Reclaimed Water 309,683<br />
Electric Utility 470,166<br />
Total depreciation expense $ 1,577,174<br />
Electric Utility Rights - Southern California Public Power Authority (SCPPA)<br />
The <strong>City</strong>’s Electric Utility is a member <strong>of</strong> the SCPPA, a joint powers authority. The <strong>City</strong> entered into the<br />
Magnolia Power Project, which is financed and owned by SCPPA. Member cities <strong>of</strong> the Magnolia Power<br />
Project include Anaheim, Burbank, Colton, Glendale, and Pasadena (the Project “A” Participants) and the<br />
<strong>City</strong> <strong>of</strong> <strong>Cerritos</strong> (the Project “B” Participant).<br />
50
<strong>City</strong> <strong>of</strong> <strong>Cerritos</strong><br />
Notes to Basic <strong>Financial</strong> Statements, Continued<br />
For the year ended June 30, 2010<br />
7. CAPITAL ASSETS, Continued<br />
The Magnolia Power Project consists <strong>of</strong> a natural gas-fired generating facility with a nominally rated net<br />
base capacity <strong>of</strong> 242 Megawatts to be located on an existing generating site in the <strong>City</strong> <strong>of</strong> Burbank,<br />
California, including necessary and appurtenant facilities and equipment thereto, the applicable portion <strong>of</strong><br />
any common facilities and interconnection facilities. The Project was being constructed for the primary<br />
purpose <strong>of</strong> providing the participants in the Project with firm capacity and energy to help meet their power<br />
and energy requirements in 2005 and thereafter. Commercial operations commenced September, 2005. The<br />
<strong>City</strong> <strong>of</strong> <strong>Cerritos</strong> has entered into a “Take or Pay” contract with SCPPA and is obligated to pay their share <strong>of</strong><br />
the indebtedness regardless <strong>of</strong> the ability <strong>of</strong> the contracting agency to provide electricity. The <strong>City</strong>’s share <strong>of</strong><br />
these payments are reported as long-term debt (see Notes 9D and 9J). This contract provides for generating<br />
capacity <strong>of</strong> 4.2% <strong>of</strong> the output generated from the plant.<br />
8. DEFERRED/UNEARNED REVENUE<br />
At June 30, 2010, deferred/unearned revenue totaled $7,417,057 consisting <strong>of</strong> the following:<br />
Unearned Revenue:<br />
Facility booking rentals $ 42,605<br />
Advance Performing Arts Center ticket sales 2,181,231<br />
Total Unearned Revenue 2,223,836<br />
Deferred Revenue:<br />
Sales tax 1,060,950<br />
Workers' compensation claims receivable 298,382<br />
Performing Arts Center refund clearing 4,568<br />
Operating Grant - Public Works 197,732<br />
Capital Grant - Community and Safety Services 367,744<br />
Investment and rental income 868,339<br />
Loan assistance programs in Redevelopment Agency 2,395,506<br />
Total Deferred Revenue 5,193,221<br />
Total $ 7,417,057<br />
51
<strong>City</strong> <strong>of</strong> <strong>Cerritos</strong><br />
Notes to Basic <strong>Financial</strong> Statements, Continued<br />
For the year ended June 30, 2010<br />
9. LONG-TERM DEBT<br />
Following is a summary <strong>of</strong> long-term debt for governmental activities for the fiscal year ended June 30,<br />
2010:<br />
Classification<br />
Balance Balance Due Within Due In More<br />
July 1, 2009 Additions Deletions June 30, 2010 One Year Than One Year<br />
Los <strong>Cerritos</strong> Redevelopment<br />
Project Revenue Bonds:<br />
1993 Issue, Series B<br />
$17,525,000 $ 3,790,000 $ - $ (1,615,000) $ 2,175,000 $ 1,745,000 $ 430,000<br />
2002 Issue, Series A<br />
$31,550,000 29,590,000 - (465,000) 29,125,000 485,000 28,640,000<br />
2002 Issue, Series B<br />
$7,550,000 5,570,000 - (375,000) 5,195,000 385,000 4,810,000<br />
2003 Issue, Series 2003<br />
$3,526,250 3,328,125 - (60,000) 3,268,125 61,875 3,206,250<br />
Los Coyotes Redevelopment<br />
Project Revenue Bonds:<br />
1993 Issue, Series A<br />
$42,155,000 8,000,000 - - 8,000,000 - 8,000,000<br />
1993 Issue, Series B<br />
$63,765,000 41,885,000 - (2,835,000) 39,050,000 3,055,000 35,995,000<br />
1998 Issue, Series A<br />
$3,760,000 1,935,000 - (275,000) 1,660,000 290,000 1,370,000<br />
2002 Issue, Series A<br />
$64,710,000 59,200,000 - (1,245,000) 57,955,000 1,290,000 56,665,000<br />
2002 Issue, Series B<br />
$12,225,000 11,130,000 - (210,000) 10,920,000 215,000 10,705,000<br />
2003 Issue, Series 2003<br />
$10,578,750 9,984,375 - (180,000) 9,804,375 185,625 9,618,750<br />
Subtotal 174,412,500 - (7,260,000) 167,152,500 7,712,500 159,440,000<br />
Add (less) deferred amounts:<br />
Bond premium 4,600,474 - (306,699) 4,293,775 - 4,293,775<br />
Bond discount (924,520) - 61,635 (862,885) - (862,885)<br />
Deferred charge on refunding (1,984,981) - 141,785 (1,843,196) - (1,843,196)<br />
Total Revenue Bonds 176,103,473 - (7,363,279) 168,740,194 7,712,500 161,027,694<br />
Note payable 1,025,000 - - 1,025,000 - 1,025,000<br />
Compensated absences 2,497,348 1,698,653 (1,683,566) 2,512,435 628,000 1,884,435<br />
Net OPEB obligation - 2,015,775 - 2,015,775 - 2,015,775<br />
Claims payable - General Liability - 1,917,561 - 1,917,561 - 1,917,561<br />
Total long-term liabilities $ 179,625,821 $ 5,631,989 $ (9,046,845) $ 176,210,965 $ 8,340,500 $ 167,870,465<br />
52
<strong>City</strong> <strong>of</strong> <strong>Cerritos</strong><br />
Notes to Basic <strong>Financial</strong> Statements, Continued<br />
For the year ended June 30, 2010<br />
9. LONG-TERM DEBT, Continued<br />
Following is a summary <strong>of</strong> long-term debt for business-type activities for the fiscal year ended June 30,<br />
2010:<br />
Classification<br />
Balance Balance Due within Due in more<br />
July 1, 2009 Additions Deletions June 30, 2010 One Year than One Year<br />
Compensated absences - Water Fund $ - $ 257,937 $ - $ 257,937 $ 64,484 $ 193,453<br />
Total long-term liabilities $ - $ 257,937 $ - $ 257,937 $ 64,484 $ 193,453<br />
A. Los <strong>Cerritos</strong> Redevelopment Project 1993 Revenue Bonds, Series B<br />
In June, 1993, the <strong>Cerritos</strong> Public Financing Authority (the Authority) issued $17,525,000 in 1993 Revenue<br />
Bonds, Series B. $15,967,767 <strong>of</strong> the $17,525,000 issue was loaned to repay prior <strong>City</strong> loans to the Agency,<br />
$1,323,852 was used to fund a reserve fund for the loans to the Agency, and the remaining balance was used<br />
to pay the cost <strong>of</strong> issuance <strong>of</strong> the bonds. Interest rates on the bonds vary from 4.00% to 8.00% with interest<br />
payable semiannually on May 1 and November 1, and principal maturing annually on November 1.<br />
The 1993 Los <strong>Cerritos</strong> Redevelopment Project Revenue Bonds, Series B, are payable solely from and secured<br />
by tax increment revenues received by the Authority from the Agency. <strong>Annual</strong> principal and interest<br />
payments on the bonds are expected to require less than 25% <strong>of</strong> net revenues. The total remaining principal<br />
and interest to be paid on the bonds is $2,296,400. Principal and interest paid for the current year and total<br />
net revenues were $1,853,600 and $7,706,348, respectively.<br />
The annual requirements to amortize the outstanding bond indebtedness as <strong>of</strong> June 30, 2010, including<br />
interest, are as follows:<br />
Year Ending<br />
June 30, Principal Interest Total<br />
2011 $ 1,745,000 $ 104,200 $ 1,849,200<br />
2012 430,000 17,200 447,200<br />
TOTAL $ 2,175,000 $ 121,400 $ 2,296,400<br />
B. Los <strong>Cerritos</strong> Redevelopment Project 2002 Tax Allocation Revenue Bonds, Series A<br />
In June 1993, the Authority issued $27,555,000 in Revenue Bonds, Series A. In September 2002, the<br />
Authority issued $31,550,000 <strong>of</strong> Tax Allocation Bonds to provide funds to refund the 1993 Revenue Bonds,<br />
Series A. A portion <strong>of</strong> the proceeds from the Bonds issued in 2002 were placed in an escrow fund to provide<br />
the debt service on the 1993 Revenue Bonds, Series A. The advance refunding met the requirements <strong>of</strong> an<br />
in-substance defeasance and the bonds were removed from the Agency’s long-term debt.<br />
The 2002 bonds are broken into two segments; the Term Bonds $27,940,000 and the Special Escrow Bonds<br />
$3,610,000.<br />
53
<strong>City</strong> <strong>of</strong> <strong>Cerritos</strong><br />
Notes to Basic <strong>Financial</strong> Statements, Continued<br />
For the year ended June 30, 2010<br />
9. LONG-TERM DEBT, Continued<br />
B. Los <strong>Cerritos</strong> Redevelopment Project 2002 Tax Allocation Revenue Bonds, Series A, Continued<br />
The Term Bonds are payable in annual installments ranging from $260,000 to $3,240,000 until maturity on<br />
November 1, 2020. Interest is payable semiannually on May 1 and November 1, with rates ranging from<br />
2.00% to 5.00%. Bonds outstanding at June 30, 2010 were $26,270,000.<br />
The Special Escrow bonds are payable in annual installments ranging from $195,000 to $320,000 until<br />
maturity on November 1, 2020. Interest is payable semiannually on May 1 and November 1, with rates<br />
ranging from 3.40% to 4.55%. Bonds outstanding at June 30, 2010 were $2,855,000.<br />
The 2002 Los <strong>Cerritos</strong> Redevelopment Project Tax Allocation Revenue Bonds, Series A, are payable solely<br />
from and secured by tax increment revenues received by the Authority from the Agency. <strong>Annual</strong> principal<br />
and interest payments on the bonds are expected to require less than 25% <strong>of</strong> net revenues. The total<br />
remaining principal and interest to be paid on the bonds is $37,985,318. Principal and interest paid for the<br />
current year and total tax revenues were $1,800,390 and $7,706,348, respectively.<br />
Future debt service requirements on these bonds (term and special escrow) are as follows:<br />
Year Ending<br />
June 30, Principal Interest Total<br />
2011 $ 485,000 $ 1,318,475 $ 1,803,475<br />
2012 1,955,000 1,279,113 3,234,113<br />
2013 2,480,000 1,204,090 3,684,090<br />
2014 2,570,000 1,113,875 3,683,875<br />
2015 2,660,000 1,002,318 3,662,318<br />
2016-2020 15,415,000 2,854,567 18,269,567<br />
2021 3,560,000 87,880 3,647,880<br />
TOTAL $ 29,125,000 $ 8,860,318 $ 37,985,318<br />
C. Los <strong>Cerritos</strong> Redevelopment Project 2002 Tax Allocation Revenue Bonds, Series B<br />
In September 2002, the Authority issued $7,550,000 in 2002 Series B Tax Allocation Revenue Bonds. The<br />
proceeds were loaned to the Agency and were used to fund projects in the Los <strong>Cerritos</strong> Project Area and<br />
pay for the cost <strong>of</strong> issuance.<br />
The bonds are payable in annual installments ranging from $360,000 to $580,000 until maturity on<br />
November 1, 2020. Interest is payable semiannually on May 1 and November 1, with rates ranging from<br />
1.85% to 4.70%. Bonds outstanding at June 30, 2010 were $5,195,000.<br />
The 2002 Los <strong>Cerritos</strong> Redevelopment Project Tax Allocation Revenue Bonds, Series B, are payable solely<br />
from and secured by tax increment revenues received by the Authority from the Agency. <strong>Annual</strong> principal<br />
and interest payments on the bonds are expected to require less than 10% <strong>of</strong> net revenues. The total<br />
remaining principal and interest to be paid on the bonds is $6,627,624. Principal and interest paid for the<br />
current year and total tax revenues were $607,819 and $7,706,348, respectively.<br />
54
<strong>City</strong> <strong>of</strong> <strong>Cerritos</strong><br />
Notes to Basic <strong>Financial</strong> Statements, Continued<br />
For the year ended June 30, 2010<br />
9. LONG-TERM DEBT, Continued<br />
C. Los <strong>Cerritos</strong> Redevelopment Project 2002 Tax Allocation Revenue Bonds, Series B, Continued<br />
Future debt service requirements on these bonds are as follows:<br />
Year Ending<br />
June 30, Principal Interest Total<br />
2011 $ 385,000 $ 220,271 $ 605,271<br />
2012 400,000 206,430 606,430<br />
2013 415,000 191,449 606,449<br />
2014 430,000 175,068 605,068<br />
2015 445,000 157,345 602,345<br />
2016-2020 2,540,000 466,981 3,006,981<br />
2021 580,000 15,080 595,080<br />
TOTAL $ 5,195,000 $ 1,432,624 $ 6,627,624<br />
D. Los <strong>Cerritos</strong> and Los Coyotes Redevelopment Project - Magnolia Power Project B, Series 2003 Revenue<br />
Bonds<br />
The Southern California Public Power Authority (SCPPA) was created in 1980 under a joint exercise <strong>of</strong><br />
powers agreement. It was formed for the acquisition and construction <strong>of</strong> facilities to supply electric energy<br />
within the boundaries <strong>of</strong> its members. Complete financial statements for SCPPA may be obtained at their<br />
administrative <strong>of</strong>fice located at 225 S. Lake Avenue, Suite 1250, Pasadena, CA 91101.<br />
In 2001, SCPPA entered into an agreement with the <strong>City</strong> <strong>of</strong> Anaheim, the <strong>City</strong> <strong>of</strong> Burbank, the <strong>City</strong> <strong>of</strong><br />
<strong>Cerritos</strong>, the <strong>City</strong> <strong>of</strong> Colton, the <strong>City</strong> <strong>of</strong> Glendale, and the <strong>City</strong> <strong>of</strong> Pasadena to construct a generation facility<br />
with a capacity <strong>of</strong> 242 megawatts to be located on the existing Magnolia generating site in Burbank,<br />
California.<br />
SCPPA issued $14,105,000 <strong>of</strong> lease revenue bonds to finance a portion <strong>of</strong> the project costs for the facility that<br />
was collateralized by the parking structure at <strong>City</strong> Hall. The <strong>City</strong> has leased back the parking structure from<br />
SCPPA. SCPPA will provide for the payment <strong>of</strong> a portion <strong>of</strong> the costs <strong>of</strong> operation <strong>of</strong> the Project through the<br />
sale <strong>of</strong> a portion <strong>of</strong> the capacity and energy <strong>of</strong> the Project <strong>of</strong> the member cities pursuant to the Power Sales<br />
Agreement. On March 1, 2003, the <strong>City</strong> entered into this sales agreement with SCPPA, entitling the <strong>City</strong> to a<br />
4.2% share <strong>of</strong> the plant output.<br />
In June 2005, the Redevelopment Agency Debt Service Fund assumed the <strong>City</strong>’s debt related to the sales<br />
agreement with SCPPA. As the energy derived from the plant serves and benefits both the Los <strong>Cerritos</strong> and<br />
Los Coyotes Capital Project Areas, it was deemed appropriate that the Agency assume the debt. Debt<br />
assumed was allocated 25%, which is $3,526,250, to the Los <strong>Cerritos</strong> Project Area and 75%, which is<br />
$10,578,750, to the Los Coyotes Project Area. The <strong>City</strong> advances debt service payments to SCPPA and is<br />
subsequently reimbursed by the Redevelopment Agency immediately after the payment due dates.<br />
The payments are due in annual installments on January 1 and July 1 <strong>of</strong> each year. The first payment was<br />
made January 2006, and the final payment is due at maturity on July 1, 2036.<br />
55
<strong>City</strong> <strong>of</strong> <strong>Cerritos</strong><br />
Notes to Basic <strong>Financial</strong> Statements, Continued<br />
For the year ended June 30, 2010<br />
9. LONG-TERM DEBT, Continued<br />
D. Los <strong>Cerritos</strong> and Los Coyotes Redevelopment Project - Magnolia Power Project B, Series 2003 Revenue<br />
Bonds, Continued<br />
The debt service schedule for the Los Coyotes Project Area is at Note 9J.<br />
The Los <strong>Cerritos</strong> Project Area portion is payable solely from and secured by tax increment revenues<br />
received by the Authority from the Agency. <strong>Annual</strong> principal and interest payments on the bonds are<br />
expected to require less than 10% <strong>of</strong> net revenues. The total remaining principal and interest to be paid on<br />
the bonds is $6,061,506. Principal and interest paid for the current year and total tax revenues were $214,952<br />
and $7,706,348, respectively.<br />
Future debt service requirements on the bonds allocated to the Los <strong>Cerritos</strong> Project Area are as follows:<br />
Year Ending<br />
June 30, Principal Interest Total<br />
2011 $ 61,875 $ 153,226 $ 215,101<br />
2012 63,750 151,291 215,041<br />
2013 65,625 149,138 214,763<br />
2014 67,500 146,800 214,300<br />
2015 70,000 144,310 214,310<br />
2016-2020 395,625 677,620 1,073,245<br />
2021-2025 488,125 585,184 1,073,309<br />
2026-2030 618,125 455,125 1,073,250<br />
2031-2035 788,750 284,250 1,073,000<br />
2036-2037 648,750 46,437 695,187<br />
TOTAL $ 3,268,125 $ 2,793,381 $ 6,061,506<br />
E. Los Coyotes Redevelopment Project 1993 Revenue Bonds, Series A<br />
In June 1993, the Authority issued $42,155,000 in 1993 Revenue Bonds, Series A. $2,594,959 <strong>of</strong> the<br />
$42,155,000 issue was loaned to the Agency to advance refund the $7,500,000 Los Coyotes Redevelopment<br />
Project Tax Allocation Bonds, Series A originally issued by the Agency in 1976, $6,780,483 was loaned to the<br />
Agency to advance refund the $15,000,000 Los Coyotes Redevelopment Project Tax Allocation Bonds, Series<br />
B originally issued by the Agency in 1977, $19,669,546 was loaned to repay prior <strong>City</strong> loans to the Agency,<br />
$9,000,000 was loaned to fund additional projects in the Los Coyotes Project Area, $3,206,533 was used to<br />
fund a reserve fund for the loans to the Agency, and the remaining balance was used to pay the cost <strong>of</strong><br />
issuance <strong>of</strong> the bonds. Interest rates on the bonds vary from 2.50% to 6.50% with interest payable<br />
semiannually on May 1 and November 1, and principal maturing annually on November 1 except for the<br />
years 2002 through 2018 in which no principal payments mature.<br />
56
<strong>City</strong> <strong>of</strong> <strong>Cerritos</strong><br />
Notes to Basic <strong>Financial</strong> Statements, Continued<br />
For the year ended June 30, 2010<br />
9. LONG-TERM DEBT, Continued<br />
E. Los Coyotes Redevelopment Project 1993 Revenue Bonds, Series A, Continued<br />
In September 2002, the Authority issued 2002 Tax Allocation Bonds, Series A to provide funds to partially<br />
refund the 1993 Revenue Bonds ($24,510,000), Series A. A portion <strong>of</strong> the proceeds from the Bonds issued in<br />
2002 were placed in an escrow fund to provide the debt service on the 1993 Revenue Bonds, Series A. The<br />
advance refunding met the requirements <strong>of</strong> an in-substance defeasance and the bonds were removed from<br />
the Agency’s long-term debt. The principal balance on the 1993 Revenue Bonds, Series A at June 30, 2003<br />
that was paid by the trustee from the escrow fund was $24,510,000, and the balance remaining in the<br />
Agency’s long-term debt is $8,000,000.<br />
The 1993 Los Coyotes Redevelopment Project Revenue Bonds, Series A, are payable solely from and<br />
secured by tax increment revenues received by the Authority from the Agency. <strong>Annual</strong> principal and<br />
interest payments on the bonds are expected to require less than 10% <strong>of</strong> net revenues. The total remaining<br />
principal and interest to be paid on the bonds is $14,989,775. Principal and interest paid for the current year<br />
and total tax revenues were $520,000 and $18,009,418, respectively.<br />
Future debt service requirements on these bonds are as follows:<br />
Year Ending<br />
June 30, Principal Interest Total<br />
2011 $ - $ 520,000 $ 520,000<br />
2012 - 520,000 520,000<br />
2013 - 520,000 520,000<br />
2014 - 520,000 520,000<br />
2015 - 520,000 520,000<br />
2016-2020 - 2,600,000 2,600,000<br />
2021-2024 8,000,000 1,789,775 9,789,775<br />
TOTAL $8,000,000 $ 6,989,775 $ 14,989,775<br />
F. Los Coyotes Redevelopment Project 1993 Revenue Bonds, Series B<br />
In June 1993, the Authority issued $63,765,000 in 1993 Revenue Bonds, Series B. $57,938,653 <strong>of</strong> the<br />
$63,765,000 issue was loaned to repay prior <strong>City</strong> loans to the Agency, $4,850,304 was used to fund a reserve<br />
fund for the loans to the Agency, and the remaining balance was used to pay the cost <strong>of</strong> issuance <strong>of</strong> the<br />
bonds. Interest rates on the bonds vary from 3.50% to 7.80% with interest payable semiannually on May 1<br />
and November 1, and principal maturing annually on November 1.<br />
The 1993 Los Coyotes Redevelopment Project Revenue Bonds, Series B, are payable solely from and secured<br />
by tax increment revenues received by the Authority from the Agency. <strong>Annual</strong> principal and interest<br />
payments on the bonds are expected to require less than 35% <strong>of</strong> net revenues. The total remaining principal<br />
and interest to be paid on the bonds is $54,640,621. Principal and interest paid for the current year and total<br />
tax revenues were $5,983,891 and $18,009,418, respectively.<br />
57
<strong>City</strong> <strong>of</strong> <strong>Cerritos</strong><br />
Notes to Basic <strong>Financial</strong> Statements, Continued<br />
For the year ended June 30, 2010<br />
9. LONG-TERM DEBT, Continued<br />
F. Los Coyotes Redevelopment Project 1993 Revenue Bonds, Series B, Continued<br />
Future debt service requirements on these bonds are as follows:<br />
Year Ending<br />
June 30, Principal Interest Total<br />
2011 $ 3,055,000 $ 2,920,653 $ 5,975,653<br />
2012 3,295,000 2,674,594 5,969,594<br />
2013 3,550,000 2,409,350 5,959,350<br />
2014 3,825,000 2,123,569 5,948,569<br />
2015 4,120,000 1,814,670 5,934,670<br />
2016-2020 21,205,000 3,697,785 24,902,785<br />
TOTAL $ 39,050,000 $ 15,640,621 $ 54,690,621<br />
G. Los Coyotes Redevelopment Project 1998 Tax Allocation Bonds, Series A<br />
In January 2001, the Los Coyotes Redevelopment Project issued $3,760,000 in 1998 Tax Allocation Bonds,<br />
Series A. The proceeds were used in the construction <strong>of</strong> a shared parking structure, which serves both the<br />
retail complex and tenants within an adjacent <strong>of</strong>fice building. The <strong>City</strong> will retain parking rights to the<br />
structure. The interest rate on the bonds is 6.5% with principal and interest payable annually on May 1.<br />
The 1998 Los Coyotes Redevelopment Project Tax Allocation Revenue Bonds, Series A, are payable solely<br />
from and secured by tax increment revenues received by the Authority from the Agency. <strong>Annual</strong> principal<br />
and interest payments on the bonds are expected to require less than 10% <strong>of</strong> net revenues. The total<br />
remaining principal and interest to be paid on the bonds is $1,997,675. Principal and interest paid for the<br />
current year and total tax revenues were $400,775 and $18,009,418, respectively.<br />
The annual requirements to amortize the outstanding bond indebtedness as <strong>of</strong> June 30, 2010 including<br />
interest, are as follows:<br />
Year Ending<br />
June 30, Principal Interest Total<br />
2011 $ 290,000 $ 107,900 $ 397,900<br />
2012 310,000 89,050 399,050<br />
2013 330,000 68,900 398,900<br />
2014 355,000 47,450 402,450<br />
2015 375,000 24,375 399,375<br />
TOTAL $ 1,660,000 $ 337,675 $ 1,997,675<br />
58
<strong>City</strong> <strong>of</strong> <strong>Cerritos</strong><br />
Notes to Basic <strong>Financial</strong> Statements, Continued<br />
For the year ended June 30, 2010<br />
9. LONG-TERM DEBT, Continued<br />
H. Los Coyotes Redevelopment Project 2002 Tax Allocation Revenue Bonds, Series A<br />
In June 1993, the Authority issued $42,155,000 in Revenue Bonds, Series A. In September 2002, the<br />
Authority issued $64,710,000 <strong>of</strong> Tax Allocation Bonds to provide funds to refund $24,510,000 <strong>of</strong> the<br />
remaining $32,510,000 the 1993 Revenue Bonds, Series A. A portion <strong>of</strong> the proceeds from the Bonds issued<br />
in 2002 were placed in an escrow fund to provide the debt service on the 1993 Revenue Bonds, Series A. The<br />
advance refunding met the requirements <strong>of</strong> an in-substance defeasance and the bonds were removed from<br />
the Agency’s long-term debt. The principal balance on the 1993 Revenue Bonds, Series A, at June 30, 2003<br />
that was paid by the trustee from the escrow fund was $24,510,000. The balance remaining in the Agency’s<br />
long-term debt as <strong>of</strong> June 30, 2010 is $8,000,000 (see Note 9E).<br />
The bonds were broken into two segments; the Term Bonds $53,675,000 and the Special Escrow Bonds<br />
$11,035,000.<br />
The Term Bonds are payable in annual installments ranging from $775,000 to $9,345,000 until maturity on<br />
November 1, 2024. Interest is payable semiannually on May 1 and November 1, with rates ranging from<br />
2.00% to 5.00%. Bonds outstanding at June 30, 2010 were $48,630,000.<br />
The Special Escrow bonds are payable in annual installments ranging from $435,000 to $830,000 until<br />
maturity on November 1, 2024. Interest is payable semiannually on May 1 and November 1, with rates<br />
ranging from 3.40% to 4.55%. Bonds outstanding at June 30, 2010 were $9,325,000.<br />
The 2002 Los Coyotes Redevelopment Project Tax Allocation Revenue Bonds, Series A, are payable solely<br />
from and secured by tax increment revenues received by the Authority from the Agency. <strong>Annual</strong> principal<br />
and interest payments on the bonds are expected to require less than 25% <strong>of</strong> net revenues. The total<br />
remaining principal and interest to be paid on the bonds is $87,323,813. Principal and interest paid for the<br />
current year and total tax revenues were $4,037,770 and $18,009,418, respectively.<br />
Future debt service requirements on these bonds (term and special escrow) are as follows:<br />
Year Ending<br />
June 30, Principal Interest Total<br />
2011 $ 1,290,000 $ 2,752,925 $ 4,042,925<br />
2012 1,325,000 2,711,810 4,036,810<br />
2013 1,370,000 2,667,248 4,037,248<br />
2014 1,420,000 2,618,928 4,038,928<br />
2015 1,460,000 2,559,016 4,019,016<br />
2016-2020 13,225,000 11,513,348 24,738,348<br />
2021-2025 37,865,000 4,545,538 42,410,538<br />
TOTAL $ 57,955,000 $ 29,368,813 $ 87,323,813<br />
59
<strong>City</strong> <strong>of</strong> <strong>Cerritos</strong><br />
Notes to Basic <strong>Financial</strong> Statements, Continued<br />
For the year ended June 30, 2010<br />
9. LONG-TERM DEBT, Continued<br />
I. Los Coyotes Redevelopment Project 2002 Tax Allocation Revenue Bonds, Series B<br />
In September 2002, the Authority issued $12,225,000 in 2002 Series B Tax Allocation Revenue Bonds. The<br />
proceeds were loaned to the Agency and will be used to fund projects in the Los Coyotes Project Area and<br />
to pay for the cost <strong>of</strong> issuance.<br />
The bonds are payable in annual installments ranging from $210,000 to $1,270,000 until maturity on<br />
November 1, 2024. Interest is payable semiannually on May 1 and November 1, with rates ranging from<br />
1.85% to 4.70%. Bonds outstanding at June 30, 2010 were $10,920,000.<br />
The 2002 Los Coyotes Redevelopment Project Tax Allocation Revenue Bonds, Series B, are payable solely<br />
from and secured by tax increment revenues received by the Authority from the Agency. <strong>Annual</strong> principal<br />
and interest payments on the bonds are expected to require less than 10% <strong>of</strong> net revenues. The total<br />
remaining principal and interest to be paid on the bonds is $16,298,146. Principal and interest paid for the<br />
current year and total tax revenues were $744,670 and $18,009,418, respectively.<br />
Future debt service requirements on these bonds are as follows:<br />
Year Ending<br />
June 30, Principal Interest Total<br />
2011 $ 215,000 $ 527,654 $ 742,654<br />
2012 235,000 519,715 754,715<br />
2013 240,000 510,985 750,985<br />
2014 250,000 501,485 751,485<br />
2015 260,000 491,155 751,155<br />
2016-2020 3,965,000 2,048,322 6,013,322<br />
2021-2025 5,755,000 778,830 6,533,830<br />
TOTAL $ 10,920,000 $ 5,378,146 $ 16,298,146<br />
J. Los <strong>Cerritos</strong> and Los Coyotes Redevelopment Project - Magnolia Power Project B, Series 2003 Revenue<br />
Bonds<br />
The Southern California Public Power Authority (SCPPA) was created in 1980 under a joint exercise <strong>of</strong><br />
powers agreement. It was formed for the acquisition and construction <strong>of</strong> facilities to supply electric energy<br />
to the inhabitants within the boundaries <strong>of</strong> its members. Complete financial statements for SCPPA may be<br />
obtained at their administrative <strong>of</strong>fice located at 225 S. Lake Avenue, Suite 1250, Pasadena, CA 91101.<br />
In 2001, SCPPA entered into an agreement with the <strong>City</strong> <strong>of</strong> Anaheim, the <strong>City</strong> <strong>of</strong> Burbank, the <strong>City</strong> <strong>of</strong><br />
<strong>Cerritos</strong>, the <strong>City</strong> <strong>of</strong> Colton, the <strong>City</strong> <strong>of</strong> Glendale, and the <strong>City</strong> <strong>of</strong> Pasadena to construct a generation facility<br />
with a capacity <strong>of</strong> 242 megawatts to be located on the existing Magnolia generating site in Burbank,<br />
California.<br />
60
<strong>City</strong> <strong>of</strong> <strong>Cerritos</strong><br />
Notes to Basic <strong>Financial</strong> Statements, Continued<br />
For the year ended June 30, 2010<br />
9. LONG-TERM DEBT, Continued<br />
J. Los <strong>Cerritos</strong> and Los Coyotes Redevelopment Project - Magnolia Power Project B, Series 2003 Revenue<br />
Bonds, Continued<br />
SCPPA issued $14,105,000 <strong>of</strong> lease revenue bonds to finance a portion <strong>of</strong> the project costs for the facility that<br />
was collateralized by the parking structure at <strong>City</strong> Hall. The <strong>City</strong> has leased back the parking structure from<br />
SCPPA. SCPPA will provide for the payment <strong>of</strong> a portion <strong>of</strong> the costs <strong>of</strong> operation <strong>of</strong> the Project through the<br />
sale <strong>of</strong> a portion <strong>of</strong> the capacity and energy <strong>of</strong> the Project <strong>of</strong> the member cities pursuant to the Power Sales<br />
Agreement. On March 1, 2003, the <strong>City</strong> entered into this sales agreement with SCPPA, entitling the <strong>City</strong> to a<br />
4.2% share <strong>of</strong> the plant output.<br />
In June 2005, the Redevelopment Agency Debt Service Fund assumed the <strong>City</strong>’s debt related to the sales<br />
agreement with SCPPA. As the energy derived from the plant serves and benefits both the Los <strong>Cerritos</strong> and<br />
Los Coyotes Capital Project Areas, it was deemed appropriate that the Agency assume the debt. Debt<br />
assumed was allocated 25%, which is $3,526,250, to the Los <strong>Cerritos</strong> Project Area and 75%, which is<br />
$10,578,750, to the Los Coyotes Project Area. The <strong>City</strong> advances debt service payments to SCPPA and is<br />
subsequently reimbursed by the Redevelopment Agency immediately after the payment due dates.<br />
The payments are due in annual installments on January 1 and July 1 <strong>of</strong> each year. The first payment was<br />
made January 2006, and the final payment is due at maturity on July 1, 2036.<br />
The debt service schedule for the Los <strong>Cerritos</strong> Project Area is at Note 9D.<br />
The Los Coyotes Project Area portion is payable solely from and secured by tax increment revenues<br />
received by the Authority from the Agency. <strong>Annual</strong> principal and interest payments on the bonds are<br />
expected to require less than 10% <strong>of</strong> net revenues. The total remaining principal and interest to be paid on<br />
the bonds is $18,184,520. Principal and interest paid for the current year and total tax revenues were<br />
$644,857 and $18,009,418, respectively.<br />
Future debt service requirements on the bonds allocated to the Los Coyotes Project Area are as follows:<br />
Year Ending<br />
June 30, Principal Interest Total<br />
2011 $ 185,625 $ 459,677 $ 645,302<br />
2012 191,250 453,874 645,124<br />
2013 196,875 447,414 644,289<br />
2014 202,500 440,400 642,900<br />
2015 210,000 432,930 642,930<br />
2016-2020 1,186,875 2,032,862 3,219,737<br />
2021-2025 1,464,375 1,755,551 3,219,926<br />
2026-2030 1,854,375 1,365,375 3,219,750<br />
2031-2035 2,366,250 852,750 3,219,000<br />
2036-2037 1,946,250 139,312 2,085,562<br />
TOTAL $ 9,804,375 $ 8,380,145 $ 18,184,520<br />
61
<strong>City</strong> <strong>of</strong> <strong>Cerritos</strong><br />
Notes to Basic <strong>Financial</strong> Statements, Continued<br />
For the year ended June 30, 2010<br />
9. LONG-TERM DEBT, Continued<br />
K. Los <strong>Cerritos</strong> Redevelopment Project - Note Payable<br />
In September 2005, the Agency entered into an agreement to purchase land owned by Southeast Regional<br />
Occupational Program within the Los <strong>Cerritos</strong> Capital Project Area for $1,205,662.<br />
In connection with the purchase, the Agency provided a note payable in the amount <strong>of</strong> $1,025,000. Interest<br />
will be charged annually at the rate equal to the annual average <strong>of</strong> the <strong>City</strong>’s investment fund return,<br />
excluding interest on outstanding loans provided by the <strong>City</strong> to the Agency and the Electric Utility<br />
Enterprise Fund. Since the future interest rate is not known, the interest portion <strong>of</strong> future debt service is not<br />
presented in the table below.<br />
Interest only payments are due on each anniversary date through 2010. Then annual principal and interest<br />
payments will be due through the maturity date, September 26, 2015, with principal in the amount <strong>of</strong><br />
$200,000 per year on the sixth through ninth year anniversary dates and $225,000 on the maturity date.<br />
Future debt service requirements on this note are as follows:<br />
Year Ending<br />
June 30,<br />
Principal<br />
2011 $<br />
-<br />
2012 200,000<br />
2013 200,000<br />
2014 200,000<br />
2015 200,000<br />
2016 225,000<br />
TOTAL $ 1,025,000<br />
L. Compensated Absences<br />
This liability represents the total unpaid vacation and compensatory time earned by employees <strong>of</strong> the <strong>City</strong>.<br />
Since this amount is paid to the employee upon termination <strong>of</strong> employment, there is no fixed payment<br />
schedule for earned but unpaid compensated absences. The compensated absences are predominately<br />
associated with the General Fund and Water Fund.<br />
M. Net OPEB Obligation<br />
The amount <strong>of</strong> net other post-employment benefits obligation at June 30, 2010 was $2,015,775. See Note 11B<br />
for details.<br />
N. Claims Payable – General Liability<br />
The amount <strong>of</strong> claims and judgments payable at June 30, 2010 was $1,917,561. See Note 12E for details.<br />
62
<strong>City</strong> <strong>of</strong> <strong>Cerritos</strong><br />
Notes to Basic <strong>Financial</strong> Statements, Continued<br />
For the year ended June 30, 2010<br />
10. RESERVES AND DESIGNATIONS OF FUND BALANCES<br />
The <strong>City</strong> establishes “reserves” <strong>of</strong> fund balances to segregate fund balances which are not available for<br />
appropriation in future periods, or which are legally set aside for a specific future use. Fund “designations”<br />
also may be established to indicate tentative plans for financial resource utilization in a future period.<br />
The <strong>City</strong>’s reserves and designations at June 30, 2010 are tabulated below by fund types, followed by<br />
explanations as to the nature and purpose <strong>of</strong> each reserve and designation.<br />
Reserves:<br />
Redevelopment Other<br />
Agency Governmental<br />
General Capital Projects Funds Totals<br />
Inventories $ 23,883 $ - $ - $ 23,883<br />
Long term receivable 101,784,752 - - 101,784,752<br />
Deposits 814,315 - - 814,315<br />
Land held for resale or lease - 1,953,330 - 1,953,330<br />
Total Reserves $ 102,622,950 $ 1,953,330 $ - $ 104,576,280<br />
Designations:<br />
Asset replacement $ 700,000 $ - $ - $ 700,000<br />
Arts Center Programs 9,959,056 - - 9,959,056<br />
Self Insurance 1,000,000 - - 1,000,000<br />
Special Revenue Purposes - - 6,275,361 6,275,361<br />
Capital Projects Purposes - 23,321,867 971 23,322,838<br />
Total Designations $ 11,659,056 $ 23,321,867 $ 6,276,332 $ 41,257,255<br />
Descriptions <strong>of</strong> Reserves and Designations:<br />
a. Reserved for Inventories:<br />
This reserve was established because inventories were not converted into cash or liquid assets after<br />
year end and not available to meet current expenditures.<br />
b. Reserved for Long Term Receivables:<br />
This reserve was established because certain receivables are not expected to be collected soon<br />
enough to be available to meet current expenditures.<br />
c. Reserved for Deposits and Land Held for Resale or Lease:<br />
These reserves were established because the related land and deposits were not converted into cash<br />
or other liquid assets after year end so that they could be considered available to meet current<br />
expenditures.<br />
d. Designated for Asset Replacement:<br />
This designation has been established primarily for replacement <strong>of</strong> equipment and capital assets.<br />
e. Designated for Arts Center Programs:<br />
This designation has been established for future operation <strong>of</strong> the Arts Center.<br />
63
<strong>City</strong> <strong>of</strong> <strong>Cerritos</strong><br />
Notes to Basic <strong>Financial</strong> Statements, Continued<br />
For the year ended June 30, 2010<br />
10. RESERVES AND DESIGNATIONS OF FUND BALANCES, Continued<br />
f. Designated for Self Insurance:<br />
This designation has been established to provide for the general liability and workers’ compensation<br />
insurance programs. The <strong>City</strong> is a member <strong>of</strong> the California Joint Powers Insurance Authority as<br />
described in Note 12.<br />
g. Designated for Special Revenue Purposes:<br />
These funds are designated to provide for the specific special revenue purposes as restricted by law<br />
or administrative action.<br />
h. Designated for Capital Projects Purposes:<br />
These funds are designated to provide for the capital expenditure within the Redevelopment<br />
Agency Capital Projects Fund.<br />
11. RETIREMENT PLAN<br />
A. Defined Benefit Pension Plan<br />
Plan Description<br />
The <strong>City</strong>’s defined benefit pension plan, the Miscellaneous Plan for the <strong>City</strong> <strong>of</strong> <strong>Cerritos</strong> (Plan), provides<br />
retirement and disability benefits, annual cost-<strong>of</strong>-living adjustments, and death benefits to plan members<br />
and beneficiaries. The Plan is part <strong>of</strong> the Public Agency portion <strong>of</strong> the California Public Employees’<br />
Retirement System (CalPERS), an agent multiple-employer plan administered by CalPERS, which acts as a<br />
common investment and administrative agent for participating public entities within the State <strong>of</strong><br />
California. A menu <strong>of</strong> benefit provisions as well as other requirements are established by the State statutes<br />
within the Public Employees’ Retirement Law. The <strong>City</strong> selects optional benefit provisions from the benefit<br />
menu by contract with CalPERS and adopts those benefits through local ordinance. CalPERS issues a<br />
separate comprehensive annual financial report. Copies <strong>of</strong> CalPERS’ annual financial report may be<br />
obtained from the CalPERS Executive Office, 400 P Street, Sacramento, CA 95814.<br />
Funding Policy<br />
Participants are required to contribute 8% <strong>of</strong> their annual covered salary. The <strong>City</strong> makes the contributions<br />
required <strong>of</strong> <strong>City</strong> employees on their behalf and for their account. The <strong>City</strong> is required to contribute the<br />
actuarially determined remaining amounts necessary to fund the benefits for its members. The actuarial<br />
methods and assumptions used are those adopted by the CalPERS Board <strong>of</strong> Administration. The <strong>City</strong>’s<br />
required employer contribution rate for fiscal year 2009-10 was 16.791%. The contribution requirements <strong>of</strong><br />
the plan members are established by State statute and the employer contribution rate is established and<br />
may be amended by CalPERS.<br />
64
<strong>City</strong> <strong>of</strong> <strong>Cerritos</strong><br />
Notes to Basic <strong>Financial</strong> Statements, Continued<br />
For the year ended June 30, 2010<br />
11. RETIREMENT PLAN, Continued<br />
A. Defined Benefit Pension Plan, Continued<br />
<strong>Annual</strong> Pension Cost<br />
For fiscal year 2009-10 the <strong>City</strong>’s actual and contributed annual pension cost was $1,693,293. The required<br />
contribution for fiscal year 2009-10 was determined as part <strong>of</strong> an amended contract between the <strong>City</strong> <strong>of</strong><br />
<strong>Cerritos</strong> and CalPERS which became effective September 23, 2004, which included an actuarial valuation<br />
using the entry age normal actuarial cost method with the contributions determined as a percentage <strong>of</strong> pay.<br />
The actuarial assumptions included (a) 7.75% investment rate <strong>of</strong> return (net <strong>of</strong> administrative expenses); (b)<br />
projected salary increases that vary by duration <strong>of</strong> service and (c) a 2% cost-<strong>of</strong>-living adjustment. Both (a)<br />
and (b) include an inflation component <strong>of</strong> 3.0%. The actuarial value <strong>of</strong> the Plan’s assets were determined<br />
using a technique that smoothes the effect <strong>of</strong> short-term volatility in the market value <strong>of</strong> investments over a<br />
two to five year period depending on the size <strong>of</strong> investment gains and/or losses. The Plan’s unfunded<br />
actuarial excess assets are being amortized as a level <strong>of</strong> percentage <strong>of</strong> projected payroll on a closed basis.<br />
The remaining amortization period at June 30, 2010 was 27 years.<br />
The following is the three-year trend information:<br />
Three-Year Trend Information for PERS<br />
Fiscal Year <strong>Annual</strong> Pension Percentage <strong>of</strong> Net Pension<br />
Ending Cost (APC) APC Contributed Obligation<br />
6/30/2008 $ 1,672,759<br />
100% $<br />
-<br />
6/30/2009 1,731,902 100% -<br />
6/30/2010 1,693,293 100% -<br />
Funding Status and Funding Progress<br />
As <strong>of</strong> June 30, 2009, the most recent actuarial valuation date, the plan was 79.2% funded. The actuarial<br />
accrued liability for benefits was $147.0 million, and the actuarial value <strong>of</strong> assets was $116.5 million,<br />
resulting in an unfunded actuarial accrued liability (UAAL) <strong>of</strong> $30.5 million. The covered payroll (annual<br />
payroll for active employees covered by the plan) was $19.4 million, and the ratio <strong>of</strong> the UAAL to the<br />
covered payroll was 157.4%.<br />
The schedule <strong>of</strong> funding progress presented below, presents the multiyear trend information about whether<br />
the actuarial value <strong>of</strong> plan assets is increasing or decreasing over time relative to the actuarial accrued<br />
liability for benefits.<br />
Schedule <strong>of</strong> Funding Progress for PERS ($ Amount in Thousands)<br />
Valuation Entry Age Normal Actuarial Value Unfunded/Liability Funded <strong>Annual</strong> Covered UAAL as a %<br />
Date Accrued Liability <strong>of</strong> Assets (Excess Assets) Status Covered Payroll <strong>of</strong> Payroll<br />
6/30/2007 $ 121,881 $ 100,469 $ 21,412 82.43% $ 19,220 111.40%<br />
6/30/2008 132,565 109,425 23,140 82.54% 19,718 117.35%<br />
6/30/2009 146,971 116,451 30,520 79.23% 19,394 157.37%<br />
65
<strong>City</strong> <strong>of</strong> <strong>Cerritos</strong><br />
Notes to Basic <strong>Financial</strong> Statements, Continued<br />
For the year ended June 30, 2010<br />
11. RETIREMENT PLAN, Continued<br />
B. Post-Retirement Health Care Benefits<br />
Plan Description<br />
In addition to the pension benefits described in Note 11, the <strong>City</strong> provides other post-employment benefits<br />
(OPEB) through the California Employer’s Retiree Benefit Trust Fund (CERBT), an agent multiple-employer<br />
defined benefit healthcare plan administered by the California Public Employees’ Retirement System<br />
(CalPERS), by contributing a predetermined monthly maximum <strong>of</strong> $798.15 for each eligible retiree and<br />
spouse toward health insurance. These benefits are provided per contract between the <strong>City</strong> and the <strong>City</strong>’s<br />
management, pr<strong>of</strong>essional and general employees. Health insurance premiums for the <strong>City</strong> Manager, <strong>City</strong><br />
Attorney and <strong>City</strong> Council are fully covered per Council decision. As <strong>of</strong> June 30, 2010, there were 221<br />
participants receiving these healthcare benefits. Separate financial statements for the CERBT may be<br />
obtained by writing to CalPERS at Lincoln Plaza North 400 Q Street, Sacramento, CA 95814, or by visiting<br />
the CalPERS website at www.calpers.ca.gov.<br />
Funding Policy<br />
The contribution requirements <strong>of</strong> plan members and the <strong>City</strong> are established and may be amended by the<br />
<strong>City</strong>, <strong>City</strong> Council, and/or the employee associations. Currently, contributions are not required from plan<br />
members. On November 19, 2007, the <strong>City</strong> entered into an agreement with CalPERS to create an irrevocable<br />
trust. The assets, all property and rights purchased with such amounts, and all income attributable to such<br />
amounts, property or rights are held in the trust for the exclusive benefit <strong>of</strong> the participants and their<br />
beneficiaries. These assets are no longer the property <strong>of</strong> the <strong>City</strong>, and as such, are no longer subject to the<br />
claims <strong>of</strong> the <strong>City</strong>’s general creditors. A one-time employer contribution <strong>of</strong> $14 million was made on<br />
December 28, 2007, and was included in the January 1, 2009 actuarial study. During the fiscal year ended<br />
June 30, 2010, the <strong>City</strong> did not contribute to the plan. The purpose <strong>of</strong> these contributions is to cover the<br />
annual required contribution (ARC) and to prefund benefits.<br />
As a result, the <strong>City</strong> calculated a Net OPEB Obligation <strong>of</strong> $2,015,775, representing the difference between<br />
the ARC and actual contributions, as presented below:<br />
<strong>Annual</strong> Required Contribution (ARC) $ 2,015,775<br />
Adjustment to ARC -<br />
<strong>Annual</strong> OPEB Cost 2,015,775<br />
Contribution made -<br />
Increase (decrease) in Net OPEB Obligation 2,015,775<br />
Net OPEB Obligation - beginning <strong>of</strong> year -<br />
Net OPEB Obligation - end <strong>of</strong> year $ 2,015,775<br />
The interest charges are based on an expected rate <strong>of</strong> return <strong>of</strong> 7.75% and the ARC <strong>of</strong> $2,015,775, an amount<br />
actuarially determined in accordance with the parameters <strong>of</strong> GASB Statement No. 45. The ARC represents<br />
a level <strong>of</strong> funding that, if paid on an ongoing basis is projected to cover the annual normal cost and the<br />
amortization <strong>of</strong> unfunded actuarial accrued liabilities (or funding excess) over a thirty year period.<br />
66
<strong>City</strong> <strong>of</strong> <strong>Cerritos</strong><br />
Notes to Basic <strong>Financial</strong> Statements, Continued<br />
For the year ended June 30, 2010<br />
11. RETIREMENT PLAN, Continued<br />
B. Post-Retirement Health Care Benefits, Continued<br />
<strong>Annual</strong> OPEB Cost and Net OPEB Obligation (Asset)<br />
For fiscal year 2009-10, the <strong>City</strong>’s annual OPEB cost (expense) <strong>of</strong> $2,015,775 was equal to the ARC. This<br />
represents the ARC based on the actuarial report. Information on the annual OPEB cost, percentage <strong>of</strong><br />
<strong>Annual</strong> OPEB Cost contributed, and Net OPEB Obligation for the 2009-10 fiscal year and preceding years<br />
are presented below:<br />
Fiscal Actual Percentage <strong>of</strong> Net OPEB<br />
Year <strong>Annual</strong> Contribution <strong>Annual</strong> OPEB Obligation<br />
Ended OPEB Cost (Net <strong>of</strong> Adjustments) Cost Contributed (Asset)<br />
6/30/2008 $ 2,686,877 $ 16,686,877 621% $ (14,000,000)<br />
6/30/2009 1,994,070 1,994,070 100% -<br />
6/30/2010 2,015,775 - 0% 2,015,775<br />
Funded Status and Funding Progress<br />
The funded status <strong>of</strong> the plan as <strong>of</strong> January 1, 2009 is as follows:<br />
Schedule <strong>of</strong> Funding Progress for OPEB ($ Amount in Thousands)<br />
Valuation Entry Age Normal Actuarial Value Unfunded/Liability Funded <strong>Annual</strong> Covered UAAL as a %<br />
Date Accrued Liability <strong>of</strong> Assets (Excess Assets) Status Covered Payroll <strong>of</strong> Payroll<br />
1/1/2007 $ 25,769 $ - $ 25,769 0.00% $ 19,306 133.48%<br />
1/1/2009 27,855 11,825 16,030 42.45% 21,648 74.05%<br />
Actuarial valuations <strong>of</strong> an ongoing plan involve estimates <strong>of</strong> the value <strong>of</strong> reported amounts and<br />
assumptions about the probability <strong>of</strong> occurrence <strong>of</strong> events far into the future. Examples include<br />
assumptions about future employment, mortality, and the healthcare cost trend. Amounts determined<br />
regarding the funded status <strong>of</strong> the plan and the annual required contributions <strong>of</strong> the <strong>City</strong> are subject to<br />
continual revision as actual results are compared with past expectations and new estimates are made about<br />
the future. The schedule <strong>of</strong> funding progress is presented as required supplementary information<br />
following the notes to the financial statements.<br />
67
<strong>City</strong> <strong>of</strong> <strong>Cerritos</strong><br />
Notes to Basic <strong>Financial</strong> Statements, Continued<br />
For the year ended June 30, 2010<br />
11. RETIREMENT PLAN, Continued<br />
B. Post-Retirement Health Care Benefits, Continued<br />
Actuarial Methods and Assumptions<br />
Projections <strong>of</strong> benefits for financial reporting purposes are based on the substantive plan and include the<br />
types <strong>of</strong> benefits provided at the time <strong>of</strong> each valuation. The actuarial methods and assumptions used<br />
include techniques that are designed to reduce the effects <strong>of</strong> short-term volatility in actuarial accrued<br />
liabilities and the actuarial value <strong>of</strong> assets, consistent with the long-term perspective <strong>of</strong> the calculations.<br />
In the January 1, 2009, actuarial valuation, the entry age normal actuarial cost method was used. The<br />
actuarial assumptions included a 7.75 percent investment rate <strong>of</strong> return (net <strong>of</strong> administrative expenses)<br />
and an initial annual healthcare cost trend rate <strong>of</strong> 10 percent, reduced by decrements to an ultimate rate <strong>of</strong><br />
7.5% after five years. A 3.25 percent annual rate <strong>of</strong> increase in future salaries is also assumed in the<br />
valuation. The <strong>City</strong>’s unfunded actuarial accrued liability will be amortized as a level percentage <strong>of</strong><br />
projected covered payroll on a closed basis. The amortization period at January 1, 2009 was thirty years.<br />
C. Other Defined Contribution Plans<br />
The <strong>City</strong> <strong>of</strong> <strong>Cerritos</strong> has adopted, through the Public Agency Retirement System (PARS), tax qualified<br />
governmental defined benefit plans for the benefit <strong>of</strong> eligible <strong>City</strong> <strong>of</strong> <strong>Cerritos</strong> employees to provide<br />
supplemental retirement benefits. The plans, which include exempt employees plan, non-exempt<br />
employees plan and the defined contribution floor-<strong>of</strong>fset plan, conform to the requirements <strong>of</strong> Internal<br />
Revenue Code Section 401(a) and therefore entitle each Plan to favorable tax treatment.<br />
12. LIABILITY, PROPERTY AND WORKERS’ COMPENSATION PROTECTION<br />
A. Description <strong>of</strong> Self-Insurance Pool Pursuant to Joint Powers Agreement<br />
The <strong>City</strong> is a member <strong>of</strong> the California Joint Powers Insurance Authority (Insurance Authority). The<br />
Insurance Authority is comprised <strong>of</strong> 122 California public entities and is organized under a joint powers<br />
agreement pursuant to California government Code §6500 et seq. The purpose <strong>of</strong> the Insurance Authority is<br />
to arrange and administer programs for the pooling <strong>of</strong> self-insured losses, to purchase excess insurance or<br />
reinsurance, and to arrange for group-purchased insurance for property and other coverages. The Insurance<br />
Authority’s pool began covering claims <strong>of</strong> its members in 1978. Each member government has an elected<br />
<strong>of</strong>ficial as its representative on the Board <strong>of</strong> Directors. The Board operates through a nine-member<br />
Executive Committee.<br />
68
<strong>City</strong> <strong>of</strong> <strong>Cerritos</strong><br />
Notes to Basic <strong>Financial</strong> Statements, Continued<br />
For the year ended June 30, 2010<br />
12. LIABILITY, PROPERTY AND WORKERS’ COMPENSATION PROTECTION, Continued<br />
B. Self-Insurance Programs <strong>of</strong> the Authority<br />
General Liability – Each member government pays a primary deposit to cover estimated losses for a fiscal<br />
year (claims year). After the close <strong>of</strong> a fiscal year, outstanding claims are valued. A retrospective deposit<br />
computation is then made for each open claims year. Claims are pooled separately between police and nonpolice.<br />
Costs are allocated to members by the following methods within each <strong>of</strong> the four layers <strong>of</strong> coverage:<br />
(1) the first $30,000 <strong>of</strong> each occurrence is charged directly to the member’s primary deposit; (2) costs from<br />
$30,000 to $750,000 and the loss development reserves associated with losses up to $750,000 are pooled<br />
based on the member’s share <strong>of</strong> losses under $30,000; (3) losses from $750,000 to $5,000,000 and the<br />
associated loss development reserves are pooled based on payroll; (4a) costs <strong>of</strong> covered claims from<br />
$5,000,000 to $10,000,000 are paid under reinsurance policies and are subject to a $2,500,000 annual<br />
aggregate deductible; (4b) costs <strong>of</strong> covered claims from $10,000,000 to $50,000,000 are covered through<br />
excess insurance policies; (4c) Cost <strong>of</strong> covered claims for subsidence losses are paid by excess insurance<br />
with a sub-limit <strong>of</strong> $25,000,000 per occurrence per member. This $25,000,000 subsidence sub-limit is<br />
composed <strong>of</strong> $10,000,000 in reinsurance and $15,000,000 in excess insurance. The excess insurance layer has<br />
a $15,000,000 annual aggregate. The costs associated with 4a, 4b, and 4c are estimated using actuarial<br />
models and pre-funded as part <strong>of</strong> the primary and retrospective deposits.<br />
The overall policy limit for each member including all layers <strong>of</strong> coverage is $50,000,000 per occurrence.<br />
Workers’ Compensation – The <strong>City</strong> also participates in the workers’ compensation pool administered by the<br />
Authority. Each member pays a primary deposit to cover estimated losses for a fiscal year (claims year).<br />
After the close <strong>of</strong> a fiscal year, outstanding claims are valued. A retrospective deposit computation is then<br />
made for each open claims year. Claims are pooled separately between public safety and non-public<br />
safety. Costs are allocated to members by the following methods within each <strong>of</strong> the four layers <strong>of</strong> coverage:<br />
(1) the first $50,000 <strong>of</strong> each loss is charged directly to the member’s primary deposit; (2) losses from $50,000<br />
to $100,000 and the loss development reserve associated with losses up to $100,000 are pooled based on the<br />
member’s share <strong>of</strong> losses under $50,000; (3) losses from $100,000 to $2,000,000 and the loss development<br />
reserves associated with those losses are pooled based on payroll; (4) losses from $2,000,000 up to statutory<br />
limits are paid under an excess insurance policy. Protection is provided per statutory liability under<br />
California Workers’ Compensation law.<br />
Employer’s Liability losses are pooled among members to $2,000,000, coverage from $2,000,000 to<br />
$4,000,000 is purchased as part <strong>of</strong> an excess insurance policy, and losses from $4,000,000 to $10,000,000 are<br />
pooled among members.<br />
C. Purchased Insurance<br />
Environmental Insurance – The <strong>City</strong> participates in the pollution legal liability and remediation legal<br />
liability insurance which is available through the Authority. The policy covers sudden and gradual<br />
pollution <strong>of</strong> scheduled property, streets, and storm drains owned by the <strong>City</strong>. Coverage is on a claimsmade<br />
basis. There is a $50,000 deductible. The Authority has a limit <strong>of</strong> $50,000,000 for the 3-year period<br />
from July 1, 2008 through July 1, 2011. Each member <strong>of</strong> the Authority has a $10,000,000 sub-limit during the<br />
3-year term <strong>of</strong> the policy.<br />
69
<strong>City</strong> <strong>of</strong> <strong>Cerritos</strong><br />
Notes to Basic <strong>Financial</strong> Statements, Continued<br />
For the year ended June 30, 2010<br />
12. LIABILITY, PROPERTY AND WORKERS’ COMPENSATION PROTECTION, Continued<br />
C. Purchased Insurance, Continued<br />
Property Insurance – The <strong>City</strong> participates in the all-risk property protection program <strong>of</strong> the Authority.<br />
This insurance protection is underwritten by several insurance companies. The <strong>City</strong> property is currently<br />
insured according to a schedule <strong>of</strong> covered property submitted by the <strong>City</strong> to the Authority. The <strong>City</strong><br />
currently has all-risk property insurance protection in amount <strong>of</strong> $254,684,398. There is a $5,000 deductible<br />
per occurrence except for non-emergency vehicle insurance which has $1,000 deductible. Premiums for the<br />
coverage are paid annually and are not subject to retroactive adjustments.<br />
Crime Insurance – The <strong>City</strong> purchases crime insurance coverage in the amount <strong>of</strong> $1,000,000 with a $2,500<br />
deductible. The fidelity coverage is provided through the Insurance Authority. Premiums are paid annually<br />
and are not subject to retroactive adjustments.<br />
Special Event Tenant User Liability Insurance – The <strong>City</strong> further protects against liability damages by<br />
requiring tenant users <strong>of</strong> certain property to purchase low-cost tenant user liability insurance for certain<br />
activities on <strong>City</strong> property. The insurance premium is paid by the tenant user and is paid to the <strong>City</strong><br />
according to a schedule. The <strong>City</strong> then pays for the insurance. The insurance is arranged by the Authority.<br />
D. Adequacy <strong>of</strong> Protection<br />
During the past three fiscal (claims) years, none <strong>of</strong> the above programs <strong>of</strong> protection have had settlements<br />
or judgments that exceeded pooled or insured coverage. There have been no significant reductions in<br />
pooled or insured liability coverage from coverage in the prior year.<br />
Complete financial statements <strong>of</strong> the Insurance Authority may be obtained at their administrative <strong>of</strong>fices<br />
located at 8010 Moody Street, La Palma, California 90623.<br />
E. Retroactive Deposit<br />
Each year the <strong>City</strong> makes an annual contribution, and at the end <strong>of</strong> the year, the California JPIA<br />
retroactively reviews the loss history and issues a partial refund or requests an additional deposit based on<br />
actual claims activity. This retrospective review is conducted on an annual basis and includes all coverage<br />
years which contain open claims. For many members <strong>of</strong> the California JPIA, claims incurred in 2003-2004<br />
and 2004-2005 have experienced significant adverse development during the past three years.<br />
Additional funding (retrospective adjustments) for these and other coverage years, was not collected in full<br />
at the time these funding short-falls were initially identified. Members <strong>of</strong> the Authority were allowed to<br />
make partial payments, while a portion <strong>of</strong> each retrospective adjustment was deferred. The aggregation <strong>of</strong><br />
these deferred amounts over the course <strong>of</strong> several years is equal to the <strong>City</strong>’s current outstanding balance,<br />
which is referred to as the aggregate retrospective deposit balance.<br />
Retrospective deposits are payments required in addition to the annual contribution, which is payment for<br />
the current year’s insurance coverage.<br />
70
<strong>City</strong> <strong>of</strong> <strong>Cerritos</strong><br />
Notes to Basic <strong>Financial</strong> Statements, Continued<br />
For the year ended June 30, 2010<br />
12. LIABILITY, PROPERTY AND WORKERS’ COMPENSATION PROTECTION, Continued<br />
E. Retroactive Deposit, Continued<br />
Following is a summary <strong>of</strong> retroactive deposit balances for the fiscal year ended June 30, 2010:<br />
Classification<br />
Balance Balance Due within Due in more<br />
July 1, 2009 Additions Deletions June 30, 2010 One Year than One Year<br />
Claim Payable - General Liability $ - $ 1,917,561 $ - $ 1,917,561 $ - $ 1,917,561<br />
Total long-term liabilities $ - $ 1,917,561 $ - $ 1,917,561 $ - $ 1,917,561<br />
13. OTHER REQUIRED DISCLOSURES<br />
A. Deficit Fund Balance<br />
At June 30, 2010, the following funds had deficit fund balances:<br />
Fund Fund Type Deficit<br />
Debt Service Fund:<br />
Redevelopment Agency Major Governmental Fund $ (66,053,156)<br />
Special Revenue Fund:<br />
Los Coyotes Lighting District Nonmajor Governmental Fund $ (4,980)<br />
Redevelopment Agency Debt Service Fund – The Redevelopment Agency Debt Service Fund has a deficit fund<br />
balance <strong>of</strong> $66,053,156 as a result <strong>of</strong> advances from the <strong>City</strong>. The deficit is expected to be eliminated with<br />
future tax increment revenues.<br />
Los Coyotes Lighting District Fund – The Los Coyotes Lighting District Fund has a deficit fund balance <strong>of</strong><br />
$4,980 as a result <strong>of</strong> increased street lighting maintenance expenditures. The deficit is expected to be<br />
eliminated with future special assessment revenues.<br />
71
<strong>City</strong> <strong>of</strong> <strong>Cerritos</strong><br />
Notes to Basic <strong>Financial</strong> Statements, Continued<br />
For the year ended June 30, 2010<br />
13. OTHER REQUIRED DISCLOSURES, Continued<br />
B. Excess <strong>of</strong> Expenditures over Appropriations<br />
Excess <strong>of</strong> expenditures over appropriations occurred in individual funds during fiscal year 2009-10 as<br />
follows:<br />
Excess<br />
Expenditures over<br />
Fund Expenditures Appropriations Appropriations<br />
Special Revenue Funds:<br />
Traffic Congestion $ 507,330 $ 460,000 $ (47,330)<br />
Sewer 213,400 209,140 (4,260)<br />
SB 821 93,605 85,000 (8,605)<br />
Los Coyotes Lighting District 1,269,490 1,141,160 (128,330)<br />
Local Law Enforcement Grants 12,560 - (12,560)<br />
COPS Grants 122,044 - (122,044)<br />
Library Grants 22,582 - (22,582)<br />
Environmental Grants 22,353 - (22,353)<br />
Measure R 52,739 - (52,739)<br />
Special Revenue Fund actual expenditures exceeded budgeted expenditures for the Traffic Congestion, Los<br />
Coyotes Lighting District, and Sewer Funds relating to operational and administrative costs, for the SB 821<br />
and Measure R relating to capital costs, and for Local Law Enforcement Grants, COPS Grants, Library<br />
Grants and Environmental Grants to reimburse the General Fund for costs incurred relating to the grants.<br />
14. COMMITMENTS AND CONTINGENCIES<br />
A. Lawsuits<br />
Numerous claims and suits have been filed against the <strong>City</strong> in the normal course <strong>of</strong> conducting <strong>City</strong><br />
business. Based upon information received from the <strong>City</strong> Attorney and the self-insurance administrator,<br />
the estimated liability under such claims would be adequately covered by the deposits paid to CJPIA for<br />
self-insurance and insurance coverage. (See Note 12)<br />
B. Contract with Los Angeles County Sheriff’s Department<br />
The <strong>City</strong> contracts for policing services through the Los Angeles County Sheriff’s Department. As part <strong>of</strong><br />
the agreement for services, the <strong>City</strong> is required to pay an additional 6% premium over the contract price to<br />
the Sheriff’s Department for liability insurance. This amount is held by the County in a Liability Trust Fund<br />
and provides for the payment <strong>of</strong> claims brought against the Sheriff’s Department. During the fiscal year<br />
ended June 30, 2010, the results <strong>of</strong> an actuarial study <strong>of</strong> both existing open claims and claims not yet<br />
reported are not able to be estimated at this time. In order to fund these past obligations <strong>of</strong> the Liability<br />
Trust Fund, the premium paid by the <strong>City</strong> may increase in future periods. The precise amount and timing<br />
<strong>of</strong> any contingencies or commitments resulting from the shortfall in the County’s Liability Trust Fund<br />
cannot be determined at this time.<br />
72
<strong>City</strong> <strong>of</strong> <strong>Cerritos</strong><br />
Notes to Basic <strong>Financial</strong> Statements, Continued<br />
For the year ended June 30, 2010<br />
14. COMMITMENTS AND CONTINGENCIES, Continued<br />
C. $5,640,000 Tax Allocation Bonds arrangement with Commonwealth Cousins I, LLC<br />
In October 1998, the <strong>City</strong> Council authorized the Agency to issue bonds relating to specific development<br />
within the Los Coyotes Project Area. Then, in November 1998, the Agency entered into an agreement to<br />
issue $5,640,000 <strong>of</strong> Tax Allocation Bonds to Commonwealth Cousins I, LLC, in relation to the construction<br />
<strong>of</strong> a shared parking structure in the <strong>Cerritos</strong> Towne Center. The parking structure serves both the retail<br />
complex and tenants within an adjacent <strong>of</strong>fice building. In 2001, $3,760,000 <strong>of</strong> the bonds were issued. The<br />
remaining balance <strong>of</strong> $1,880,000 remained unissued as <strong>of</strong> June 30, 2010. Interest will not accrue prior to the<br />
issuance date. The Agency will repay the bonds by pledging a portion <strong>of</strong> the tax increment generated from<br />
the adjacent <strong>of</strong>fice building.<br />
D. Electric Utility<br />
The <strong>City</strong>’s Electric Utility is a member <strong>of</strong> the Magnolia Power Project that is financed and owned by the<br />
Southern California Public Power Authority (SCPPA). Member cities <strong>of</strong> the Magnolia Power Project<br />
include Anaheim, Burbank, Colton, Glendale and Pasadena (the Project “A” Participants) and the <strong>City</strong> <strong>of</strong><br />
<strong>Cerritos</strong> (the Project “B” Participant). All Magnolia Participants have a “Take or Pay” contract with SCPPA<br />
and are obligated to pay their share <strong>of</strong> the indebtedness regardless <strong>of</strong> the ability <strong>of</strong> the contracting agency to<br />
provide electricity. The <strong>City</strong>’s share <strong>of</strong> these payments are reported as long-term debt (see Notes 9D and<br />
9J). Payment for these obligations will be made from operating revenues. This contract provides for<br />
generating capacity <strong>of</strong> 4.2% <strong>of</strong> the output generated from the plant.<br />
15. LEASE INCOME UNDER OPERATING LEASES<br />
Land in the amount <strong>of</strong> $69,098,912 is owned by the <strong>City</strong> and Agency and is held for lease. In connection<br />
with certain ground leases <strong>of</strong> the <strong>Cerritos</strong> Towne Center property, the Lincoln Station Property and the<br />
Jaguar/Land Rover property, the Agency and <strong>City</strong> have entered into cooperation agreements. Under the<br />
terms <strong>of</strong> the cooperation agreements, 75% <strong>of</strong> the lease income is paid to the <strong>City</strong> and 25% is paid to the<br />
Agency. For the year ended June 30, 2010, the Agency’s 25% portion <strong>of</strong> the lease income was $1,295,930<br />
while the <strong>City</strong>’s 75% portion was $4,535,134.<br />
Projected minimum lease payments to be received by the <strong>City</strong> and Agency as <strong>of</strong> June 30, 2010 are as<br />
follows:<br />
Year Ending<br />
June 30, <strong>City</strong> Agency Total<br />
2011 $ 4,160,593 $ 1,716,514 $ 5,877,107<br />
2012 4,377,043 1,802,344 6,179,387<br />
2013 4,402,985 1,824,962 6,227,947<br />
2014 4,418,552 1,843,791 6,262,343<br />
2015 4,424,320 1,536,973 5,961,293<br />
2016-2088 273,342,523 91,114,174 364,456,697<br />
Total $ 295,126,016 $ 99,838,758 $ 394,964,774<br />
73
<strong>City</strong> <strong>of</strong> <strong>Cerritos</strong><br />
Notes to Basic <strong>Financial</strong> Statements, Continued<br />
For the year ended June 30, 2010<br />
16. PROPOSITION 1A BORROWING BY THE STATE OF CALIFORNIA<br />
Under the provisions <strong>of</strong> Proposition 1A and as part <strong>of</strong> the 2009-10 budget package passed by the California<br />
State legislature on July 28, 2009, the State <strong>of</strong> California borrowed 8% <strong>of</strong> the amount <strong>of</strong> property tax<br />
revenue, including those property taxes associated with the in-lieu motor vehicle license fee, the triple flip<br />
in lieu sales tax, and supplemental property tax, apportioned to cities, counties and special districts<br />
(excluding redevelopment agencies). The state is required to repay this borrowing plus interest by June 30,<br />
2013. After repayment <strong>of</strong> this initial borrowing, the California legislature may consider only one additional<br />
borrowing within a ten-year period. The amount <strong>of</strong> this borrowing pertaining to the <strong>City</strong> was $1,107,411.<br />
Authorized with the 2009-10 State budget package, the Proposition 1A Securitization Program was<br />
instituted by the California Statewide Communities Development Authority ("California Communities"), a<br />
joint powers authority sponsored by the California State Association <strong>of</strong> Counties and the League <strong>of</strong><br />
California Cities, to enable local governments to sell their Proposition 1A receivables to California<br />
Communities. Under the Securitization Program, California Communities simultaneously purchased the<br />
Proposition 1A receivables and issued bonds ("Prop 1A Bonds") to provide local agencies with cash<br />
proceeds in two equal installments, on January 15, 2010 and May 3, 2010. The purchase price paid to the<br />
local agencies equaled 100% <strong>of</strong> the amount <strong>of</strong> the property tax reduction. All transaction costs <strong>of</strong> issuance<br />
and interest were paid by the State <strong>of</strong> California. Participating local agencies have no obligation on the<br />
bonds and no credit exposure to the State. The <strong>City</strong> participated in the securitization program and<br />
accordingly property taxes have been recorded in the same manner as if the State had not exercised its<br />
rights under Proposition 1A. The receivable sale proceeds were equal to the book value and, as a result, no<br />
gain or loss was recorded.<br />
17. SUBSEQUENT EVENT<br />
Redevelopment Agency funds have been estimated for a takeaway by the State <strong>of</strong> California. This decision<br />
was litigated by the California Redevelopment Association and other parties with the hope that this would<br />
be considered unconstitutional. The court’s decision is currently being appealed and the results have not<br />
yet been determined. The 2009-10 payment was $11,812,007 and it is anticipated another $2,431,884 will<br />
need to be submitted if the ruling is not overturned.<br />
Management has evaluated subsequent events to determine if events or transactions occurring through<br />
November 30, 2010, the date the consolidated financial statements were available to be issued, require<br />
adjustment to, or disclosure in the basic financial statements.<br />
74
REQUIRED SUPPLEMENTARY INFORMATION<br />
(UNAUDITED)<br />
75
CITY OF CERRITOS<br />
Required Supplementary Information (Unaudited)<br />
For the year ended June 30, 2010<br />
1. BUDGET AND BUDGETARY ACCOUNTING<br />
The annual budget adopted by the <strong>City</strong> Council provides for the general operation <strong>of</strong> the <strong>City</strong>. It includes<br />
proposed expenditures and the means <strong>of</strong> financing them.<br />
The <strong>City</strong> Council approves total budgeted appropriations and any amendments to appropriations<br />
throughout the year. This “appropriated budget” covers substantially all <strong>City</strong> expenditures, with the<br />
exception <strong>of</strong> debt service on bond issues and capital improvement projects carried forward from prior<br />
years, which expenditures constitute legally-authorized “non-appropriated budget.”<br />
There were no significant non-budgeted financial activities. Actual expenditures may not exceed budgeted<br />
appropriations at the fund level. However, the <strong>City</strong> Manager is authorized to transfer budgeted amounts<br />
between funds. There were no significant supplementary budget appropriations during the year ended<br />
June 30, 2010.<br />
Formal budgetary integration is employed as a management control. Commitments for materials and<br />
services, such as purchase orders and contracts, are recorded during the year as encumbrances to assist in<br />
controlling expenditures. Encumbrances at year end lapse, unless appropriations are made for certain<br />
capital projects in the subsequent fiscal year.<br />
<strong>Annual</strong> budgets for the General and Special Revenue Funds are adopted on a basis substantially consistent<br />
with accounting principles generally accepted in the United States <strong>of</strong> America. Accordingly, actual<br />
revenues and expenditures can be compared with related budgeted amounts without any significant<br />
reconciling items. Budgets for the Capital Projects and Debt Service Funds are long-term in nature.<br />
Accordingly, no budgetary comparisons are reflected for these funds in the accompanying financial<br />
statements. No budgetary comparisons are presented for Proprietary Funds, as the <strong>City</strong> is not legally<br />
required to adopt a budget for these types <strong>of</strong> funds.<br />
Under Article XIIIB <strong>of</strong> the California Constitution (the Gann Spending Limitation Initiative), the <strong>City</strong> is<br />
restricted as to the amount <strong>of</strong> annual appropriations from the proceeds <strong>of</strong> taxes, and if proceeds <strong>of</strong> taxes<br />
exceed allowed appropriations, the excess must either be refunded to the State Controller, returned to the<br />
taxpayers through revised tax rates or revised fee schedules, or an excess in one year may be <strong>of</strong>fset against a<br />
deficit in the following year. For the fiscal year ended June 30, 2010, based on calculations by <strong>City</strong><br />
Management, proceeds <strong>of</strong> taxes did not exceed appropriations. Further, Section 5 <strong>of</strong> Article XIIIB allows the<br />
<strong>City</strong> to designate a portion <strong>of</strong> fund balance for general contingencies, to be used for any purpose.<br />
76
CITY OF CERRITOS<br />
Required Supplementary Information (Unaudited), Continued<br />
For the year ended June 30, 2010<br />
1. BUDGET AND BUDGETARY ACCOUNTING, Continued<br />
BUDGETARY COMPARISON SCHEDULE<br />
GENERAL FUND<br />
For the Year Ended June 30, 2010<br />
Variance with<br />
Final Budget<br />
Budgeted Amounts<br />
Positive<br />
Original Final Actual (Negative)<br />
REVENUES:<br />
Taxes $ 24,359,410 $ 23,134,170 $ 20,507,251 $ (2,626,919)<br />
Licenses and permits 1,921,500 1,912,000 1,913,968 1,968<br />
Fines and forfeitures 955,000 910,015 1,103,441 193,426<br />
Investment and rental income 15,620,910 15,330,325 16,468,213 1,137,888<br />
Revenues from other agencies 11,002,120 11,976,835 10,976,983 (999,852)<br />
Current fees and services 7,443,970 7,254,650 6,932,698 (321,952)<br />
Franchises 1,465,000 1,495,000 1,498,545 3,545<br />
Other revenue 282,580 863,615 1,706,500 842,885<br />
TOTAL REVENUES 63,050,490 62,876,610 61,107,599 (1,769,011)<br />
EXPENDITURES:<br />
Current:<br />
Legislative and Administrative 2,913,560 2,901,190 2,707,891 193,299<br />
Community Development 2,758,270 2,381,360 2,864,679 (483,319)<br />
Public Works 11,654,580 11,576,960 10,908,071 668,889<br />
Water and Power 95,410 124,310 73,683 50,627<br />
Community and Safety Services 22,780,500 22,331,620 21,217,358 1,114,262<br />
Administrative Services 11,580,470 11,338,650 10,317,186 1,021,464<br />
<strong>Cerritos</strong> Center for the Performing Arts 9,275,340 9,117,040 8,781,832 335,208<br />
TOTAL EXPENDITURES 61,058,130 59,771,130 56,870,700 2,900,430<br />
EXCESS OF REVENUES OVER<br />
(UNDER) EXPENDITURES 1,992,360 3,105,480 4,236,899 1,131,419<br />
OTHER FINANCING SOURCES (USES):<br />
Transfers in 2,402,955 2,155,303 2,000,000 (155,303)<br />
Transfers out (4,713,163) (4,948,927) (4,581,877) 367,050<br />
TOTAL OTHER FINANCING<br />
SOURCES (USES) (2,310,208) (2,793,624) (2,581,877) 211,747<br />
NET CHANGE IN FUND BALANCE (317,848) 311,856 1,655,022 1,343,166<br />
FUND BALANCES - BEGINNING OF YEAR 181,445,052 181,445,052 181,445,052 -<br />
FUND BALANCES - END OF YEAR $ 181,127,204 $ 181,756,908 $ 183,100,074 $ 1,343,166<br />
77
CITY OF CERRITOS<br />
Required Supplementary Information (Unaudited), Continued<br />
For the year ended June 30, 2010<br />
2. DEFINED PENSION PLAN<br />
PUBLIC EMPLOYEE RETIREMENT SYSTEMS (PERS)<br />
SCHEDULE OF FUNDING PROGRESS<br />
Miscellaneous Employees<br />
Schedule <strong>of</strong> Funding Progress for PERS ($ Amount in Thousands)<br />
Valuation Entry Age Normal Actuarial Value Unfunded/Liability Funded <strong>Annual</strong> Covered UAAL as a %<br />
Date Accrued Liability <strong>of</strong> Assets (Excess Assets) Status Covered Payroll <strong>of</strong> Payroll<br />
6/30/2007 $ 121,881 $ 100,469 $ 21,412 82.43% $ 19,220 111.40%<br />
6/30/2008 132,565 109,425 23,140 82.54% 19,718 117.35%<br />
6/30/2009 146,971 116,451 30,520 79.23% 19,394 157.37%<br />
* Based on the latest actuarial valuation available.<br />
3. OTHER POST EMPLOYMENT BENEFITS<br />
SCHEDULE OF FUNDING PROGRESS<br />
Schedule <strong>of</strong> Funding Progress for OPEB ($ Amount in Thousands)<br />
Valuation Entry Age Normal Actuarial Value Unfunded/Liability Funded <strong>Annual</strong> Covered UAAL as a %<br />
Date Accrued Liability <strong>of</strong> Assets (Excess Assets) Status Covered Payroll <strong>of</strong> Payroll<br />
1/1/2007 $ 25,769 $ - $ 25,769 0.00% $ 19,306 133.48%<br />
1/1/2009 27,855 11,825 16,030 42.45% 21,648 74.05%<br />
* Based on the latest actuarial valuation available.<br />
78
SUPPLEMENTARY INFORMATION<br />
79
This page intentionally left blank.<br />
80
NONMAJOR GOVERNMENTAL FUNDS<br />
Special Revenue Funds account for taxes and other revenues set aside in accordance with law or administrative<br />
regulations for a specific purpose.<br />
Street Improvements Fund - to account for allocation <strong>of</strong> state gasoline taxes received by the <strong>City</strong>. These funds<br />
may be used for street maintenance, right-<strong>of</strong>-way acquisition and street construction.<br />
Traffic Congestion Fund - to account for allocated funds from the state for street or road maintenance or<br />
reconstruction during the fiscal year 2008-2009.<br />
Drainage Fund - to account for monies received from development fees. The funds are used for the maintenance<br />
<strong>of</strong> the drainage system.<br />
Sewer Fund - to account for monies received from sewer connection and maintenance fees. This fund is used for<br />
the maintenance and reconstruction <strong>of</strong> the sewer systems.<br />
SB 821 Fund - to account for monies received from the State for bike lanes and handicapped ramp construction.<br />
Proposition “A” Fund - to account for Los Angeles County special 1/2 cent transportation sales tax, which<br />
became effective July 1 , 1982. These funds may be used only for certain transportation purposes.<br />
Proposition “C” Fund - to account for a Los Angeles County Special 1/2 cent transit sales tax, which was<br />
approved by the voters in November 1990. These funds may be used only for public transit projects.<br />
Assessment District #6 Fund - to account for monies received from special assessment tax levied from the areas<br />
benefited. These funds are used to cover the expenses <strong>of</strong> maintaining the improvements in the area.<br />
Los Coyotes Lighting District Fund - to account for monies secured from the State <strong>of</strong> California under the<br />
provision <strong>of</strong> Division 14, Part 1, Street and Highways Code, State <strong>of</strong> California as amended, referred to as the<br />
“Street Lighting Act <strong>of</strong> 1919”. These funds are used for the installation, maintenance <strong>of</strong>, and furnishing <strong>of</strong><br />
electrical current for the lighting <strong>of</strong> a street lighting system on certain public streets within the <strong>City</strong>.<br />
Local Law Enforcement Grants Fund - to account for non-recurring grant monies received from the State <strong>of</strong><br />
California for “Local Law Enforcement Block Grant”. These funds are used for public safety programs.<br />
COPS Grants Fund - to account for non-recurring grant monies received from the State <strong>of</strong> California under the<br />
following laws: COPS SB3229 and COPS Ahead. These funds are used for public safety programs.<br />
Library Grants Fund - to account for non-recurring grant monies received from the State <strong>of</strong> California for<br />
technology improvements in library services.<br />
Environmental Grant Fund - to account for non-recurring grant monies received from the State <strong>of</strong> California for<br />
increased recycling efforts within the <strong>City</strong> <strong>of</strong> <strong>Cerritos</strong>.<br />
Air Quality Management District (AQMD) Fund - to account for monies received from the South Coast Air<br />
Quality Management District. These funds are used for the <strong>City</strong>’s rideshare program.<br />
Measure "R" Fund - to account for a Los Angeles County 1/2-cent sales tax which was approved by voters in<br />
November 2008 for transportation purposes.<br />
The Capital Projects Fund is used to account for resources used for the construction and acquisition <strong>of</strong> capital<br />
facilities.<br />
Municipal Improvement Fund - to account for the monies received from General Fund and other grant monies for<br />
the construction <strong>of</strong> major capital facilities, which generally require more than one budgetary cycle to complete.<br />
81
<strong>City</strong> <strong>of</strong> <strong>Cerritos</strong><br />
Combining Balance Sheet<br />
Non-Major Governmental Funds<br />
June 30, 2010<br />
Special Revenue Funds<br />
Street<br />
Traffic<br />
Improvements Congestion Drainage Sewer SB 821<br />
ASSETS<br />
Cash and investments $ 570,008 $ 689,449 $ - $ 3,232,588 $<br />
-<br />
Receivable:<br />
Accounts 633,314 137,602 - 7,814 -<br />
Interest 1,323 1,600 - 7,503 -<br />
Other - - - - -<br />
Prepaid expenses 370 - - - -<br />
Total Assets $ 1,205,015 $ 828,651 $ - $ 3,247,905 $<br />
-<br />
LIABILITIES AND<br />
FUND BALANCES<br />
Liabilities:<br />
Accounts payable and accrued liabilities $ 249,800 $ 360,387 $ - $ - $<br />
-<br />
Accrued salaries and benefits 50,510 - - - -<br />
Deferred revenue 197,732 - - - -<br />
Due to other funds - - - - -<br />
Total Liabilities 498,042 360,387 - - -<br />
Fund Balances:<br />
Reserved:<br />
Encumbrance - - - - -<br />
Unreserved:<br />
Designated for special revenue purpose 706,973 468,264 - 3,247,905 -<br />
Total Fund Balances (Deficit) 706,973 468,264 - 3,247,905 -<br />
Total Liabilities and Fund Balances $ 1,205,015 $ 828,651 $ - $ 3,247,905 $<br />
-<br />
82
Special Revenue Funds<br />
Public Safety Grants Fund<br />
Local Law<br />
Proposition Proposition Assessment Los Coyotes Enforcement COPS Library Environmental<br />
"A" "C" District #6 Lighting District Grant Grant Grant Grant<br />
$ 943,481 $ - $ 114,658 $ - $ 104,961 $ 12,542 $ 165 $ 110,885<br />
- - - 37,086 16,943 7,548 - -<br />
2,190 - 266 - 244 29 - 257<br />
8,053 - - - - - - -<br />
- - - 180 - - - -<br />
$ 953,724 $ - $ 114,924 $ 37,266 $ 122,148 $ 20,119 $ 165 $ 111,142<br />
$ - $ - $ 4,282 $ 11,460 $ - $ - $ - $<br />
-<br />
- - - 1,650 - - - -<br />
- - - - 16,943 - - -<br />
- - - 29,136 - - - -<br />
- - 4,282 42,246 16,943 - - -<br />
- - - - - - - -<br />
953,724 - 110,642 (4,980) 105,205 20,119 165 111,142<br />
953,724 - 110,642 (4,980) 105,205 20,119 165 111,142<br />
$ 953,724 $ - $ 114,924 $ 37,266 $ 122,148 $ 20,119 $ 165 $ 111,142<br />
83
Capital<br />
Special Revenue Fund<br />
Projects Fund<br />
Total<br />
Total Special<br />
Nonmajor<br />
Measure Revenue Municipal Governmental<br />
AQMD "R" Funds Improvement Funds<br />
$ 255,251 $ 299,663 $ 6,333,651 $ 92,810 $ 6,426,461<br />
- - 840,307 350,800 1,191,107<br />
592 696 14,700 215 14,915<br />
- - 8,053 - 8,053<br />
- - 550 - 550<br />
$ 255,843 $ 300,359 $ 7,197,261 $ 443,825 $ 7,641,086<br />
$ - $ - $ 625,929 $ 92,054 $ 717,983<br />
- - 52,160 - 52,160<br />
- - 214,675 350,800 565,475<br />
- - 29,136 - 29,136<br />
- - 921,900 442,854 1,364,754<br />
- - - -<br />
255,843 300,359 6,275,361 971 6,276,332<br />
255,843 300,359 6,275,361 971 6,276,332<br />
$ 255,843 $ 300,359 $ 7,197,261 $ 443,825 $ 7,641,086<br />
84
This page intentionally left blank.<br />
85
<strong>City</strong> <strong>of</strong> <strong>Cerritos</strong><br />
Combining Statement <strong>of</strong> Revenues, Expenditures and Changes in Fund Balances<br />
Non-Major Governmental Funds<br />
For the Year Ended June 30, 2010<br />
Special Revenue Funds<br />
REVENUES:<br />
Street<br />
Traffic<br />
Improvements Congestion Drainage Sewer SB 821<br />
Investment and rental income $ 5,965 $ 12,697 $ - $ 72,023 $<br />
-<br />
Revenues from other agencies 1,788,564 496,287 - - 93,605<br />
Franchise 6,307 - - - -<br />
Current fees and services - - 759 58,466 -<br />
Other revenues - - - - -<br />
Total Revenues 1,800,836 508,984 759 130,489 93,605<br />
EXPENDITURES:<br />
Current:<br />
Legislative and Administration 11,140 - - - -<br />
Community Development - - - - -<br />
Public Works 3,789,870 146,943 8,930 98,040 -<br />
Water and Power - - - 32,140 -<br />
Community and Safety Services - - - - -<br />
Administrative Services 84,000 - 11,170 83,220 -<br />
Capital outlay 1,292,211 360,387 - - 93,605<br />
Total Expenditures 5,177,221 507,330 20,100 213,400 93,605<br />
REVENUES OVER<br />
(UNDER) EXPENDITURES (3,376,385) 1,654 (19,341) (82,911) -<br />
OTHER FINANCING SOURCES (USES):<br />
Transfers in 3,608,889 - 19,341 - -<br />
Transfers out - - - (2,000,000) -<br />
Total Other Financing Sources (Uses) 3,608,889 - 19,341 (2,000,000) -<br />
NET CHANGE IN FUND BALANCES 232,504 1,654 - (2,082,911) -<br />
FUND BALANCE (DEFICIT):<br />
Beginning <strong>of</strong> Year 474,469 466,610 - 5,330,816 -<br />
End <strong>of</strong> Year $ 706,973 $ 468,264 $ - $ 3,247,905 $<br />
-<br />
86
Special Revenue Funds<br />
Public Safety Grants Fund<br />
Local Law<br />
Proposition Proposition Assessment Los Coyotes Enforcement COPS Library Environmental<br />
"A" "C" District #6 Lighting District Grant Grant Grant Grant<br />
$ 26,188 $ - $ 2,372 $ - $ 2,454 $ 1,079 $ 32 $ 2,437<br />
890,978 629,136 29,625 746,438 - 122,043 22,582 22,353<br />
- - - - - - - -<br />
16,431 81,664 - - - - - -<br />
- - - 109,183 - - - -<br />
933,597 710,800 31,997 855,621 2,454 123,122 22,614 24,790<br />
- - - - - - - -<br />
489,201 1,267,027 - - - - - -<br />
- - - 1,153,030 - - - 22,353<br />
- - - - - - - -<br />
- - - - 12,560 122,044 - -<br />
- - 11,170 116,460 - - 22,582 -<br />
- - - - - - - -<br />
489,201 1,267,027 11,170 1,269,490 12,560 122,044 22,582 22,353<br />
444,396 (556,227) 20,827 (413,869) (10,106) 1,078 32 2,437<br />
- 548,197 - 372,110 - - - -<br />
(548,197) - - - - - - -<br />
(548,197) 548,197 - 372,110 - - - -<br />
(103,801) (8,030) 20,827 (41,759) (10,106) 1,078 32 2,437<br />
1,057,525 8,030 89,815 36,779 115,311 19,041 133 108,705<br />
$ 953,724 $ - $ 110,642 $ (4,980) $ 105,205 $ 20,119 $ 165 $ 111,142<br />
87
Capital<br />
Special Revenue Fund<br />
Projects Fund<br />
Total<br />
Total Special<br />
Nonmajor<br />
Measure Revenue Municipal Governmental<br />
AQMD "R" Funds Improvement Funds<br />
$ 5,480 $ 4,667 $ 135,394 $ 971 $ 136,365<br />
46,985 348,431 5,237,027 400,000 5,637,027<br />
- - 6,307 - 6,307<br />
- - 157,320 - 157,320<br />
- - 109,183 - 109,183<br />
52,465 353,098 5,645,231 400,971 6,046,202<br />
- - 11,140 - 11,140<br />
36,895 - 1,793,123 - 1,793,123<br />
- - 5,219,166 - 5,219,166<br />
- - 32,140 - 32,140<br />
- - 134,604 - 134,604<br />
700 - 329,302 - 329,302<br />
- 52,739 1,798,942 981,537 2,780,479<br />
37,595 52,739 9,318,417 981,537 10,299,954<br />
14,870 300,359 (3,673,186) (580,566) (4,253,752)<br />
- - 4,548,537 581,537 5,130,074<br />
- - (2,548,197) - (2,548,197)<br />
- - 2,000,340 581,537 2,581,877<br />
14,870 300,359 (1,672,846) 971 (1,671,875)<br />
240,973 - 7,948,207 - 7,948,207<br />
$ 255,843 $ 300,359 $ 6,275,361 $ 971 $ 6,276,332<br />
88
This page intentionally left blank.<br />
89
<strong>City</strong> <strong>of</strong> <strong>Cerritos</strong><br />
Schedule <strong>of</strong> Revenues, Expenditures and Changes in Fund Balance - Budget and Actual<br />
Street Improvements Special Revenue Fund<br />
For the Year Ended June 30, 2010<br />
REVENUES:<br />
Variance<br />
Original Final Positive<br />
Budget Budget Actual (Negative)<br />
Investment and rental income $ - $ - $ 5,965 $ 5,965<br />
Revenues from other agencies 2,565,585 2,565,585 1,788,564 (777,021)<br />
Franchise - - 6,307 6,307<br />
Total Revenues 2,565,585 2,565,585 1,800,836 (764,749)<br />
EXPENDITURES:<br />
Current:<br />
Legislative and Administrative 9,790 8,170 11,140 (2,970)<br />
Public Works 3,891,180 3,972,720 3,789,870 182,850<br />
Administrative Services 95,790 92,900 84,000 8,900<br />
Capital outlay 2,375,000 1,459,730 1,292,211 167,519<br />
Total Expenditures 6,371,760 5,533,520 5,177,221 356,299<br />
REVENUES OVER (UNDER) EXPENDITURES (3,806,175) (2,967,935) (3,376,385) (408,450)<br />
OTHER FINANCING SOURCES (USES):<br />
Transfers in 3,557,348 3,748,726 3,608,889 (139,837)<br />
Total Other Financing Sources (Uses) 3,557,348 3,748,726 3,608,889 (139,837)<br />
NET CHANGE IN FUND BALANCE (248,827) 780,791 232,504 (548,287)<br />
FUND BALANCE:<br />
Beginning <strong>of</strong> Year 474,469 474,469 474,469 -<br />
End <strong>of</strong> Year $ 225,642 $ 1,255,260 $ 706,973 $ (548,287)<br />
90
<strong>City</strong> <strong>of</strong> <strong>Cerritos</strong><br />
Schedule <strong>of</strong> Revenues, Expenditures and Changes in Fund Balance - Budget and Actual<br />
Traffic Congestion Special Revenue Fund<br />
For the Year Ended June 30, 2010<br />
REVENUES:<br />
Variance<br />
Original Final Positive<br />
Budget Budget Actual (Negative)<br />
Investment and rental income $ - $ - $ 12,697 $ 12,697<br />
Revenues from other agencies 519,005 519,005 496,287 (22,718)<br />
Total Revenues 519,005 519,005 508,984 (10,021)<br />
EXPENDITURES:<br />
Current:<br />
Public works - - 146,943 (146,943)<br />
Capital outlay - 460,000 360,387 99,613<br />
Total expenditures - 460,000 507,330 (47,330)<br />
REVENUES OVER (UNDER) EXPENDITURES 519,005 59,005 1,654 (57,351)<br />
OTHER FINANCING SOURCES (USES):<br />
Transfers in (out) (519,005) - -<br />
Total Other Financing Sources (Uses) (519,005) - - -<br />
NET CHANGE IN FUND BALANCE - 59,005 1,654 (57,351)<br />
FUND BALANCE:<br />
Beginning <strong>of</strong> Year 466,610 466,610 466,610 -<br />
End <strong>of</strong> Year $ 466,610 $ 525,615 $ 468,264 $ (57,351)<br />
91
<strong>City</strong> <strong>of</strong> <strong>Cerritos</strong><br />
Schedule <strong>of</strong> Revenues, Expenditures and Changes in Fund Balance - Budget and Actual<br />
Drainage Special Revenue Fund<br />
For the Year Ended June 30, 2010<br />
REVENUES:<br />
Variance<br />
Original Final Positive<br />
Budget Budget Actual (Negative)<br />
Current fees and services $ 1,000 $ 1,500 $ 759 $ (741)<br />
Total Revenues 1,000 1,500 759 (741)<br />
EXPENDITURES:<br />
Current:<br />
Public Works 8,570 8,600 8,930 (330)<br />
Administrative Services 12,600 11,980 11,170 810<br />
Total Expenditures 21,170 20,580 20,100 480<br />
REVENUES OVER (UNDER) EXPENDITURES (20,170) (19,080) (19,341) (261)<br />
OTHER FINANCING SOURCES (USES):<br />
Transfers in 20,170 19,080 19,341 261<br />
Total Other Financing Sources (Uses) 20,170 19,080 19,341 261<br />
NET CHANGE IN FUND BALANCE - - - -<br />
FUND BALANCE:<br />
Beginning <strong>of</strong> Year - - - -<br />
End <strong>of</strong> Year $ - $ - $ - $<br />
-<br />
92
<strong>City</strong> <strong>of</strong> <strong>Cerritos</strong><br />
Schedule <strong>of</strong> Revenues, Expenditures and Changes in Fund Balance - Budget and Actual<br />
Sewer Special Revenue Fund<br />
For the Year Ended June 30, 2010<br />
REVENUES:<br />
Variance<br />
Original Final Positive<br />
Budget Budget Actual (Negative)<br />
Investment and rental income $ 108,100 $ 67,300 $ 72,023 $ 4,723<br />
Current fees and services 63,000 67,000 58,466 (8,534)<br />
Total Revenues 171,100 134,300 130,489 (3,811)<br />
EXPENDITURES:<br />
Current:<br />
Public Works 95,910 95,660 98,040 (2,380)<br />
Water and Power 28,470 29,390 32,140 (2,750)<br />
Administrative Services 86,880 84,090 83,220 870<br />
Total Expenditures 211,260 209,140 213,400 (4,260)<br />
REVENUES OVER (UNDER) EXPENDITURES (40,160) (74,840) (82,911) (8,071)<br />
OTHER FINANCING SOURCES (USES):<br />
Transfers in (out) (2,000,000) (2,000,000) (2,000,000) -<br />
Total Other Financing Sources (Uses) (2,000,000) (2,000,000) (2,000,000) -<br />
NET CHANGE IN FUND BALANCE (2,040,160) (2,074,840) (2,082,911) (8,071)<br />
FUND BALANCE:<br />
Beginning <strong>of</strong> Year 5,330,816 5,330,816 5,330,816 -<br />
End <strong>of</strong> Year $ 3,290,656 $ 3,255,976 $ 3,247,905 $ (8,071)<br />
93
<strong>City</strong> <strong>of</strong> <strong>Cerritos</strong><br />
Schedule <strong>of</strong> Revenues, Expenditures and Changes in Fund Balance - Budget and Actual<br />
SB 821 Special Revenue Fund<br />
For the Year Ended June 30, 2010<br />
REVENUES:<br />
Variance<br />
Original Final Positive<br />
Budget Budget Actual (Negative)<br />
Revenues from other agencies $ 28,000 $ 28,000 $ 93,605 $ 65,605<br />
Total Revenues 28,000 28,000 93,605 65,605<br />
EXPENDITURES:<br />
Capital outlay - 85,000 93,605 (8,605)<br />
Total Expenditures - 85,000 93,605 (8,605)<br />
REVENUES OVER (UNDER) EXPENDITURES 28,000 (57,000) - 57,000<br />
Transfers in (out) - 57,000 - (57,000)<br />
Total Other Financing Sources (Uses) - 57,000 - (57,000)<br />
NET CHANGE IN FUND BALANCE 28,000 - - -<br />
FUND BALANCE:<br />
Beginning <strong>of</strong> Year - - - -<br />
End <strong>of</strong> Year $ 28,000 $ - $ - $<br />
-<br />
94
<strong>City</strong> <strong>of</strong> <strong>Cerritos</strong><br />
Schedule <strong>of</strong> Revenues, Expenditures and Changes in Fund Balance - Budget and Actual<br />
Proposition "A" Special Revenue Fund<br />
For the Year Ended June 30, 2010<br />
REVENUES:<br />
Variance<br />
Original Final Positive<br />
Budget Budget Actual (Negative)<br />
Investment and rental income $ 18,680 $ 31,200 $ 26,188 $ (5,012)<br />
Revenues from other agencies 1,250,000 942,885 890,978 (51,907)<br />
Current fees and services 17,000 12,000 16,431 4,431<br />
Total Revenues 1,285,680 986,085 933,597 (52,488)<br />
EXPENDITURES:<br />
Current:<br />
Community Development 800,000 800,000 489,201 310,799<br />
Total Expenditures 800,000 800,000 489,201 310,799<br />
REVENUES OVER (UNDER) EXPENDITURES 485,680 186,085 444,396 258,311<br />
OTHER FINANCING SOURCES (USES):<br />
Transfers out (476,000) (541,970) (548,197) (6,227)<br />
Total Other Financing Sources (Uses) (476,000) (541,970) (548,197) (6,227)<br />
NET CHANGE IN FUND BALANCE 9,680 (355,885) (103,801) 252,084<br />
FUND BALANCE:<br />
Beginning <strong>of</strong> Year 1,057,525 1,057,525 1,057,525 -<br />
End <strong>of</strong> Year $ 1,067,205 $ 701,640 $ 953,724 $ 252,084<br />
95
<strong>City</strong> <strong>of</strong> <strong>Cerritos</strong><br />
Schedule <strong>of</strong> Revenues, Expenditures and Changes in Fund Balance - Budget and Actual<br />
Proposition "C" Special Revenue Fund<br />
For the Year Ended June 30, 2010<br />
REVENUES:<br />
Variance<br />
Original Final Positive<br />
Budget Budget Actual (Negative)<br />
Revenue from other agencies $ 850,000 $ 800,000 $ 629,136 $ (170,864)<br />
Current fees and services 124,000 100,000 81,664 (18,336)<br />
Total Revenues 974,000 900,000 710,800 (189,200)<br />
EXPENDITURES:<br />
Current:<br />
Community Development 1,450,000 1,450,000 1,267,027 182,973<br />
Total Expenditures 1,450,000 1,450,000 1,267,027 182,973<br />
REVENUES OVER (UNDER) EXPENDITURES (476,000) (550,000) (556,227) (6,227)<br />
OTHER FINANCING SOURCES (USES):<br />
Transfers in 476,000 541,970 548,197 6,227<br />
Total Other Financing Sources (Uses) 476,000 541,970 548,197 6,227<br />
NET CHANGE IN FUND BALANCE - (8,030) (8,030) -<br />
FUND BALANCE:<br />
Beginning <strong>of</strong> Year 8,030 8,030 8,030 -<br />
End <strong>of</strong> Year $ 8,030 $ - $ - $<br />
-<br />
96
<strong>City</strong> <strong>of</strong> <strong>Cerritos</strong><br />
Schedule <strong>of</strong> Revenues, Expenditures and Changes in Fund Balance - Budget and Actual<br />
Assessment District #6 Special Revenue Fund<br />
For the Year Ended June 30, 2010<br />
REVENUES:<br />
Variance<br />
Original Final Positive<br />
Budget Budget Actual (Negative)<br />
Investment and rental income $ 925 $ 860 $ 2,372 $ 1,512<br />
Revenues from other agencies 10,000 26,180 29,625 3,445<br />
Total Revenues 10,925 27,040 31,997 4,957<br />
EXPENDITURES:<br />
Current:<br />
Administrative Services 12,600 11,980 11,170 810<br />
Total Expenditures 12,600 11,980 11,170 810<br />
REVENUES OVER (UNDER) EXPENDITURES (1,675) 15,060 20,827 5,767<br />
FUND BALANCE:<br />
Beginning <strong>of</strong> Year 89,815 89,815 89,815 -<br />
End <strong>of</strong> Year $ 88,140 $ 104,875 $ 110,642 $ 5,767<br />
97
<strong>City</strong> <strong>of</strong> <strong>Cerritos</strong><br />
Schedule <strong>of</strong> Revenues, Expenditures and Changes in Fund Balance - Budget and Actual<br />
Los Coyotes Lighting District Special Revenue Fund<br />
For the Year Ended June 30, 2010<br />
REVENUES:<br />
Variance<br />
Original Final Positive<br />
Budget Budget Actual (Negative)<br />
Revenues from other agencies $ 690,000 $ 734,855 $ 746,438 $ 11,583<br />
Other revenues 107,000 109,185 109,183 (2)<br />
Total Revenues 797,000 844,040 855,621 11,581<br />
EXPENDITURES:<br />
Current:<br />
Public Works 895,040 1,020,410 1,153,030 (132,620)<br />
Administrative Services 124,500 120,750 116,460 4,290<br />
Total Expenditures 1,019,540 1,141,160 1,269,490 (128,330)<br />
REVENUES OVER (UNDER) EXPENDITURES (222,540) (297,120) (413,869) (116,749)<br />
OTHER FINANCING SOURCES (USES):<br />
Transfers in 222,540 260,341 372,110 111,769<br />
Total Other Financing Sources (Uses) 222,540 260,341 372,110 111,769<br />
NET CHANGE IN FUND BALANCE - (36,779) (41,759) (4,980)<br />
FUND BALANCE (DEFICIT):<br />
Beginning <strong>of</strong> Year 36,779 36,779 36,779 -<br />
End <strong>of</strong> Year $ 36,779 $ - $ (4,980) $ (4,980)<br />
98
<strong>City</strong> <strong>of</strong> <strong>Cerritos</strong><br />
Schedule <strong>of</strong> Revenues, Expenditures and Changes in Fund Balance - Budget and Actual<br />
Local Law Enforcement Grants Special Revenue Fund<br />
For the Year Ended June 30, 2010<br />
REVENUES:<br />
Variance<br />
Original Final Positive<br />
Budget Budget Actual (Negative)<br />
Investment and rental income $ 2,000 $ 2,000 $ 2,454 $ 454<br />
Total Revenues 2,000 2,000 2,454 454<br />
EXPENDITURES:<br />
Current:<br />
Community and Safety Services 12,560 (12,560)<br />
Total Expenditures - - 12,560 (12,560)<br />
REVENUES OVER (UNDER) EXPENDITURES 2,000 2,000 (10,106) (12,106)<br />
OTHER FINANCING SOURCES (USES):<br />
Transfers out (2,000) (2,000) - 2,000<br />
Total Other Financing Sources (Uses) (2,000) (2,000) - 2,000<br />
NET CHANGE IN FUND BALANCE - - (10,106) (10,106)<br />
FUND BALANCE:<br />
Beginning <strong>of</strong> Year 115,311 115,311 115,311 -<br />
End <strong>of</strong> Year $ 115,311 $ 115,311 $ 105,205 $ (10,106)<br />
99
<strong>City</strong> <strong>of</strong> <strong>Cerritos</strong><br />
Schedule <strong>of</strong> Revenues, Expenditures and Changes in Fund Balance - Budget and Actual<br />
COPS Grants Special Revenue Fund<br />
For the Year Ended June 30, 2010<br />
REVENUES:<br />
Variance<br />
Original Final Positive<br />
Budget Budget Actual (Negative)<br />
Investment and rental income $ 375 $ 375 $ 1,079 $ 704<br />
Revenues from other agencies 100,000 100,000 122,043 22,043<br />
Total Revenues 100,375 100,375 123,122 22,747<br />
EXPENDITURES:<br />
Current:<br />
Community and Safety Services - - 122,044 (122,044)<br />
Total Expenditures - - 122,044 (122,044)<br />
REVENUES OVER (UNDER) EXPENDITURES 100,375 100,375 1,078 (99,297)<br />
OTHER FINANCING SOURCES (USES):<br />
Transfers out (101,000) (100,000) - 100,000<br />
Total Other Financing Sources (Uses) (101,000) (100,000) - 100,000<br />
NET CHANGE IN FUND BALANCE (625) 375 1,078 703<br />
FUND BALANCE:<br />
Beginning <strong>of</strong> Year 19,040 19,040 19,041 -<br />
End <strong>of</strong> Year $ 18,415 $ 19,415 $ 20,119 $ 703<br />
100
<strong>City</strong> <strong>of</strong> <strong>Cerritos</strong><br />
Schedule <strong>of</strong> Revenues, Expenditures and Changes in Fund Balance - Budget and Actual<br />
Library Grants Special Revenue Fund<br />
For the Year Ended June 30, 2010<br />
REVENUES:<br />
Variance<br />
Original Final Positive<br />
Budget Budget Actual (Negative)<br />
Investment and rental income $ - $ - $ 32 $<br />
32<br />
Revenues from other agencies 38,700 22,000 22,582 582<br />
Total Revenues 38,700 22,000 22,614 614<br />
EXPENDITURES:<br />
Current:<br />
Administrative Services 22,582 (22,582)<br />
Total Expenditures - - 22,582 (22,582)<br />
REVENUES OVER (UNDER) EXPENDITURES 38,700 22,000 32 (21,968)<br />
OTHER FINANCING SOURCES (USES):<br />
Transfers out (38,700) (22,133) - 22,133<br />
Total Other Financing Sources (Uses) (38,700) (22,133) - 22,133<br />
NET CHANGE IN FUND BALANCE - (133) 32 165<br />
FUND BALANCE:<br />
Beginning <strong>of</strong> Year 133 133 133 -<br />
End <strong>of</strong> Year $ 133 $ - $ 165 $ 165<br />
101
<strong>City</strong> <strong>of</strong> <strong>Cerritos</strong><br />
Schedule <strong>of</strong> Revenues, Expenditures and Changes in Fund Balance - Budget and Actual<br />
Environmental Grants Special Revenue Fund<br />
For the Year Ended June 30, 2010<br />
REVENUES:<br />
Variance from<br />
Final Budget<br />
Original Final Positive<br />
Budget Budget Actual (Negative)<br />
Investment and rental income $ 2,120 $ 2,000 $ 2,437 $ 437<br />
Revenues from other agencies 29,000 9,000 22,353 13,353<br />
Total Revenues 31,120 11,000 24,790 13,790<br />
EXPENDITURES:<br />
Current:<br />
Public Works - - 22,353 (22,353)<br />
Total Expenditures - - 22,353 (22,353)<br />
REVENUES OVER (UNDER) EXPENDITURES 31,120 11,000 2,437 (8,563)<br />
OTHER FINANCING SOURCES (USES):<br />
Transfers out (31,770) (31,770) - 31,770<br />
Total Other Financing Sources (Uses) (31,770) (31,770) - 31,770<br />
NET CHANGE IN FUND BALANCE (650) (20,770) 2,437 23,207<br />
FUND BALANCE:<br />
Beginning <strong>of</strong> Year 108,705 108,705 108,705 -<br />
End <strong>of</strong> Year $ 108,055 $ 87,935 $ 111,142 $ 23,207<br />
102
<strong>City</strong> <strong>of</strong> <strong>Cerritos</strong><br />
Schedule <strong>of</strong> Revenues, Expenditures and Changes in Fund Balance - Budget and Actual<br />
AQMD Special Revenue Fund<br />
For the Year Ended June 30, 2010<br />
REVENUES:<br />
Variance<br />
Original Final Positive<br />
Budget Budget Actual (Negative)<br />
Investment and rental income $ 4,150 $ 5,500 $ 5,480 $ (20)<br />
Revenues from other agencies 67,000 60,000 46,985 (13,015)<br />
Total Revenues 71,150 65,500 52,465 (13,035)<br />
EXPENDITURES:<br />
Current:<br />
Community Development 29,890 45,080 36,895 8,185<br />
Administrative Services 3,150 2,990 700 2,290<br />
Total Expenditures 33,040 48,070 37,595 10,475<br />
REVENUES OVER (UNDER) EXPENDITURES 38,110 17,430 14,870 (2,560)<br />
FUND BALANCE:<br />
Beginning <strong>of</strong> Year 240,973 240,973 240,973 -<br />
End <strong>of</strong> Year $ 279,083 $ 258,403 $ 255,843 $ (2,560)<br />
103
<strong>City</strong> <strong>of</strong> <strong>Cerritos</strong><br />
Schedule <strong>of</strong> Revenues, Expenditures and Changes in Fund Balance - Budget and Actual<br />
Measure "R" Special Revenue Fund<br />
For the Year Ended June 30, 2010<br />
REVENUES:<br />
Variance<br />
Original Final Positive<br />
Budget Budget Actual (Negative)<br />
Investment and rental income $ - $ - $ 4,667 $ 4,667<br />
Revenues from other agencies 282,580 282,580 348,431 65,851<br />
Total Revenues 282,580 282,580 353,098 70,518<br />
EXPENDITURES:<br />
Capital outlay - - 52,739 (52,739)<br />
Total Expenditures - - 52,739 (52,739)<br />
REVENUES OVER (UNDER) EXPENDITURES 282,580 282,580 300,359 17,779<br />
FUND BALANCE:<br />
Beginning <strong>of</strong> Year - - - -<br />
End <strong>of</strong> Year $ 282,580 $ 282,580 $ 300,359 $ 17,779<br />
104
INTERNAL SERVICE FUNDS<br />
Equipment Replacement Fund - to account for the regular maintenance and replacement <strong>of</strong> the <strong>City</strong>’s capital<br />
equipment and <strong>of</strong>fice equipment inventory and to accumulate funds necessary for equipment replacement.<br />
105
<strong>City</strong> <strong>of</strong> <strong>Cerritos</strong><br />
Statement <strong>of</strong> Net Assets<br />
Internal Service Funds<br />
June 30, 2010<br />
Equipment<br />
Replacement<br />
ASSETS<br />
Current assets:<br />
Cash and investments $ 15,501,407<br />
Interest receivables 35,978<br />
Total Assets 15,537,385<br />
LIABILITIES<br />
Current Liabilities:<br />
Accounts payable 44,070<br />
Total Liabilities 44,070<br />
NET ASSETS<br />
Unrestricted 15,493,315<br />
Total Net Assets $ 15,493,315<br />
106
<strong>City</strong> <strong>of</strong> <strong>Cerritos</strong><br />
Statement <strong>of</strong> Revenues, Expenses and Changes in Net Assets<br />
Internal Service Funds<br />
For the Year Ended June 30, 2010<br />
Equipment<br />
Replacement<br />
OPERATING EXPENSES:<br />
Administrative costs $ 745,760<br />
Total Operating Expenses 745,760<br />
OPERATING INCOME (LOSS) (745,760)<br />
NONOPERATING REVENUES (EXPENSES):<br />
Interest income 344,810<br />
Total Nonoperating Revenues (Expenses) 344,810<br />
CHANGE IN NET ASSETS (400,950)<br />
NET ASSETS:<br />
Beginning <strong>of</strong> Year 15,894,265<br />
End <strong>of</strong> Year $ 15,493,315<br />
107
<strong>City</strong> <strong>of</strong> <strong>Cerritos</strong><br />
Statement <strong>of</strong> Cash Flows<br />
Internal Service Funds<br />
For the Year Ended June 30, 2010<br />
Equipment<br />
Replacement<br />
CASH FLOWS FROM OPERATING ACTIVITIES:<br />
Cash paid to other suppliers <strong>of</strong> goods or services $ (416,000)<br />
Cash paid to employees (285,690)<br />
Net Cash Provided by (Used for) Operating Activities (701,690)<br />
CASH FLOWS FROM INVESTING ACTIVITIES:<br />
Interest income received 308,832<br />
Net Cash Provided by (Used for) Investing Activities 308,832<br />
Net Increase (Decrease) in Cash and Cash Equivalents (392,858)<br />
CASH AND CASH EQUIVALENTS:<br />
Beginning <strong>of</strong> Year 15,894,265<br />
End <strong>of</strong> Year $ 15,501,407<br />
RECONCILIATION OF OPERATING INCOME (LOSS) TO NET<br />
CASH PROVIDED BY (USED FOR) OPERATING ACTIVITIES:<br />
Operating income (loss) $ (745,760)<br />
Adjustments to reconcile operating income to net cash<br />
provided by (used for) operating activities:<br />
Change in assets and liabilities:<br />
Increase (decrease) in accounts payable 44,070<br />
Total Adjustments 44,070<br />
Net Cash Provided by (Used for) Operating Activities $ (701,690)<br />
108
STATISTICAL SECTION<br />
(Unaudited)<br />
This part <strong>of</strong> the <strong>City</strong> <strong>of</strong> <strong>Cerritos</strong>'s comprehensive annual financial report presents detailed information as a context for<br />
understanding what the information in the financial statements, note disclosures, and required supplementary<br />
information says about the <strong>City</strong>'s overall financial health.<br />
Contents<br />
Page<br />
<strong>Financial</strong> Trends 110<br />
These tables contain trend information to help the reader understand how the <strong>City</strong>'s financial<br />
performance and well-being have changed over time.<br />
Revenue Capacity 122<br />
These tables contain information to help the reader assess the <strong>City</strong>'s most significant local<br />
revenue source, the property tax.<br />
Debt Capacity 128<br />
These tables present information to help the reader assess the affordability <strong>of</strong> the <strong>City</strong>'s current<br />
levels <strong>of</strong> outstanding debt and the <strong>City</strong>'s ability to issue additional debt in the future.<br />
Demographic and Economic Information 134<br />
These tables <strong>of</strong>fer demographic and economic indicators to help the reader understand the<br />
environment within which the <strong>City</strong>'s financial activities take place.<br />
Operating Information 136<br />
These tables contain service and infrastructure data to help the reader understand how the<br />
information in the <strong>City</strong>'s financial report relates to the services the <strong>City</strong> provides and the<br />
activities it performs.<br />
Sources:<br />
Unless otherwise noted, the information in these tables is derived from the<br />
comprehensive annual financial reports for the relevant year.<br />
109
<strong>City</strong> <strong>of</strong> <strong>Cerritos</strong><br />
Net Assets By Component<br />
Last Eight Fiscal Years<br />
(accrual basis <strong>of</strong> accounting)<br />
Fiscal Year<br />
2002-03 2003-04 2004-05 2005-06<br />
Governmental Activities:<br />
Invested in capital assets, net <strong>of</strong> related debt $ 83,888,493 $ 121,366,767 $ 128,354,981 $ 124,591,591<br />
Restricted For:<br />
Special revenue 8,063,081 6,245,154 6,587,749 7,143,179<br />
Street and sewer related purposes - - - -<br />
Transportation related purposes - - - -<br />
Assessment districts - - - -<br />
Miscellaneous grants - - - -<br />
Asset replacement - 14,308,312 15,072,026 14,900,417<br />
Other post employment benefits - - - -<br />
Unrestricted 215,788,662 156,663,276 152,914,279 144,717,403<br />
Total governmental activities net assets 307,740,236 298,583,509 302,929,035 291,352,590<br />
Business-type Activities:<br />
Invested in capital assets, net <strong>of</strong> related debt 29,922,954 29,578,894 31,835,092 42,440,170<br />
Unrestricted 20,818,339 19,195,242 18,232,852 15,685,283<br />
Total business-type activities net assets 50,741,293 48,774,136 50,067,944 58,125,453<br />
Primary Government:<br />
Invested in capital assets, net <strong>of</strong> related debt 113,811,447 150,945,661 160,190,073 167,031,761<br />
Restricted For:<br />
Special revenue 8,063,081 6,245,154 6,587,749 7,143,179<br />
Street and sewer related purposes - - - -<br />
Transportation related purposes - - - -<br />
Assessment districts - - - -<br />
Miscellaneous grants - - - -<br />
Asset replacement - 14,308,312 15,072,026 14,900,417<br />
Other post employment benefits - - - -<br />
Unrestricted 236,607,001 175,858,518 171,147,131 160,402,686<br />
Total primary government net assets $ 358,481,529 $ 347,357,645 $ 352,996,979 $ 349,478,043<br />
The <strong>City</strong> has elected to show only eight years <strong>of</strong> data for this schedule coinciding with the implementation <strong>of</strong> GASB 34 in fiscal year 2002-2003.<br />
Information prior to implementation <strong>of</strong> GASB 34 is not available.<br />
Source: Finance Division, <strong>City</strong> <strong>of</strong> <strong>Cerritos</strong><br />
110
Fiscal Year<br />
2006-07 2007-08 2008-09 2009-10<br />
$ 123,877,356 $ 112,701,038 $ 108,311,131 $ 129,318,648<br />
6,663,515 - - -<br />
- 6,498,583 6,271,895 4,423,142<br />
- 1,368,331 1,065,555 1,254,083<br />
- 77,532 126,594 105,662<br />
- 239,106 484,163 492,474<br />
13,595,796 28,582,731 24,966,400 25,275,197<br />
- 14,000,000 - -<br />
156,184,426 143,862,339 158,317,863 127,557,614<br />
300,321,093 307,329,660 299,543,601 288,426,820<br />
28,761,072 30,454,814 41,912,421 40,406,258<br />
13,011,620 9,099,926 2,164,728 (1,319,738)<br />
41,772,692 39,554,740 44,077,149 39,086,520<br />
152,638,428 143,155,852 150,223,552 169,724,906<br />
6,663,515 - - -<br />
- 6,498,583 6,271,895 4,423,142<br />
- 1,368,331 1,065,555 1,254,083<br />
- 77,532 126,594 105,662<br />
- 239,106 484,163 492,474<br />
13,595,796 28,582,731 24,966,400 25,275,197<br />
- 14,000,000 - -<br />
169,196,046 152,962,265 160,482,591 126,237,876<br />
$ 342,093,785 $ 346,884,400 $ 343,620,750 $ 327,513,340<br />
111
<strong>City</strong> <strong>of</strong> <strong>Cerritos</strong><br />
Changes In Net Assets<br />
Last Eight Fiscal Years<br />
(accrual basis <strong>of</strong> accounting)<br />
Fiscal Year<br />
2002-03 2003-04 2004-05 2005-06<br />
Expenses:<br />
Governmental activities:<br />
GLegislative and administrative $ 9,612,757 $ 10,849,842 $ 12,317,585 $ 5,137,856<br />
LCommunity development 6,411,921 3,594,264 4,696,912 3,461,730<br />
TPublic works 23,421,916 20,268,011 19,420,947 17,574,984<br />
Water and power - - - -<br />
PCommunity and safety services 18,281,998 22,430,205 18,769,565 20,107,426<br />
DAdministrative services 14,664,165 13,789,588 13,570,397 25,390,327<br />
E<strong>Cerritos</strong> Center for the Performing Arts 14,526,215 14,021,467 12,661,796 13,166,416<br />
HUnallocated infrastructure depreciation 870,960 924,241 913,887 1,017,027<br />
Land transferred to developer - - - 1,752,597<br />
IInterest expense 16,784,520 16,187,807 15,952,869 16,189,176<br />
Total governmental activities expenses 104,574,452 102,065,425 98,303,958 103,797,539<br />
Business-type activities:<br />
Water 8,461,281 8,120,758 8,369,176 9,153,710<br />
Reclaimed water 1,007,903 1,434,632 796,974 1,541,594<br />
WElectric utility - 54,352 227,238 7,076,232<br />
Total business-type activities net assets 9,469,184 9,609,742 9,393,388 17,771,536<br />
Total primary government expenses $ 114,043,636 $ 111,675,167 $ 107,697,346 $ 121,569,075<br />
Program revenues:<br />
Governmental activities:<br />
Charges for services:<br />
Legislative and administrative $ 3,113 $ 15,290 $ 145 $ 1,536<br />
Community development 1,608,929 1,685,361 1,849,001 1,861,055<br />
Public works 555,720 649,676 725,501 759,197<br />
Water and power - - - -<br />
Community and cultural services 2,359,547 2,759,291 2,855,197 2,943,514<br />
Administrative services 2,744,760 2,917,003 3,248,205 3,059,380<br />
<strong>Cerritos</strong> Center for the Performing Arts 6,502,960 5,172,658 5,532,468 5,683,029<br />
Operating grants and contributions 8,642,059 7,805,246 7,474,648 8,324,225<br />
Capital grants and contributions - 106,620 82,317 352,285<br />
Total governmental activities program revenues 22,417,088 21,111,145 21,767,482 22,984,221<br />
Business-type activities:<br />
Charges for services:<br />
Water 5,796,613 6,199,207 6,855,422 7,832,449<br />
Reclaimed water 580,307 484,908 748,555 540,922<br />
Electric utility - - - 5,171,744<br />
Capital grants and contributions 341,898 253,637 2,479,163 36,978<br />
Total business-type activities program revenues 6,718,818 6,937,752 10,083,140 13,582,093<br />
Total primary government program revenues $ 29,135,906 $ 28,048,897 $ 31,850,622 $ 36,566,314<br />
Net revenue (expense):<br />
Governmental activities $ (82,157,364) $ (80,954,280) $ (76,536,476) $ (80,813,318)<br />
Business-type activities (2,750,366) (2,671,990) 689,752 (4,189,443)<br />
Total primary government net expense $ (84,907,730) $ (83,626,270) $ (75,846,724) $ (85,002,761)<br />
The <strong>City</strong> has elected to show only eight years <strong>of</strong> data for this schedule coinciding with the implementation <strong>of</strong> GASB 34 in<br />
fiscal year 2002-2003.<br />
Information prior to implementation <strong>of</strong> GASB 34 is not available.<br />
Source: Finance Division, <strong>City</strong> <strong>of</strong> <strong>Cerritos</strong><br />
112
Fiscal Year<br />
2006-07 2007-08 2008-09 2009-10<br />
$ 9,586,244 $ 10,763,138 $ 12,202,801 $ 24,016,676<br />
7,974,456 7,944,431 7,512,609 9,634,162<br />
21,644,742 21,251,184 23,981,467 17,574,871<br />
183,723 166,380 1,456,670 503,095<br />
21,788,095 21,553,201 24,661,818 23,219,777<br />
14,898,470 13,740,128 16,536,088 12,431,539<br />
12,309,527 12,950,937 12,613,288 10,795,353<br />
977,568 1,010,465 994,414 1,058,317<br />
- - - -<br />
16,857,542 16,686,433 16,811,036 16,114,428<br />
106,220,367 106,066,297 116,770,191 115,348,218<br />
9,633,874 10,249,111 9,034,371 9,690,959<br />
1,163,206 1,384,725 1,338,743 1,351,283<br />
8,390,869 9,064,917 9,189,345 6,524,284<br />
19,187,949 20,698,753 19,562,459 17,566,526<br />
$ 125,408,316 $ 126,765,050 $ 136,332,650 $ 132,914,744<br />
$ 5,401 $ 7,975 $ 24,123 $ 8,990<br />
2,059,152 2,530,848 1,151,681 1,472,210<br />
776,251 809,946 974,575 924,062<br />
- - - 8,200<br />
2,926,171 3,069,657 3,693,983 3,724,638<br />
3,078,915 1,949,196 1,421,710 1,313,723<br />
6,269,387 6,249,316 5,267,804 4,620,793<br />
9,247,019 8,954,724 9,954,624 11,297,870<br />
101,281 472,220 176,995 613,790<br />
24,463,577 24,043,882 22,665,495 23,984,276<br />
8,577,571 8,766,259 7,371,339 7,032,634<br />
852,558 886,454 902,348 698,021<br />
7,068,193 7,517,818 7,040,943 4,637,710<br />
125,020 888,011 135,613 109,677<br />
16,623,342 18,058,542 15,450,243 12,478,042<br />
$ 41,086,919 $ 42,102,424 $ 38,115,738 $ 36,462,318<br />
$ (81,756,790) $ (82,022,415) $ (94,104,696) $ (91,363,942)<br />
(2,564,607) (2,640,211) (4,112,216) (5,088,484)<br />
$ (84,321,397) $ (84,662,626) $ (98,216,912) $ (96,452,426)<br />
113
<strong>City</strong> <strong>of</strong> <strong>Cerritos</strong><br />
Change in Net Assets<br />
Last Eight Fiscal Years<br />
(accrual basis <strong>of</strong> accounting)<br />
(Continued)<br />
Fiscal Year<br />
2002-03 2003-04 2004-05 2005-06<br />
General revenues and other changes in net assets:<br />
Governmental Activities:<br />
Taxes:<br />
Sales taxes $ 26,279,631 $ 26,540,867 $ 27,288,347 $ 26,136,953<br />
Property taxes in lieu <strong>of</strong> sales taxes 27,469,285 27,036,204 28,931,093 32,938,305<br />
Motor vehicle taxes 3,291,867 3,732,692 3,570,211 4,026,334<br />
Franchise taxes 1,011,506 1,123,865 1,072,893 1,146,323<br />
Transient occupancy taxes 294,792 312,177 423,239 443,467<br />
Other taxes 188,127 284,405 249,160 272,498<br />
Investment and rental income 19,600,776 12,685,570 17,236,176 18,353,462<br />
Miscellaneous 588,745 175,006 104,209 24,664<br />
Transfers (128,299) (93,233) - (133)<br />
Total governmental activities 78,596,430 71,797,553 78,875,328 83,341,873<br />
Business-type activities:<br />
Investment and rental income 1,110,441 611,600 604,056 529,425<br />
Gain (loss) on sale <strong>of</strong> assets (81,045) - - -<br />
Miscellaneous 2,387,606 - - -<br />
Transfers 128,299 93,233 - 133<br />
Total business-type activities 3,545,301 704,833 604,056 529,558<br />
Total primary government $ 82,141,731 $ 72,502,386 $ 79,479,384 $ 83,871,431<br />
Changes in net assets:<br />
Governmental activities $ (3,560,934) $ (9,156,727) $ 2,338,852 $ 2,528,555<br />
Business-type activities 794,935 (1,967,157) 1,293,808 (3,659,885)<br />
Total primary government $ (2,765,999) $ (11,123,884) $ 3,632,660 $ (1,131,330)<br />
The <strong>City</strong> has elected to show only eight years <strong>of</strong> data for this schedule coinciding with the implementation <strong>of</strong> GASB 34<br />
in fiscal year 2002-2003. Information prior to implementation <strong>of</strong> GASB 34 is not available.<br />
Source: Finance Division, <strong>City</strong> <strong>of</strong> <strong>Cerritos</strong><br />
114
Fiscal Year<br />
2006-07 2007-08 2008-09 2009-10<br />
$ 26,680,643 $ 25,083,985 $ 20,602,899 $ 17,166,138<br />
32,293,806 35,005,279 36,392,537 34,842,837<br />
4,146,681 4,210,900 4,446,679 4,382,067<br />
1,341,635 1,418,403 1,507,105 1,498,545<br />
474,297 481,880 394,290 356,119<br />
403,210 240,331 258,898 286,895<br />
25,200,318 22,483,705 18,318,651 20,581,624<br />
79,703 106,499 195,668 1,132,936<br />
105,000 - 4,201,910 -<br />
90,725,293 89,030,982 86,318,637 80,247,161<br />
546,768 422,259 142,035 97,855<br />
- - - -<br />
- - - -<br />
(105,000) - (4,201,910) -<br />
441,768 422,259 (4,059,875) 97,855<br />
$ 91,167,061 $ 89,453,241 $ 82,258,762 $ 80,345,016<br />
$ 8,968,503 $ 7,008,567 $ (7,786,059) $ (11,116,781)<br />
(2,122,839) (2,217,952) (8,172,091) (4,990,629)<br />
$ 6,845,664 $ 4,790,615 $ (15,958,150) $ (16,107,410)<br />
115
<strong>City</strong> <strong>of</strong> <strong>Cerritos</strong><br />
Fund Balances <strong>of</strong> Governmental Funds<br />
Last Eight Fiscal Years<br />
(modified accrual basis <strong>of</strong> accounting)<br />
Fiscal Year<br />
2002-03 2003-04 2004-05 2005-06<br />
General fund:<br />
Reserved $ 8,033,673 $ 76,071,914 $ 76,993,950 $ 91,500,873<br />
Unreserved 182,507,752 111,105,238 113,993,942 97,162,922<br />
Total general fund $ 190,541,425 $ 187,177,152 $ 190,987,892 $ 188,663,795<br />
All other governmental funds:<br />
Reserved $ 4,020,515 $ 3,865,603 $ 3,967,607 $ 4,999,544<br />
Unreserved, reported in:<br />
Special revenue funds 8,063,081 6,245,154 6,587,749 7,143,179<br />
Debt service funds (23,317,416) (23,790,958) (25,644,125) (31,728,190)<br />
Capital projects funds 30,200,811 26,022,565 21,623,936 20,171,114<br />
Total all other governmental funds $ 18,966,991 $ 12,342,364 $ 6,535,167 $ 585,647<br />
The <strong>City</strong> has elected to show only eight years <strong>of</strong> data for this schedule coinciding with the implementation <strong>of</strong> GASB 34 in fiscal<br />
year 2002-2003.<br />
Source: Finance Division, <strong>City</strong> <strong>of</strong> <strong>Cerritos</strong><br />
116
Fiscal Year<br />
2006-07 2007-08 2008-09 2009-10<br />
$ 92,579,824 $ 98,193,022 $ 99,903,724 $ 102,622,950<br />
101,236,061 81,992,326 81,541,328 80,477,124<br />
$ 193,815,885 $ 180,185,348 $ 181,445,052 $ 183,100,074<br />
$ 4,095,975 $ 2,837,221 $ 5,851,972 $ 1,953,330<br />
6,663,515 8,183,552 7,849,641 6,275,361<br />
(47,251,487) (45,566,239) (43,171,702) (66,053,156)<br />
34,522,333 21,762,988 19,212,994 23,322,838<br />
$ (1,969,664) $ (12,782,478) $ (10,257,095) $ (34,501,627)<br />
117
<strong>City</strong> <strong>of</strong> <strong>Cerritos</strong><br />
Changes in Fund Balances <strong>of</strong> Governmental Fund<br />
Last Eight Fiscal Years<br />
(modified accrual basis <strong>of</strong> accounting)<br />
Fiscal Years<br />
2002-03 2003-04 2004-05 2005-06<br />
Revenues:<br />
Taxes $ 54,231,835 $ 54,173,653 $ 56,891,838 $ 58,539,846<br />
Licenses and permits 1,582,962 1,620,309 1,673,017 1,844,753<br />
Fines and forfeitures 780,388 1,154,385 1,224,282 1,207,626<br />
Investment and rental income 18,862,717 12,260,022 16,749,519 17,847,889<br />
Market value investment fluctuation - - - -<br />
Revenues from other agencies 12,253,101 11,102,756 11,948,199 14,104,013<br />
Current fees and services 10,648,407 9,549,672 10,197,847 10,333,249<br />
Franchises 1,011,506 1,123,865 1,072,893 1,146,324<br />
Other revenue 949,829 636,494 1,269,811 748,401<br />
Total revenues 100,320,745 91,621,156 101,027,406 105,772,101<br />
Expenditures:<br />
Current:<br />
Legislative and administrative 8,575,389 10,333,065 11,657,197 4,098,818<br />
Community development 4,033,261 3,316,869 4,122,251 4,607,205<br />
Public works 17,727,961 17,492,649 18,056,952 19,659,561<br />
Water and power - - - -<br />
Community and safety services 15,989,974 18,074,542 17,877,074 18,740,162<br />
Administrative services 10,457,027 10,691,994 10,520,783 20,349,051<br />
<strong>Cerritos</strong> Center for the Performing Arts 12,130,813 12,326,532 10,966,179 10,331,228<br />
Land transferred to developer - - - -<br />
Capital outlay 17,259,976 8,581,890 8,661,850 15,495,350<br />
Prefund other post employment benefits obligation - - - -<br />
Debt service:<br />
Principal retirement 2,855,000 4,200,000 4,725,000 5,105,000<br />
Interest 15,021,364 16,404,229 16,099,412 16,341,796<br />
Bond issuance costs 2,212,463 - - -<br />
Total expenditures 106,263,228 101,421,770 102,686,698 114,728,171<br />
Excess <strong>of</strong> revenues over<br />
(under) expenditures (5,942,483) (9,800,614) (1,659,292) (8,956,070)<br />
Other Financing Sources (Uses):<br />
Transfers in 54,542,346 12,234,072 10,558,209 19,901,653<br />
Transfers out (54,753,609) (12,422,358) (10,895,374) (20,244,200)<br />
Issuance <strong>of</strong> debt 121,426,395 - - 1,025,000<br />
Payment to refunding bond escrow agent (53,478,228) - - -<br />
Total other financing sources (uses) 67,736,904 (188,286) (337,165) 682,453<br />
Net change in fund balances 61,794,421 (9,988,900) (1,996,457) (8,273,617)<br />
Fund balances - July 1 147,713,995 209,508,416 199,519,516 197,523,059<br />
Fund balances - June 30 $ 209,508,416 $ 199,519,516 $ 197,523,059 $ 189,249,442<br />
Debt service as a percentage<br />
<strong>of</strong> noncapital expenditures 22.57% 22.19% 22.15% 21.61%<br />
The <strong>City</strong> has elected to show only eight years <strong>of</strong> data for this schedule coinciding with the implementation <strong>of</strong> GASB 34 in fiscal year 2002-2003.<br />
Source: Finance Division, <strong>City</strong> <strong>of</strong> <strong>Cerritos</strong><br />
118
Fiscal Years<br />
2006-07 2007-08 2008-09 2009-10<br />
$ 59,211,957 $ 61,019,400 $ 58,009,779 $ 52,651,959<br />
2,026,677 2,425,107 2,037,294 1,913,968<br />
1,178,472 1,162,016 1,146,489 1,103,441<br />
24,607,789 21,889,177 18,358,111 19,768,319<br />
- - - -<br />
13,904,277 13,907,020 15,161,460 16,614,010<br />
10,888,836 9,699,277 7,783,043 7,090,018<br />
1,341,635 1,418,403 1,507,105 1,504,852<br />
644,735 1,103,420 1,140,096 1,848,075<br />
113,804,378 112,623,820 105,143,377 102,494,642<br />
9,983,075 10,148,023 10,943,195 21,357,884<br />
5,992,210 4,851,226 5,042,844 4,657,802<br />
20,146,511 19,926,345 17,288,857 16,127,237<br />
143,296 164,016 299,790 105,823<br />
19,985,188 19,904,050 20,894,079 21,351,962<br />
11,719,308 12,322,795 11,495,344 10,646,488<br />
10,508,816 11,083,634 9,528,923 8,781,832<br />
- - - -<br />
8,457,564 21,081,472 6,695,801 18,533,849<br />
- 14,000,000 - -<br />
6,092,500 6,467,500 6,862,500 7,260,000<br />
17,018,816 16,851,905 16,508,867 16,261,275<br />
- - - -<br />
110,047,284 136,800,966 105,560,200 125,084,152<br />
3,757,094 (24,177,146) (416,823) (22,589,510)<br />
30,324,598 14,025,441 15,856,712 25,559,016<br />
(30,494,913) (14,291,646) (11,654,802) (25,559,016)<br />
- - - -<br />
- - - -<br />
(170,315) (266,205) 4,201,910 -<br />
3,586,779 (24,443,351) 3,785,087 (22,589,510)<br />
188,259,442 191,846,221 167,402,870 171,187,957<br />
$ 191,846,221 $ 167,402,870 $ 171,187,957 $ 148,598,447<br />
22.75% 20.15% 23.64% 21.46%<br />
119
<strong>City</strong> <strong>of</strong> <strong>Cerritos</strong><br />
Governmental Activities (1) Revenues by Sources<br />
Last Ten Fiscal Years<br />
Other<br />
Licenses<br />
Fiscal Sales Other Business Building and<br />
Year Tax Franchise Taxes Licenses Permits Permits<br />
2000-01 $ 26,516,264 $ 1,258,268 $ 23,432,771 $ 635,019 $ 863,334 $ 1,625<br />
2001-02 24,381,406 1,147,739 24,552,345 722,909 600,465 1,275<br />
2002-03 26,279,631 1,011,506 27,952,204 726,350 832,532 24,080<br />
2003-04 26,540,866 1,123,865 27,632,787 761,667 856,912 1,730<br />
2004-05 27,288,347 1,072,893 29,603,491 796,205 871,787 5,025<br />
2005-06 26,095,745 1,146,324 32,444,100 839,060 1,000,338 5,355<br />
2006-07 26,040,643 1,341,635 33,856,356 908,258 1,110,529 7,890<br />
2007-08 25,291,910 1,418,403 35,727,490 963,775 1,455,121 6,211<br />
2008-09 20,964,054 1,507,105 37,045,725 888,701 1,137,133 11,460<br />
2009-10 17,166,108 1,504,852 35,485,851 882,434 1,024,714 6,820<br />
(1) Includes General, Special Revenue, Debt Service, and Capital Projects funds.<br />
Source:<br />
Finance Division, <strong>City</strong> <strong>of</strong> <strong>Cerritos</strong><br />
120
Fines Investment Charges From<br />
and and Rental For Other<br />
Forfeitures Income Services Agencies Other Totals<br />
$ 779,610 $ 25,347,401 $ 10,532,162 $ 12,371,400 $ 1,295,588 $ 103,033,442<br />
791,270 20,771,225 10,802,271 11,564,242 668,114 96,003,261<br />
780,388 18,862,717 10,648,407 12,253,101 949,829 100,320,745<br />
1,154,385 12,260,022 9,549,672 11,102,756 636,494 91,621,156<br />
1,224,282 16,749,519 10,197,847 11,948,199 1,269,811 101,027,406<br />
1,207,626 17,847,889 10,333,249 14,104,013 748,402 105,772,101<br />
1,178,472 24,607,789 8,862,159 13,904,277 1,986,370 113,804,378<br />
1,162,016 21,889,177 9,699,277 13,907,020 1,103,420 112,623,820<br />
1,146,489 18,358,111 7,783,043 15,161,460 1,140,096 105,143,377<br />
1,103,441 19,768,319 7,090,018 16,614,010 1,848,075 102,494,642<br />
121
<strong>City</strong> <strong>of</strong> <strong>Cerritos</strong><br />
Assessed Value <strong>of</strong> Taxable Property<br />
Last Ten Fiscal Years<br />
Fiscal Year<br />
Category 2000-2001 2001-2002 2002-2003 2003-2004<br />
Residential $ 2,828,745,160 $ 3,004,053,067 $ 3,194,101,239 $ 3,417,442,052<br />
Commercial 711,425,050 734,796,343 779,666,425 941,597,239<br />
Industrial 561,808,382 569,466,932 596,087,183 624,825,548<br />
Government - - - -<br />
Institutional 9,552,077 12,520,302 8,535,262 8,681,377<br />
Irrigated - - - 306<br />
Miscellaneous 292 296 300 -<br />
Recreational - - 366,228 4,922,132<br />
Vacant land 25,962,553 39,367,468 27,410,710 12,789,464<br />
SBE nonunitary 1,541,234 1,590,716 1,614,284 1,853,601<br />
Possessory<br />
interest 2,005,443 2,442,550 2,993,961 4,919,537<br />
Unsecured 270,691,344 281,489,877 275,661,875 255,457,453<br />
Exempt (31,393,573) (32,010,938) (32,899,559) (29,673,960)<br />
Unknown 16,454,745 1,897,237 1,936,549 1,986,321<br />
Subtotal 4,396,792,707 4,615,613,850 4,855,474,457 5,244,801,070<br />
Add back<br />
exempt 31,393,573 32,010,938 32,899,559 29,673,960<br />
Grand Total $ 4,428,186,280 $ 4,647,624,788 $ 4,888,374,016 $ 5,274,475,030<br />
Total<br />
Direct Rate 0.60240% 0.59331% 0.59209% 0.60187%<br />
Source: HdL Coren & Cone<br />
122
Fiscal Year<br />
2004-2005 2005-2006 2006-2007 2007-2008 2008-2009 2009-2010<br />
$ 3,652,684,822 $ 3,925,932,025 $ 4,236,487,296 $ 4,492,069,661 $ 4,672,038,063 $ 4,539,269,735<br />
974,952,423 1,057,807,314 1,160,350,438 1,228,751,400 1,343,951,315 1,366,103,446<br />
654,396,867 685,464,066 708,718,893 757,782,869 908,573,269 952,870,116<br />
- - 2,750,027 - - -<br />
9,451,184 21,702,864 27,537,449 26,101,211 19,811,379 20,572,239<br />
- - - 328 334 340<br />
- - - - - -<br />
5,014,027 5,114,306 5,216,591 6,523,402 6,653,868 6,786,944<br />
9,366,646 10,224,697 8,462,513 9,684,651 8,777,294 5,495,684<br />
2,035,367 367 1,309,388 388 1,237,559 2,737,670 2,597,624 2,597,624<br />
4,678,298 4,717,568 6,518,019 5,849,466 14,163,200 13,854,359<br />
272,282,747 275,010,910 290,016,895 294,796,408 306,757,198 309,113,020<br />
(28,510,172) (29,083,529) (29,016,454) (30,799,948) (28,844,386) (39,947,438)<br />
2,023,708 2,064,175 2,105,454 - - -<br />
5,558,375,917 5,960,263,784 6,420,384,680 6,793,497,118 7,254,479,158 7,176,716,069<br />
28,510,172 29,083,529 29,016,454 30,799,948 28,844,386 39,947,438<br />
$ 5,586,886,089 $ 5,989,347,313 $ 6,449,401,134 $ 6,824,297,066 $ 7,283,323,544 $ 7,216,663,507<br />
0.56813% 0.58997% 0.59562% 0.59608% 0.59547% 0.48569%<br />
123
<strong>City</strong> <strong>of</strong> <strong>Cerritos</strong><br />
Direct and Overlapping Property Tax Rates<br />
(Per $100 <strong>of</strong> Taxable Value)<br />
Last Ten Fiscal Years<br />
Los<br />
Sanitation/<br />
Fiscal Basic Tax Angeles School Flood Water<br />
Year Levy County District Control District Totals<br />
2001 1.0000 .0013 .0257 .0016 .0088 1.0374<br />
2002 1.0000 .0011 .0250 .0005 .0077 1.0343<br />
2003 1.0000 .0010 .0278 .0009 .0067 1.0364<br />
2004 1.0000 .0010 .0249 .0005 .0067 1.0331<br />
2005 1.0000 .0010 .0457 .0002 .0058 1.0527<br />
2006 1.0000 .0010 .0517 .0001 .0052 1.0580<br />
2007 1.0000 .0010 .0482 .0001 .0047 1.0540<br />
2008 1.0000 .0000 .0351 .0000 .0045 1.0396<br />
2009 1.0000 .0000 .0338 .0000 .0043 1.0381<br />
2010 1.0000 .0000 .0455 .0000 .0043 1.0498<br />
Source: HdL Coren & Cone, Los Angeles County Auditor-Controller<br />
124
<strong>City</strong> <strong>of</strong> <strong>Cerritos</strong><br />
Ten Largest Secured Taxpayers<br />
Current Year and Nine Years Ago<br />
2009-10 2000-01<br />
Percentage<br />
Percentage<br />
Property Property Assessed <strong>of</strong> Assessed <strong>of</strong><br />
Owner Description Valuations Total (1) Valuations Total (1)<br />
Macerich <strong>Cerritos</strong> LLC Commercial $ 241,329,532<br />
3.34% $ - 0.00%<br />
Walton CWCA O'Donnell <strong>Cerritos</strong> Industrial 132,130,800 1.83% - 0.00%<br />
Maguire Partners, Inc Commercial 90,521,041 1.25% - 0.00%<br />
<strong>Cerritos</strong> Towne Center Commercial 73,117,209 1.01% - 0.00%<br />
<strong>Cerritos</strong> Office Center Commercial 64,891,280 0.90% - 0.00%<br />
<strong>Cerritos</strong> Best Plaza, LLC Commercial 63,484,626 0.88% - 0.00%<br />
TA Western LLC Industrial 60,185,083 0.83% - 0.00%<br />
<strong>Cerritos</strong> Corporate Tower LLP Commercial 49,050,000 0.68% - 0.00%<br />
<strong>Cerritos</strong> Promenade LLC Commercial 45,462,150 0.63% - 0.00%<br />
Bloomfield <strong>Cerritos</strong> Associates, LLC Commercial 43,730,000 0.61% - 0.00%<br />
Macerich <strong>Cerritos</strong> Commercial - 0.00% 95,214,523 2.29%<br />
Calwest Industries Properties Industrial - 0.00% 71,791,442 1.73%<br />
TA Western LLC Industrial - 0.00% 57,684,083 1.39%<br />
Commonwealth Cousins I LLC Office Building - 0.00% 56,753,600 1.37%<br />
Spieker Properties LLP Office Building - 0.00% 51,404,797 1.24%<br />
Vestar Development Office Building - 0.00% 41,871,325 1.01%<br />
Dayton Hudson Corp. Shopping Center - 0.00% 34,884,458 0.84%<br />
Makallon <strong>Cerritos</strong> Office Building Office Building - 0.00% 28,425,098 0.68%<br />
TIAA Realty Inc. Warehouse/Distributions - 0.00% 24,256,886 0.58%<br />
CWIP Corp Industrial - 0.00% 20,736,446 0.50%<br />
$ 863,901,721 11.97% $ 483,022,658 11.63%<br />
(1) 2009-10 and 2000-01 total secured assessed valuation is $ 7,216,663,507<br />
$ 4,155,953,702<br />
Source: HdL Coren & Cone<br />
125
<strong>City</strong> <strong>of</strong> <strong>Cerritos</strong><br />
Property Tax Levies and Collections<br />
Last Ten Fiscal Years<br />
Fiscal<br />
Year<br />
Property<br />
Tax<br />
Collections<br />
2000-01 $ 21,276,453<br />
2001-02 22,400,298<br />
2002-03 25,875,620<br />
2003-04 25,106,032<br />
2004-05 26,620,835<br />
2005-06 29,163,729<br />
2006-07 29,860,652<br />
2007-08 32,454,062<br />
2008-09 33,711,139<br />
2009-10 32,144,708<br />
Note: This table represents tax increment revenues received by the <strong>Cerritos</strong> Redevelopment Agency,<br />
representing the increase in valuation <strong>of</strong> the redevelopment project areas over the base year,<br />
1969-70. The <strong>City</strong> <strong>of</strong> <strong>Cerritos</strong> does not levy a direct property tax.<br />
Source:<br />
Finance Division, <strong>City</strong> <strong>of</strong> <strong>Cerritos</strong><br />
126
This page intentionally left blank.<br />
127
<strong>City</strong> <strong>of</strong> <strong>Cerritos</strong><br />
Ratios <strong>of</strong> Outstanding Debt by Type<br />
Last Eight Fiscal Years<br />
Governmental Activities<br />
Los Los Los<br />
<strong>Cerritos</strong> Coyotes <strong>Cerritos</strong><br />
Redevelopment Redevelopment Redevelopment<br />
Add (Less) Deferred Amounts<br />
Project Project Project Deferred<br />
Fiscal Revenue Revenue Note Bond Bond Charge on<br />
Year Bonds Bonds Payable Premium Discount Refunding<br />
2002-03 $ 50,380,000 $ 143,380,000 $ - $ 6,440,668 $ (1,294,336) $ (2,835,691)<br />
2003-04 48,900,000 140,660,000 - 6,133,969 (1,232,700) (2,693,906)<br />
2004-05 47,240,000 137,595,000 - 5,827,270 (1,171,064) (2,552,121)<br />
2005-06 48,978,750 144,856,250 1,025,000 5,520,571 (1,109,428) (2,410,336)<br />
2006-07 46,883,125 140,859,375 1,025,000 5,213,872 (1,047,792) (2,268,551)<br />
2007-08 44,651,250 136,623,750 1,025,000 4,907,173 (986,156) (2,126,766)<br />
2008-09 42,278,125 132,134,375 1,025,000 4,600,474 (924,520) (1,984,981)<br />
2009-10 39,763,125 127,389,375 1,025,000 4,293,775 (862,885) (1,843,196)<br />
Note: Details regarding the outstanding debt can be found<br />
in the notes to basic financial statements.<br />
(a) Not available.<br />
The <strong>City</strong> has elected to show only eight years <strong>of</strong> data for this<br />
schedule coinciding with the implementation <strong>of</strong> GASB 34 in<br />
fiscal year 2002-2003.<br />
Source: Finance Division, <strong>City</strong> <strong>of</strong> <strong>Cerritos</strong><br />
128
Total<br />
% <strong>of</strong><br />
Primary Total Debt Personal<br />
Government Population per Capita Income<br />
$ 196,070,641<br />
51,716 $ 3,791<br />
12.054%<br />
191,767,363 51,748 3,706 11.169%<br />
186,939,085 51,792 3,609 10.485%<br />
196,860,807 51,944 3,790 10.144%<br />
190,665,029 52,020 3,665 9.210%<br />
184,094,251 52,096 3,534 8.361%<br />
177,128,473 52,172 3,395 (a)<br />
169,765,194 52,249 3,249 (a)<br />
129
<strong>City</strong> <strong>of</strong> <strong>Cerritos</strong><br />
Schedule <strong>of</strong> Direct and Overlapping Bonded Debt<br />
June 30, 2010<br />
Percent<br />
Debt Balance Applicable <strong>City</strong>'s Share<br />
Outstanding to <strong>City</strong> <strong>of</strong> Debt<br />
*Metropolitan Water District $ 121,475,156<br />
0.463 % $<br />
562,371<br />
<strong>Cerritos</strong> CC DS 2004 Series 2004A 3,595,000 20.508 % 737,272<br />
<strong>Cerritos</strong> CC DS 2005 Refunding Bonds 22,875,994 20.508 % 4,691,466<br />
<strong>Cerritos</strong> CCD DS 2004 Series 2006 30,645,000 20.508 % 6,284,753<br />
<strong>Cerritos</strong> CCD DS 2004 Series 2009C 55,000,000 20.508 % 11,279,537<br />
ABC USD 2003 Refunding Bond Series A 26,820,000 59.735 % 16,020,877<br />
ABC Unified SD DS 1997 Series B 30,811,700 59.735 % 18,405,311<br />
Total Overlapping Debt: $<br />
57,981,587<br />
2009/10 Assessed Valuation: $3,990,830,863 After Deducting $3,225,832,644 Redevelopment Increment.<br />
Debt To Assessed Valuation Ratios: Direct Debt 0.00 %<br />
Overlapping Debt 1.45 %<br />
Total Debt 1.45 %<br />
Note: Prepared for the <strong>City</strong> <strong>of</strong> <strong>Cerritos</strong> by HdL Coren & Cone.<br />
130
This page intentionally left blank.<br />
131
<strong>City</strong> <strong>of</strong> <strong>Cerritos</strong><br />
Legal Debt Margin Information<br />
Last Eight Fiscal Years<br />
Fiscal Year<br />
2002-03 2003-04 2004-05 2005-06<br />
Debt Limit $ 738,016,496 $ 795,621,570 $ 842,826,108 $ 901,944,542<br />
Total net debt applicable to limit - - - -<br />
Legal debt margin $ 738,016,496 $ 795,621,570 $ 842,826,108 $ 901,944,542<br />
Total net debt applicable to the limit as a<br />
percent <strong>of</strong> debt limit 0.00% 0.00% 0.00% 0.00%<br />
Legal Debt Margin Calculation for Fiscal Year 2009-2010:<br />
Assessed value<br />
Add back: exempt real property<br />
Total assessed value<br />
Debt limit (15% <strong>of</strong> total assessed value)<br />
Debt applicable to limit<br />
Legal debt margin<br />
Note:<br />
Section 43605 <strong>of</strong> the Government Code <strong>of</strong> the State <strong>of</strong> California limits the amount <strong>of</strong> indebtedness for public<br />
improvements to 15% <strong>of</strong> the assessed valuation <strong>of</strong> all real and personal property <strong>of</strong> the <strong>City</strong>.<br />
The <strong>City</strong> has elected to show only eight years <strong>of</strong> data for this schedule coinciding with the implementation <strong>of</strong> GASB 34 in fiscal year<br />
year 2002-2003.<br />
Source: HdL Coren & Cone, Los Angeles County Assessors Office<br />
Finance Division, <strong>City</strong> <strong>of</strong> <strong>Cerritos</strong><br />
132
Fiscal Year<br />
2006-07 2007-08 2008-09 2009-10<br />
$ 971,890,907 $ 1,028,776,348 $ 1,098,825,713 $ 1,089,326,156<br />
- - - -<br />
$ 971,890,907 $ 1,028,776,348 $ 1,098,825,713 $ 1,089,326,156<br />
0.00% 0.00% 0.00% 0.00%<br />
$<br />
7,216,663,507<br />
45,510,863<br />
$<br />
7,262,174,370<br />
$<br />
1,089,326,156<br />
-<br />
$<br />
1,089,326,156<br />
133
<strong>City</strong> <strong>of</strong> <strong>Cerritos</strong><br />
Demographic and Economic Statistics<br />
Last Eight Fiscal Years<br />
Per Capita<br />
Personal<br />
<strong>City</strong><br />
Fiscal Income Personal Unemployment<br />
Year Population (1) (in thousands) Income (2) * Rate (3)<br />
2002-03 51,716 31,452 1,626,572 3.50%<br />
2003-04 51,748 33,179 1,716,947 3.30%<br />
2004-05 51,792 34,426 1,782,991 2.60%<br />
2005-06 51,944 37,362 1,940,732 2.50%<br />
2006-07 52,020 39,794 2,070,084 2.60%<br />
2007-08 52,096 42,265 2,201,837 3.80%<br />
2008-09 52,172 (a) (a) 6.20%<br />
2009-10 52,249 (a) (a) 6.70%<br />
*Based on Los Angeles County personal income data<br />
(a) Not Available<br />
The <strong>City</strong> has elected to show only eight years <strong>of</strong> data for this schedule coinciding with the<br />
implementation <strong>of</strong> GASB 34 in fiscal year 2002-2003.<br />
Sources:<br />
(1) <strong>City</strong> <strong>of</strong> <strong>Cerritos</strong><br />
(2) Bureau <strong>of</strong> Economic Analysis<br />
(3) State <strong>of</strong> California, Labor Market Information, Data Library<br />
134
<strong>City</strong> <strong>of</strong> <strong>Cerritos</strong><br />
Principal Employers<br />
Current Year and Seven Years Ago<br />
2010 2001**<br />
Percent <strong>of</strong><br />
Percent <strong>of</strong><br />
Number <strong>of</strong> Total Number <strong>of</strong> Total<br />
Employer Employees Employment* Employees Employment<br />
United Parcel Service 1,654 4.69%<br />
ABC Unified School District 1,231 3.49%<br />
Caremore 1,012 2.87%<br />
Southern Wine & Spirits <strong>of</strong> Southern California 979 2.77%<br />
<strong>City</strong> <strong>of</strong> <strong>Cerritos</strong> 592 1.68%<br />
College Hospital, Inc 530 1.50%<br />
Dolex Dollar Express 415 1.18%<br />
Marina Medical Billing 364 1.03%<br />
AT&T Wireless Services 353 1.00%<br />
Expert Automotive Associates 286 0.81%<br />
Total 7,416 21.02%<br />
*Based upon California Employment Development Department data <strong>of</strong> 35,288 total employment <strong>of</strong> all employers located<br />
within <strong>City</strong> limits.<br />
**Information not available<br />
Source: California Employment Development Department<br />
135
<strong>City</strong> <strong>of</strong> <strong>Cerritos</strong><br />
Full-Time and Part-Time <strong>City</strong> Employees<br />
By Function<br />
Last Eight Fiscal Years<br />
Fiscal Year<br />
Fiscal Year<br />
Department 2002-03 2003-04 2004-05 2005-06 2006-07 2007-08 2008-09 2009-10<br />
Legislative and administrative 10 8 9 9 9 9 9 9<br />
Community Development 20 19 20 20 21 20 20 20<br />
Public Works 137 138 128 130 113 114 111 96<br />
Water and Power - - - - 19 19 18 17<br />
Community and cultural services 176 177 237 239 251 255 292 298<br />
Administrative services 142 134 146 147 148 155 155 153<br />
<strong>Cerritos</strong> Center for the Performing Arts 173 173 222 221 203 201 190 200<br />
Total 658 649 762 766 764 773 795 793<br />
Full-Time employees 250 248 241 241 241 241 235 239<br />
Part-Time employees 408 401 521 525 523 532 560 554<br />
Total 658 649 762 766 764 773 795 793<br />
The <strong>City</strong> has elected to show only eight years <strong>of</strong> data for this schedule coinciding with the implementation<br />
<strong>of</strong> GASB 34 in fiscal year 2002-2003.<br />
Source: Finance Division, <strong>City</strong> <strong>of</strong> <strong>Cerritos</strong><br />
136
<strong>City</strong> <strong>of</strong> <strong>Cerritos</strong><br />
Operating Indicators By Function<br />
Last Eight Fiscal Years<br />
Fiscal Year<br />
Function 2002-03 2003-04 2004-05 2005-06 2006-07 2007-08 2008-09 2009-10<br />
Public Works<br />
Maintenance:<br />
Graffiti removal (average incidence) 7,900 7,900 8,000 8,000 7,800 8,000 7,800 7,800<br />
Streetsweeping miles 7,100 7,100 7,100 7,100 7,100 7,100 7,100 7,100<br />
Trees maintained 28,000 28,000 28,000 28,000 28,000 29,450 29,450 29,500<br />
Trees trimmed 12,000 12,000 12,000 12,000 11,500 12,000 12,000 12,000<br />
Water and Power<br />
Water:<br />
Number <strong>of</strong> customer accounts 15,060 15,622 15,636 15,647 15,647 15,482 15,159 15,668<br />
Average daily consumption (millions <strong>of</strong> gallons) 8.68 9.02 8.15 8.18 8.80 10.13 9.75 8.57<br />
Water samples taken (annual) 2,272 2,272 2,800 2,272 2,104 2,128 2,038 2,039<br />
Community and Safety Services<br />
Police (1):<br />
Number <strong>of</strong> sworn <strong>of</strong>ficers 64 58 59 58 54 56 59 60<br />
Community Service <strong>of</strong>ficers (non-sworn) 25 5 17 17 16 16 14 19<br />
Calls dispatched 18,536 18,680 17,945 17,447 17,286 16,931 16,830 16,745<br />
Crime reports 6,765 6,672 6,321 5,650 5,991 5,946 5,843 5,511<br />
Moving citations 8,287 7,622 6,680 6,740 5,615 4,920 6,395 5,868<br />
Parking citations 1,259 719 722 936 825 1,152 1,116 1,089<br />
Culture and Recreation:<br />
Leisure classes attendance 56,786 53,023 53,520 58,346 60,947 47,135 48,360 53,360<br />
Indoor park reservation attendance 145,799 150,676 169,635 177,712 152,561 121,777 99,119 101,237<br />
Picnic shelter attendance 54,096 65,795 59,267 56,091 61,658 44,716 53,880 57,903<br />
Swim lessons attendance 118,504 133,477 131,644 181,996 298,131 288,504 292,674 284,994<br />
Recreational swim attendance 58,217 62,082 54,549 51,009 55,587 55,021 51,594 48,784<br />
Volunteer hours 8,876 16,528 19,558 20,954 16,097 16,027 11,974 12,550<br />
Administrative Services<br />
Library:<br />
Number <strong>of</strong> patrons 1,173,171 1,057,044 1,089,527 1,172,500 1,173,000 1,042,445 1,064,875 1,128,990<br />
(1) Services are contracted with the County <strong>of</strong> Los Angeles<br />
The <strong>City</strong> has elected to show only eight years <strong>of</strong> data for this schedule coinciding with the implementation <strong>of</strong><br />
GASB 34 in fiscal year 2002-2003.<br />
Source: Finance Division, <strong>City</strong> <strong>of</strong> <strong>Cerritos</strong><br />
137
<strong>City</strong> <strong>of</strong> <strong>Cerritos</strong><br />
Operating Indicators By Function<br />
Last Eight Fiscal Years<br />
Function<br />
Fiscal Year<br />
2002-03 2003-04 2004-05 2005-06 2006-07 2007-08 2008-09 2009-10<br />
Public Works<br />
Sewers:<br />
Miles <strong>of</strong> sanitary sewers 124 124 124 124 124 124 124 124<br />
Sewer lines (miles) 109.18 109.32 109.32 109.32 109.32 109.32 109.32 109.32<br />
Streets and Highways:<br />
Streets (miles) 136.33 136.33 136.33 136.33 136.33 136.33 136.33 136.33<br />
Sidewalks (miles) 242.16 242.16 242.16 242.16 242.16 242.16 242.16 242.16<br />
Curb & gutter (miles) 255.75 255.75 255.75 255.75 255.75 255.75 255.75 255.75<br />
Traffic signals (intersections) 87 87 89 89 90 90 90 90<br />
Community and Safety Services<br />
Number <strong>of</strong> Sheriff Stations 1 1 1 1 1 1 1 1<br />
Number <strong>of</strong> parks 24 24 24 24 24 24 24 24<br />
Number <strong>of</strong> swimming pool 2 2 2 2 2 2 2 2<br />
Administrative Services<br />
Number <strong>of</strong> libraries 1 1 1 1 1 1 1 1<br />
Number <strong>of</strong> volumes 224,822 238,243 242,167 238,860 241,942 241,607 247,405 258,349<br />
The <strong>City</strong> has elected to show only eight years <strong>of</strong> data for this schedule coinciding with the<br />
implementation <strong>of</strong> GASB 34 in fiscal year 2002-2003.<br />
Source: Finance Division, <strong>City</strong> <strong>of</strong> <strong>Cerritos</strong><br />
138