Comprehensive Annual Financial Report - City of Cerritos
Comprehensive Annual Financial Report - City of Cerritos
Comprehensive Annual Financial Report - City of Cerritos

You also want an ePaper? Increase the reach of your titles
YUMPU automatically turns print PDFs into web optimized ePapers that Google loves.
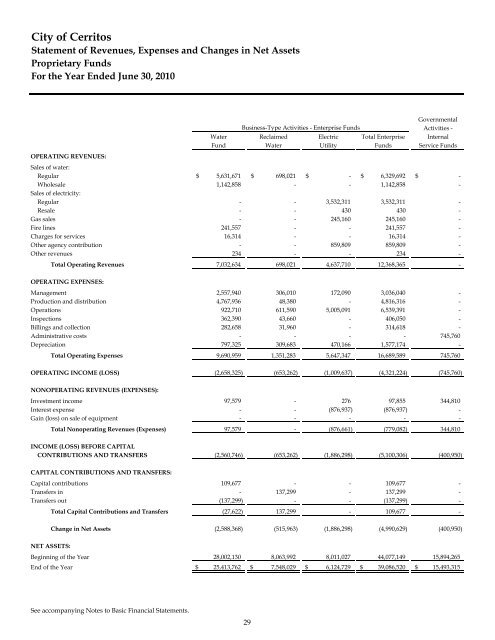
<strong>City</strong> <strong>of</strong> <strong>Cerritos</strong><br />
Statement <strong>of</strong> Revenues, Expenses and Changes in Net Assets<br />
Proprietary Funds<br />
For the Year Ended June 30, 2010<br />
Governmental<br />
Business-Type Activities - Enterprise Funds<br />
Activities -<br />
Water Reclaimed Electric Total Enterprise Internal<br />
Fund Water Utility Funds Service Funds<br />
OPERATING REVENUES:<br />
Sales <strong>of</strong> water:<br />
Regular $ 5,631,671 $ 698,021 $ - $ 6,329,692 $<br />
-<br />
Wholesale 1,142,858 - - 1,142,858 -<br />
Sales <strong>of</strong> electricity:<br />
Regular - - 3,532,311 3,532,311 -<br />
Resale - - 430 430 -<br />
Gas sales - - 245,160 245,160 -<br />
Fire lines 241,557 - - 241,557 -<br />
Charges for services 16,314 - - 16,314 -<br />
Other agency contribution - - 859,809 859,809 -<br />
Other revenues 234 - - 234 -<br />
Total Operating Revenues 7,032,634 698,021 4,637,710 12,368,365 -<br />
OPERATING EXPENSES:<br />
Management 2,557,940 306,010 172,090 3,036,040 -<br />
Production and distribution 4,767,936 48,380 - 4,816,316 -<br />
Operations 922,710 611,590 5,005,091 6,539,391 -<br />
Inspections 362,390 43,660 - 406,050 -<br />
Billings and collection 282,658 31,960 - 314,618 -<br />
Administrative costs - - - - 745,760<br />
Depreciation 797,325 309,683 470,166 1,577,174 -<br />
Total Operating Expenses 9,690,959 1,351,283 5,647,347 16,689,589 745,760<br />
OPERATING INCOME (LOSS) (2,658,325) (653,262) (1,009,637) (4,321,224) (745,760)<br />
NONOPERATING REVENUES (EXPENSES):<br />
Investment income 97,579 - 276 97,855 344,810<br />
Interest expense - - (876,937) (876,937) -<br />
Gain (loss) on sale <strong>of</strong> equipment - - - - -<br />
Total Nonoperating Revenues (Expenses) 97,579 - (876,661) (779,082) 344,810<br />
INCOME (LOSS) BEFORE CAPITAL<br />
CONTRIBUTIONS AND TRANSFERS (2,560,746) (653,262) (1,886,298) (5,100,306) (400,950)<br />
CAPITAL CONTRIBUTIONS AND TRANSFERS:<br />
Capital contributions 109,677 - - 109,677 -<br />
Transfers in - 137,299 - 137,299 -<br />
Transfers out (137,299) - - (137,299) -<br />
Total Capital Contributions and Transfers (27,622) 137,299 - 109,677 -<br />
Change in Net Assets (2,588,368) (515,963) (1,886,298) (4,990,629) (400,950)<br />
NET ASSETS:<br />
Beginning <strong>of</strong> the Year 28,002,130 8,063,992 8,011,027 44,077,149 15,894,265<br />
End <strong>of</strong> the Year $ 25,413,762 $ 7,548,029 $ 6,124,729 $ 39,086,520 $ 15,493,315<br />
See accompanying Notes to Basic <strong>Financial</strong> Statements.<br />
29