2011 Hampton Roads Real Estate Market Review - College of ...
2011 Hampton Roads Real Estate Market Review - College of ...
2011 Hampton Roads Real Estate Market Review - College of ...

Create successful ePaper yourself
Turn your PDF publications into a flip-book with our unique Google optimized e-Paper software.
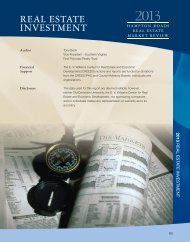
<strong>2011</strong> HAMPTON ROADS<br />
REAL ESTATE<br />
MARKET REVIEW
<strong>2011</strong><br />
HAMPTON ROADS REAL ESTATE MARKET REVIEW<br />
CONTENTS<br />
ASSOCIATE PUBLISHER<br />
Mike Herron<br />
Inside Business<br />
757.222.3991<br />
SPECIAL PUBLISHING MANAGER<br />
Olga Currie<br />
GRAPHIC DESIGN<br />
Pico Design & Illustration<br />
www.picodesign.net<br />
757.493.0370<br />
DIRECTOR OF SALES<br />
Bill Blake<br />
757.222.3165<br />
ADVERTISING SALES<br />
Robin Simmons<br />
John Kinsley<br />
BUSINESS MANAGER<br />
Debbi Wilson<br />
Message From The Director<br />
CREED Executive Committee<br />
CREED IPAC Members<br />
CREED Council Members<br />
<strong>Hampton</strong> <strong>Roads</strong> Retail <strong>Market</strong> Survey<br />
<strong>Hampton</strong> <strong>Roads</strong> Industrial <strong>Market</strong> Survey<br />
<strong>Hampton</strong> <strong>Roads</strong> Office <strong>Market</strong> Survey<br />
<strong>Hampton</strong> <strong>Roads</strong> Residential <strong>Market</strong> Survey<br />
<strong>Hampton</strong> <strong>Roads</strong> Multi-Family <strong>Market</strong> Survey<br />
Commercial <strong>Real</strong> <strong>Estate</strong> Investment <strong>Market</strong> <strong>Review</strong><br />
3<br />
5<br />
6<br />
8<br />
11<br />
25<br />
33<br />
51<br />
67<br />
79<br />
Inside Business<br />
150 W. Brambleton Avenue<br />
Norfolk, Virginia 23510<br />
757.222.5353<br />
E. V. Williams Center<br />
for <strong>Real</strong> <strong>Estate</strong> & Economic Development<br />
www.odu.edu/creed<br />
Data for Old Dominion University<br />
E.V. Williams Center for <strong>Real</strong> <strong>Estate</strong> and<br />
Economic Development <strong>Market</strong> Survey was<br />
collected in the fourth quarter — 2010<br />
1
MESSAGE FROM THE DIRECTOR<br />
Welcome and thank you for joining us for the <strong>2011</strong> Old Dominion University E. V. Williams Center for <strong>Real</strong> <strong>Estate</strong> and<br />
Economic Development (CREED) <strong>Hampton</strong> <strong>Roads</strong> <strong>Real</strong> <strong>Estate</strong> <strong>Market</strong> <strong>Review</strong> and Forecast. This is our 16th annual market<br />
report and review and we sincerely appreciate your continued support.<br />
<strong>Hampton</strong> <strong>Roads</strong> is <strong>of</strong>ficially designated the Virginia Beach – Norfolk – Newport News VA-NC MSA by the Office <strong>of</strong><br />
Management and Budget. It encompasses 2,628 square miles, has a population <strong>of</strong> more than 1.6 million and a workforce <strong>of</strong><br />
nearly 800,000. <strong>Hampton</strong> <strong>Roads</strong> is the fourth largest MSA in the southeast US, comprised <strong>of</strong> 16 cities and counties in<br />
Southeastern Virginia and Northeastern North Carolina, and is the largest consumer market between Washington D.C. and Atlanta.<br />
Our report this year features an expanded residential overview to a new section reviewing existing home sales. The <strong>Real</strong><br />
<strong>Estate</strong> Information Network (REIN) has graciously provided us with the data and analysis by James Pritchard. This information,<br />
in conjunction with our ongoing evaluation <strong>of</strong> residential development, now provide you with a more informative and<br />
comprehensive overview <strong>of</strong> the residential market.<br />
Growth and development at CREED is driven significantly by support from our members. In 2010, the Industry Pr<strong>of</strong>essional<br />
Advisors to the Center (IPAC) and the CREED Council numbered 114. Together, these membership bodies are dedicated to<br />
creating a nationally prominent center <strong>of</strong> excellence in real estate research and education here at Old Dominion University. The<br />
high degree <strong>of</strong> support and involvement demonstrated by our membership is positioning CREED to invest greater resources in<br />
research, additional educational programming, networking opportunities, and practical applications that benefit the Industry as<br />
a whole and sustain the real estate community here at Old Dominion University.<br />
CREED membership continues to be one <strong>of</strong> the most cost effective networking organizations you can ever support. There<br />
are many benefits to CREED membership, including complimentary registration to CREED events such as the <strong>Hampton</strong> <strong>Roads</strong><br />
<strong>Real</strong> <strong>Estate</strong> <strong>Market</strong> <strong>Review</strong> and Forecast and the annual CREED Business Meeting and Luncheon. Moreover, there are several<br />
opportunities to meet promising students for possible internships or career symposiums. CREED Council and IPAC membership<br />
also provides further opportunity for those <strong>of</strong> you who want to see real estate establish itself as an academic major <strong>of</strong> choice<br />
for Old Dominion University students.<br />
With member support, CREED continues to expand student <strong>of</strong>ferings and member services and programming. In 2010,<br />
CREED invited several industry leaders to campus and sponsored numerous events in the <strong>College</strong> <strong>of</strong> Business and Public<br />
Administration including a guest speaker series. In June, CREED welcomed Dr. Susan Wachter, former United States Assistant<br />
Secretary <strong>of</strong> Housing and Urban Development, to advise our membership on navigating the turbulent economic climate.<br />
Looking ahead to <strong>2011</strong>, CREED is expanding its partnership with the local chapter <strong>of</strong> the Urban Land Institute, in addition<br />
to many other regional industry partners. Dr. Michael J. Seiler, the Robert M. Stanton Chair <strong>of</strong> <strong>Real</strong> <strong>Estate</strong>, continues his<br />
cutting edge research in areas <strong>of</strong> consumer behavior and the home purchase process. His research appears in top level<br />
publications all the while enhancing the reputation <strong>of</strong> real estate related research in the <strong>College</strong> and University.<br />
There are many people to thank for their contributions to this report and the annual market review. Many writers, speakers,<br />
and event planners make this program such a success. Of course, a special thank you to all the volunteers within the real estate<br />
and economic development community for providing their expertise and sharing their data. None <strong>of</strong> this is possible without your<br />
commitment.<br />
In closing, please note that we have changed the way we present some <strong>of</strong> our information. Every effort is made to provide<br />
the most accurate information in these reports. If you find an error, or have a suggestion on how to improve upon these reports,<br />
please contact me with comments.<br />
Your continued support is truly appreciated.<br />
John R. Lombard, Ph.D.<br />
John R. Lombard, Ph.D.<br />
Associate Pr<strong>of</strong>essor and Chair | Department <strong>of</strong> Urban Studies and Public Administration<br />
Director, E. V. Williams Center for <strong>Real</strong> <strong>Estate</strong> and Economic Development<br />
Old Dominion University | <strong>College</strong> <strong>of</strong> Business and Public Administration | Norfolk, VA 23529-0218<br />
Direct line: (757) 683-4809 Center line: (757) 683-5352<br />
3
To obtain additional copies <strong>of</strong><br />
this report, please go to our<br />
website: www.odu.edu/creed<br />
Send to:<br />
Kyllie Brinkley<br />
Program Manager<br />
E. V. Williams Center for <strong>Real</strong> <strong>Estate</strong><br />
and Economic Development<br />
Old Dominion University<br />
2088 Constant Hall<br />
Norfolk, VA 23529<br />
Telephone: (757) 683-5352<br />
E-Mail: kbrinkle@odu.edu
THE <strong>2011</strong> EXECUTIVE<br />
COMMITTEE OF THE<br />
CREED COUNCIL<br />
The purpose <strong>of</strong> the Creed Council is to provide pr<strong>of</strong>essional<br />
expertise in various aspects <strong>of</strong> real estate and economic<br />
development to make recommendations to the University<br />
concerning policy and operations <strong>of</strong> the CREED as well as the<br />
University’s real estate curriculum.<br />
The <strong>2011</strong> Officers And Members Of CREED<br />
Are As Follows:<br />
Executive Committee<br />
Chair .............................................. Brad Sanford<br />
Director........................................... John Lombard<br />
Program Chair ................................ Stephanie Sanker<br />
Publications Chair ........................... Brian Dundon<br />
Membership Chair .......................... Craig Cope<br />
Curriculum Co-Chairs ....................... Jon Crunkleton<br />
................................................... Brad Sanford<br />
By-Laws Chair.................................. Andrew Keeney<br />
Past Chair ....................................... Tom Dillon<br />
At-Large........................................... Jonathan Guion<br />
................................................... Billy King<br />
................................................... Aubrey Layne<br />
<strong>Market</strong> <strong>Review</strong> Committee<br />
Industrial .............................. William C. Throne and<br />
........................................ Stephanie Sanker<br />
Office ................................... Maureen G. Rooks<br />
Retail ................................... David Machupa and<br />
........................................ David Chapman<br />
Multi-family ........................... Charles Dalton/<strong>Real</strong> Data<br />
Residential ........................... Blair Hardesty, James Pritchard<br />
and Van Rose<br />
Investment ........................... Scott Adams<br />
Staff ...............................................Kyllie Brinkley<br />
Research/Editorial Committee<br />
Kyllie Brinkley<br />
Nancy Gossett<br />
John Lombard<br />
Lane Shea<br />
David Chapman<br />
Elizabeth Hancock<br />
Sandi Prestridge<br />
Kristi Sutphin<br />
Albert Duncan<br />
Janice Hurley<br />
Maureen Rooks<br />
Brian Dundon<br />
Joy Learn<br />
Brad Sanford<br />
5
INDUSTRY PROFESSIONAL ADV<br />
Honorary Member<br />
Robert M. Stanton,<br />
CSM and CPM<br />
Stanton Partners, Inc.<br />
Jeff Ainslie<br />
Ainslie Group<br />
G. Robert Aston, Jr.<br />
TowneBank<br />
Ramon W. Breeden, Jr.<br />
The Breeden Company<br />
Sanford (Sandy) M. Cohen<br />
Divaris <strong>Real</strong> <strong>Estate</strong>, Inc.<br />
Craig Cope<br />
Liberty Property Trust<br />
Cecil V. Cutchins<br />
Olympia Development<br />
Corporation<br />
Robert L. Dewey<br />
Willcox & Savage, PC<br />
Thomas M. Dillon<br />
Fulton Bank<br />
N. Joseph Dreps<br />
BB&T<br />
Pamela J. Faber<br />
LeClair Ryan<br />
Joel T. Flax, CPA<br />
Goodman and Company<br />
David M. Gianascoli<br />
Gee’s Group <strong>Real</strong> <strong>Estate</strong><br />
Development<br />
John L. Gibson, III<br />
Ellis-Gibson Development<br />
Group<br />
Warren Harris<br />
City <strong>of</strong> Virginia Beach<br />
Economic Development<br />
Aubrey L. Layne, Jr.<br />
Great Atlantic<br />
Management, LLC<br />
Miles B. Leon<br />
S. L. Nusbaum <strong>Real</strong>ty<br />
Company<br />
THANK YOU <strong>2011</strong> SPONSORS<br />
<strong>2011</strong> <strong>Hampton</strong> <strong>Roads</strong> <strong>Real</strong> <strong>Estate</strong> <strong>Market</strong> <strong>Review</strong> 6
ISORS TO THE CENTER (IPAC)<br />
Michael W. McCabe<br />
Harvey Lindsay Commercial<br />
<strong>Real</strong> <strong>Estate</strong><br />
Michael Newsome<br />
Clark Whitehill Enterprises, Inc.<br />
Harrison J. Perrine<br />
Perrine Investments<br />
Don Perry<br />
Continental Development<br />
Victor L. Pickett<br />
Grandbridge <strong>Real</strong> <strong>Estate</strong><br />
Capital, LLC<br />
Thomas E. Robinson<br />
Robinson Development Group<br />
Jim V. Rose<br />
Rose & Womble <strong>Real</strong>ty Co.,<br />
LLC<br />
Bradley R. Sanford, MAI<br />
Dominion <strong>Real</strong>ty Advisors<br />
Burrell F. Saunders<br />
CMSS Architects, PC<br />
Reese Smith<br />
Reese Smith & Associates<br />
Tony Smith<br />
Robinson Development Group<br />
Deborah K. Stearns,<br />
CPM, SIOR<br />
Harvey Lindsay Commercial<br />
<strong>Real</strong> <strong>Estate</strong><br />
Richard Thurmond<br />
William E. Wood & Associates<br />
Jon S. Wheeler<br />
Wheeler Interests<br />
Robert T. Williams<br />
Tri City Developers, LLC<br />
Rod Woolard<br />
City <strong>of</strong> Norfolk Economic<br />
Development<br />
Steven Wright<br />
City <strong>of</strong> Chesapeake<br />
Economic Development<br />
7
CREED COUNCIL MEMBERS<br />
J. Scott Adams<br />
CB Richard Ellis/<strong>Hampton</strong> <strong>Roads</strong><br />
Tom Atherton<br />
MEB General Contrators<br />
Stewart Buckle, II<br />
The Morgan <strong>Real</strong> <strong>Estate</strong> Group<br />
M. Albert Carmichael<br />
Harvey Lindsay Commercial<br />
<strong>Real</strong> <strong>Estate</strong><br />
W. Page Cockrell<br />
Hurt & Pr<strong>of</strong>fitt<br />
David Collier<br />
First Atlantic Restoration<br />
Lawrence J. Colorito, Jr., MAI<br />
Axial Advisory Group, LLC<br />
Hahns L. Copeland<br />
DARVA Group LLC<br />
Ann K. Crenshaw<br />
Kaufman & Canoles, P.C.<br />
Don Crigger, CCIM<br />
CB Richard Ellis <strong>of</strong> Virginia, Inc.<br />
Jon R. Crunkleton, Ph.D.<br />
Old Dominion University<br />
Kim Curtis<br />
Tidewater Home Funding<br />
William G. Darden<br />
Hearndon Construction Co.<br />
Laura B. de Graaf<br />
Bank <strong>of</strong> America Merrill Lynch<br />
Michael Divaris<br />
Divaris <strong>Real</strong> <strong>Estate</strong>, Inc.<br />
Helen Dragas<br />
The Dragas Companies<br />
Brian Dundon<br />
Dundon & Associates<br />
Frederick D. Facka<br />
Tuckahoe Asset Management<br />
Sandra Ferebee<br />
GSH Residential Sales<br />
Bart Frye, Jr.<br />
Frye Properties, Inc.<br />
Brian E. Gordineer, A.A.S<br />
City <strong>of</strong> <strong>Hampton</strong>,<br />
Office <strong>of</strong> the Assessor<br />
Howard E. Gordon<br />
Williams Mullen<br />
Dennis W. Gruelle<br />
Appraisal Consultation Group<br />
Jonathan S. Guion, SIOR<br />
Jonathan Commercial Properties<br />
Elizabeth O. Hancock<br />
Office <strong>of</strong> <strong>Real</strong> <strong>Estate</strong> Assessor,<br />
Norfolk<br />
Russell G. Hanson, Jr.<br />
Hanson Capital, LLC<br />
Carl Hardee<br />
Lawson <strong>Real</strong>ty Corporation<br />
John Harry<br />
John C. Harry, Inc.<br />
Dorcas T. Helfant-Browning<br />
DTH Properties, LLC<br />
Virginia P. Henderson, MAI<br />
Commercial First Appraisers, LLC<br />
Charles Hutchison<br />
Vanasse Hangen Brustlin, Inc.<br />
Michael A. Inman<br />
Inman & Strickler, P.L.C.<br />
Cherie James<br />
Cherie James, CPA<br />
Terry Johnson<br />
Abbitt <strong>Real</strong>ty<br />
Mallory Kahler<br />
City <strong>of</strong> Portsmouth<br />
Economic Development<br />
E. Andrew Keeney<br />
Kaufman & Canoles, P.C.<br />
R. I. King, II<br />
Cushman & Wakefield/<br />
THALHIMER<br />
William E. King, SIOR<br />
Harvey Lindsay Commercial<br />
<strong>Real</strong> <strong>Estate</strong><br />
April Koleszar<br />
Koleszar Properties, Inc.<br />
Barry M. Kornblau<br />
Summit <strong>Real</strong>ty Group, Inc.<br />
Tyler Leinbach<br />
Meredith Construction<br />
Company<br />
<strong>2011</strong> <strong>Hampton</strong> <strong>Roads</strong> <strong>Real</strong> <strong>Estate</strong> <strong>Market</strong> <strong>Review</strong><br />
8
John R. (Jack) Lewis, II<br />
ECS Mid-Atlantic, LLC<br />
Harvey Lindsay, Jr.<br />
Harvey Lindsay Commercial<br />
<strong>Real</strong> <strong>Estate</strong><br />
Jeffrey R. Mack<br />
The CIM Group<br />
Mike Mausteller<br />
G. Cliff Moore<br />
Virtexco Corporation<br />
Michael Nice<br />
George Nice and Sons, Inc.<br />
Thomas O’Grady<br />
KBS , Inc.<br />
James N. Owens, CCIM<br />
Harvey Lindsay Commercial<br />
<strong>Real</strong> <strong>Estate</strong><br />
Robert L. Philips, Jr.<br />
Cushman & Wakefield/THALHIMER<br />
Sandra Prestridge<br />
City <strong>of</strong> Norfolk Economic<br />
Development<br />
Chris Read<br />
CB Richard Ellis/<strong>Hampton</strong> <strong>Roads</strong><br />
F. Craig Read<br />
Read Commercial Properties<br />
John C. Richards, Jr.<br />
CB Richard Ellis/Melody & Co.<br />
Rennie Richardson<br />
Richardson <strong>Real</strong> <strong>Estate</strong> Corporation<br />
Maureen G. Rooks<br />
Jones Lang LaSalle<br />
J. Randy Royal<br />
Kimley-Horn and Associates<br />
Robert J. Ruhl<br />
City <strong>of</strong> Virginia Beach<br />
Economic Development<br />
Stephanie Sanker, SIOR, CCIM<br />
S.L. Nusbaum <strong>Real</strong>ty Co.<br />
Robert M. Sherman III, CPM<br />
Harrison & Lear, Inc.<br />
Kenneth Sisk, P.E.<br />
Bowman Consulting Group<br />
Anthony W. Smith<br />
Robinson Development Group<br />
Robert M. Stanton<br />
Stanton Partners, Inc.<br />
Jeremy R. Starkey<br />
Monarch Bank Commercial <strong>Real</strong><br />
<strong>Estate</strong> Finance/Monarch Capital, LLC<br />
Daniel R. Stegall<br />
Daniel Richard Stegall,<br />
A Pr<strong>of</strong>essional Law Corporation<br />
Terrie L. Suit<br />
The Office <strong>of</strong> Commonwealth<br />
Preparedness<br />
Leo Sutton<br />
Historic Ventures, LLC<br />
Michael Sykes<br />
Bank <strong>of</strong> <strong>Hampton</strong> <strong>Roads</strong><br />
Robert M. Thornton, CRE,<br />
CCIM, SIOR<br />
Cushman & Wakefield/THALHIMER<br />
William C. Throne, SIOR,<br />
CCIM, ALC<br />
Cushman & Wakefield/THALHIMER<br />
Jamie Tollenaere<br />
Clancy & Theys Construction<br />
Stewart Tyler, ASA<br />
Right <strong>of</strong> Way Acquisitions &<br />
Appraisals<br />
George D. Vick, III<br />
Harvey Lindsay Commercial<br />
<strong>Real</strong> <strong>Estate</strong><br />
Edward W. Ware<br />
Norfolk Redevelopment and Housing<br />
H. Mac Weaver, II<br />
Wells Fargo <strong>Real</strong> <strong>Estate</strong> Group<br />
Edward M. Williams<br />
William E. Wood & Associates<br />
F. Blair Wimbush<br />
Norfolk Southern Corporation<br />
Peter E. Winters, Jr.<br />
Bank <strong>of</strong> <strong>Hampton</strong> <strong>Roads</strong><br />
Chris Wood<br />
JD & W<br />
John P. Wright<br />
Waverton Associates<br />
9
RETAIL<br />
Author<br />
Survey<br />
Collection<br />
Data Analysis/<br />
Layout<br />
Financial<br />
Support<br />
Disclosure<br />
David Machupa<br />
Cushman & Wakefield/THALHIMER<br />
Kyllie Brinkley<br />
E.V. Williams Center for <strong>Real</strong> <strong>Estate</strong> and Economic Development<br />
David Chapman<br />
Old Dominion University<br />
The E. V. Williams Center for <strong>Real</strong> <strong>Estate</strong> and Economic<br />
Development (CREED) functions and reports are<br />
funded by donations from individuals, organizations<br />
and the CREED Council.<br />
The data used for this report are deemed reliable; however,<br />
neither Old Dominion University, the E. V. Williams Center for <strong>Real</strong><br />
<strong>Estate</strong> and Economic Development, nor sponsoring companies and/or<br />
individuals makes any representation or warranty as to its accuracy.<br />
<strong>2011</strong> RETAIL
General Overview<br />
This report analyzes the 2010 retail real estate<br />
conditions within the Virginia Beach–Norfolk–<br />
Newport News, Virginia Metropolitan Statistical Area<br />
(the “MSA”), which is commonly known as <strong>Hampton</strong><br />
<strong>Roads</strong>. It provides supply, vacancy, construction,<br />
absorption and rent data for the MSA to provide a<br />
comparison <strong>of</strong> the data for Southside and Peninsula<br />
areas <strong>of</strong> <strong>Hampton</strong> <strong>Roads</strong> for specific submarkets and<br />
product types. The survey includes properties from the<br />
Southside <strong>of</strong> <strong>Hampton</strong> <strong>Roads</strong> located in the cities <strong>of</strong><br />
Chesapeake, Norfolk, Portsmouth, Smithfield, Suffolk<br />
and Virginia Beach. Properties are also included from<br />
the Peninsula <strong>of</strong> <strong>Hampton</strong> <strong>Roads</strong> in Gloucester,<br />
<strong>Hampton</strong>, Newport News, Poquoson, Williamsburg<br />
and York County.<br />
This survey is believed to be the most comprehensive analysis <strong>of</strong> retail real estate trends in the MSA. The report<br />
includes information on all retail product types including regional malls, freestanding buildings and strip centers <strong>of</strong><br />
various classifications. The scope <strong>of</strong> the report also includes a summary <strong>of</strong> new retail construction, an analysis <strong>of</strong><br />
absorption, and a review <strong>of</strong> retail investment sales that have occurred in the region.<br />
This survey gathered information about strip shopping centers and regional malls located in the<br />
METHODOLOGY MSA that were generally 30,000 square feet in size or larger. Additionally, information on retailoriented<br />
freestanding buildings at least 23,000 square feet and freestanding buildings that contained<br />
furniture stores, discounters, grocery stores or category killer retailers that met the established size criteria were included in the<br />
survey. Automotive uses and buildings containing “downtown storefronts” were not included. Although available retail space in many<br />
submarkets (e.g., Ghent) is best described as a collection <strong>of</strong> small specialty shops, storefronts or freestanding buildings, practical limitations<br />
dictated that the focus <strong>of</strong> the survey be on larger product types.<br />
The survey data was collected between October 2010 and January <strong>2011</strong>. Questionnaires were mailed to owners, leasing agents<br />
and property managers responsible for retail properties meeting the selection criteria. Direct contact was utilized as a follow-up to the<br />
mailing to encourage participation. Information on square footage for freestanding buildings was obtained from building owners, tax<br />
records, store managers and retail real estate representatives. Sales information was obtained from property owners, real estate agents,<br />
appraisers, and real estate assessors.<br />
<strong>2011</strong> <strong>Hampton</strong> <strong>Roads</strong> <strong>Real</strong> <strong>Estate</strong> <strong>Market</strong> <strong>Review</strong><br />
12
<strong>2011</strong> R E TA I L<br />
DEFINITIONS OF TERMS<br />
Asking Rates: The market rate per square foot <strong>of</strong> a retail property (excluding freestanding buildings and malls), exclusive <strong>of</strong> additional<br />
rents that may be paid under a triple net lease. Interpretation <strong>of</strong> average retail rates in different product types and submarkets<br />
should be viewed cautiously given the tremendous variability in rates for like products and for properties located within<br />
the same submarket. Factors such as visibility, co-tenancy and accessibility are some <strong>of</strong> the many sources <strong>of</strong> variation in market<br />
rates which should be considered.<br />
Big Boxes: Contiguous retail space that is at least 23,000 square feet and located in any one <strong>of</strong> the identified product types. Retailers<br />
occupying big boxes include, but are not limited to, the following: category killers, specialty stores, discounters, furniture<br />
stores, grocery stores and theaters. Bowling alleys, automotive uses, roller rinks and ice-skating rinks were not included.<br />
CAM: Common Area Maintenance<br />
Product Types: Properties were classified according to one <strong>of</strong> the following nine retail product types. The International Council<br />
<strong>of</strong> Shopping Centers defined the first six categories. Three additional categories were included to accurately categorize the remaining<br />
properties.<br />
Neighborhood Center<br />
Community Center<br />
Fashion/Specialty Center<br />
Power Center<br />
Theme Festival Center<br />
Outlet Center<br />
Freestanding<br />
Mall<br />
Other<br />
30,000 to 150,000 square feet; supermarket anchored<br />
100,000 to 350,000 square feet; discount department store,<br />
supermarket or drug store anchored<br />
80,000 to 250,000 square feet; fashion anchored<br />
250,000 to 600,000 square feet; category killer, home improvement<br />
and discount department store anchored<br />
80,000 to 250,000 square feet; restaurants, entertainment anchored<br />
50,000 to 400,000 square feet; manufacturer’s outlet store anchored<br />
Individual building not considered a shopping center<br />
Shopping center with area designed for pedestrian use only<br />
Any center that does not fit into a typical category<br />
Regional Mall Node: Submarket anchored by regional mall.<br />
Small Shop: In-line retail space usually less than 10,000 square feet located in a multi-tenanted shopping center.<br />
Submarkets: <strong>Hampton</strong> <strong>Roads</strong> is divided into 35 retail submarkets (25 Southside submarkets and 10 Peninsula submarkets)<br />
which reflected general concentrations, pockets or corridors <strong>of</strong> retail product type. Geographical boundaries <strong>of</strong> the retail submarkets<br />
were influenced by density <strong>of</strong> existing retail product, physical or geographical obstacles, existing transportation networks,<br />
municipal boundaries, population concentrations and retailers’ perceptions <strong>of</strong> the MSA. Final determination <strong>of</strong> specific boundaries<br />
<strong>of</strong> each submarket was made by a subcommittee <strong>of</strong> retail real estate pr<strong>of</strong>essionals who are actively involved in the MSA.<br />
Also highlighted were specific submarkets that are anchored by regional malls. A map which identifies the general location <strong>of</strong> each<br />
submarket is included in the centerfold <strong>of</strong> this report.<br />
Triple Net Lease: Type <strong>of</strong> lease under which a tenant pays its pro-rata share <strong>of</strong> real estate taxes, insurance and common area<br />
maintenance.<br />
<strong>2011</strong> RETAIL<br />
13
YEAR IN REVIEW<br />
Moving into 2010 the market was cautiously optimistic.<br />
The prior year had left us with increased vacancy rates and<br />
reduced rental rates; the appetite <strong>of</strong> lenders was almost nonexistent<br />
for developments or acquisitions and, from a national level,<br />
there was a concern that the commercial real estate market bubble<br />
was going to burst as did the residential market. This concern<br />
further slowed the recovery <strong>of</strong> the <strong>Hampton</strong> <strong>Roads</strong> market, yet the market did recover.<br />
Savvy tenants made the most <strong>of</strong> the market as landlords were willing to make concessions to fill vacant units; the result was decreased<br />
vacancy for the overall market and a slightly decreased average rental rate. In 2009 Dillard’s closed both Chesapeake Square<br />
locations; in 2010, we welcomed Burlington Coat Factory to one <strong>of</strong> the stores and the other location is in the process <strong>of</strong> being redeveloped<br />
into a state <strong>of</strong> the art movie theater. TJ Maxx and PetSmart built new stores in the Harborview submarket, and Restaurant<br />
Depot opened in the former Value City in Virginia Beach.<br />
Departing from past years, 2010 did not have a great deal <strong>of</strong> Big Box activity. Wal-Mart broke ground on a site they purchased in<br />
2008 in the Edinburgh submarket. The Fresh <strong>Market</strong> relocation in Williamsburg was the only grocery store to commence construction<br />
in <strong>Hampton</strong> <strong>Roads</strong>. Having said that, we ended the year with the home improvement stores once again touring the market and<br />
evaluating sites.<br />
Investment sales in the <strong>Hampton</strong> <strong>Roads</strong> retail market were few and far between. We have heard on a number <strong>of</strong> occassions that<br />
lenders are going to foreclose on nonperforming assets; this belief is keeping many buyers on the sideline. Buyers appear to be searching<br />
for the bottom <strong>of</strong> the market, waiting to swoop in and get the banks’ nonperforming loans, yet the banks have not foreclosed in the<br />
large scale that we have been told will take place. The properties that were taken back are the same Williamsburg properties that struggled<br />
last year. The Williamsburg market was over built and that submarket continues to face challenges.<br />
As we faced last year with Circuit City, one thing that we did not see this year was the exodus <strong>of</strong> a large retailer. We continue to<br />
watch Blockbuster, as the long-term viability <strong>of</strong> their product line is suspect. Blockbuster, like Circuit City, has some good sites and<br />
we can expect many <strong>of</strong> those to be re-tenanted in short order.<br />
Overall, the <strong>Hampton</strong> <strong>Roads</strong> retail market remains stable. Due to our military presence, retailers tend to outperform overall national<br />
sales levels; these same military personnel provide a stable work force. As we settle into what we believe is the new reality, our<br />
expectations must remain realistic. Positive growth will take place next year, albeit at a slower rate than the market is accustomed and<br />
<strong>2011</strong> should outperform 2010 just as 2010 outperformed 2009.<br />
HAMPTON ROADS MARKET SURVEY<br />
The <strong>Hampton</strong> <strong>Roads</strong> retail market contains approximately 51,983,981 square feet <strong>of</strong> gross leasable area (“GLA”) in 412 properties<br />
with an average asking rental rate <strong>of</strong> $16.00 triple net. The US Census Bureau indicates the population <strong>of</strong> <strong>Hampton</strong> <strong>Roads</strong> is approximately<br />
1.7 million resulting in a 30.58 square feet <strong>of</strong> retail supply per person. Certain methodological differences (e.g., the<br />
inclusion <strong>of</strong> freestanding buildings and malls in this survey) make it difficult to compare per capita supply in the MSA to the national<br />
average statistics.<br />
<strong>Hampton</strong> <strong>Roads</strong> consist <strong>of</strong> two markets, the Southside and Peninsula. The Southside market has approximately 33,435,574<br />
square feet, roughly 66% <strong>of</strong> the total square footage in the market, in 274 properties. The average asking rent for small shop space decreased<br />
by $.16 over 2009 numbers to $16.16 per square foot triple net. The decrease in rental rates was a boon to tenants and, as a<br />
result, the overall vacancy rate on the Southside decreased. In 2010 there was a decrease in the vacancy rate <strong>of</strong> .67% to 7.42%, while<br />
new construction added just 18,880 square feet to the Southside market.<br />
The Peninsula also experienced some changes this past year. The 138 properties surveyed on the Peninsula had a total <strong>of</strong><br />
18,548,407 square feet <strong>of</strong> product. The average asking price <strong>of</strong> small shop space decreased $.17 to $15.65 per square foot triple net.<br />
<strong>2011</strong> <strong>Hampton</strong> <strong>Roads</strong> <strong>Real</strong> <strong>Estate</strong> <strong>Market</strong> <strong>Review</strong><br />
14
<strong>2011</strong> R E TA I L<br />
<strong>Market</strong> Overview Table<br />
<strong>2011</strong><br />
2010<br />
2009<br />
2008<br />
2007<br />
2006<br />
2005<br />
2004<br />
2003<br />
2002<br />
2001<br />
2000<br />
1999<br />
1998<br />
New<br />
Number <strong>of</strong> Construction Occupied Absorption<br />
Properties GLA in SF Vacant SF % Vacant in SF in SF in SF<br />
Southside 274 34,019,555 2,523,754 7.42% 18,880 31,495,801 675,035<br />
Peninsula 138 18,548,407 2,175,793 11.73% - 16,372,614 604,361<br />
Total 412 52,567,962 4,699,547 8.94% 18,880 47,868,415 1,279,396<br />
Southside 273 33,535,280 2,714,514 8.09% 302,352 30,820,766 (288,440)”<br />
Peninsula 136 18,160,963 2,392,710 13.18% 981,463 15,768,253 362,777<br />
Total 409 51,696,243 5,107,224 9.88% 1,283,815 46,589,019 74,337<br />
Southside 265 33,265,028 2,155,822 6.48% 275,252 31,109,206 238,525<br />
Peninsula 133 17,112,012 1,706,536 9.97% - 15,405,476 (109,898)<br />
Total 398 50,377,040 3,862,358 7.67% 275,252 46,514,682 128,627<br />
Southside 263 33,086,160 2,215,479 6.70% 1,038,291 30,870,681 339,596<br />
Peninsula 133 17,133,079 1,617,705 9.44% 1,009,000 15,515,374 100,485<br />
Total 396 50,219,239 3,833,184 7.63% 2,047,291 46,386,055 440,081<br />
Southside 259 32,407,761 1,876,676 5.79% 1,552,392 30,531,085 1,741,962<br />
Peninsula 131 16,895,155 1,480,266 8.76% 1,042,451 15,414,889 576,788<br />
Total 390 49,302,916 3,356,942 6.81% 2,594,843 45,945,974 2,318,750<br />
Southside 246 30,852,210 2,063,087 6.69% 593,520 28,789,123 1,280,869<br />
Peninsula 129 16,337,458 1,499,357 9.18% 618,179 14,838,101 687,097<br />
Total 375 47,189,668 3,562,444 7.55% 1,211,699 43,627,224 1,967,966<br />
Southside 243 30,184,395 2,676,141 8.87% 271,610 27,508,254 341,736<br />
Peninsula 125 15,799,778 1,648,774 10.44% 185,000 14,151,004 496,338<br />
Total 368 45,984,173 4,324,915 9.41% 456,610 41,659,258 838,074<br />
Southside 243 30,336,266 3,169,748 10.45% 419,458 27,166,518 419,138<br />
Peninsula 127 16,094,161 2,027,477 12.60% 330,000 14,066,684 412,018<br />
Total 370 46,430,427 5,197,225 11.19% 749,458 41,233,202 831,156<br />
Southside 245 30,180,691 3,433,311 11.38% 574,400 26,747,380 535,167<br />
Peninsula 126 15,546,085 1,891,419 12.17% 676,000 13,654,666 932,008<br />
Total 371 45,726,776 5,324,730 11.64% 1,250,400 40,402,046 1,467,175<br />
Southside 239 29,760,443 3,548,230 11.92% 828,800 26,212,213 1,185,818<br />
Peninsula 123 14,906,530 2,183,872 14.65% 202,750 12,722,658 242,563<br />
Total 362 44,666,973 5,732,102 12.83% 1,031,550 38,934,871 1,428,381<br />
Southside 230 29,436,515 3,760,087 12.77% 918,100 25,676,428 (158,181)<br />
Peninsula 121 14,477,970 1,997,875 13.80% 212,229 12,480,095 147,115<br />
Total 351 43,914,485 5,757,962 13.11% 1,130,329 38,156,523 (11,066)<br />
Southside 220 28,816,383 2,933,294 10.18% 2,064,727 25,883,089 1,344,209<br />
Peninsula 118 15,249,617 2,012,637 13.20% 758,370 13,236,980 292,785<br />
Total 338 44,066,000 4,945,931 11.22% 2,823,097 39,120,069 1,636,994<br />
Southside 208 27,089,939 2,551,059 9.42% 1,414,805 24,538,880 1,961,927<br />
Peninsula 112 14,548,482 1,604,287 11.03% 1,253,342 12,944,195 1,592,805<br />
Total 320 41,638,421 4,155,346 9.98% 2,668,147 37,483,075 3,554,732<br />
Southside 195 25,463,588 2,886,635 11.34% No Data 22,576,953 No Data<br />
Peninsula 102 12,952,845 1,601,455 12.36% No Data 11,351,390 No Data<br />
Total 297 38,416,433 4,488,090 11.68% No Data 33,928,343 No Data<br />
<strong>2011</strong> RETAIL<br />
15
We saw a greater decrease in the vacancy rate on the Peninsula. The vacancy rate dropped 1.45% to 11.73%, and<br />
interest remains very strong for select submarkets. Despite adverse lending conditions, we will welcome two new projects<br />
to the Peninsula in <strong>2011</strong>.<br />
In 2009, we were left with a vacancy rate <strong>of</strong> 9.88% for the overall retail market in <strong>Hampton</strong> <strong>Roads</strong>, the highest<br />
we have experienced in the past decade. Landlords did not want a repeat <strong>of</strong> 2009 and became more aggressive at deal<br />
making. Savvy tenants took advantage <strong>of</strong> favorable market conditions thereby reducing the market vacancy rate to<br />
8.94%. While we will face many <strong>of</strong> the same challenges as 2010 retail sales are up, supply is slowly reducing. Tenants<br />
continue to express interest in the <strong>Hampton</strong> <strong>Roads</strong> market.<br />
We continue to move forward acknowledging that <strong>2011</strong> may bring some challenges with the unknowns <strong>of</strong> the capital<br />
markets and lender viability; however, the <strong>Hampton</strong> <strong>Roads</strong> retail market is more stable. As we are trending in all<br />
the right directions, the worst is now behind us.<br />
RETAIL SUBMARKETS<br />
SOUTHSIDE SUBMARKETS<br />
There were 25 retail submarkets on the Southside this year. The largest Southside markets were Greenbrier and<br />
Military Highway, with combined square footage <strong>of</strong> 7,026,016 square feet. The overall average size <strong>of</strong> the submarkets<br />
was 1,337,423 square feet. The Greenbrier/Battlefield submarket, at 4,243,816 square feet, has one <strong>of</strong> the lowest<br />
vacancy rates at 4.88% and one <strong>of</strong> the highest small shop asking rates, $20.03 per square foot triple net.<br />
The range <strong>of</strong> vacancy rates in the Southside submarkets can be seen in the table below.<br />
Southside By Submarket<br />
Average<br />
Number <strong>of</strong><br />
Small Shop<br />
Properties GLA in SF Vacant SF % Vacant Rate PSF<br />
Bay Front 5 283,551 3,854 1.36% $17.53<br />
Birdneck/Oceanfront 4 191,655 11,511 6.01% $10.95<br />
Campostella 6 332,904 80,800 24.27% $12.56<br />
Chesapeake Square 9 2,218,786 82,805 3.73% $17.00<br />
Churchland-Portsmouth/Harborview 13 986,880 47,729 4.84% $15.08<br />
Dam Neck 7 1,509,037 28,900 1.92% $18.57<br />
Downtown 4 1,329,283 31,475 2.37% $14.83<br />
Ghent 9 391,588 41,269 10.54% $17.81<br />
Great Bridge 17 1,363,132 107,928 7.92% $16.30<br />
Greenbrier/Battlefield Boulevard 24 4,243,816 207,065 4.88% $20.03<br />
Hilltop/Great Neck 12 1,485,168 88,854 5.98% $21.36<br />
Holland/Green Run 10 863,663 50,242 5.82% $13.67<br />
Indian River/<strong>College</strong> Park ( Including Chesapeake) 5 666,183 74,265 11.15% $14.20<br />
Kempsville 12 1,233,576 138,882 11.26% $15.75<br />
Little Creek Road /Wards Corner/Ocean View 18 1,867,591 310,786 16.64% $14.38<br />
Little Neck 11 1,435,803 147,297 10.26% $17.38<br />
Lynnhaven Road (Virginia Beach Boulevard To Holland Road) 8 1,822,451 173,247 9.51% $18.80<br />
Middle Portsmouth 15 1,768,265 176,988 10.01% $12.75<br />
Military Highway/Janaf 16 3,366,181 140,750 4.18% $13.24<br />
Newtown 12 638,344 91,408 14.32% $12.82<br />
ODU 1 39,691 8,675 21.86% $19.00<br />
Pembroke 23 2,716,994 335,491 12.35% $15.90<br />
Princess Anne Road (From Kempsville Road To Holland Road) 15 1,854,589 46,745 2.52% $17.88<br />
Smithfield 5 279,764 5,436 1.94% $17.00<br />
Suffolk 13 1,130,660 91,352 8.08% $16.80<br />
Total 274 34,019,555 2,523,754 7.42% $16.16<br />
<strong>2011</strong> <strong>Hampton</strong> <strong>Roads</strong> <strong>Real</strong> <strong>Estate</strong> <strong>Market</strong> <strong>Review</strong><br />
16
<strong>2011</strong> R E TA I L<br />
PENINSULA SUBMARKETS<br />
There were 10 retail submarkets on the Peninsula with an average size <strong>of</strong> 1,854,841 square feet. The two largest Peninsula<br />
submarkets are now Patrick Henry and Williamsburg. While the Patrick Henry submarket is anchored by a regional mall, and has the<br />
lowest vacancy rate on the Peninsula, Williamsburg continues to struggle with over development.<br />
The Patrick Henry submarket continues to be one <strong>of</strong> the most highly desired submarkets in <strong>Hampton</strong> <strong>Roads</strong> with 4,427,594<br />
square feet and a vacancy rate <strong>of</strong> just 3.03%. During the past year, the Coliseum Central Submarket showed improvement with a reduction<br />
<strong>of</strong> the vacancy rate from 21.56% to 12.00%. This reduction decline can be attributed to the opening <strong>of</strong> Peninsula Towne Center.<br />
Peninsula By Submarket<br />
Average<br />
Number <strong>of</strong><br />
Small Shop<br />
Properties GLA in SF Vacant SF % Vacant Rate PSF<br />
Coliseum Central 15 3,505,105 420,501 12.00% $17.38<br />
Denbigh 15 1,785,121 405,169 22.70% $13.27<br />
Foxhill/Buckroe/East Mercury 7 711,630 113,403 15.94% $13.80<br />
Gloucester 8 894,676 107,840 12.05% $14.38<br />
<strong>Hampton</strong> Misc 2 118,972 19,470 16.37% $10.75<br />
Newmarket/Main (To Include <strong>Hampton</strong>) 13 1,389,156 274,274 19.74% $10.29<br />
Patrick Henry/Oyster Point/Kiln Creek 32 4,427,594 134,012 3.03% $17.76<br />
Poquoson 2 108,521 10,550 9.72% $15.00<br />
Williamsburg 33 4,794,929 638,064 13.31% $19.10<br />
York County 11 812,703 52,510 6.46% $14.25<br />
Total 138 18,548,407 2,175,793 11.73% $15.65<br />
RETAIL PRODUCT TYPE<br />
The Neighborhood Center, as a product type, remains the predominant with 160 properties<br />
containing over 12 million square feet <strong>of</strong> GLA. The Community Center comprised over 10 million<br />
square feet. Both product types showed a decrease in vacancy in 2010.<br />
<strong>2011</strong> RETAIL<br />
17
Total Retail Product By Type<br />
New<br />
Average<br />
Number <strong>of</strong> Construction Small Shop Average<br />
Properties GLA in SF in SF Vacant SF % Vacant Rate PSF CAM PSF<br />
Neighborhood Center 162 12,224,492 18,880 1,379,030 11.28% $15.11 $2.54<br />
Community Center 58 10,073,618 - 1,218,966 12.10% $15.79 $2.39<br />
Fashion/Specialty Center 10 1,488,711 - 115,009 7.73% $23.78 $3.94<br />
Power Center 29 10,350,350 - 901,629 8.71% $20.41 $3.27<br />
Theme Festival Center 1 100,000 - - No data No data No data<br />
Outlet Center 1 349,927 - - No data No data No data<br />
Other 64 2,391,469 - 286,287 11.97% $15.67 $2.92<br />
Freestanding 77 8,050,908 - 397,674 4.94% $12.44 $3.08<br />
Mall 10 7,538,487 - 400,952 5.32% $20.50 $17.75<br />
Total 412 52,567,962 18,880 4,699,547 8.94% $16.00 $2.70<br />
Southside By Type<br />
New<br />
Average<br />
Number <strong>of</strong> Construction Small Shop Average<br />
Properties GLA in SF in SF Vacant SF % Vacant Rate PSF CAM PSF<br />
Neighborhood Center 115 8,781,549 18,880 989,334 11.27% $15.30 $2.55<br />
Community Center 37 6,159,227 - 618,745 10.05% $15.60 $2.38<br />
Fashion/Specialty Center 8 1,005,711 - 54,846 5.45% $23.50 $3.94<br />
Power Center 19 6,267,303 - 336,250 5.37% $20.15 $3.27<br />
Theme Festival Center 1 100,000 - - No data No data No data<br />
Outlet Center - - - - No data No data No data<br />
Other 44 1,556,985 - 149,645 9.61% $15.90 $2.95<br />
Freestanding 43 4,499,135 - 61,870 1.38% $13.63 $3.08<br />
Mall 7 5,649,645 - 313,064 5.54% $20.50 $18.86<br />
Total 274 34,019,555 18,880 2,523,754 7.42% $16.16 $2.79<br />
Peninsula By Type<br />
New<br />
Average<br />
Number <strong>of</strong> Construction Small Shop Average<br />
Properties GLA in SF in SF Vacant SF % Vacant Rate PSF CAM PSF<br />
Neighborhood Center 47 3,442,943 - 389,696 11.32% $14.66 $2.15<br />
Community Center 21 3,914,391 - 600,221 15.33% $16.12 $2.35<br />
Fashion/Specialty Center 2 483,000 - 60,163 12.46% $26.00 $5.03<br />
DPower Center 10 4,083,047 - 565,379 13.85% $20.85 $2.79<br />
Theme Festival Center - - - - No data No data No data<br />
Outlet Center 1 349,927 - - No data No data No data<br />
Other 20 834,484 - 136,642 16.37% $15.20 $2.38<br />
Freestanding 34 3,551,773 - 335,804 9.45% $11.25 $2.24<br />
Mall 3 1,888,842 - 87,888 4.65% No data $17.75<br />
Total 138 18,548,407 - 2,175,793 11.73% $15.65 $2.51<br />
<strong>2011</strong> <strong>Hampton</strong> <strong>Roads</strong> <strong>Real</strong> <strong>Estate</strong> <strong>Market</strong> <strong>Review</strong><br />
18
<strong>2011</strong> R E TA I L<br />
Big Box Vacancy<br />
Big Box Vacancy in <strong>Hampton</strong> <strong>Roads</strong> decreased in 2010 to 1,717,593 square feet, a decrease <strong>of</strong> 373,805 square feet<br />
over last year’s numbers. This number represents 37% <strong>of</strong> the total retail vacancy in the market. We did see some Big Box activity<br />
this past year. Wal-Mart is under construction at Edinburgh in Chesapeake on a site purchased in 2009 and Restaurant<br />
Depot opened in the former Value City on Virginia Beach Boulevard.<br />
Big Box Vacancy<br />
4,000,000<br />
Vacant Square Feet<br />
3,500,000<br />
3,000,000<br />
2,500,000<br />
2,000,000<br />
1,500,000<br />
1,000,000<br />
500,000<br />
0<br />
Southside<br />
Peninsula<br />
TOTAL<br />
1998 1999 2000 2001 2002 2003 2004 2005 2006 2007 2008 2009 2010<br />
Big Box Vacancy<br />
2004 2005 2006 2007 2008 2009 2010<br />
Southside 1,513,523 1,142,319 957,887 948,288 907,688 1,102,093 880,568<br />
Peninsula 1,141,207 982,263 819,163 827,360 880,805 989,305 837,025<br />
TOTAL 2,654,730 2,124,582 1,777,050 1,775,648 1,788,493 2,091,398 1,717,593<br />
<strong>2011</strong> RETAIL<br />
19
Retail Submarkets<br />
Southside<br />
1 Bayfront<br />
2 Birdneck/Oceanfront<br />
3 Campostella<br />
4 Chesapeake Square<br />
5 Churchland/Harbourview<br />
6 Dam Neck<br />
7 Downtown Norfolk<br />
8 Ghent<br />
9 Great Bridge<br />
10 Greenbrier/Battlefield<br />
Boulevard<br />
11 Hilltop/Great Neck<br />
12 Holland/Green Run<br />
13 Indian River/<strong>College</strong> Park<br />
14 Kempsville<br />
15 Little Creek Road/<br />
Wards Corner<br />
16 Little Neck<br />
17 Lynnhaven<br />
18 Middle Portsmouth<br />
19 Military Highway/Janaf<br />
20 Newtown<br />
21 ODU<br />
22 Pembroke<br />
23 Princess Anne<br />
24 Smithfield<br />
25 Suffolk<br />
Peninsula<br />
26 Coliseum Central<br />
27 Denbigh<br />
28 Foxhill/Buckroe<br />
29 Gloucester<br />
30 <strong>Hampton</strong> Miscellaneous<br />
31 Patrick Henry<br />
32 Poquoson<br />
33 Newmarket/Main<br />
34 Williamsburg<br />
35 York County<br />
<strong>2011</strong> <strong>Hampton</strong> <strong>Roads</strong> <strong>Real</strong> <strong>Estate</strong> <strong>Market</strong> <strong>Review</strong><br />
20
The following is a list <strong>of</strong> the<br />
properties included in this year’s survey<br />
listed by submarket with a code<br />
representing the type <strong>of</strong> property.<br />
The GLA <strong>of</strong> the property is also<br />
listed.<br />
A Neighborhood Center<br />
B Community Center<br />
C Fashion/Specialty Center<br />
D Power Center<br />
E Theme Festival<br />
SOUTHSIDE<br />
F Outlet Center<br />
G Other<br />
H Freestanding<br />
I Mall<br />
BAY FRONT<br />
Bayside I & II A 79,397<br />
Cape Henry Plaza A 58,424<br />
Kroger H 47,000<br />
Lake Shores Plaza Shopping Center A 58,230<br />
Marina Shores G 40,500<br />
BIRDNECK / OCEANFRONT<br />
Birdneck SC A 65,460<br />
Farm Fresh H 29,296<br />
Harris Teeter H 48,000<br />
Linkhorn Shops A 48,899<br />
CAMPOSTELLA<br />
Atlantic Commons A 63,393<br />
Bainbridge <strong>Market</strong>place A 46,444<br />
Campostella Corner A 43,375<br />
George Washington Commons A 44,942<br />
Holly Point SC A 65,321<br />
Southgate Plaza A 69,429<br />
CHESAPEAKE SQUARE<br />
BJ’s H 115,660<br />
Chesapeake Center B 270,602<br />
Chesapeake Square Mall I 800,000<br />
Crossroads Center at Chesapeake Square D 332,464<br />
Food Lion @ Chesp. Sq. H 45,000<br />
Home Depot H 130,060<br />
Lowes H 115,000<br />
Taylor Road Plaza A 60,000<br />
Wal-Mart Supercenter/Sam’s Club H 350,000<br />
CHURCHLAND / PORTSMOUTH / HARBOURVIEW<br />
Academy Crossing G 45,483<br />
Churchland Place Shoppes G 21,000<br />
Churchland SC A 149,741<br />
Churchland Square A 72,189<br />
Grand H 30,000<br />
Harbourview Station East D 217,308<br />
Harbourview Station West D 83,007<br />
<strong>Market</strong>center at Harbourview A 65,750<br />
<strong>Market</strong>place Square A 12,461<br />
Planet Fitness Plaza A 52,966<br />
Poplar Hill Plaza B 102,326<br />
Sterling Creek A 75,660<br />
Town Point Square A 58,989<br />
DAM NECK<br />
Dam Neck Crossing B 138,571<br />
Dam Neck Square A 67,917<br />
General Booth Plaza A 73,320<br />
Red Mill Commons D 750,000<br />
Red Mill Walk B 240,000<br />
Sandbridge SC A 66,800<br />
Strawbridge <strong>Market</strong>place A 172,429<br />
DOWNTOWN<br />
Berkley Center A 47,945<br />
Church Street Crossing A 51,000<br />
MacArthur Center Mall I 1,100,000<br />
Waterside Festival <strong>Market</strong>place I 130,338<br />
GHENT<br />
201 Twenty One A 15,616<br />
21st Street Pavilion G 21,000<br />
Center Shops A 139,081<br />
Colley Village A 44,585<br />
Ghent Place G 13,000<br />
Harris Teeter H 27,000<br />
Palace Shops I, II C 71,794<br />
Palace Station G 38,000<br />
The Corner Shops G 21,512<br />
GREAT BRIDGE<br />
Cahoon Commons D 278,023<br />
Cedar Lakes Center A 35,659<br />
Centerville Crossing A 50,000<br />
Crossings at Deep Creek A 68,970<br />
Dominion <strong>Market</strong>place A 73,103<br />
Dominion Plaza SC A 63,733<br />
Glenwood Square A 73,859<br />
Great Bridge SC A 156,937<br />
Hanbury Village A 100,560<br />
Harbor Watch Shoppes G 21,505<br />
Las Gaviotas A 82,000<br />
Millwood Plaza G 16,930<br />
Mt. Pleasant Shopping Center A 100,000<br />
Mt. Pleasant Village A 39,970<br />
Wilson Village A 52,500<br />
Woodford Shoppes B 9,760<br />
Woodford Square B 139,623<br />
GREENBRIER / BATTLEFIELD BOULEVARD<br />
Battlefield <strong>Market</strong>place G 30,000<br />
Chesapeake Crossing B 287,679<br />
Country Club Square H 12,600<br />
Crossways Center I & Eden Way Shops D 438,725<br />
Crossways II D 152,686<br />
Edinburgh Commons D 195,111<br />
Edinburgh East D 133,000<br />
Gainsborough Square A 88,862<br />
Greenbrier Mall I 899,665<br />
Greenbrier <strong>Market</strong> Center D 487,580<br />
Greenbrier South SC A 97,500<br />
Home Depot H 130,060<br />
K-Mart/OfficeMax H 165,000<br />
Knell’s Ridge Square G 40,000<br />
Lowes H 114,000<br />
Orchard Square A 88,910<br />
Parkview @ Greenbrier A 83,711<br />
Regal Cinemas H 60,763<br />
The Shoppes at Greenbrier G 40,000<br />
Towne Place at Greenbrier C 127,109<br />
Village Square G 15,000<br />
Volvo Parkway SC G 41,874<br />
Wal-Mart Way Crossing G 80,160<br />
Wal-Mart/Sam’s Club/Kohl’s D 433,821<br />
HILLTOP / GREAT NECK<br />
Great Neck Square A 93,887<br />
Great Neck Village A 73,836<br />
Hilltop East C 100,000<br />
Hilltop North B 202,511<br />
Hilltop Plaza B 152,025<br />
Hilltop Square B 220,413<br />
Hilltop West G 60,000<br />
La Promenade C 63,280<br />
<strong>Market</strong>place at Hilltop C 113,000<br />
Regency Hilltop B 236,549<br />
Renaissance Place G 47,667<br />
Target H 122,000<br />
HOLLAND / GREEN RUN<br />
Auburn Place A 42,709<br />
Chimney Hill B 207,175<br />
Green Run Square A 75,000<br />
Holland Plaza SC A 165,663<br />
Holland Windsor Crossing B 47,400<br />
Lowes H 125,323<br />
Lynnhaven Green A 50,838<br />
Rosemont Center A 12,700<br />
Shipps Corner A 63,355<br />
Timberlake SC A 73,500<br />
INDIAN RIVER / COLLEGE PARK<br />
<strong>College</strong> Park I & II B 181,902<br />
<strong>College</strong> Park Square H 183,874<br />
Indian River Plaza B 126,017<br />
Indian River SC A 123,752<br />
Tidewater Plaza A 50,638<br />
KEMPSVILLE<br />
Arrowhead Plaza A 97,006<br />
Fairfield SC B 239,763<br />
Kemps Corner Shoppes G 25,929<br />
Kemps River Center A 62,507<br />
Kemps River Crossing B 245,268<br />
Kempsville Crossing A 111,394<br />
Kempsville Plaza A 60,778<br />
21
Parkway <strong>Market</strong>place A 26,602<br />
Providence Square SC A 135,915<br />
University Shoppes A 26,100<br />
Witchduck Exchange A 50,000<br />
Woods Corner A 152,314<br />
LITTLE CREEK ROAD / WARDS CORNER /<br />
OCEAN VIEW<br />
Ames/Kroger B 140,568<br />
Dollar Tree Shopping Center A 51,415<br />
East Beach Shoppes A 63,000<br />
Farm Fresh - Little Creek H 66,000<br />
Glenwood Shoppes A 53,255<br />
Little Creek and Tidewater Shops B 119,820<br />
Little Creek East SC B 202,000<br />
Little Creek Square A 82,300<br />
Meadowbrook S C G 27,260<br />
Mid-Town A 75,768<br />
Mid-Way SC G 31,000<br />
Ocean View SC A 73,658<br />
Roosevelt Gardens SC A 109,175<br />
Southern Shopping Center B 239,719<br />
Suburban Park B 116,113<br />
Super Wal-Mart H 225,000<br />
Wards Corner Strip A 61,540<br />
Wedgewood SC A 130,000<br />
LITTLE NECK<br />
Birchwood SC A 358,635<br />
Home Depot H 130,060<br />
Kroger H 45,000<br />
London Bridge Plaza B 114,584<br />
Lowes H 160,000<br />
Lynnhaven 2600 A 13,326<br />
Lynnhaven Convenience G 36,900<br />
Lynnhaven Shopping Center B 191,136<br />
Princess Anne Plaza West C 77,558<br />
Regatta Bay Shops G 60,000<br />
Sam’s Club Plaza D 248,604<br />
LYNNHAVEN ROAD<br />
Lynnhaven Crossing G 55,550<br />
Lynnhaven East B 97,303<br />
Lynnhaven Mall I 1,293,100<br />
Lynnhaven North B 176,254<br />
Lynnshores Shopping Center G 12,692<br />
Lynnway Place G 30,213<br />
Parkway Plaza G 44,227<br />
Wal-Mart H 113,112<br />
MIDDLE PORTSMOUTH<br />
Afton SC A 106,500<br />
Airline <strong>Market</strong>place A 69,000<br />
Airline Plaza A 99,549<br />
Alexander’s Corner Shopping Center A 50,826<br />
Elmhurst Square A 66,250<br />
Gilmerton Square G 43,236<br />
Manor Commerce Center G 67,060<br />
Manor Shops G 14,573<br />
Old Towne <strong>Market</strong>place A 42,000<br />
Rodman SC A 45,000<br />
Super Wal-Mart H 200,000<br />
Triangle SC A 82,430<br />
Victory Crossing D 500,000<br />
Victory West Shopping Center A 167,102<br />
Williams Court B 214,739<br />
MILITARY HIGHWAY / JANAF<br />
3455 Azalea Garden Road A 73,180<br />
Best Square B 140,030<br />
Broad Creek SC D 205,417<br />
Bromley SC A 106,200<br />
CostCo H 110,000<br />
Dump/Mega Office G 115,854<br />
Farm Fresh H 60,000<br />
Food Lion #170 H 41,000<br />
Grand Outlet H 35,000<br />
Janaf D 878,381<br />
Lowes H 115,000<br />
Military Crossing D 195,003<br />
Military Triangle G 10,061<br />
Super K-Mart & Shoppes B 200,000<br />
Super Wal-Mart H 224,513<br />
The Gallery @ Military Circle I 856,542<br />
NEWTOWN<br />
Cypress Plaza SC A 59,012<br />
Cypress Point A 117,958<br />
Diamond Springs North (Shopping Center)<br />
A<br />
23,880<br />
Diamond Springs Shoppes H 18,840<br />
Newpointe SC A 92,978<br />
Newtown Baker Crossing A 91,687<br />
Newtown Center G 19,876<br />
Newtown Convenience Center G 19,800<br />
Northampton Business Center G 85,000<br />
Thomas Corner SC G 23,557<br />
Weblin Square G 31,552<br />
Wesleyan Commons Shopping Center A 54,204<br />
ODU<br />
First Floor Retail Shops at University Village Apartments<br />
39,691<br />
PEMBROKE<br />
Aragona SC A 69,700<br />
Best Buy H 45,000<br />
Circuit City H 38,414<br />
Collins Square A 123,870<br />
Columbus Village East A 63,000<br />
Columbus Village Entertainment Center E 100,000<br />
Dean Plaza (Former HQ) D 140,000<br />
Former Bloom Brothers H 50,400<br />
Giant Square B 150,000<br />
Goodwill H 34,000<br />
Haverty’s H 55,000<br />
G<br />
Haygood SC B 178,533<br />
Haynes H 228,000<br />
Hunter’s Mill Shoppes G 22,827<br />
Loehmann’s Plaza C 139,380<br />
Northern Super Center G 36,588<br />
Pembroke East B 27,200<br />
Pembroke Mall I 570,000<br />
Pembroke Meadows SC A 81,592<br />
Pembroke Place B 165,000<br />
Pembroke Plaza G 34,900<br />
Roomstore H 50,000<br />
The Town Center <strong>of</strong> Virginia Beach C 313,590<br />
PRINCESS ANNE ROAD<br />
Brenneman Farm SC A 228,197<br />
Courthouse <strong>Market</strong>place A 122,000<br />
Home Depot H 260,000<br />
Kempsville <strong>Market</strong>place A 71,460<br />
Landstown Commons D 505,766<br />
Lynnhaven Square S C G 22,933<br />
Parkway SC A 64,820<br />
Pleasant Valley <strong>Market</strong>place A 88,107<br />
Princess Anne <strong>Market</strong>place B 209,500<br />
Princess One SC A 84,725<br />
Salem Crossing D 92,407<br />
Salem Lakes <strong>Market</strong>place A 42,087<br />
Salem Lakes SC A 37,087<br />
Woodtide SC A 25,500<br />
SMITHFIELD<br />
Cypress Run SC G 25,000<br />
Eagle Harbor A 77,400<br />
Shoppes at Eagle Harbor A 23,000<br />
Smithfield Plaza B 89,120<br />
Smithfield Square A 65,244<br />
SUFFOLK<br />
Bennetts Creek Crossing A 109,812<br />
Bennetts Creek Food Lion A 64,544<br />
Harbor View Shoppes A 17,000<br />
Holland Plaza A 69,345<br />
Kensington Square A 60,000<br />
Lowes H 150,000<br />
Oak Ridge A 38,700<br />
Suffolk Plaza B 174,221<br />
Suffolk Plaza West A 60,000<br />
Suffolk SC B 165,803<br />
Suffolk Specialty Shops G 15,200<br />
Suffolk Village SC G 11,875<br />
Wal-Mart Super Center H 194,160<br />
PENINSULA<br />
COLISEUM CENTRAL<br />
Coliseum Corner A 49,267<br />
Coliseum Crossing B 221,004<br />
Coliseum <strong>Market</strong>place A 86,681<br />
<strong>2011</strong> <strong>Hampton</strong> <strong>Roads</strong> <strong>Real</strong> <strong>Estate</strong> <strong>Market</strong> <strong>Review</strong><br />
22
Coliseum Specialty Shops G 15,026<br />
Coliseum Square G 45,041<br />
<strong>Hampton</strong> Towne Centre D 376,100<br />
<strong>Hampton</strong> Woods A 89,092<br />
Home Depot H 130,060<br />
Peninsula Towncenter I 994,235<br />
Riverdale Plaza D 280,133<br />
Sports Authority H 40,000<br />
Target H 122,000<br />
The Power Plant D 621,150<br />
Todd Center & Todd Lane Shops B 242,000<br />
Wal-Mart Super Center H 193,316<br />
DENBIGH<br />
Beaconsdale SC A 28,000<br />
Denbigh Speciality Shops G 24,504<br />
Denbigh Village Centre B 334,299<br />
Denbigh Village Shopping Center H 327,322<br />
Ferguson Center G 118,000<br />
Former Hills Denbigh H 86,589<br />
Jefferson Crossing<br />
(formerly Denbigh Crossing) A 145,000<br />
Kmart H 115,854<br />
Lee Hall Plaza A 36,000<br />
Newport Crossing B 200,088<br />
Richneck Shopping Center A 63,425<br />
Stoneybrook Shopping Center A 74,340<br />
Turnberry Crossing A 53,775<br />
Village Square A 40,000<br />
Warwick Denbigh SC B 137,925<br />
FOXHILL / BUCKROE / EAST MERCURY<br />
Buckroe SC A 76,000<br />
Farm Fresh Phoebus H 39,000<br />
Kmart H 94,500<br />
Langley Square A 154,103<br />
<strong>Market</strong>place @ Nickerson A 70,450<br />
Nickerson Plaza A 83,849<br />
Willow Oaks Village Square S.C. B 193,728<br />
GLOUCESTER<br />
Food Lion H 40,000<br />
Hayes Plaza SC A 52,651<br />
Hayes SC A 100,000<br />
Home Depot H 100,000<br />
Lowe’s H 125,000<br />
Shoppes at Gloucester B 82,025<br />
Wal-Mart Super Center H 220,000<br />
York River Crossing B 175,000<br />
Brentwood SC A 53,600<br />
Dresden SC G 35,000<br />
Forest Park Square B 150,000<br />
Francisco Village A 55,865<br />
<strong>Hampton</strong> Plaza B 173,199<br />
Hilton SC A 74,000<br />
Midway Shopping Center G 58,780<br />
Newmarket South D 368,085<br />
Plaza @ Newmarket B 117,377<br />
Warwick Center A 150,000<br />
Warwick Village A 75,400<br />
PATRICK HENRY / OYSTER POINT / KILN CREEK<br />
Bayberry Village A 72,883<br />
Best Buy Building H 135,000<br />
City Center C 230,000<br />
Commonweatlh Center G 30,279<br />
Fairway Plaza G 37,950<br />
Glendale SC G 30,000<br />
Grand Furniture H 35,000<br />
Harris Teeter H 52,334<br />
Haverty’s H 45,000<br />
Haynes H 170,000<br />
Hidenwood SC A 108,000<br />
Jefferson Commons D 400,000<br />
Jefferson Greene G 57,430<br />
Jefferson Plaza D 178,200<br />
Kroger H 55,000<br />
Lowes H 120,000<br />
<strong>Market</strong> Place @ Oyster Point A 69,660<br />
Newport <strong>Market</strong>place D 450,000<br />
Newport Square B 184,126<br />
Office Depot H 30,122<br />
Oyster Point Plaza A 73,197<br />
Oyster Point Square A 83,089<br />
Patrick Henry Mall I 714,607<br />
Patrick Henry Place A 96,391<br />
Sam’s Club H 133,880<br />
The Shoppes at Oyster Point G 30,000<br />
Victory Center @ Kiln Creek A 61,000<br />
Village Square @ Kiln Creek B 263,000<br />
Villages <strong>of</strong> Kiln Creek G 45,300<br />
Wal-Mart Super Center H 201,146<br />
Yoder Plaza SC D 235,000<br />
POQUOSON<br />
Poquoson SC A 57,458<br />
Wythe Creek Plaza SC A 51,063<br />
James York Plaza B 137,708<br />
Kingsgate Green B 138,348<br />
Lowes H 163,000<br />
<strong>Market</strong>place Shoppes G 32,026<br />
<strong>Market</strong>place Shopping Center A 36,000<br />
Monticello <strong>Market</strong>place B 299,792<br />
Monticello SC A 82,000<br />
New Town Shops on Main C 253,000<br />
Norge Crossing H 52,000<br />
Olde Towne SC G 30,000<br />
Prime Outlets F 349,927<br />
Quarterpath Crossing A 85,600<br />
Settlers <strong>Market</strong> at New Town B 195,000<br />
Staples H 37,400<br />
The Marquis (Phase I) D 1,000,000<br />
The Shops at High Street B 114,449<br />
Village Shops at Kingsmill G 82,200<br />
Wal-Mart SuperCenter H 210,000<br />
Williamsburg Crossing A 149,933<br />
Williamsburg Farm Fresh A 79,188<br />
Williamsburg <strong>Market</strong>center B 120,920<br />
Williamsburg Outlet Mall I 180,000<br />
Williamsburg Pavillion Shops G 50,000<br />
Williamsburg SC I & II B 251,000<br />
Williamsburg Towne and Cnty A 49,802<br />
WindsorMeade <strong>Market</strong>place D 174,379<br />
Yankee Candle H 42,000<br />
YORK COUNTY<br />
Grafton SC A 32,000<br />
Heritage Square A 73,665<br />
Kiln Creek Center A 45,700<br />
Lakeside 17 H 8,400<br />
<strong>Market</strong>place @ Yorktown A 73,050<br />
Patriots Square A 47,231<br />
Shady Banks SC A 56,634<br />
Wal-Mart SuperCenter H 220,000<br />
Washington Square Shopping Center B 183,403<br />
York Square A 48,720<br />
Yorkshire Downs G 23,900<br />
HAMPTON MISCELLANEOUS<br />
Kecoughtan SC A 64,327<br />
The Shops at <strong>Hampton</strong> Harbor G 54,645<br />
NEWMARKET / MAIN<br />
4113 W Mercury Blvd. H 49,770<br />
4205 W. Mercury Blvd. H 28,080<br />
WILLIAMSBURG<br />
Colony Square A 66,806<br />
Ewell Station A 68,048<br />
Festival <strong>Market</strong>place G 16,216<br />
Gallery Shops G 18,187<br />
Governor’s Green SC A 100,000<br />
Home Depot H 130,000<br />
23
<strong>2011</strong><br />
HAMPTON ROADS<br />
REAL ESTATE<br />
MARKET REVIEW<br />
INDUSTRIAL<br />
Author<br />
Data<br />
Preparation<br />
Survey<br />
Coordination<br />
William C. Throne, SIOR, CCIM, ALC<br />
Vice President, Cushman & Wakefield/THALHIMER<br />
Stephanie Sanker, SIOR, CCIM<br />
Industrial Brokerage, S.L. Nusbaum <strong>Real</strong>ty Co.<br />
Stephanie Sanker, SIOR, CCIM<br />
Industrial Brokerage, S.L. Nusbaum <strong>Real</strong>ty Co.<br />
Reporters Greenbrier Christine Kaempfe<br />
Bainbridge/S. Elizabeth River Area<br />
Chip Worley<br />
Cavalier Industrial Park<br />
Pat Mumey<br />
Norfolk Commerce Park/Central Norfolk Area Worth Remick<br />
Norfolk Industrial Park<br />
Charles Dickinson<br />
West Side/MidTown Norfolk Area<br />
Billy King<br />
Lynnhaven<br />
Brian Baker<br />
Greenwich/Cleveland Streets Area<br />
Bobby Beasley<br />
Airport Industrial Area<br />
Bobby Beasley<br />
Portsmouth<br />
Sam Walker<br />
Suffolk<br />
Bill Throne<br />
Isle <strong>of</strong> Wight<br />
Billy King<br />
Copeland/Lower Peninsula<br />
Clay Culbreth<br />
Oyster Point/Middle Peninsula Area<br />
Bobby Philips<br />
Oakland/Upper Peninsula Area<br />
Clay Culbreth<br />
Williamsburg Extended Area<br />
Bobby Phillips<br />
Financial<br />
Support<br />
Disclosure<br />
The E. V. Williams Center for <strong>Real</strong> <strong>Estate</strong> and Economic Development<br />
(CREED) functions and reports are funded by donations from<br />
individuals, organizations and the CREED Council.<br />
The data used for this report are deemed reliable; however,<br />
neither Old Dominion University, the E. V. Williams Center for <strong>Real</strong><br />
<strong>Estate</strong> and Economic Development, nor sponsoring companies and/or<br />
individuals makes any representation or warranty as to its accuracy.<br />
25<br />
<strong>2011</strong> INDUSTRIAL
General Overview<br />
This report analyzes the 2010 industrial real estate conditions<br />
within the Virginia Beach-Norfolk-Newport News, VA-NC<br />
Metropolitan Statistical Area (the MSA), also known as <strong>Hampton</strong><br />
<strong>Roads</strong>. It provides inventory, vacancy, rent, sale and other data for<br />
the MSA. The survey includes properties in the cities <strong>of</strong> Chesapeake,<br />
<strong>Hampton</strong>, Newport News, Norfolk, Poquoson, Portsmouth, Suffolk,<br />
Virginia Beach and Williamsburg, plus the counties <strong>of</strong> Gloucester,<br />
James City, York and Isle <strong>of</strong> Wight.<br />
METHODOLOGY<br />
This survey includes the following types <strong>of</strong> properties:<br />
■ Office-warehouse, industrial and shop facilities <strong>of</strong> 5,000 square feet or greater, although some facilities <strong>of</strong> less than 5,000<br />
may be included.<br />
■ Properties must have less than 80% <strong>of</strong>fice space to be included in the ODU survey.<br />
■ Both owner-occupied and leased properties are included. Owner-occupied is defined as property that is 100% occupied<br />
by a business that is the same as or is related to the owner <strong>of</strong> the building.<br />
■ Leased properties are defined as all properties that are available and are listed for sale or lease regardless <strong>of</strong> whether they<br />
are occupied, unless they are strictly available for sale as an investment property, for example, a property that is available<br />
for sale and is currently occupied on a short term lease is included.<br />
■ All properties that have commenced construction (foundations installed as a minimum).<br />
The survey excludes the following types <strong>of</strong> properties:<br />
■ Land<br />
■ Warehouse or shop facilities on shipyard properties.<br />
■ Warehouse or industrial facilities on federal government property (e.g. military installations).<br />
■ Industrial facilities on government property (e.g. Norfolk International Terminal or Newport News Marine Terminal).<br />
<strong>2011</strong> <strong>Hampton</strong> <strong>Roads</strong> <strong>Real</strong> <strong>Estate</strong> <strong>Market</strong> <strong>Review</strong><br />
26
<strong>2011</strong> I N D U S T R I A L<br />
Functional submarket delineations are determined with some regard to city boundaries, but boundaries are not determinative.<br />
The entire market is divided into 16 submarkets defined by industrial building concentrations, the transportation network,<br />
and pertinent physical features. The area map included in this report provides a location for key reference.<br />
The E.V. Williams Center for <strong>Real</strong> <strong>Estate</strong> and Economic Development (CREED) at Old Dominion University has been<br />
tracking the inventory <strong>of</strong> the <strong>Hampton</strong> <strong>Roads</strong> industrial market since 1995. The results <strong>of</strong> this year’s survey (collected during the<br />
4th quarter <strong>of</strong> 2010) indicate that the <strong>Hampton</strong> <strong>Roads</strong> industrial market currently encompasses 106,691,857 square feet <strong>of</strong> space<br />
located in 2,866 buildings throughout the Region. This is a decrease <strong>of</strong> 2,030,258 square feet, or 1.9% from last year’s survey.<br />
The decrease is primarily due to the demolition <strong>of</strong> approximately 1 million square feet on the former Ford plant and increased<br />
accuracy <strong>of</strong> surveyors over previous years. Totals may differ from other market surveys due to the self-imposed limitations established<br />
by the ODU CREED methodology described above.<br />
INTRODUCTION<br />
The <strong>Hampton</strong> <strong>Roads</strong> industrial market continues to grow in complexity, while 2010 was mired in mediocrity. In 2010, overall<br />
vacancy rates remained essentially steady at 12.48%, deal velocity and absorption slowed, rents and sales prices declined, and<br />
there were no substantial deliveries.<br />
On the other side <strong>of</strong> the coin, interest in the Region continues from outside the area with a number <strong>of</strong> companies considering<br />
<strong>Hampton</strong> <strong>Roads</strong> for new manufacturing and distribution centers. Port volumes are increasing and a few large transactions<br />
took place in anticipation <strong>of</strong> a market rebound. John Wright, President <strong>of</strong> Waverton Associates, developer <strong>of</strong> a world class 300<br />
acre, rail served industrial park in Suffolk relates: “Interest in Waverton Commerce Park has not abated over the last few years,<br />
and in 2010 we got close to landing two national prospects. We see the increase in manufacturing nationwide and the upturn in<br />
export traffic through the Port <strong>of</strong> Virginia as a good leading edge indicator <strong>of</strong> where <strong>Hampton</strong> <strong>Roads</strong> can go in the next few years.”<br />
VACANCIES<br />
In 2010, the <strong>Hampton</strong> <strong>Roads</strong> Region saw vacancy rates decrease marginally from a 2009 level <strong>of</strong> 12.94% to 12.48%.<br />
Only four <strong>of</strong> the 16 submarkets were spared increasing vacancy rates.<br />
Submarkets that improved:<br />
■ Norfolk Commerce Park/Central Norfolk saw a decrease in vacancy rate from 38.41% to 16.3%. The former Ford<br />
manufacturing plant demolished almost 1.6 million square feet <strong>of</strong> obsolete space. The result was a decrease in total<br />
square footage <strong>of</strong> space, a reduction in vacant space, and the decline in vacancy rate.<br />
■ Suffolk saw a minor reduction from 19.13% to 18.27% with modest absorption. Caspari, Inc., a distribution company,<br />
leased 60,762 square feet at the Regional Commerce Center <strong>of</strong>f Rt. 58 and Rt. 460. Northern Suffolk (Northgate<br />
and Bridgeway Commerce Park) also saw absorption.<br />
■ Oyster Point/Middle Peninsula maintained strong occupancy rates, with only 157,203 square feet available in a<br />
market <strong>of</strong> 4.3 million square feet.<br />
■ Isle <strong>of</strong> Wight. Cost Plus took their excess space <strong>of</strong>f the market, thereby reducing vacancy in the market by 240,000<br />
square feet.<br />
<strong>Market</strong>s that fared significantly worse in 2010 include:<br />
■ The City <strong>of</strong> Chesapeake (Greenbrier, Cavalier, and Bainbridge/South Elizabeth River) saw overall vacancy rise from<br />
1,795,076 square feet to 2,429,786 square feet, a 35% increase from 8.8% to 11.88%. The addition <strong>of</strong> the Chesapeake<br />
Hardwoods accounted for much <strong>of</strong> the increase, with Greenbrier and Cavalier each adding vacant space.<br />
■ Airport Industrial Park, Virginia Beach. Vacancy rates increased to 18.35% from 9.67%. 318,000 square feet <strong>of</strong><br />
(primarily) older warehouse and distribution space came on line in 2010.<br />
Southside <strong>Hampton</strong> <strong>Roads</strong> finished 2010 with a vacancy rate <strong>of</strong> 13.24% compared to 14.29% for 2009, improving<br />
slightly. The Peninsula edged up to 10.59% from 9.49% a year ago. Overall <strong>Hampton</strong> <strong>Roads</strong> actual vacancy in 2010<br />
reached 13,313,836 square feet compared to 14,071,871 in 2009.<br />
<strong>2011</strong> INDUSTRIAL<br />
27
TABLE 1<br />
<strong>2011</strong> ODU <strong>Hampton</strong> <strong>Roads</strong> Industrial Survey<br />
Submarket Totals<br />
Bldgs<br />
Submarket City Surveyed Reporter Total Sq Ft Vacancy Sq Ft Vacancy %<br />
Greenbrier Area Chesapeake 283 Kaempfe 8,587,634 956,633 11.14%<br />
Bainbridge/S. Elizabeth River Area Chesapeake 143 Worley 5,835,039 659,621 11.30%<br />
Cavalier Industrial Park Area Chesapeake 189 Mumey 6,075,045 813,532 13.39%<br />
Norfolk Commerce Park/ Norfolk 144 Remick 5,442,588 887,018 16.30%<br />
Central Norfolk Area<br />
Norfolk Industrial Park Area Norfolk 352 Dickinson 10,196,224 1,201,596 11.78%<br />
West Side/Midtown Norfolk Area Norfolk 271 King 6,418,873 576,482 8.98%<br />
Lynnhaven Area Virginia Beach 283 Baker 8,132,331 1,141,225 14.03%<br />
Greenwich/Cleveland Streets Area Virginia Beach 125 Beasley 3,063,856 203,304 6.64%<br />
Airport Industrial Park Area Virginia Beach 72 Beasley 3,637,737 667,375 18.35%<br />
City <strong>of</strong> Portsmouth Portsmouth 161 Walker 4,221,156 303,145 7.18%<br />
City <strong>of</strong> Suffolk Suffolk 124 Throne 11,578,012 2,115,318 18.27%<br />
Isle <strong>of</strong> Wight Isle <strong>of</strong> Wight 30 King 2,970,400 556,276 18.73%<br />
Southside Totals 2,177 76,158,895 10,081,525 13.24%<br />
Copeland/Lower Peninsula Area Peninsula 370 Culbreth 12,139,266 2,038,564 16.79%<br />
Oyster Point/Middle Peninsula Area Peninsula 123 Phillips 4,330,663 157,203 3.63%<br />
Oakland/Upper Peninsula Area Peninsula 134 Culbreth 4,940,030 571,891 11.58%<br />
Williamsburg Extended Area Peninsula 62 Phillips 9,123,003 464,653 5.09%<br />
Peninsula Totals 689 30,532,962 3,232,311 10.59%<br />
Totals 2,866 Sanker 106,691,857 13,313,836 12.48%<br />
Building Sales<br />
Sales activity levels fell in 2010. Total sales transactions are shown below for the past four years, comparing number<br />
<strong>of</strong> building sales with average sales prices.<br />
Year Total Sales Average Size Average Price<br />
Per Square Foot<br />
2007 28 21,901 $93.02<br />
2008 60 29,828 $70.15<br />
2009 46 17,377 $68.44<br />
2010 23 48,200 $27.63<br />
A few analytical notes:<br />
1. Number <strong>of</strong> Sales: The data certainly reflects the general economy and national industrial market trends. Financing<br />
in <strong>Hampton</strong> <strong>Roads</strong> has been problematic. Hopefully the trend line has bottomed in 2010.<br />
2. Average Size: The 2010 average <strong>of</strong> 48,200 square feet is a result <strong>of</strong> four buildings sold over 100,000 square feet,<br />
and one over 450,000. At the peak <strong>of</strong> the market in 2008, only three buildings sold exceeded 100,000 square feet.<br />
<strong>2011</strong> <strong>Hampton</strong> <strong>Roads</strong> <strong>Real</strong> <strong>Estate</strong> <strong>Market</strong> <strong>Review</strong><br />
28
<strong>2011</strong> I N D U S T R I A L<br />
3. Average Price Per Square Foot:<br />
Buildings sold in 2010 tended to be<br />
larger, clearly distressed properties<br />
such as 201 West Dexter Street in<br />
Chesapeake, 3800 Village Avenue in<br />
Norfolk and 2211 Elliott Avenue in Portsmouth. All suffered from a combination <strong>of</strong> functional obsolescence/deferred<br />
maintenance and were deeply discounted.<br />
In contrast, few quality industrial buildings from 10,000 to 30,000 square feet (arguably the core size range for industrial<br />
users in <strong>Hampton</strong> <strong>Roads</strong>) traded in 2010. In 2008, 24 buildings sold in this square footage range. In 2010, only three<br />
traded. One possible conclusion: sellers who sell are truly distressed and buyers who buy are looking for deep discounts.<br />
Many companies are choosing to ‘stand pat’ in lieu <strong>of</strong> selling and relocating. Reasons include:<br />
1. Uncertainty in the future <strong>of</strong> business regulation and taxation;<br />
2. Growth and expansion as a corporate goal has generally been replaced with a drive toward greater efficiency and<br />
reduction in debt;<br />
3. A depressed real estate market;<br />
4. A shortage <strong>of</strong> prospective buyers, causing concern about extended marketing periods;<br />
5. Banking pressures to reduce overall debt load, including operational debt, lines <strong>of</strong> credit, equipment and real estate;<br />
6. Difficulty in obtaining acquisition financing with favorable terms to fund expansion and/or renovation.<br />
As a result, the industrial market has produced a self-induced drag on sales: Healthy companies choosing or<br />
needing to wait, and the lack <strong>of</strong> buyers forcing prices downward, in turn restricting their ability to sell and move to<br />
better facilities.<br />
Representative Building Sales<br />
As a result, the industrial market has produced a self-induced<br />
drag on sales: Healthy companies choosing or needing to<br />
wait, and the lack <strong>of</strong> buyers forcing prices downward, in turn<br />
restricting their ability to sell and move to better facilities.<br />
201 Dexter Street, Chesapeake December 2010 457,501 SF $6,000,000 $13.11 per SF<br />
215 Suburban Drive, Suffolk December 2010 102,055 SF $4,150,000 $40.66 per SF<br />
2211 Elliot Avenue, Portsmouth April 2010 76,046 SF $1,600,000 $21.04 per SF<br />
3800 Village Avenue, Norfolk March 2010 100,000 SF $2,000,000 $20.00 per SF<br />
715 Industrial Park Drive, Newport News January 2010 4,480 SF $305,000 $68.08 per SF<br />
1201 West Olney Road, Norfolk April 2010 4,979 SF $350,000 $70.30 per SF<br />
615 Chautauqua Avenue, Portsmouth July 2010 8,206 SF $360,000 $43.87 per SF<br />
1445-1453 Miller Store Road, Virginia Beach October 2010 40,000 SF $2,915,000 $72.83 per SF<br />
Leasing<br />
As expected, current vacancy rates have driven lease rates downward as landlords have worked to attract or retain<br />
tenants. In 2009 smaller spaces were less susceptible to rate retreat, but in 2010, all square foot sizes were vulnerable.<br />
High bay distribution buildings continued to suffer, with older obsolete buildings begging for tenants. In outlying<br />
areas, rents could be found as low as $1.00 per square foot.<br />
Free rent is a preferred concession, with financing for high levels <strong>of</strong> tenant improvements difficult to obtain for<br />
some landlords. One to two months <strong>of</strong> free rent for each year <strong>of</strong> lease term is not uncommon.<br />
<strong>2011</strong> INDUSTRIAL<br />
29
Representative Leasing<br />
1140 Azalea Garden Road, Norfolk 44,450 SF $4.00 3 years<br />
1431 Baker Road, Virginia Beach 38,580 SF $4.35 7 years<br />
6701 Bridgeway Business Center, Suffolk 20,450 SF $3.50 5 years<br />
3732 Cook Boulevard, Chesapeake 23,580 SF $4.95 7 years<br />
905 Live Oak Drive, Chesapeake 5,000 SF $5.25 3 years<br />
4840 Brookside Court, Norfolk 18,900 SF $4.76 5 years<br />
3745 Progress Road, Norfolk 32,000 SF $3.25 4 years<br />
680 Carolina Road, Suffolk 7,695 SF $3.50 3 years<br />
6900 Harbour View, Suffolk 31,500 SF $5.45 5 years<br />
2101 Aluminum Avenue, <strong>Hampton</strong> 32,000 SF $4.75 7 years<br />
720 Greenlawn Avenue, <strong>Hampton</strong> 44,000 SF $3.50 3 years<br />
Rents For Available Spaces By Size Range 2010<br />
60,000 square feet $1.00+<br />
Major <strong>Market</strong> Activity<br />
Aside from normal market transactions, there have been a number <strong>of</strong> significant industrial market developments<br />
worthy <strong>of</strong> note.<br />
1. Jacoby Development, former Ford Plant. Purchase <strong>of</strong> the property was imminent as 2010 came to a close by Atlanta<br />
Developer Jacoby Development. The City <strong>of</strong> Norfolk approved bond financing <strong>of</strong> $12 million to assist in the purchase,<br />
demolition and improvement <strong>of</strong> the property including the demolition <strong>of</strong> 1.6 million square feet in specialized manufacturing<br />
space, while 662,450 square feet <strong>of</strong> warehouse and manufacturing space remains along with acreage available<br />
for development.<br />
2. International Paper. A major employer in western <strong>Hampton</strong> <strong>Roads</strong>, this closure was a blow to the employment market.<br />
In addition to the Franklin mill, International Paper owns a number <strong>of</strong> other available industrial buildings in<br />
<strong>Hampton</strong> <strong>Roads</strong> in Cavalier Industrial Park in Chesapeake, Suffolk and Newport News submarkets. The International<br />
Paper property is not included in the ODU Survey due to its location in Isle <strong>of</strong> Wight County traditionally outside the<br />
survey boundaries.<br />
3. Kinder Morgan purchased 41 acres to add to their terminaling operations on Freeman Avenue in Chesapeake along<br />
the Elizabeth River.<br />
4. 201 West Dexter Street, Chesapeake. The sale <strong>of</strong> this 457,501 square foot industrial building on 21 acres on South Dexter<br />
Street demonstrates that creativity helps in today’s market. The sale included a corporate bankruptcy filing; a sale<br />
<strong>of</strong> debt on the property; an auction <strong>of</strong> the real estate; and investors looking for a great deal to hold for future development.<br />
Ultimate sales price: $6 million, or $13.11 per square foot.<br />
5. 215 Suburban Drive, Suffolk. One local company expanded in 2010 with the purchase <strong>of</strong> a 102,000 square foot<br />
building in eastern Suffolk. Kerma Medical relocated from Portsmouth almost doubling in size and achieving<br />
greater manufacturing efficiencies.<br />
6. Becton Dickenson. One that got away. Becton Dickenson was searching for 600,000 square feet with expansion to<br />
1,000,000 square feet in Virginia and North Carolina. North Carolina got the requirement. This deal reflects the<br />
strengths and some <strong>of</strong> the challenges facing <strong>Hampton</strong> <strong>Roads</strong> in attracting top quality industrial companies to the area.<br />
<strong>2011</strong> <strong>Hampton</strong> <strong>Roads</strong> <strong>Real</strong> <strong>Estate</strong> <strong>Market</strong> <strong>Review</strong><br />
30
<strong>2011</strong> I N D U S T R I A L<br />
Regional Influences on the Local <strong>Market</strong><br />
Beyond real estate transactions, the following events occurred in 2010 that will influence the <strong>Hampton</strong> <strong>Roads</strong> Industrial<br />
market for years to come.<br />
1. The Port <strong>of</strong> Virginia<br />
■ MAERSK/Port <strong>of</strong> Virginia lease. In Fall 2010, the Port <strong>of</strong> Virginia and APM Terminals signed a 20 year lease<br />
agreement assigning operational control <strong>of</strong> this ‘state <strong>of</strong> the art’ terminal to Virginia International Terminals, the<br />
operating arm <strong>of</strong> the Port <strong>of</strong> Virginia. The APM facility is equipped with advanced automated cranes and immediate<br />
rail access to the CSX and Norfolk Southern Class I rail lines.<br />
■ TEU volumes (import and export) at the Port <strong>of</strong> Virginia were up in 2010 by 8.9% to 1,859,018 TEU’s, but still<br />
less than 2005 levels. Export volume exceeded import volume 54% to 46%.<br />
Commenting on port volumes, Neil Doyle <strong>of</strong> CenterPoint Properties relates: “Though port volumes, as measured<br />
by the Virginia Port Authority in TEU’s, seem to indicate a clear rebound in trade in 2010, its effect on the<br />
industrial real estate market in <strong>Hampton</strong> <strong>Roads</strong> has yet to be realized. Or has it? One would argue that the local<br />
industrial market is undersized for the port volumes, yet we still see double digit vacancy. There is disconnect<br />
there (be it product type, location, or other factor) with space <strong>of</strong>fered to users. <strong>2011</strong> and 2012 should <strong>of</strong>fer us<br />
a few more pieces <strong>of</strong> this puzzle and begin to foreshadow the future <strong>of</strong> the ports and the local industrial real estate<br />
market allowing those with a vested interest a road map going forward.”<br />
■ Norfolk Southern and the Heartland Corridor. In September, trains rolled to Columbus, Ohio and Chicago,<br />
Illinois along the new Heartland Corridor. An investment <strong>of</strong> $320 million in both public and private funds allow<br />
double stacked trains to reduce the distance to Chicago by 230 miles, cutting delivery time by a day and a half,<br />
and doubling the potential container volume per car.<br />
Conclusion: HREDA and the Year Ahead<br />
The <strong>Hampton</strong> <strong>Roads</strong> Economic Development Alliance December Business Attraction Report for 2010 is one report card for<br />
the Region. Reporting on activity for 2010 as it compares to previous years, the report presents the following:<br />
Project Year 2007 2009 YTD December 2010<br />
Projects n/a 146 160<br />
Prospect Visits 206 42 51<br />
Announcements 20 5 5<br />
Capital Investment (millions) $94.27 $18.75 $8.2<br />
Square footage 772,850 115,700 88,100<br />
Clearly the <strong>Hampton</strong> <strong>Roads</strong> industrial market is suffering. Whether 2010 represented ‘bottom’ is open to speculation.<br />
The last time the local industrial market experienced vacancy rates above 12%, the recovery took three years to return to less<br />
than 10%, and another five years to reach a norm <strong>of</strong> around 7%.<br />
Looking forward to <strong>2011</strong>, ‘ground level’ business users are looking at varied economic indicators in the marketplace to<br />
gauge where their businesses are going. Industrial companies in the <strong>Hampton</strong> <strong>Roads</strong> MSA are setting their sights on a wide<br />
variety <strong>of</strong> market influences, including trend lines in sales volumes, energy costs and production expenditures, in projecting<br />
performance levels in <strong>2011</strong>.<br />
For industrial companies, both large and small, the instability in the marketplace experienced during the last several years<br />
has changed the structure <strong>of</strong> how business is done. Recovery efforts and sales volume in 2010 indicate that the trend line<br />
is pointed in the right direction <strong>of</strong>fering a modest degree <strong>of</strong> optimism for <strong>2011</strong> and beyond. As we move out <strong>of</strong> 2010, the<br />
Industrial real estate market is looking for measured steady growth back to health.<br />
<strong>2011</strong> INDUSTRIAL<br />
31
Industrial Submarkets<br />
Southside<br />
Airport Industrial Park<br />
Bainbridge<br />
Cavalier<br />
Central Norfolk<br />
Cleveland<br />
Greenbrier<br />
Lynnhaven<br />
Norfolk Industrial Park<br />
Portsmouth<br />
Suffolk<br />
West Norfolk<br />
Peninsula<br />
Copeland<br />
Oakland<br />
Oyster Point<br />
Williamsburg Extended
<strong>2011</strong><br />
HAMPTON ROADS<br />
REAL ESTATE<br />
MARKET REVIEW<br />
OFFICE<br />
Author<br />
Data Analysis<br />
Maureen G. Rooks<br />
Vice President, Jones Lang LaSalle<br />
Nicolas Politas<br />
Research & Financial Analyst<br />
Jones Lang LaSalle<br />
Financial<br />
Support<br />
Disclosure<br />
The E. V. Williams Center for <strong>Real</strong> <strong>Estate</strong> and Economic<br />
Development (CREED) functions and reports are<br />
funded by donations from individuals, organizations<br />
and the CREED Council.<br />
The data used for this report are deemed reliable; however,<br />
neither Old Dominion University, the E. V. Williams Center for <strong>Real</strong> <strong>Estate</strong><br />
and Economic Development, nor sponsoring companies and/or<br />
individuals makes any representation or warranty as to its accuracy.<br />
<strong>2011</strong> OFFICE<br />
33
General Overview<br />
TThe <strong>Hampton</strong> <strong>Roads</strong> <strong>of</strong>fice market ended 2010 with relative<br />
stability and with statistical performance reflecting a slow yearend<br />
turn towards recovery and potential growth in <strong>2011</strong>.<br />
Representing a tenant-oriented marketplace driven by economic<br />
incentives, a notable inventory <strong>of</strong> new supply, and stagnant leasing<br />
activity, the <strong>Hampton</strong> <strong>Roads</strong> <strong>of</strong>fice market is looking to market<br />
performance during the first two quarters <strong>of</strong> <strong>2011</strong> as an important<br />
predictor <strong>of</strong> overall market recovery characterized by positive<br />
absorption and decreasing vacancy rates.<br />
The overall <strong>of</strong>fice vacancy rate for <strong>Hampton</strong> <strong>Roads</strong> remained<br />
a steady 14.6 percent at year-end 2010 bearing little traction from<br />
the year-end 2009 vacancy rate <strong>of</strong> 14.5 percent for the region. However, <strong>Hampton</strong> <strong>Roads</strong> did outperform the National Office<br />
<strong>Market</strong> vacancy <strong>of</strong> 16.2 percent and demonstrated relative market strength in comparison with other regional markets<br />
The information in this report relies on market reports from the Brookings Institution, CoStar<br />
METHODOLOGY and individual interviews <strong>of</strong> local <strong>of</strong>fice brokers. The methodology or parameters <strong>of</strong> size included<br />
in the report for all <strong>of</strong> <strong>Hampton</strong> <strong>Roads</strong> were 19,000 SF and higher for the largest completed<br />
lease transactions in 2010; 5,000 SF and higher were included for the top completed <strong>of</strong>fice building sales transactions<br />
in 2010; approximately five acres and higher were included for the top completed <strong>of</strong>fice land sales transactions in 2010; and<br />
19,000 SF and higher were included for top new construction deliveries in 2010.<br />
OFFICE MARKET ACTIVITY LIKELY TO PICK UP IN <strong>2011</strong><br />
Economy<br />
The economy in <strong>Hampton</strong> <strong>Roads</strong> has remained resilient, and was recently recognized in a study by the Brookings Institution<br />
as a top performing region in the United States. The study analyzed economic performance during the recession and<br />
during post-recession recovery, focusing on data representing employment and economic output. Unemployment in <strong>Hampton</strong><br />
<strong>Roads</strong> has dropped to 7.0 percent, from its peak rate <strong>of</strong> 7.4 percent in August 2010.<br />
The dust has started to settle around the disestablishment <strong>of</strong> United States Joint Forces Command (USJFCOM), and<br />
initial fears have subsided as the potential consequences may prove to be less <strong>of</strong> an economic impact than initially anticipated.<br />
Uncertainty following the announced disestablishment <strong>of</strong> the USJFCOM prompted tenants and investors in the market to<br />
step back and observe how the market would be affected. There is still a level <strong>of</strong> residual uncertainty surrounding a potential<br />
spike in vacancy from tenants tied to USJFCOM causing some government contractor <strong>of</strong>fice tenants to close, downsize,<br />
or discontinue any expansions planned for fourth quarter 2010 and the first half <strong>of</strong> <strong>2011</strong>.<br />
<strong>2011</strong> <strong>Hampton</strong> <strong>Roads</strong> <strong>Real</strong> <strong>Estate</strong> <strong>Market</strong> <strong>Review</strong><br />
34
<strong>2011</strong> O F F I C E<br />
New and existing <strong>Hampton</strong> <strong>Roads</strong> tenants are preparing to backfill vacancies created by USJFCOM’s exodus in the<br />
Harbour View area <strong>of</strong> Suffolk. In addition, <strong>Hampton</strong> <strong>Roads</strong> looks forward to the benefits <strong>of</strong> the completion <strong>of</strong> the Norfolk<br />
Southern “Heartland Corridor” which will be a direct rail connection from the Virginia ports to Chicago.<br />
<strong>Market</strong> Conditions<br />
In many ways, 2010 represented a settling period in the market. Other than medical sector growth, some government contractors,<br />
and private colleges and universities entering and expanding in the <strong>Hampton</strong> <strong>Roads</strong> area, there has been little economic<br />
growth by way <strong>of</strong> <strong>of</strong>fice tenants. There were fewer lease transactions completed in the last quarter <strong>of</strong> 2010 than any other since<br />
the beginning <strong>of</strong> 2009, resulting in a fairly stagnant market. The overall vacancy rate remained a steady 14.6 percent, which is<br />
still below the National Office <strong>Market</strong> vacancy <strong>of</strong> 16.2%. Rental rates remained flat throughout the year, and large rent abatements<br />
remain prevalent. Despite the lack <strong>of</strong> leasing<br />
activity, brokers in the market reported a surge<br />
in tour activity. The increase in tour activity due to<br />
new tenants entering the market will hopefully<br />
translate into positive absorption and continued increases<br />
in activity in <strong>2011</strong>.<br />
Outlook<br />
<strong>Market</strong> performance during the first two quarters<br />
<strong>of</strong> <strong>2011</strong> will be especially important in measuring<br />
overall market recovery and potential growth<br />
in <strong>Hampton</strong> <strong>Roads</strong>. Leasing activity is expected to<br />
increase as tenants gain more confidence in the<br />
market. Rent rates will likely remain relatively flat<br />
over the next 12 months, and tenants will continue<br />
to expect highly attractive rent concessions. The<br />
market has become less dependent on “blend and<br />
extend” renewals and it is possible that fundamentals<br />
will begin to shift as early as the fourth quarter<br />
<strong>of</strong> <strong>2011</strong> or the beginning <strong>of</strong> 2012.<br />
Pricing Demand Supply<br />
Key <strong>Market</strong> Indicators<br />
Supply<br />
26,816,106 sf<br />
Direct vacancy rate 13.7%<br />
Total vacancy rate 14.6%<br />
Under construction<br />
80,742 sf<br />
Leasing activity 12 mo. % change -14.7%<br />
YTD net absorption<br />
281,916 sf<br />
12-month overall rent % change -4.1%<br />
Class A overall asking rent<br />
Class B overall asking rent<br />
$21.37 psf<br />
$16.09 psf<br />
12-month<br />
forecast<br />
*Please note the above statistics were derived and referenced from the Brookings Institution. They <strong>of</strong>fered the overall <strong>of</strong>fice vacancy rate <strong>of</strong> <strong>Hampton</strong> <strong>Roads</strong> at 14.6%. CoStar’s<br />
statistics, which are also referenced in this report, differed by 2% <strong>of</strong>fering an overall <strong>of</strong>fice vacancy rate <strong>of</strong> 12.6%. The percentage difference is the utilization <strong>of</strong> A,B,C & F <strong>of</strong>fice<br />
properties with Brookings and only A,B & C <strong>of</strong>fice properties with CoStar.<br />
Net New Supply, Net Absorption and Total Vacancy<br />
1,500,000<br />
20%<br />
Leasing Activity vs. Sublease Vacant Space<br />
1,000,000<br />
15%<br />
2,000,000<br />
Leasing Activity<br />
Sublease Space<br />
Square Feet<br />
500,000<br />
0<br />
-500,000<br />
2006 2007 2008 2009 2010<br />
Net New Supply Total Vacancy<br />
Net Absorption<br />
10%<br />
5%<br />
0%<br />
Square Feet<br />
1,500,000<br />
1,000,000<br />
500,000<br />
0<br />
2006 2007 2008 2009 2010<br />
<strong>2011</strong> OFFICE<br />
Sublease space includes vacant space.<br />
35
Tenant Perspective<br />
As the <strong>Hampton</strong> <strong>Roads</strong> market continues to stabilize, tenants remain in the driver seat with a significant advantage in<br />
the market. Economic uncertainty surrounding the disestablishment <strong>of</strong> USJFCOM and overall high vacancy has put pressure<br />
on landlords to <strong>of</strong>fer greater incentives to keep the tenants they currently have and to compete for tenants entering the<br />
market. Free rent and high tenant improvement allowances have become commonplace and will remain in place over the next<br />
12 months, most likely tightening during the course <strong>of</strong> <strong>2011</strong>. The bottomed-out rental rates and high competition among landlords<br />
continues to present the opportunity for tenants to trade up to higher class space at similar or cheaper costs than currently<br />
experienced. The next two quarters will become the optimal timing for tenants looking to renew and cut rent costs as<br />
economic incentives should begin a decline within the third quarter <strong>of</strong> <strong>2011</strong>.<br />
Landlord Perspective<br />
Landlords must focus on keeping the tenants they have, while <strong>of</strong>fering attractive rates and rent abatements to aggressively<br />
lure tenants entering the market. As the market in <strong>Hampton</strong> <strong>Roads</strong> bottomed out, the lack <strong>of</strong> new leasing activity extended<br />
landlords’ struggle to maintain high occupancy rates. In order to stay competitive, landlords have been forced to drop<br />
rental rates below what they were at the end <strong>of</strong> 2006, and <strong>of</strong>fer more free rent plus larger tenant improvement allowances.<br />
The aftermath <strong>of</strong> the recession has left landlords with large debt obligations that must become top priority. With over 4.6 million<br />
square feet in new supply added to the market since the start <strong>of</strong> 2007, it is highly unlikely that there will be any speculative<br />
<strong>of</strong>fice construction in the next 18-24 months. Landlords are currently at the bottom <strong>of</strong> the market slowly moving up;<br />
and those owning top quality spaces can expect fundamentals to begin to shift as early as the fourth quarter <strong>of</strong> <strong>2011</strong>.<br />
Class A Overall Asking Rents<br />
$25<br />
Peninsula Southside<br />
$20<br />
Class A Tenant Improvement Allowance<br />
$20<br />
Peninsula Southside<br />
$ Per Square Feet<br />
$15<br />
$10<br />
$5<br />
$ Per Square Feet<br />
$10<br />
$0<br />
2006 2007 2008 2009 2010<br />
$0<br />
2006 2007 2008 2009 2010<br />
Class A Free Rent<br />
Months<br />
8<br />
Peninsula Southside<br />
6<br />
4<br />
2<br />
0<br />
2006 2007 2008 2009 2010<br />
Class A Blocks <strong>of</strong> Vacant Contiguous Space<br />
Number <strong>of</strong> Blocks<br />
25<br />
20<br />
15<br />
10<br />
5<br />
0<br />
15<br />
2<br />
25,000 -<br />
50,000 SF<br />
Peninsula<br />
4<br />
50,000 -<br />
100,000 SF<br />
Southside<br />
100,000 -<br />
200,000 SF<br />
0 0<br />
> 200,000 SF<br />
<strong>2011</strong> <strong>Hampton</strong> <strong>Roads</strong> <strong>Real</strong> <strong>Estate</strong> <strong>Market</strong> <strong>Review</strong><br />
36
<strong>2011</strong> O F F I C E<br />
Submarket Leverage – <strong>Market</strong> History and Forecast<br />
Submarket 2008 2009 2010 <strong>2011</strong> 2012<br />
Newport News<br />
<strong>Hampton</strong><br />
Williamsburg<br />
Yorktown<br />
Norfolk<br />
Virginia Beach<br />
Portsmouth<br />
Chesapeake<br />
Suffolk<br />
Property Clock – Current <strong>Market</strong> Conditions<br />
Landlord Leverage<br />
Peaking<br />
<strong>Market</strong><br />
Rising<br />
<strong>Market</strong><br />
Falling<br />
<strong>Market</strong><br />
Bottoming<br />
<strong>Market</strong><br />
Peninsula<br />
Southside<br />
Tenant Leverage<br />
Landlord-favorable conditions<br />
Tenant-favorable conditions<br />
Balanced conditions<br />
Largest Completed Lease Transactions - 2010<br />
Tenant Address Submarket SF Type<br />
Labels Unlimited 2505 Hawkeye Court Virginia Beach 65,000 Expansion<br />
Verizon Wireless 240 Clearfield Avenue Virginia Beach 52,329 Renewal<br />
Monarch Bank 1435 Crossways Boulevard Chesapeake 52,000 Relocation<br />
Tidewater Physicians Multi-Specialty Group Discovery Park Drive Williamsburg 40,000 Build-to-suit<br />
Booz Allen Hamilton Inc 5800 Lake Wright Drive Norfolk 34,577 Renewal<br />
ISHPI 6900 Harbour View Boulevard Suffolk 31,500 Relocation<br />
Strayer University 676 Independence Parkway Chesapeake 25,622 New<br />
Amerigroup 4433 Corporation Lane Virginia Beach 23,532 New<br />
URS Federal Technical Services Inc. 4565 Progress Road Norfolk 23,116 Renewal<br />
Towne Insurance 301 Bendix Road Virginia Beach 19,000 Relocation<br />
Co-Writers: Nicolas Politas; Research & Finance Analyst; Maureen Rooks, Vice President, Jones Lang LaSalle |Sources: CoStar Group, Inc.<br />
Top Completed Office Building Sales/Transactions<br />
Address Submarket Buyer / Seller SF $ PSF<br />
2600 Washington Avenue Newport News Sage <strong>Real</strong>ty Partners / Berkadia Comm Mtg LLC 134,172 $15.47<br />
535 Independence Parkway Chesapeake First Potomac <strong>Real</strong>ty Trust / VJM LLC 96,720 $89.95<br />
1435 Crossways Blvd Chesapeake Monarch Bank / Crossways Center LLC 50,882 $87.85<br />
5838 Harbour View Blvd Suffolk HC REIT / Harbour View Medical Arts LLC 49,000 $255<br />
5360 Robin Hood Road Norfolk Robin Hood Road LLC / Undisclosed 42,000 $41<br />
11835 Fishing Point Drive Newport News 11835 Fishing Pt LLC / Oysterpoint Med Ctr LLC 32,174 $93.24<br />
11790 Jefferson Avenue Newport News BBK Enterprises LLC / JSA Four LLC 20,311 $115.70<br />
7907 Marshall Avenue Newport News Wright <strong>Real</strong> <strong>Estate</strong> Hldgs LLC / JMC Comm LLC 19,256 $77.27<br />
751 J Clyde Morris Blvd Newport News Tidewater PT Inc / Helmuth W Treishmann Jr 18,000 $96.03<br />
345 W Freemason Street Norfolk US Old Pt Natl Bank <strong>of</strong> Phoeb / Zemanian Peter G 8,457 $171.46<br />
200 E Plume Street Norfolk KJR Plume LLC / SL Nusbaum <strong>Real</strong>ty Co 4,884 $157.66<br />
37<br />
<strong>2011</strong> OFFICE
Top Completed Office Land Sales/Transactions<br />
Address Submarket Buyer / Seller Acres $ PSF<br />
Princess Anne Rd / S. Ind Blvd Virginia Beach Wells Fargo Bank NA / Spence Family Farm LP 133.8 $3.29<br />
12080 Jefferson Avenue Newport News WM Jordan Company / W&M <strong>Real</strong> <strong>Estate</strong> Foundation 43.5 $4.22<br />
881 Carolina Road Suffolk Better Health Care Family Svcs LLC / 4.43 $17.88<br />
L Walton & H Ismael<br />
1600 Richmond Road Williamsburg CVS Caremark / Americas Best Value Inn 4.04 $19.32<br />
1560 International Blvd Norfolk Edward Street LLC / Park Crescent Associates LP 7.70 $7.45<br />
5223 Monticello Avenue Williamsburg New Town Six LLC / Exxon Mobil Corporation 4.92 $10.73<br />
Top Select New Construction Deliveries (2010)<br />
Address Submarket Broker / Developer SF<br />
The Wells Fargo Center Norfolk SL Nusbaum <strong>Real</strong>ty Co 299,887<br />
Medical Office Tower Norfolk Lauth Property Group 196,000<br />
Virginia Natural Gas Bldg Virginia Beach Divaris <strong>Real</strong> <strong>Estate</strong> Inc 48,242<br />
101 Production Road Yorktown Harvey Lindsay Commercial <strong>Real</strong> <strong>Estate</strong> 30,000<br />
4388 Holland Road Virginia Beach Thalhimer 27,844<br />
Towne Bank Suffolk TowneBank Foundation 19,318<br />
Class A Office <strong>Market</strong> Statistics <strong>Hampton</strong> <strong>Roads</strong> (Year-end 2010)<br />
<strong>Market</strong> Existing Inventory Vacancy YTD net YTD Under Quoted<br />
Absorption Deliveries Const SF Rates<br />
# Blds Total r.b.a. Direct SF Total SF Vac %<br />
Peninsula 35 2,956,724 398,297 406,520 13.7% 18,706 0 0 $20.93<br />
Southside 117 10,863,360 1,670,016 1,727,691 15.9% 353,483 495,887 0 $21.46<br />
Totals 152 13,820,084 2,068,313 2,134,211 14.8% 372,189 495,887 0<br />
Class B Office <strong>Market</strong> Statistics <strong>Hampton</strong> <strong>Roads</strong> (Year-end 2010)<br />
<strong>Market</strong> Existing Inventory Vacancy YTD net YTD Under Quoted<br />
Absorption Deliveries Const SF Rates<br />
# Blds Total r.b.a. Direct SF Total SF Vac %<br />
Peninsula 654 8,477,632 970,662 1,007,881 11.9% 33,607 47,332 48,000 $15.87<br />
Southside 759 14,579,924 1,971,750 2,018,766 13.8% (53,274) 119,507 47501 $16.25<br />
Totals 1413 23,057,556 2,942,412 3,026,647 12.9% (19,667) 166,839 0<br />
<strong>2011</strong> <strong>Hampton</strong> <strong>Roads</strong> <strong>Real</strong> <strong>Estate</strong> <strong>Market</strong> <strong>Review</strong><br />
38
<strong>2011</strong> O F F I C E<br />
Class C Office <strong>Market</strong> Statistics <strong>Hampton</strong> <strong>Roads</strong> (Year-end 2010)<br />
<strong>Market</strong> Existing Inventory Vacancy YTD net YTD Under Quoted<br />
Absorption Deliveries Const SF Rates<br />
# Blds Total r.b.a. Direct SF Total SF Vac %<br />
Peninsula 403 2,159,058 231,316 231,316 10.7% (28,443) 0 0 $11.78<br />
Southside 1,018 6,381,931 376,171 378,251 5.9% (62,282) 0 0 $13.60<br />
Totals 1,421 8,540,989 607,487 609,567 8.3% (90,725) 0 0<br />
Total Office <strong>Market</strong> Statistics <strong>Hampton</strong> <strong>Roads</strong> (Year-end 2010)<br />
<strong>Market</strong> Existing Inventory Vacancy YTD net YTD Under Quoted<br />
Absorption Deliveries Const SF Rates<br />
# Blds Total r.b.a. Direct SF Total SF Vac %<br />
Peninsula 1,092 13,593,414 1,600,275 1,645,717 12.1% 23,870 47,332 48,000 $16.69<br />
Southside 1,894 31,825,215 4,017,937 4,124,708 13.0% 237,927 615,394 47,501 $18.36<br />
Totals 2,986 45,418,629 5,618,212 5,770,425 12.6%* 261,797 662,726 95,501<br />
*Please note the above statistics were derived and referenced from the Brookings Institution. They <strong>of</strong>fered the overall <strong>of</strong>fice vacancy rate <strong>of</strong> <strong>Hampton</strong> <strong>Roads</strong> at 14.6%. CoStar’s statistics,<br />
which are also referenced in this report, differed by 2% <strong>of</strong>fering an overall <strong>of</strong>fice vacancy rate <strong>of</strong> 12.6%. The percentage difference is the utilization <strong>of</strong> A,B,C & F <strong>of</strong>fice properties with Brookings<br />
and only A,B & C <strong>of</strong>fice properties with CoStar.<br />
Class A - Significant Office <strong>Market</strong> Statistics <strong>Hampton</strong> <strong>Roads</strong> (Year-end 2010)<br />
<strong>Market</strong> Existing Inventory Vacancy YTD net YTD Under Quoted<br />
Absorption Deliveries Const SF Rates<br />
# Blds Total r.b.a. Direct SF Total SF Vac %<br />
Downtown<br />
Norfolk 11 2,650,318 484,250 488,805 18.4% 44,385 299,887 0 $23.38<br />
Harbour View 11 1,055,699 149,353 154,153 14.6% 19,702 0 0 $22.18<br />
Oyster Point 16 1,128,426 182,391 182,391 16.2% (4,829) 0 0 $21.69<br />
VA Beach CBD 14 1,297,764 99,573 107,823 8.3% 100,299 0 0 $23.43<br />
Totals 52 6,132,207 915,567 933,172 14.4% 159,557 299,887 0<br />
Class B - Significant Office <strong>Market</strong> Statistics <strong>Hampton</strong> <strong>Roads</strong> (Year-end 2010)<br />
<strong>Market</strong> Existing Inventory Vacancy YTD net YTD Under Quoted<br />
Absorption Deliveries Const SF Rates<br />
# Blds Total r.b.a. Direct SF Total SF Vac %<br />
Downtown<br />
Norfolk 53 1,912,078 336,770 337,970 17.7% (57,781) 0 2,000 $16.40<br />
Harbour View 23 504,967 41,494 41,494 8.2% 21,308 32,578 12,930 $18.92<br />
Oyster Point 197 3,089,852 385,166 405,331 13.1% (40,851) 0 0 $15.93<br />
VA Beach CBD 19 661,684 67,259 71,300 10.8% 15,922 0 0 $18.35<br />
Totals 292 6,168,581 830,689 856,095 12.5% (61,402) 32,578 14,930<br />
<strong>2011</strong> OFFICE<br />
39
Class C - Significant Office <strong>Market</strong> Statistics <strong>Hampton</strong> <strong>Roads</strong> (Year-end 2010)<br />
<strong>Market</strong> Existing Inventory Vacancy YTD net YTD Under Quoted<br />
Absorption Deliveries Const SF Rates<br />
# Blds Total r.b.a. Direct SF Total SF Vac %<br />
Downtown<br />
Norfolk 39 385,262 38,845 38,845 10.1% (1,111) 0 0 $12.69<br />
Harbour View 4 14,120 3,893 3,893 27.6% (1,873) 0 0 $12.75<br />
Oyster Point 144 702,329 36,424 36,424 5.2% (7,123) 0 0 $12.30<br />
VA Beach CBD 3 8,808 0 0 0.0% (15,000) 0 0 N/A<br />
Totals 190 1,110,519 79,162 79,162 14.3% (25,107) 0 0<br />
Significant Office <strong>Market</strong> Statistics <strong>Hampton</strong> <strong>Roads</strong> (Year-end 2010)<br />
<strong>Market</strong> Existing Inventory Vacancy YTD net YTD Under Quoted<br />
Absorption Deliveries Const SF Rates<br />
# Blds Total r.b.a. Direct SF Total SF Vac %<br />
Downtown<br />
Norfolk 103 4,947,658 859,865 865,620 17.5% (14,507) 299,887 2,000 $20.50<br />
Harbour View 38 1,574,786 194,740 199,540 12.7% 39,137 32,578 12,930 $21.77<br />
Oyster Point 357 4,920,607 603,981 624,146 12.7% (52,803) 0 0 $17.65<br />
VA Beach CBD 36 1,968,256 166,832 179,123 9.1% 101,221 0 0 $21.09<br />
Totals 534 13,411,307 1,825,418 1,868,429 13.0% 73,048 332,465 14,930<br />
Source: CoStar Group, Inc.<br />
©<strong>2011</strong> Jones Lang LaSalle IP, Inc. All rights reserved. All information contained herein is from sources deemed reliable; however,<br />
no representation or warranty is made to the accuracy there<strong>of</strong>.<br />
<strong>Hampton</strong> <strong>Roads</strong> methodology: Inventory includes all Class A, B, & C <strong>of</strong>fice properties<br />
Regional Office <strong>Market</strong> Comparison<br />
The relative vitality <strong>of</strong> the <strong>Hampton</strong> <strong>Roads</strong> <strong>of</strong>fice market can be more clearly illustrated by comparing the area’s 2010 performance<br />
to the nearby Virginia market <strong>of</strong> Richmond, the District <strong>of</strong> Columbia, as well as the North Carolina markets <strong>of</strong><br />
Raleigh-Durham and Charlotte. Clearly our regional competitive areas fared well in comparison to the United States’ national<br />
<strong>of</strong>fice vacancy rate <strong>of</strong> 16.2% in 2010. All combined, this select regional vacancy rate was 12.3%. All data is gathered from<br />
the Brookings Institution and CoStar.<br />
Q4 2010 Data — From CoStar Office <strong>Market</strong> Report<br />
The <strong>of</strong>fice vacancy rate in the Richmond, VA <strong>of</strong>fice market area decreased to 11.3% at the end <strong>of</strong> the fourth quarter<br />
2010. The vacancy rate was 11.9% at the end <strong>of</strong> the third quarter 2010, 12.3% at the end <strong>of</strong> the second quarter 2010, and<br />
12.0% at the end <strong>of</strong> the first quarter 2010.<br />
The <strong>of</strong>fice vacancy rate in the Raleigh-Durham, NC <strong>of</strong>fice market area decreased to 12.6% at the end <strong>of</strong> the fourth quarter<br />
2010. The vacancy rate was 12.7% at the end <strong>of</strong> the third quarter 2010, 13.2% at the end <strong>of</strong> the second quarter 2010, and<br />
13.4% at the end <strong>of</strong> the first quarter 2010.<br />
The <strong>of</strong>fice vacancy rate in the Charlotte, NC <strong>of</strong>fice market area decreased to 14.0% at the end <strong>of</strong> the fourth quarter<br />
2010. The vacancy rate was 14.2% at the end <strong>of</strong> the third quarter 2010, 14.7% at the end <strong>of</strong> the second quarter 2010, and<br />
14.1% at the end <strong>of</strong> the first quarter 2010.<br />
<strong>2011</strong> <strong>Hampton</strong> <strong>Roads</strong> <strong>Real</strong> <strong>Estate</strong> <strong>Market</strong> <strong>Review</strong><br />
40
<strong>2011</strong> O F F I C E<br />
The <strong>of</strong>fice vacancy rate in the District <strong>of</strong> Columbia (Washington D.C.) <strong>of</strong>fice market area decreased to 10.9% at the end<br />
<strong>of</strong> the fourth quarter 2010. The vacancy rate was 11.6% at the end <strong>of</strong> the third quarter 2010, 11.9% at the end <strong>of</strong> the second<br />
quarter 2010, and 11.6% at the end <strong>of</strong> the first quarter 2010.<br />
The <strong>of</strong>fice vacancy rate in the <strong>Hampton</strong> <strong>Roads</strong> <strong>of</strong>fice market area decreased to 12.6% at the end <strong>of</strong> the fourth quarter 2010.<br />
The vacancy rate was 12.7% at the end <strong>of</strong> the third quarter 2010, 12.7% at the end <strong>of</strong> the second quarter 2010, and 12.2% at<br />
the end <strong>of</strong> the first quarter 2010.<br />
Regional Office <strong>Market</strong> Comparison — Office Vacancy Rate<br />
2010 <strong>Hampton</strong> <strong>Roads</strong>, VA Washington DC Richmond, VA Raleigh-Durham, NC Charlotte, NC<br />
1st Quarter 12.2% 11.6% 12.0% 13.4% 14.1%<br />
2nd Quarter 12.9% 11.9% 12.3% 13.2% 14.7%<br />
3rd Quarter 12.7% 11.6% 11.9% 12.7% 14.2%<br />
4th Quarter 12.6% 10.9% 11.3% 12.6% 14.0%<br />
Peninsula Class A — Average Rental Rates<br />
DIRECT SPACES SUBLET SPACES TOTAL<br />
# Spaces Min Avg Max # Spaces Min Avg Max Avg<br />
Off/Med<br />
Triple Net 8 $22.00 $22.00 $22.00 0 - - - $22.00<br />
Office<br />
Full Service Gross 69 $16.00 $19.84 $28.00 4 $9.00 $13.24 $22.00 $19.66<br />
Modified Gross 3 $16.95 $16.95 $16.95 0 - - - $16.95<br />
Negotiable 4 - - - 0 - - - -<br />
Retail<br />
Triple Net 1 $13.50 $13.50 $13.50 0 - - - $13.50<br />
Vacancy Rate<br />
Peninsula Vacancy Rates<br />
16%<br />
14%<br />
12%<br />
10%<br />
8%<br />
6%<br />
4%<br />
2%<br />
0%<br />
2010<br />
Q1<br />
2010<br />
Q2<br />
2010 2010<br />
Q3 Q4<br />
Direct/Relet Vacancy<br />
Sublet Vacancy<br />
Total Vacancy<br />
CUR<br />
QUTR<br />
Occupancy<br />
Existing Bldgs: 35<br />
# Spaces: 88<br />
Existing RBA: 2,956,724<br />
Vacant: 13%<br />
Occupied: 2,566,788 87%<br />
Leased: 2,596,988 88%<br />
Availability<br />
Vacant Avail: 367,959 12%<br />
Total Avail: 390,244 13%<br />
Direct Avail: 382,021 13%<br />
Sublet Avail: 8,223 0%<br />
Average Time: 25.8 Months<br />
Leasing activity<br />
Leasing YTD: 17,045 1%<br />
Net Absorp YTD: 16,584 1%<br />
Direct gross rent<br />
Office range: $16.00-$31.34/yr<br />
Office Avg: $21.06/yr<br />
South <strong>Hampton</strong> <strong>Roads</strong> Vacancy Rates<br />
Vacancy Rate<br />
16%<br />
14%<br />
12%<br />
10%<br />
8%<br />
6%<br />
4%<br />
2%<br />
0%<br />
2010<br />
Q1<br />
2010<br />
Q2<br />
2010 2010<br />
Q3 Q4<br />
Direct/Relet Vacancy<br />
Sublet Vacancy<br />
Total Vacancy<br />
CUR<br />
QUTR<br />
Occupancy<br />
Existing Bldgs: 117<br />
# Spaces: 314<br />
Existing RBA: 10,863,360<br />
Vacant: 15%<br />
Occupied: 9,202,360 85%<br />
Leased: 9,348,257 86%<br />
Availability<br />
Vacant Avail: 1,567,167 14%<br />
Total Avail: 1,947,667 18%<br />
Direct Avail: 1,857,310 17%<br />
Sublet Avail: 90,357 1%<br />
Average Time: 23.4 Months<br />
Leasing activity<br />
Leasing YTD: 27,791 0%<br />
Net Absorp YTD: 66,691 1%<br />
Direct gross rent<br />
Office range: $15.50-$29.50/yr<br />
Office Avg: $21.61/yr<br />
<strong>2011</strong> OFFICE<br />
41
Peninsula Class A - Average Rental Rates<br />
DIRECT SPACES SUBLET SPACES TOTAL<br />
# Spaces Min Avg Max # Spaces Min Avg Max Avg<br />
Off/Med<br />
Full Service Gross 17 $21.00 $25.16 $27.00 1 $22.38 $22.38 $22.38 $25.07<br />
Negotiable 1 - - - 0 - - - -<br />
Plus Cleaning 2 $17.95 $18.11 $18.50 0 - - - $18.11<br />
Triple Net 6 $16.50 $17.14 $21.50 0 - - - $17.14<br />
Office/Ret<br />
Full Service Gross 1 $24.95 $24.95 $24.95 0 - - - $24.95<br />
Modified Gross 3 $22.00 $22.68 $24.00 0 - - - $22.68<br />
Office<br />
+ Elec & Clean 1 $17.25 $17.25 $17.25 0 - - - $17.25<br />
Full Service Gross 216 $16.00 $21.32 $29.50 14 $14.00 $16.23 $23.00 $20.98<br />
Modified Gross 1 $17.50 $17.50 $17.50 0 - - - $17.50<br />
Negotiable 13 - - - 1 - - - -<br />
Net 4 $15.50 $17.14 $22.50 0 - - - $17.14<br />
Plus Cleaning 0 - - - 1 $18.50 $18.50 $18.50 $18.50<br />
TBD 9 $20.00 $20.56 $25.00 1 - - - $20.56<br />
Triple Net 12 $13.50 $21.23 $30.00 0 - - - $21.23<br />
Retail<br />
Full Service Gross 5 - - - 0 - - - -<br />
Triple Net 4 $21.00 $21.00 $21.00 0 - - - $21.00<br />
Utilities & Char 2 $22.50 $22.50 $22.50 0 - - - $22.50<br />
Peninsula Class B - Average Rental Rates<br />
DIRECT SPACES SUBLET SPACES TOTAL<br />
# Spaces Min Avg Max # Spaces Min Avg Max Avg<br />
Off/Med<br />
Full Service Gross 1 $16.00 $16.00 $16.00 0 - - - $16.00<br />
Modified Gross 5 $12.00 $13.53 $15.00 0 - - - $13.53<br />
Net 9 $16.50 $17.66 $18.69 0 - - - $17.66<br />
Plus All Utilities 4 $10.46 $14.49 $20.00 0 - - - $14.49<br />
Triple Net 5 $12.85 $13.79 $15.00 0 - - - $13.79<br />
Utilities & Char 1 $13.50 $13.50 $13.50 0 - - - $13.50<br />
Office/Ret<br />
Full Service Gross 4 $20.00 $20.00 $20.00 0 - - - $20.00<br />
Modified Gross 4 $11.95 $16.55 $20.00 0 - - - $16.55<br />
Triple Net 1 $16.00 $16.00 $16.00 0 - - - $16.00<br />
Office<br />
+ Elec & Clean 8 $10.00 $13.13 $16.50 0 - - - $13.13<br />
Double Net 6 $11.25 $14.96 $21.00 0 - - - $14.96<br />
Full Service Gross 128 $8.00 $16.28 $20.95 5 $12.95 $13.35 $16.50 $16.16<br />
Modified Gross 49 $9.00 $14.21 $23.00 2 $12.00 $12.85 $13.75 $14.16<br />
Negotiable 25 - - - 2 - - - -<br />
Net 13 $10.00 $10.95 $16.00 2 $13.00 $13.26 $13.50 $11.23<br />
Plus All Utilities 21 $8.67 $13.40 $18.50 0 - - - $13.40<br />
Plus Cleaning 2 $10.00 $10.68 $10.95 0 - - - $10.68<br />
Plus Electric 5 $12.48 $15.70 $18.90 0 - - - $15.70<br />
TBD 9 $12.31 $13.56 $14.92 1 - - - $13.56<br />
Triple Net 45 $7.94 $14.24 $21.00 0 - - - $14.24<br />
Utilities & Char 21 $10.00 $12.25 $14.00 0 - - - $12.25<br />
Retail<br />
Modified Gross 1 $19.00 $19.00 $19.00 0 - - - $19.00<br />
Net 2 $16.00 $16.00 $16.00 0 - - - $16.00<br />
Triple Net 7 $10.00 $10.00 $10.00 0 - - - $10.00<br />
<strong>2011</strong> <strong>Hampton</strong> <strong>Roads</strong> <strong>Real</strong> <strong>Estate</strong> <strong>Market</strong> <strong>Review</strong><br />
42
Vacancy Rate<br />
Peninsula Class B Vacancy Rates<br />
14%<br />
12%<br />
10%<br />
8%<br />
6%<br />
4%<br />
2%<br />
0%<br />
2010<br />
Q1<br />
2010<br />
Q2<br />
2010 2010<br />
Q3 Q4<br />
Direct/Relet Vacancy<br />
Sublet Vacancy<br />
Total Vacancy<br />
CUR<br />
QUTR<br />
Occupancy<br />
Existing Bldgs: 657<br />
# Spaces: 385<br />
Existing RBA: 8,489,034<br />
Vacant: 12%<br />
Occupied: 7,462,809 88%<br />
Leased: 7,550,970 89%<br />
Availability<br />
Vacant Avail: 975,283 11%<br />
Total Avail: 1,122,314 13%<br />
Direct Avail: 1,083,844 13%<br />
Sublet Avail: 38,469 0%<br />
Average Time: 28.8 Months<br />
Leasing activity<br />
Leasing YTD: 27,062 0%<br />
Net Absorp YTD: (4,844) (0%)<br />
Direct gross rent<br />
Office range:<br />
Office Avg:<br />
$7.94-$34.77/yr<br />
$15.34/yr<br />
Vacancy Rate<br />
South <strong>Hampton</strong> <strong>Roads</strong> Class B Vacancy Rates<br />
14%<br />
12%<br />
10%<br />
8%<br />
6%<br />
4%<br />
2%<br />
0%<br />
2010<br />
Q1<br />
2010<br />
Q2<br />
2010 2010<br />
Q3 Q4<br />
Direct/Relet Vacancy<br />
Sublet Vacancy<br />
Total Vacancy<br />
CUR<br />
QUTR<br />
Occupancy<br />
Existing Bldgs: 762<br />
# Spaces: 656<br />
Existing RBA: 14,677,776<br />
Vacant: 14%<br />
Occupied: 12,681,303 86%<br />
Leased: 12,852,609 88%<br />
Availability<br />
Vacant Avail: 1,872,873 13%<br />
Total Avail: 2,390,831 16%<br />
Direct Avail: 2,317,735 16%<br />
Sublet Avail: 67,454 0%<br />
Average Time: 21.9 Months<br />
Leasing activity<br />
Leasing YTD: 17,198 0%<br />
Net Absorp YTD: (13,222) (0%)<br />
Direct gross rent<br />
Office range:<br />
Office Avg:<br />
$6.00-$40.00/yr<br />
$15.59/yr<br />
South <strong>Hampton</strong> <strong>Roads</strong> Class A - Average Rental Rates<br />
DIRECT SPACES SUBLET SPACES TOTAL<br />
# Spaces Min Avg Max # Spaces Min Avg Max Avg<br />
Med<br />
Full Service Gross 10 $18.00 $21.31 $24.75 0 - - - $21.31<br />
Utilities & Char 1 $18.00 $18.00 $18.00 0 - - - $18.00<br />
Triple Net 6 $16.50 $17.14 $21.50 0 - - - $17.14<br />
Off/Med<br />
Double Net 2 $15.50 $15.50 $15.50 0 - - - $15.50<br />
Full Service Gross 23 $12.00 $18.96 $26.00 0 - - - $18.96<br />
Modified Gross 4 $12.88 $14.74 $15.75 0 - - - $14.74<br />
Negotiable 2 - - - 0 - - - -<br />
Net 1 $13.75 $13.75 $13.75 0 - - - $13.75<br />
Plus All Utilities 3 $12.00 $12.75 $14.00 0 - - - $12.75<br />
Plus Cleaning 1 $20.00 $20.00 $20.00 0 - - - $20.00<br />
Tenant Electric 1 $13.00 $13.00 $13.00 0 - - - $13.00<br />
Triple Net 8 $12.00 $17.53 $23.00 1 $18.00 $18.00 $18.00 $17.61<br />
Utilities & Char 4 $17.00 $18.57 $22.00 1 $11.00 $11.00 $11.00 $16.62<br />
Office/Ret<br />
Double Net 1 $14.95 $14.95 $14.95 0 - - - $14.95<br />
Full Service Gross 2 $16.00 $17.30 $18.00 0 - - - $17.30<br />
Modified Gross 2 $10.00 $12.30 $18.00 0 - - - $12.30<br />
Negotiable 2 - - - 2 - - - -<br />
Net 1 $18.00 $18.00 $18.00 0 - - - $18.00<br />
Plus Cleaning 2 $22.50 $22.50 $22.50 0 - - - $22.50<br />
TBD 1 - - - 0 - - - -<br />
Triple Net 3 $9.95 $17.63 $22.50 0 - - - $17.63<br />
Office<br />
+ Elec & Clean 26 $12.00 $14.20 $23.50 0 - - - $14.20<br />
Double Net 5 $11.95 $12.10 $13.00 0 - - - $12.10<br />
Full Service Gross 292 $11.00 $16.33 $40.00 23 $12.50 $16.50 $20.00 $16.34<br />
Modified Gross 54 $8.55 $15.55 $30.00 1 - - - $15.55<br />
Negotiable 40 $12.86 $12.86 $12.86 1 - - - $12.86<br />
Net 41 $10.00 $12.51 $18.75 0 - - - $12.51<br />
Plus All Utilities 8 $11.29 $11.68 $12.85 0 - - - $11.68<br />
Plus Cleaning 16 $12.95 $15.15 $18.21 0 - - - $15.15<br />
Plus Electric 9 $10.00 $14.11 $17.50 0 - - - $14.11<br />
TBD 5 $14.00 $16.10 $18.00 1 $14.50 $14.50 $14.50 $15.93<br />
Tenant Electric 2 $13.00 $13.00 $13.00 0 - - - $13.00<br />
Triple Net 51 $6.00 $12.68 $23.00 1 $17.00 $17.00 $17.00 $12.71<br />
Utilities & Char 17 $9.95 $15.00 $18.00 0 - - - $15.00<br />
Retail<br />
Full Service Gross 1 $22.00 $22.00 $22.00 0 - - - $22.00<br />
TBD 1 $16.00 $16.00 $16.00 0 - - - $16.00<br />
Triple Net 4 $12.00 $20.46 $23.00 0 - - - $20.46<br />
<strong>2011</strong> OFFICE<br />
43
Peninsula Class C - Average Rental Rates<br />
DIRECT SPACES SUBLET SPACES TOTAL<br />
# Spaces Min Avg Max # Spaces Min Avg Max Avg<br />
Med<br />
Modified Gross 1 $11.50 $11.50 $11.50 0 - - - $11.50<br />
Off/Med<br />
Double Net 1 $13.00 $13.00 $13.00 0 - - - $13.00<br />
Triple Net 2 $10.00 $10.00 $10.00 0 - - - $10.00<br />
Office/Ret<br />
Full Service Gross 2 $10.00 $11.00 $12.00 0 - - - $11.00<br />
Negotiable 1 - - - 0 - - - -<br />
Triple Net 1 $12.50 $12.50 $12.50 0 - - - $12.50<br />
Office<br />
+ Elec & Clean 1 $12.00 $12.00 $12.00 0 - - - $12.00<br />
Double Net 1 $9.50 $9.50 $9.50 0 - - - $9.50<br />
Full Service Gross 57 $7.20 $10.37 $22.21 1 $12.00 $12.00 $12.00 $10.39<br />
Modified Gross 22 $8.00 $12.32 $27.00 0 - - - $12.32<br />
Negotiable 11 - - - 0 - - - -<br />
Net 11 $9.50 $12.20 $16.00 0 - - - $12.20<br />
Plus All Utilities 4 $6.40 $9.25 $12.00 0 - - - $9.25<br />
Plus Cleaning 1 $22.91 $22.91 $22.91 0 - - - $22.91<br />
Plus Electric 1 $15.00 $15.00 $15.00 0 - - - $15.00<br />
Triple Net 9 $8.00 $13.07 $17.00 0 - - - $13.07<br />
Utilities & Char 17 $9.50 $10.99 $14.00 1 $13.50 $13.50 $13.50 $11.18<br />
Vacancy Rate<br />
Peninsula Class C Vacancy Rates<br />
12%<br />
10%<br />
8%<br />
6%<br />
4%<br />
2%<br />
0%<br />
2010<br />
Q1<br />
2010<br />
Q2<br />
2010 2010<br />
Q3 Q4<br />
Direct/Relet Vacancy<br />
Sublet Vacancy<br />
Total Vacancy<br />
CUR<br />
QUTR<br />
Occupancy<br />
Existing Bldgs: 412<br />
# Spaces: 144<br />
Existing RBA: 2,209,180<br />
Vacant: 11%<br />
Occupied: 1,974,527 89%<br />
Leased: 2,003,886 91%<br />
Availability<br />
Vacant Avail: 206,029 9%<br />
Total Avail: 252,879 11%<br />
Direct Avail: 249,642 11%<br />
Sublet Avail: 3,235 0%<br />
Average Time: 14.6 Months<br />
Leasing activity<br />
Leasing YTD: 31,141 1%<br />
Net Absorp YTD: (2,602) (0%)<br />
Direct gross rent<br />
Office range:<br />
Office Avg:<br />
$6.40-$22.91/yr<br />
$11.73/yr<br />
South <strong>Hampton</strong> <strong>Roads</strong> Class C Vacancy Rates<br />
Vacancy Rate<br />
14%<br />
12%<br />
10%<br />
8%<br />
6%<br />
4%<br />
2%<br />
0%<br />
2010<br />
Q1<br />
2010<br />
Q2<br />
2010 2010<br />
Q3 Q4<br />
Direct/Relet Vacancy<br />
Sublet Vacancy<br />
Total Vacancy<br />
CUR<br />
QUTR<br />
Occupancy<br />
Existing Bldgs: 1028<br />
# Spaces: 237<br />
Existing RBA: 6,517,087<br />
Vacant: 6%<br />
Occupied: 6,110,610 94%<br />
Leased: 6,109,614 94%<br />
Availability<br />
Vacant Avail: 409,553 6%<br />
Total Avail: 555,053 9%<br />
Direct Avail: 546,476 8%<br />
Sublet Avail: 2,080 0%<br />
Average Time: 16.7 Months<br />
Leasing activity<br />
Leasing YTD: 2,674 0%<br />
Net Absorp YTD: (12,020) (0%)<br />
Direct gross rent<br />
Office range: $6.00-$26.23/yr<br />
Office Avg: $12.94/yr<br />
<strong>2011</strong> <strong>Hampton</strong> <strong>Roads</strong> <strong>Real</strong> <strong>Estate</strong> <strong>Market</strong> <strong>Review</strong><br />
44
<strong>2011</strong> O F F I C E<br />
South <strong>Hampton</strong> <strong>Roads</strong> Class C - Average Rental Rates<br />
DIRECT SPACES SUBLET SPACES TOTAL<br />
# Spaces Min Avg Max # Spaces Min Avg Max Avg<br />
Med<br />
Plus Cleaning 1 $23.25 $23.25 $23.25 0 - - - $23.25<br />
Off/Med<br />
Full Service Gross 1 $18.00 $18.00 $18.00 0 - - - $18.00<br />
Modified Gross 4 $12.75 $13.84 $15.00 0 - - - $13.84<br />
Net 2 $16.00 $16.00 $16.00 0 - - - $16.00<br />
Plus All Utilities 1 $18.50 $18.50 $18.50 0 - - - $18.50<br />
Plus Electric 1 $12.00 $12.00 $12.00 0 - - - $12.00<br />
Triple Net 2 $6.86 $10.67 $12.00 0 - - - $10.67<br />
Office/Ret<br />
Modified Gross 1 $13.00 $13.00 $13.00 0 - - - $13.00<br />
Negotiable 4 - - - 0 - - - -<br />
Plus All Utilities 3 $11.20 $12.00 $14.40 0 - - - $12.00<br />
Plus Electric 1 $12.00 $12.00 $12.00 0 - - - $12.00<br />
Triple Net 8 $9.09 $13.15 $18.50 0 - - - $13.15<br />
Utilities & Char 2 $12.00 $12.32 $13.00 0 - - - $12.32<br />
Office<br />
+ Elec & Clean 8 $12.00 $15.09 $17.50 0 - - - $15.09<br />
Full Service Gross 44 $8.42 $13.84 $20.00 1 $8.42 $8.42 $8.42 $13.67<br />
Modified Gross 27 $6.00 $12.42 $21.45 0 - - - $12.42<br />
Negotiable 34 - - - 0 - - - -<br />
Net 16 $8.00 $11.57 $15.00 0 - - - $11.57<br />
Plus All Utilities 10 $10.20 $14.05 $15.00 0 - - - $14.05<br />
Plus Cleaning 9 $12.00 $13.22 $15.00 1 $22.80 $22.80 $22.80 $13.56<br />
Plus Electric 9 $9.79 $11.95 $16.00 0 - - - $11.95<br />
TBD 7 $11.86 $11.86 $11.86 0 - - - $11.86<br />
Triple Net 43 $7.50 $11.50 $29.43 0 - - - $11.50<br />
Retail<br />
Full Service Gross 1 $12.95 $12.95 $12.95 0 - - - $12.95<br />
Triple Net 2 $10.00 $11.74 $12.00 0 - - - $11.74<br />
<strong>2011</strong> OFFICE<br />
45
2010 Office Building<br />
Directory<br />
DOWNTOWN NORFOLK<br />
CLASS A<br />
150 West Main Street . . . . . . . . . . . . . . . . . . . . .226,183<br />
Bank <strong>of</strong> America . . . . . . . . . . . . . . . . . . . . . . . . . .340,000<br />
Crown Center . . . . . . . . . . . . . . . . . . . . . . . . . . . . .62,000<br />
Dominion Tower . . . . . . . . . . . . . . . . . . . . . . . . . .403,276<br />
Fort Norfolk Medical Office Tower . . . . . . . . . . .196,000<br />
Main Street Tower . . . . . . . . . . . . . . . . . . . . . . . . .200,000<br />
Norfolk Southern Tower . . . . . . . . . . . . . . . . . . . . .301,463<br />
Town Point Center . . . . . . . . . . . . . . . . . . . . . . . . .130,266<br />
World Trade Center . . . . . . . . . . . . . . . . . . . . . . . .366,941<br />
Wells Fargo Center . . . . . . . . . . . . . . . . . . . . . . .255,000<br />
CLASS B<br />
101 Granby Street . . . . . . . . . . . . . . . . . . . . . . . . .22,000<br />
141 W. Virginia Beach Blvd. (ABC Building) . . . . . .10,000<br />
201 Granby Mall Building . . . . . . . . . . . . . . . . . . . .76,071<br />
250 W. Brambleton Avenue . . . . . . . . . . . . . . . . . .17,984<br />
345 W. Freemason . . . . . . . . . . . . . . . . . . . . . . . . .11,000<br />
500 Plume Street . . . . . . . . . . . . . . . . . . . . . . . . . .60,000<br />
500 E. Main St. (BB&T) . . . . . . . . . . . . . . . . . . . .230,000<br />
City Centre . . . . . . . . . . . . . . . . . . . . . . . . . . . . . . .54,138<br />
Hague Medical Center . . . . . . . . . . . . . . . . . . . . . .31,659<br />
Madison Office Building . . . . . . . . . . . . . . . . . . . .82,000<br />
Monticello Arcade . . . . . . . . . . . . . . . . . . . . . . . . . .44,500<br />
The Monticello Building . . . . . . . . . . . . . . . . . . . . .70,000<br />
Plume Center West . . . . . . . . . . . . . . . . . . . . . . . . .82,375<br />
RBC Centura Tower . . . . . . . . . . . . . . . . . . . . . . . .111,600<br />
St. Paul Building . . . . . . . . . . . . . . . . . . . . . . . . . . .47,308<br />
Seaboard Center . . . . . . . . . . . . . . . . . . . . . . . . . .30,000<br />
Tazewell Building . . . . . . . . . . . . . . . . . . . . . . . . . . .38,000<br />
The Helena Building . . . . . . . . . . . . . . . . . . . . . . . .20,100<br />
Towne Bank Building . . . . . . . . . . . . . . . . . . . . . . .52,698<br />
Wainwright Building . . . . . . . . . . . . . . . . . . . . . . . .83,151<br />
York Street Center . . . . . . . . . . . . . . . . . . . . . . . . . .52,293<br />
CLASS C<br />
220 West Freemason Street . . . . . . . . . . . . . . . . . .10,775<br />
255 Granby Street . . . . . . . . . . . . . . . . . . . . . . . . .30,000<br />
400 Gresham Drive (The Medical Building) . . . . . .78,867<br />
700 Monticello Avenue . . . . . . . . . . . . . . . . . . . . . .22,760<br />
700 Boush Street . . . . . . . . . . . . . . . . . . . . . . . . . .16,825<br />
Anders Williams Building . . . . . . . . . . . . . . . . . . . .14,000<br />
Duke Grace Building . . . . . . . . . . . . . . . . . . . . . . . .26,417<br />
Ghent-Olney Building . . . . . . . . . . . . . . . . . . . . . . .24,000<br />
Lonsdale Building . . . . . . . . . . . . . . . . . . . . . . . . . .18,000<br />
Norfolk Community Services . . . . . . . . . . . . . . . . . .16,192<br />
Wainwright Building . . . . . . . . . . . . . . . . . . . . . . . .82,318<br />
OWNER OCCUPIED<br />
AT&T . . . . . . . . . . . . . . . . . . . . . . . . . . . . . . . . . . .200,000<br />
Atlantic Building . . . . . . . . . . . . . . . . . . . . . . . . . . .14,000<br />
Decker Building . . . . . . . . . . . . . . . . . . . . . . . . . . .10,000<br />
Dominion Enterprises . . . . . . . . . . . . . . . . . . . . . .220,000<br />
Landmark Communications . . . . . . . . . . . . . . . . . .66,500<br />
Norfolk Telcom Center . . . . . . . . . . . . . . . . . . . . . . .60,000<br />
Peta . . . . . . . . . . . . . . . . . . . . . . . . . . . . . . . . . . . .25,000<br />
Standard Forms . . . . . . . . . . . . . . . . . . . . . . . . . . .30,000<br />
Two Commercial Place . . . . . . . . . . . . . . . . . . . . .234,450<br />
Virginian Pilot Building . . . . . . . . . . . . . . . . . . . . .174,141<br />
AIRPORT/NORTHAMPTON<br />
CLASS A<br />
Twin Oaks I . . . . . . . . . . . . . . . . . . . . . . . . . . . . . . .88,000<br />
Twin Oaks II . . . . . . . . . . . . . . . . . . . . . . . . . . . . . .88,000<br />
The Concourse . . . . . . . . . . . . . . . . . . . . . . . . . .325,000<br />
CLASS B<br />
Airport Executive Center . . . . . . . . . . . . . . . . . . . . .70,609<br />
Circle South . . . . . . . . . . . . . . . . . . . . . . . . . . . . . .48,000<br />
HRSA-ILA Bldg (Longshoremen’s) . . . . . . . . . . . . . .21,678<br />
Northhampton Executive Center<br />
corrected buiding size . . . . . . . . . . . . . . . . . . . .69,904<br />
CLASS C<br />
Electrical Workers Corporation Office . . . . . . . . . . . .22,020<br />
OWNER OCCUPIED<br />
CMA/CGM (USA) . . . . . . . . . . . . . . . . . . . . . . . . . .90,000<br />
Commander Corporate Center . . . . . . . . . . . . . . . .65,000<br />
Silver Oak . . . . . . . . . . . . . . . . . . . . . . . . . . . . . . . .78,200<br />
Zim-American Israeli Shipping . . . . . . . . . . . . . . . .30,000<br />
CENTRAL NORFOLK<br />
CLASS B<br />
100 Kingsley Lane, DePaul Health Park” . . . . . . . . .48,000<br />
110 Kingsley Lane, DePaul Medical Building” . . . . .39,054<br />
160 Lingsley Lane, DePaul Medical Atrium” . . . . . .40,000<br />
241 Corporate Blvd. (VA Eye Development) . . . . . .34,070<br />
930 Majestic Avenue . . . . . . . . . . . . . . . . . . . . . . . .9,500<br />
5360 Robin Hood Road . . . . . . . . . . . . . . . . . . . . .42,000<br />
Almeda Business Center (flex) . . . . . . . . . . . . . . . .84,000<br />
Central Center Office Building . . . . . . . . . . . . . . . . .53,815<br />
Commerce Park Place(flex) . . . . . . . . . . . . . . . . . . .58,783<br />
Gateway II(flex) . . . . . . . . . . . . . . . . . . . . . . . . . . . .45,000<br />
Lafayette Executive Center . . . . . . . . . . . . . . . . . . .18,641<br />
Lawson Building . . . . . . . . . . . . . . . . . . . . . . . . . . .20,022<br />
Norfolk Business Center (flex) . . . . . . . . . . . . . . . . .89,000<br />
Norfolk Business Center II (flex) . . . . . . . . . . . . . .126,926<br />
Norfolk Commerce Center I(flex) . . . . . . . . . . . . . . .73,000<br />
Norfolk Commerce Center III(flex) . . . . . . . . . . . . .168,000<br />
Norfolk Commerce Center IV(flex) . . . . . . . . . . . . . .79,980<br />
Norfolk Commerce Center V(flex) . . . . . . . . . . . . . .72,000<br />
CLASS C<br />
4100 Building . . . . . . . . . . . . . . . . . . . . . . . . . . . .20,614<br />
Atlas Building . . . . . . . . . . . . . . . . . . . . . . . . . . . . .30,476<br />
Blair Building . . . . . . . . . . . . . . . . . . . . . . . . . . . . .15,000<br />
Southern Office Building . . . . . . . . . . . . . . . . . . . . .11,061<br />
Time Building . . . . . . . . . . . . . . . . . . . . . . . . . . . . .32,000<br />
OWNER OCCUPIED<br />
American Funds Building . . . . . . . . . . . . . . . . . . .106,000<br />
CHESAPEAKE/GREENBRIER<br />
CLASS A<br />
BECO Corp HQ (609 Independence) . . . . . . . . . . .22,400<br />
Crossways Center . . . . . . . . . . . . . . . . . . . . . . . . . .52,702<br />
CHKD Health Center (Volvo Park VI) . . . . . . . . . . . .25,000<br />
Chubb Building . . . . . . . . . . . . . . . . . . . . . . . . . . . .97,500<br />
Dendrite One . . . . . . . . . . . . . . . . . . . . . . . . . . . . .50,000<br />
Dendrite Two . . . . . . . . . . . . . . . . . . . . . . . . . . . . . .50,000<br />
EDS - 1434 Crossways Blvd . . . . . . . . . . . . . . . . .111,000<br />
Greenbrier Tower I . . . . . . . . . . . . . . . . . . . . . . . . . .87,900<br />
Greenbrier Tower II . . . . . . . . . . . . . . . . . . . . . . . . .86,976<br />
HR <strong>Real</strong>tors Association Bldg (638 Independence) . .40,000<br />
Independence Place . . . . . . . . . . . . . . . . . . . . . . . .73,345<br />
Lake Center I . . . . . . . . . . . . . . . . . . . . . . . . . . . . .60,000<br />
Lake Center II . . . . . . . . . . . . . . . . . . . . . . . . . . . . .64,000<br />
Liberty One . . . . . . . . . . . . . . . . . . . . . . . . . . . . . . .50,000<br />
Liberty Two . . . . . . . . . . . . . . . . . . . . . . . . . . . . . . .50,000<br />
Liberty Three . . . . . . . . . . . . . . . . . . . . . . . . . . . . . .75,000<br />
1403 Greenbrier Parkway (Gateway Bank) . . . . . . .75,000<br />
CLASS B<br />
Atlantic Business Center . . . . . . . . . . . . . . . . . . . . .60,000<br />
Battlefield Corporate Center . . . . . . . . . . . . . . . . . .98,000<br />
Battlefield Lakes Tech Center I . . . . . . . . . . . . . . . .38,500<br />
Battlefield Lakes Tech Center II . . . . . . . . . . . . . . . .29,000<br />
Battlefield Lakes Tech Center III . . . . . . . . . . . . . . . .18,000<br />
Battlefield Technology Center . . . . . . . . . . . . . . . . .51,578<br />
Battlefield Technology Center I . . . . . . . . . . . . . . . .97,000<br />
Battlefield Technology Center II (MCI) . . . . . . . . . . .81,478<br />
Branch Executive Quarter-Hamilton . . . . . . . . . . . .11,600<br />
Branch Executive Quarter-Jefferson . . . . . . . . . . . . .23,838<br />
Branch Executive Quarter-Madison . . . . . . . . . . . . .16,788<br />
Chelsea Commons WCMB . . . . . . . . . . . . . . . . . . .12,400<br />
1580 Crossways Blvd . . . . . . . . . . . . . . . . . . . . . . .10,800<br />
Crossways Commerce Center II . . . . . . . . . . . . . . .145,300<br />
Crossways Commerce Center I . . . . . . . . . . . . . . . .45,000<br />
Crossways I . . . . . . . . . . . . . . . . . . . . . . . . . . . . .137,007<br />
Crossways II (flex) . . . . . . . . . . . . . . . . . . . . . . . . . .84,751<br />
Crossways III . . . . . . . . . . . . . . . . . . . . . . . . . . . . .61,992<br />
Dominion Business Center . . . . . . . . . . . . . . . . . . .20,000<br />
Eden North Center . . . . . . . . . . . . . . . . . . . . . . . . .18,700<br />
Greenbrier Business Centre (flex) . . . . . . . . . . . . . .91,561<br />
Greenbrier Circle Corporate Center . . . . . . . . . . . .233,138<br />
Greenbrier Executive Center II<br />
(I was torn down for a hotel) . . . . . . . . . . . . . . .26,787<br />
Greenbrier Point II . . . . . . . . . . . . . . . . . . . . . . . . . .16,000<br />
Greenbrier Tech Center One (flex) . . . . . . . . . . . . . .95,414<br />
Greenbrier Tech Center Two (flex) . . . . . . . . . . . . . . .82,340<br />
Hanbury Office Park . . . . . . . . . . . . . . . . . . . . . . . .24,000<br />
Hanbury Road Business Center . . . . . . . . . . . . . . . .9,000<br />
Independence Technology Center I . . . . . . . . . . . . .98,000<br />
Rose and Womble Business Center . . . . . . . . . . . .13,432<br />
SunTrust Bank Building . . . . . . . . . . . . . . . . . . . . . .23,000<br />
737 Volvo Parkway . . . . . . . . . . . . . . . . . . . . . . . . .36,000<br />
Volvo Park (Progressive Drive) . . . . . . . . . . . . . . . . .52,000<br />
Volvo VII . . . . . . . . . . . . . . . . . . . . . . . . . . . . . . . . .13,000<br />
Greenbrier Business Center . . . . . . . . . . . . . . . . . .50,000<br />
Greenbrier Square . . . . . . . . . . . . . . . . . . . . . . . . .26,250<br />
Heritage Bank Building . . . . . . . . . . . . . . . . . . . . . .12,654<br />
Riverwalk Pr<strong>of</strong>essional Bldg . . . . . . . . . . . . . . . . . .10,000<br />
Woodbrier Terrace . . . . . . . . . . . . . . . . . . . . . . . . . .10,000<br />
Wright Building . . . . . . . . . . . . . . . . . . . . . . . . . . .12,000<br />
CLASS C<br />
2125 Smith Avenue . . . . . . . . . . . . . . . . . . . . . . . .42,423<br />
Knells Ridge Plaza . . . . . . . . . . . . . . . . . . . . . . . . .15,500<br />
Old Greenbrier Village . . . . . . . . . . . . . . . . . . . . . . .34,015<br />
OWNER OCCUPIED<br />
Cox Communications . . . . . . . . . . . . . . . . . . . . .150,000<br />
Dollar Tree . . . . . . . . . . . . . . . . . . . . . . . . . . . . . .300,000<br />
First Data . . . . . . . . . . . . . . . . . . . . . . . . . . . . . . . .42,557<br />
Household Finance . . . . . . . . . . . . . . . . . . . . . . . . .60,000<br />
Panasonic Call Center . . . . . . . . . . . . . . . . . . . . . . .55,000<br />
HILLTOP/OCEANFRONT<br />
CLASS A<br />
Pavilion Center (Towne Bank) . . . . . . . . . . . . . . . . .85,177<br />
Potter Pr<strong>of</strong>essional Center . . . . . . . . . . . . . . . . . . . .27,500<br />
William E. Wood Building . . . . . . . . . . . . . . . . . . . .20,000<br />
CLASS B<br />
1206 Laskin Road Executive Center . . . . . . . . . . . .33,000<br />
Beach Health Pavilion . . . . . . . . . . . . . . . . . . . . . . .57,800<br />
Beach Tower . . . . . . . . . . . . . . . . . . . . . . . . . . . . . .23,000<br />
Birdneck Office Park . . . . . . . . . . . . . . . . . . . . . . . .10,182<br />
Birdneck Square . . . . . . . . . . . . . . . . . . . . . . . . . . .17,285<br />
Camelot Pr<strong>of</strong>essional Center . . . . . . . . . . . . . . . . . .40,725<br />
Colonial Mill Pr<strong>of</strong>essional Center . . . . . . . . . . . . . . .23,555<br />
Damalas Centre . . . . . . . . . . . . . . . . . . . . . . . . . . .16,900<br />
First Colonial Office Park . . . . . . . . . . . . . . . . . . . . .18,000<br />
General Booth Pr<strong>of</strong>essional Center . . . . . . . . . . . . .11,000<br />
Gibson Pavilion . . . . . . . . . . . . . . . . . . . . . . . . . . . .30,000<br />
Great Neck Pr<strong>of</strong>essional Bldg. . . . . . . . . . . . . . . . .20,000<br />
Heritage Commons . . . . . . . . . . . . . . . . . . . . . . . . .11,000<br />
Hilltop West Executive Center . . . . . . . . . . . . . . . . .23,000<br />
Louisa Avenue Building One . . . . . . . . . . . . . . . . . .11,000<br />
Louisa Avenue Building Two . . . . . . . . . . . . . . . . . .11,000<br />
Louisa Avenue Building Three . . . . . . . . . . . . . . . . . .8,195<br />
Mill Dam Crossing . . . . . . . . . . . . . . . . . . . . . . . . .22,037<br />
Rudd Building . . . . . . . . . . . . . . . . . . . . . . . . . . . . .13,000<br />
Sandpiper Key Associates Bldg. . . . . . . . . . . . . . . .32,000<br />
1092 Laskin Road . . . . . . . . . . . . . . . . . . . . . . . . .18,240<br />
CLASS C<br />
Oceana East . . . . . . . . . . . . . . . . . . . . . . . . . . . . .10,360”<br />
CORPORATE LANDING<br />
CLASS B<br />
Executive Center at Corporate Landing . . . . . . . . .45,000”<br />
Princess Anne Executive Park . . . . . . . . . . . . . . . .59,756”<br />
Verizon Building . . . . . . . . . . . . . . . . . . . . . . . . . . .10,000<br />
OWNER OCCUPIED<br />
Al-Anon . . . . . . . . . . . . . . . . . . . . . . . . . . . . . . . . .30,000<br />
Liberty Tax Service . . . . . . . . . . . . . . . . . . . . . . . . .30,000<br />
GEICO . . . . . . . . . . . . . . . . . . . . . . . . . . . . . . . . .250,000<br />
KEMPSVILLE<br />
CLASS A<br />
Chadwick Building . . . . . . . . . . . . . . . . . . . . . . . . .80,000<br />
Grayson Building . . . . . . . . . . . . . . . . . . . . . . . . . .42,000<br />
Metroplex 1 . . . . . . . . . . . . . . . . . . . . . . . . . . . . . .35,000<br />
CLASS B<br />
1201 Lake James Office . . . . . . . . . . . . . . . . . . . . .12,000<br />
3386 Holland Road . . . . . . . . . . . . . . . . . . . . . . . .20,000<br />
5301 Providence Road (Providence South) . . . . . .12,000
Arrowhead Office Court . . . . . . . . . . . . . . . . . . . . . .10,000<br />
Atrium <strong>of</strong> <strong>College</strong> Park Square . . . . . . . . . . . . . . . .36,379<br />
Central Park I (552 Central Dr) . . . . . . . . . . . . . . . .18,000<br />
Central Park II (544 Central) . . . . . . . . . . . . . . . . . .43,000<br />
<strong>College</strong> Park Square III . . . . . . . . . . . . . . . . . . . . . .30,150<br />
Courtyard at Providence . . . . . . . . . . . . . . . . . . . . .17,879<br />
Fairfield Square . . . . . . . . . . . . . . . . . . . . . . . . . . .12,933<br />
Holland South . . . . . . . . . . . . . . . . . . . . . . . . . . . .14,843<br />
Holland/Taft Pr<strong>of</strong>essional Center . . . . . . . . . . . . . . .11,850<br />
Kempsville Office Park . . . . . . . . . . . . . . . . . . . . . .30,722<br />
Oxford Square . . . . . . . . . . . . . . . . . . . . . . . . . . . .13,544<br />
Woolpert Building . . . . . . . . . . . . . . . . . . . . . . . . . .36,700<br />
LYNNHAVEN<br />
CLASS A<br />
Chase Building . . . . . . . . . . . . . . . . . . . . . . . . . . . .31,910<br />
Lynnhaven Commons Complex . . . . . . . . . . . . . . . .25,000<br />
Lynnhaven Commons (<strong>of</strong>fice bldg) . . . . . . . . . . . . .26,000<br />
Lynnhaven II . . . . . . . . . . . . . . . . . . . . . . . . . . . . . .36,000<br />
Lynnwood Plaza . . . . . . . . . . . . . . . . . . . . . . . . . . .87,157<br />
Marsh Landing . . . . . . . . . . . . . . . . . . . . . . . . . . . .62,117<br />
Oceana Center One . . . . . . . . . . . . . . . . . . . . . . . .39,928<br />
Oceana Place . . . . . . . . . . . . . . . . . . . . . . . . . . . . .75,369<br />
Park West AMSEC . . . . . . . . . . . . . . . . . . . . . . . . .66,180<br />
Pinehurst Centre . . . . . . . . . . . . . . . . . . . . . . . . .103,000<br />
Reflections I . . . . . . . . . . . . . . . . . . . . . . . . . . . . . .62,924<br />
Reflections II . . . . . . . . . . . . . . . . . . . . . . . . . . . . . .73,676<br />
Reflections III . . . . . . . . . . . . . . . . . . . . . . . . . . . . .67,000<br />
Reflections IV . . . . . . . . . . . . . . . . . . . . . . . . . . . . .80,000<br />
Viking Building . . . . . . . . . . . . . . . . . . . . . . . . . . . .18,900<br />
Windwood Center . . . . . . . . . . . . . . . . . . . . . . . . . .78,348<br />
CLASS B<br />
2700 International Parkway . . . . . . . . . . . . . . . . . .53,000<br />
Advanced Technology Building . . . . . . . . . . . . . . . .32,000<br />
Basgier Bldg. I . . . . . . . . . . . . . . . . . . . . . . . . . . . .18,200<br />
Basgier Bldg. II . . . . . . . . . . . . . . . . . . . . . . . . . . . .20,000<br />
Bennett Office Building (120 S. Lynnhaven) . . . . . .10,522<br />
Commercial Place . . . . . . . . . . . . . . . . . . . . . . . . .36,400<br />
Gateway Bank Building (641 Lynnhaven) . . . . . . . .18,000<br />
Lynnhaven Corporate Center I . . . . . . . . . . . . . . . . .36,046<br />
Lynnhaven Corporate Center II . . . . . . . . . . . . . . . .40,300<br />
Lynnhaven Executive Center . . . . . . . . . . . . . . . . . .18,000<br />
Lynnhaven Five . . . . . . . . . . . . . . . . . . . . . . . . . . . .24,549<br />
Lynnhaven North . . . . . . . . . . . . . . . . . . . . . . . . . .10,000<br />
Lynnhaven Pr<strong>of</strong>essional Center . . . . . . . . . . . . . . . .12,000<br />
Lynnhaven Station . . . . . . . . . . . . . . . . . . . . . . . . .26,226<br />
Parkway Center 3 and 4 . . . . . . . . . . . . . . . . . . . . .64,567<br />
Parkway Center I & II . . . . . . . . . . . . . . . . . . . . . . .32,112<br />
Parkway III (Unisys) . . . . . . . . . . . . . . . . . . . . . . . . .50,428<br />
Parkway West (flex) . . . . . . . . . . . . . . . . . . . . . . . . .41,563<br />
RBM Building . . . . . . . . . . . . . . . . . . . . . . . . . . . . .14,170<br />
Sabre Street I . . . . . . . . . . . . . . . . . . . . . . . . . . . . .68,000<br />
Sabre Street II . . . . . . . . . . . . . . . . . . . . . . . . . . . .60,000<br />
Sabre Street III . . . . . . . . . . . . . . . . . . . . . . . . . . . .40,000<br />
Sabre Street IV . . . . . . . . . . . . . . . . . . . . . . . . . . . .40,000<br />
South Lynnhaven Business Park . . . . . . . . . . . . . . .40,000<br />
U.S. Commerce Center (Tidewater Tech) . . . . . . . . .26,819<br />
Yorktown Commerce Center<br />
(228 N. Lynnhaven) . . . . . . . . . . . . . . . . . . . . . .30,529<br />
OWNER OCCUPIED<br />
Cenit Bank Bldg . . . . . . . . . . . . . . . . . . . . . . . . . . .40,000<br />
Global Technical Systems . . . . . . . . . . . . . . . . . . . .46,000<br />
Hall Automotive . . . . . . . . . . . . . . . . . . . . . . . . . . .29,865<br />
SAIC . . . . . . . . . . . . . . . . . . . . . . . . . . . . . . . . . . . .60,000<br />
LITTLE NECK<br />
CLASS B<br />
3300 Building (Virginia Beach Blvd.) . . . . . . . . . . .11,000<br />
King’s Grant Office Building . . . . . . . . . . . . . . . . . .13,000<br />
Little Neck Office Park (3300 Bldg) . . . . . . . . . . . .33,000<br />
Little Neck Office Park (3300 South) . . . . . . . . . . .50,000<br />
Little Neck Office Park (3400 Bldg) . . . . . . . . . . . .22,000<br />
Little Neck Towers . . . . . . . . . . . . . . . . . . . . . . . . . .48,860<br />
Lynnhaven Station 101 North Lynnhaven ( . . . . . . .28,000<br />
NEXCOM Building . . . . . . . . . . . . . . . . . . . . . . . . . .75,000<br />
NEXCOM Expansion . . . . . . . . . . . . . . . . . . . . . . . .18,000<br />
Plaza Trail Office Building . . . . . . . . . . . . . . . . . . . .15,975<br />
Rose Hall Commons . . . . . . . . . . . . . . . . . . . . . . . .12,266<br />
Rose Hall Pr<strong>of</strong>essional Center . . . . . . . . . . . . . . . . .20,000<br />
Rosemont Interstate Center I . . . . . . . . . . . . . . . . .41,400<br />
Rosemont Interstate Center II . . . . . . . . . . . . . . . . .51,835<br />
Rosemont Interstate Center III* . . . . . . . . . . . . . . .38,000<br />
Sun Building . . . . . . . . . . . . . . . . . . . . . . . . . . . . . .11,600<br />
Transouth Building (3615 VB Blvd) . . . . . . . . . . . . .12,500<br />
CLASS C<br />
Birchwood Office Park . . . . . . . . . . . . . . . . . . . . . . .11,688<br />
Byler Building . . . . . . . . . . . . . . . . . . . . . . . . . . . . .16,592<br />
OWNER OCCUPIED<br />
Plan-It Building . . . . . . . . . . . . . . . . . . . . . . . . . . . .24,000<br />
MILITARY CIRCLE<br />
CLASS A<br />
Riverside Commerce Center (120 Corporate Blvd.) .70,000<br />
Riverside Corporate Center . . . . . . . . . . . . . . . . . . .86,682<br />
CLASS B<br />
Centura Bank Building . . . . . . . . . . . . . . . . . . . . . .40,442<br />
Circle East . . . . . . . . . . . . . . . . . . . . . . . . . . . . . . .41,047<br />
<strong>College</strong> Park Executive Center . . . . . . . . . . . . . . . . .20,000<br />
FBI Building . . . . . . . . . . . . . . . . . . . . . . . . . . . . . .50,000<br />
I.T.T. Building . . . . . . . . . . . . . . . . . . . . . . . . . . . . . .49,379<br />
CLASS C<br />
Executive Office - Janaf . . . . . . . . . . . . . . . . . . . . . .28,800<br />
Janaf Office Building . . . . . . . . . . . . . . . . . . . . . . . .37,329<br />
OWNER OCCUPIED<br />
Portfolio Recovery Building . . . . . . . . . . . . . . . . . . .34,850<br />
Sentara . . . . . . . . . . . . . . . . . . . . . . . . . . . . . . . . .45,000<br />
Union Mission (former VA Natural Gas) . . . . . . . . . .75,403<br />
NEWTOWN/WITCHDUCK<br />
CLASS A<br />
AAA Headquarters . . . . . . . . . . . . . . . . . . . . . . . . .47,045<br />
Amelia Building . . . . . . . . . . . . . . . . . . . . . . . . . . .64,660<br />
Amerigroup Building I . . . . . . . . . . . . . . . . . . . . . .106,000<br />
Amerigroup Building II . . . . . . . . . . . . . . . . . . . . .106,000<br />
BB&T Building . . . . . . . . . . . . . . . . . . . . . . . . . . . .30,000<br />
Expressway Corporate Center . . . . . . . . . . . . . . . . .85,658<br />
Gallery I . . . . . . . . . . . . . . . . . . . . . . . . . . . . . . . . .30,000<br />
Gallery II . . . . . . . . . . . . . . . . . . . . . . . . . . . . . . . . .30,000<br />
Greenwich Center . . . . . . . . . . . . . . . . . . . . . . . . . .56,000<br />
Greenwich Commons . . . . . . . . . . . . . . . . . . . . . . .55,000<br />
Greenwich Station . . . . . . . . . . . . . . . . . . . . . . . . .29,000<br />
Halifax Building . . . . . . . . . . . . . . . . . . . . . . . . . . .71,100<br />
Mass Mutual Building . . . . . . . . . . . . . . . . . . . . . . .45,500<br />
Smithfield Building . . . . . . . . . . . . . . . . . . . . . . . .145,000<br />
Verizon Center . . . . . . . . . . . . . . . . . . . . . . . . . . .135,000<br />
Westmoreland Building . . . . . . . . . . . . . . . . . . . . . .83,436<br />
CLASS B<br />
144 Business Park Drive . . . . . . . . . . . . . . . . . . . .17,000<br />
168 Business Park Drive . . . . . . . . . . . . . . . . . . . .19,300<br />
184 Business Park Drive . . . . . . . . . . . . . . . . . . . .27,784<br />
209 Business Park Drive . . . . . . . . . . . . . . . . . . . .11,250<br />
232 Business Park Drive . . . . . . . . . . . . . . . . . . . .14,000<br />
396 Witchduck Road . . . . . . . . . . . . . . . . . . . . . . .12,000<br />
6330 Newtown Road . . . . . . . . . . . . . . . . . . . . . . .55,181<br />
American Teleservices Building . . . . . . . . . . . . . . . .12,232<br />
Azalea Village . . . . . . . . . . . . . . . . . . . . . . . . . . . . .20,000<br />
BCF Building . . . . . . . . . . . . . . . . . . . . . . . . . . . . . .24,000<br />
BPC Building . . . . . . . . . . . . . . . . . . . . . . . . . . . . .29,074<br />
Colonial Corporate Center . . . . . . . . . . . . . . . . . . . .41,772<br />
Commerce Centre (200-259 Expressway Ct) . . . . .35,500<br />
Commonwealth Building . . . . . . . . . . . . . . . . . . . . .10,000<br />
Interstate Corporate Center . . . . . . . . . . . . . . . . .430,000<br />
Parliament Drive Pr<strong>of</strong>essional Bldg . . . . . . . . . . . . .10,000<br />
TRC Center I . . . . . . . . . . . . . . . . . . . . . . . . . . . . . .62,000<br />
TRC Center II . . . . . . . . . . . . . . . . . . . . . . . . . . . . . .36,884<br />
TRC Center III . . . . . . . . . . . . . . . . . . . . . . . . . . . . .52,000<br />
Witchduck Crossing . . . . . . . . . . . . . . . . . . . . . . . .15,326<br />
CLASS C<br />
Witchduck Office Court . . . . . . . . . . . . . . . . . . . . . .18,000<br />
OWNER OCCUPIED<br />
Cox Cable Building . . . . . . . . . . . . . . . . . . . . . . . . .45,000<br />
Cox Expansion . . . . . . . . . . . . . . . . . . . . . . . . . . . .25,000<br />
Copy Data (Ikon) . . . . . . . . . . . . . . . . . . . . . . . . . .20,000<br />
Lendman . . . . . . . . . . . . . . . . . . . . . . . . . . . . . . . .10,000<br />
Newtown Square . . . . . . . . . . . . . . . . . . . . . . . . . .78,000<br />
PEMBROKE/<br />
CENTRAL BUSINESS DISTRICT<br />
CLASS A<br />
249 Central Park Avenue . . . . . . . . . . . . . . . . . . . .59,000<br />
Convergence Center . . . . . . . . . . . . . . . . . . . . . . . .85,000<br />
Convergence Center II . . . . . . . . . . . . . . . . . . . . . . .85,000<br />
Convergence Center III . . . . . . . . . . . . . . . . . . . . . .99,000<br />
Corporate Center VI . . . . . . . . . . . . . . . . . . . . . . . .59,000<br />
Five Columbus Center . . . . . . . . . . . . . . . . . . . . . . .20,000<br />
Fulton Bank Plaza . . . . . . . . . . . . . . . . . . . . . . . . . .90,315<br />
One Columbus Center . . . . . . . . . . . . . . . . . . . . .134,000<br />
OSS Building (former Ticketmaster) . . . . . . . . . . . .30,000<br />
Six Columbus Center . . . . . . . . . . . . . . . . . . . . . . .36,000<br />
Southport Center . . . . . . . . . . . . . . . . . . . . . . . . . .65,000<br />
Town Center (222 Central Park) . . . . . . . . . . . . . .256,900<br />
Town Center North Tower . . . . . . . . . . . . . . . . . . . . .53,000<br />
Two Columbus Center . . . . . . . . . . . . . . . . . . . . . .109,000<br />
CLASS B<br />
4701 Columbus . . . . . . . . . . . . . . . . . . . . . . . . . . .32,000<br />
4705 Columbus Street . . . . . . . . . . . . . . . . . . . . . .33,000<br />
4801 Columbus Street . . . . . . . . . . . . . . . . . . . . . .40,000<br />
Corporate Center I . . . . . . . . . . . . . . . . . . . . . . . . .51,000<br />
Corporate Center II . . . . . . . . . . . . . . . . . . . . . . . . .52,475<br />
Corporate Center III . . . . . . . . . . . . . . . . . . . . . . . .51,000<br />
Corporate Center IV . . . . . . . . . . . . . . . . . . . . . . . .76,012<br />
Holland Commerce Center . . . . . . . . . . . . . . . . . . .30,000<br />
Holland Office Park . . . . . . . . . . . . . . . . . . . . . . . . .32,000<br />
Independence Business Center . . . . . . . . . . . . . . .62,000<br />
Independence Technology Center - Technocenter I .50,000<br />
Independent Plaza . . . . . . . . . . . . . . . . . . . . . . . . .36,655<br />
Pembroke Commercial Bldg. (4425 Corporation Lane)<br />
70,760<br />
Pembroke Office Park . . . . . . . . . . . . . . . . . . . . . .294,000<br />
Prism Plaza . . . . . . . . . . . . . . . . . . . . . . . . . . . . . . .32,000<br />
Southgate Centre . . . . . . . . . . . . . . . . . . . . . . . . . .43,200<br />
Southport Business Center(flex) (Baskin Bldg) . . . .20,683<br />
Southport Trade Center(flex) . . . . . . . . . . . . . . . . . .30,883<br />
Thalia One . . . . . . . . . . . . . . . . . . . . . . . . . . . . . . .18,408<br />
Thalia Pr<strong>of</strong>essional Center . . . . . . . . . . . . . . . . . . .15,000<br />
The Meadows . . . . . . . . . . . . . . . . . . . . . . . . . . . . .32,433<br />
VST Building . . . . . . . . . . . . . . . . . . . . . . . . . . . . .25,000<br />
CLASS C<br />
4224 Holland Road . . . . . . . . . . . . . . . . . . . . . . . .10,104<br />
Dragas Office Park . . . . . . . . . . . . . . . . . . . . . . . . .30,896<br />
Haygood Buildings . . . . . . . . . . . . . . . . . . . . . . . . .22,392<br />
Haygood Executive Park . . . . . . . . . . . . . . . . . . . . .36,472<br />
Holland Plaza Office Building . . . . . . . . . . . . . . . . .14,513<br />
Old Donation Executive Park . . . . . . . . . . . . . . . . . .20,347<br />
Larkspur Village . . . . . . . . . . . . . . . . . . . . . . . . . . .16,184<br />
Pocahontas Center . . . . . . . . . . . . . . . . . . . . . . . . .17,800<br />
OWNER OCCUPIED<br />
Alantec Financial Fed Credit Union . . . . . . . . . . . . .12,000<br />
AVIS . . . . . . . . . . . . . . . . . . . . . . . . . . . . . . . . . . .168,000<br />
Coastal Training Technologies . . . . . . . . . . . . . . . . .60,000<br />
Commonwealth <strong>College</strong> . . . . . . . . . . . . . . . . . . . . .30,000<br />
Electronic Systems Building . . . . . . . . . . . . . . . . . .10,000<br />
ISC . . . . . . . . . . . . . . . . . . . . . . . . . . . . . . . . . . . . .40,000<br />
QED Building . . . . . . . . . . . . . . . . . . . . . . . . . . . . .30,000<br />
REIN Building . . . . . . . . . . . . . . . . . . . . . . . . . . . . .24,500<br />
Virginia Natural Gas Building . . . . . . . . . . . . . . . . .48,242<br />
PORTSMOUTH<br />
CLASS A<br />
BB&T Building (500 Crawford) . . . . . . . . . . . . . . . .35,327<br />
Harbourfront Corporate Center (801 Water St) . . . .53,000<br />
CLASS B<br />
307 County Street . . . . . . . . . . . . . . . . . . . . . . . . .13,475<br />
355 Crawford Street Building . . . . . . . . . . . . . . . . .79,367<br />
600 Crawford Street . . . . . . . . . . . . . . . . . . . . . . . .16,171<br />
Boyette Pr<strong>of</strong>essional Center . . . . . . . . . . . . . . . . . .13,000<br />
Bristol Square . . . . . . . . . . . . . . . . . . . . . . . . . . . . .10,800
Towne Bank Building (200 High St) . . . . . . . . . . . .34,000<br />
JJH Building . . . . . . . . . . . . . . . . . . . . . . . . . . . . . .17,563<br />
New Kirn Building . . . . . . . . . . . . . . . . . . . . . . . . . .44,000<br />
PortCentre I (flex) . . . . . . . . . . . . . . . . . . . . . . . . .100,000<br />
Port Trade Center . . . . . . . . . . . . . . . . . . . . . . . . . .14,223<br />
The Seaboard Building . . . . . . . . . . . . . . . . . . . . . .65,000<br />
Wachovia Bank . . . . . . . . . . . . . . . . . . . . . . . . . . . .48,000<br />
CLASS C<br />
Crawford Executive Center . . . . . . . . . . . . . . . . . . .20,340<br />
SUFFOLK<br />
CLASS A<br />
MAST One . . . . . . . . . . . . . . . . . . . . . . . . . . . . . . .60,000<br />
JTASC Building . . . . . . . . . . . . . . . . . . . . . . . . . . .408,365<br />
CLASS B<br />
Bridgeway Technology Center I . . . . . . . . . . . . . . .125,000<br />
Bridgeway Technology Center II . . . . . . . . . . . . . . . .67,500<br />
Bridgeway Technology Center III . . . . . . . . . . . . . . .72,384<br />
Brinkley Building . . . . . . . . . . . . . . . . . . . . . . . . . . .20,500<br />
Brinkley Building II . . . . . . . . . . . . . . . . . . . . . . . . .21,000<br />
Harbour Breeze Pr<strong>of</strong>essional Center . . . . . . . . . . . .52,265<br />
Harbour View Medical Arts Center . . . . . . . . . . . . . .47,000<br />
Harbor View Pr<strong>of</strong>essional Center (1033 & 1035) .23,000”<br />
Konik<strong>of</strong>f Medical Office Building . . . . . . . . . . . . . .22,675”<br />
Lakeview Technology GSA Center . . . . . . . . . . . . .110,000<br />
Lakeview Tech Center II . . . . . . . . . . . . . . . . . . . . .86,400”<br />
Main Street Center . . . . . . . . . . . . . . . . . . . . . . . . .13,800<br />
Washington Street Center . . . . . . . . . . . . . . . . . . . .12,000<br />
OWNER OCCUPIED<br />
Rubicon NGP - Lakeview Technical Center . . . . . . .351,075<br />
Lockheed Martin . . . . . . . . . . . . . . . . . . . . . . . . . . .50,000<br />
Overton Building . . . . . . . . . . . . . . . . . . . . . . . . . . .12,940<br />
Rose & Womble Building . . . . . . . . . . . . . . . . . . . .25,000<br />
Towne Bank Center . . . . . . . . . . . . . . . . . . . . . . . . .19,318<br />
DOWNTOWN HAMPTON<br />
CLASS A<br />
Harbour Centre . . . . . . . . . . . . . . . . . . . . . . . . . . .158,855<br />
CLASS B<br />
10-16 W. Queens Way . . . . . . . . . . . . . . . . . . . . . .11,238<br />
47 W. Queens Way . . . . . . . . . . . . . . . . . . . . . . . . .12,500<br />
Mill Point Center . . . . . . . . . . . . . . . . . . . . . . . . . . .10,000<br />
One Mallory Street . . . . . . . . . . . . . . . . . . . . . . . . .14,000<br />
CLASS C<br />
55 W. Queens Way . . . . . . . . . . . . . . . . . . . . . . . . .12,132<br />
DOWNTOWN NEWPORT NEWS<br />
CLASS B<br />
2600 Building . . . . . . . . . . . . . . . . . . . . . . . . . . .118,018<br />
Wachovia Bank Building . . . . . . . . . . . . . . . . . . . . .17,846<br />
OWNER OCCUPIED<br />
Newport News Shipbuilding, Bldg 520-521” . . . . .50,000<br />
HAMPTON ROADS CENTER<br />
CLASS A<br />
6 Manhattan Square . . . . . . . . . . . . . . . . . . . . . . .30,106<br />
1001 N Campus Parkway . . . . . . . . . . . . . . . . . . . .19,000<br />
Allstate Building . . . . . . . . . . . . . . . . . . . . . . . . . . .17,000<br />
HealthNet Building . . . . . . . . . . . . . . . . . . . . . . . . .60,482<br />
Lakefront Plaza I . . . . . . . . . . . . . . . . . . . . . . . . . . .77,442<br />
Morgan Marrow Building . . . . . . . . . . . . . . . . . . . . .12,000<br />
Olympia Place . . . . . . . . . . . . . . . . . . . . . . . . . . . .72,395<br />
Oxford Plaza . . . . . . . . . . . . . . . . . . . . . . . . . . . . . .64,297<br />
Parkway Executive Center . . . . . . . . . . . . . . . . . . . .45,000<br />
Research Quad - Building One . . . . . . . . . . . . . . . .60,000<br />
Research Quad - Building Three . . . . . . . . . . . . . .100,000<br />
CLASS B<br />
400 Butler Farm Road . . . . . . . . . . . . . . . . . . . . . .96,446<br />
404 Butler Farm Road . . . . . . . . . . . . . . . . . . . . . .54,715<br />
421 Butler Farm Road . . . . . . . . . . . . . . . . . . . . . .56,515<br />
<strong>Hampton</strong> I . . . . . . . . . . . . . . . . . . . . . . . . . . . . . . .68,532<br />
<strong>Hampton</strong> II . . . . . . . . . . . . . . . . . . . . . . . . . . . . . . .67,000<br />
<strong>Hampton</strong> III . . . . . . . . . . . . . . . . . . . . . . . . . . . . . .45,000<br />
<strong>Hampton</strong> Technology Center I . . . . . . . . . . . . . . . . .56,575<br />
NDS Building . . . . . . . . . . . . . . . . . . . . . . . . . . . . .35,000<br />
Raytheon . . . . . . . . . . . . . . . . . . . . . . . . . . . . . . . .50,000<br />
Research Office Building . . . . . . . . . . . . . . . . . . . . .30,000<br />
CLASS C<br />
NASA Langley Research Center . . . . . . . . . . . . . . .11,790<br />
3217 Armistead Avenue . . . . . . . . . . . . . . . . . . . . .24,043<br />
COLISEUM CENTRAL<br />
CLASS A<br />
Claiborne Building (Regional Mall Office) . . . . . . .150,000<br />
Executive Tower . . . . . . . . . . . . . . . . . . . . . . . . . . .134,164<br />
Pinewood Plaza . . . . . . . . . . . . . . . . . . . . . . . . . . .77,500<br />
CLASS B<br />
2115 Executive Drive . . . . . . . . . . . . . . . . . . . . . . .62,000<br />
2310 Tower Place . . . . . . . . . . . . . . . . . . . . . . . . . .10,500<br />
Bank <strong>of</strong> America Building . . . . . . . . . . . . . . . . . . . .14,434<br />
Colony Square <strong>of</strong> <strong>Hampton</strong> . . . . . . . . . . . . . . . . . . .30,050<br />
Riverdale Complex . . . . . . . . . . . . . . . . . . . . . . . .168,000<br />
Sheraton Office Bldg. . . . . . . . . . . . . . . . . . . . . . . .12,673<br />
Todds Lane Pr<strong>of</strong>essional Center . . . . . . . . . . . . . . .12,500<br />
West Telemarketing . . . . . . . . . . . . . . . . . . . . . . . . .55,855<br />
OWNER OCCUPIED<br />
Langley Federal Credit Union . . . . . . . . . . . . . . . . .72,800<br />
NEWMARKET<br />
CLASS B<br />
Newmarket Building . . . . . . . . . . . . . . . . . . . . . . . .21,262<br />
NetCenter . . . . . . . . . . . . . . . . . . . . . . . . . . . . . . .546,171<br />
UPS Call Center . . . . . . . . . . . . . . . . . . . . . . . . . .103,000<br />
CLASS C<br />
Rouse Tower . . . . . . . . . . . . . . . . . . . . . . . . . . . . .150,000<br />
OWNER OCCUPIED<br />
NN Shipbuilding Employee Credit Union . . . . . . . . .15,000<br />
OYSTER POINT<br />
CLASS A<br />
601 Thimble Shoals Boulevard . . . . . . . . . . . . . . . .30,000<br />
Atrium At Oyster Point . . . . . . . . . . . . . . . . . . . . . .62,971<br />
Cedar One . . . . . . . . . . . . . . . . . . . . . . . . . . . . . . .15,467<br />
Cedar Two . . . . . . . . . . . . . . . . . . . . . . . . . . . . . . . .27,000<br />
Contemporary Cybernetics . . . . . . . . . . . . . . . . . . .60,000<br />
Ferguson Corporate Center II . . . . . . . . . . . . . . . .150,000<br />
Fountain Plaza One . . . . . . . . . . . . . . . . . . . . . . .100,000<br />
Fountain Plaza Two . . . . . . . . . . . . . . . . . . . . . . . . .80,000<br />
Fountain Plaza Three . . . . . . . . . . . . . . . . . . . . . . . .80,000<br />
Langley Federal Centre . . . . . . . . . . . . . . . . . . . . . .51,982<br />
Merchants Walk . . . . . . . . . . . . . . . . . . . . . . . . . . .28,000<br />
One City Center . . . . . . . . . . . . . . . . . . . . . . . . . . .70,000<br />
One Oyster Point . . . . . . . . . . . . . . . . . . . . . . . . . . .36,226<br />
Oyster Point Interstate Center . . . . . . . . . . . . . . . . .64,000<br />
Patrick Henry Corporate Center . . . . . . . . . . . . . . . .98,883<br />
Riverside Health Center Building (Warwick) . . . . . .104,500<br />
Peninsula Pr<strong>of</strong>essional Building . . . . . . . . . . . . . . .30,800<br />
Rock Landing Corporate Center II . . . . . . . . . . . . . .33,476<br />
SunTrust Building . . . . . . . . . . . . . . . . . . . . . . . . .100,955<br />
Symantec Corp. Building . . . . . . . . . . . . . . . . . . .100,000<br />
Tower Park (733 &735 Thimble Shoals) . . . . . . . . .31,667<br />
Town Center One . . . . . . . . . . . . . . . . . . . . . . . . . . .60,000<br />
TowneBank Center . . . . . . . . . . . . . . . . . . . . . . . . .60,000<br />
Two City Center . . . . . . . . . . . . . . . . . . . . . . . . . . . .63,600<br />
Two Oyster Point . . . . . . . . . . . . . . . . . . . . . . . . . . .39,137<br />
Turner Bldg (1060 L<strong>of</strong>tis) . . . . . . . . . . . . . . . . . . .21,000”<br />
Wachovia Building . . . . . . . . . . . . . . . . . . . . . . . . .42,921<br />
William E Wood Building (1030 L<strong>of</strong>tis) . . . . . . . . . .26,000<br />
CLASS B<br />
11790 Jefferson Avenue . . . . . . . . . . . . . . . . . . . . .20,662<br />
745 Bluecrab (flex) . . . . . . . . . . . . . . . . . . . . . . . .16,000<br />
BB&T Plaza (603 Pilot House) . . . . . . . . . . . . . . . .37,348<br />
Cale Colony 17 . . . . . . . . . . . . . . . . . . . . . . . . . . . .17,000<br />
Canon Place . . . . . . . . . . . . . . . . . . . . . . . . . . . . . .26,000<br />
Comb-Bay Park . . . . . . . . . . . . . . . . . . . . . . . . . . . .32,000<br />
Dunwoody Place . . . . . . . . . . . . . . . . . . . . . . . . . . .19,798<br />
Executive Center . . . . . . . . . . . . . . . . . . . . . . . . . . .95,399<br />
Fishing Point Complex(flex) . . . . . . . . . . . . . . . . . . .50,000<br />
International Distribution Center . . . . . . . . . . . . . . .36,000<br />
McCale Pr<strong>of</strong>essional Park . . . . . . . . . . . . . . . . . . . .40,000<br />
Middle Ground Business Center . . . . . . . . . . . . . . .62,000<br />
Oyster Point Center . . . . . . . . . . . . . . . . . . . . . . . . .44,000<br />
Oyster Point Business Center . . . . . . . . . . . . . . . . .25,000<br />
Oyster Point Place (flex) . . . . . . . . . . . . . . . . . . . . .38,000<br />
Oyster Point West . . . . . . . . . . . . . . . . . . . . . . . . .176,560<br />
Park Central Executive Center . . . . . . . . . . . . . . . . .54,425<br />
Park Place (751 & 753 Thimble Shoals) . . . . . . . .25,000<br />
Peninsula Business Center I (flex) . . . . . . . . . . . . . .21,817<br />
Peninsula Business Centre II (flex) . . . . . . . . . . . . .40,475<br />
Peninsula Business Centre III (flex) . . . . . . . . . . . . .60,000<br />
Rock Landing Corporate Center IV . . . . . . . . . . . . .18,125<br />
Rock Landing Corporate Center V . . . . . . . . . . . . . .18,125<br />
Technology Center (flex) . . . . . . . . . . . . . . . . . . . . .81,000<br />
Thimble Shoals Business Center (flex) . . . . . . . . . .55,377<br />
Thimble Shores Lakefront . . . . . . . . . . . . . . . . . . . .25,000<br />
CLASS C<br />
714-716-718 J.Clyde Morris Blvd. . . . . . . . . . . . . .15,000<br />
Drucker & Falk Building . . . . . . . . . . . . . . . . . . . . .30,000<br />
Pilgrim Landing . . . . . . . . . . . . . . . . . . . . . . . . . . . .10,650<br />
Regent Park . . . . . . . . . . . . . . . . . . . . . . . . . . . . . .25,000<br />
OWNER OCCUPIED<br />
Applied Research Center . . . . . . . . . . . . . . . . . . .121,000<br />
Fountain Plaza Two . . . . . . . . . . . . . . . . . . . . . . . . .80,000<br />
Muller Martini Building . . . . . . . . . . . . . . . . . . . . . .24,000<br />
Peninsula Retail Credit . . . . . . . . . . . . . . . . . . . . . .30,000<br />
SUBURBAN NEWPORT NEWS<br />
CLASS B<br />
Bay Savings Bank Building . . . . . . . . . . . . . . . . . . .18,000<br />
Colony Square <strong>of</strong> Denbigh II . . . . . . . . . . . . . . . . . .26,100<br />
Denbigh Pr<strong>of</strong>essional Park . . . . . . . . . . . . . . . . . . .40,598<br />
Ferguson Enterprises . . . . . . . . . . . . . . . . . . . . . . .75,800<br />
MCI Building . . . . . . . . . . . . . . . . . . . . . . . . . . . . . .60,000<br />
Tidewater Tech (616 Denbigh Blvd) . . . . . . . . . . . .15,778<br />
CLASS C<br />
Mariner Building . . . . . . . . . . . . . . . . . . . . . . . . . . .26,000<br />
Teagle Building . . . . . . . . . . . . . . . . . . . . . . . . . . . .22,000<br />
OWNER OCCUPIED<br />
CNU Building . . . . . . . . . . . . . . . . . . . . . . . . . . . . .40,000<br />
WILLIAMSBURG/JAMES CITY/YORK<br />
COUNTY<br />
CLASS A<br />
263 McLaws Circle . . . . . . . . . . . . . . . . . . . . . . . . .26,967<br />
Atrium Building . . . . . . . . . . . . . . . . . . . . . . . . . . . .24,000<br />
Casey New Town - SunTrust . . . . . . . . . . . . . . . . . . .60,000<br />
Courthouse Green . . . . . . . . . . . . . . . . . . . . . . . . .30,000<br />
Design Center . . . . . . . . . . . . . . . . . . . . . . . . . . . . .13,700<br />
First Union Center . . . . . . . . . . . . . . . . . . . . . . . . . .32,000<br />
Langley Federal Credit Union . . . . . . . . . . . . . . . . .20,000<br />
Williamsburg Commerce Center . . . . . . . . . . . . . . .32,000<br />
Palladian Office Building . . . . . . . . . . . . . . . . . . . . .21,000<br />
Patriot Park Business Center . . . . . . . . . . . . . . . . . .24,000<br />
Sentara New Town Medical Building . . . . . . . . . . . .50,000<br />
Sun Trust (Courthouse St.) . . . . . . . . . . . . . . . . . . .60,000<br />
William E. Wood Building . . . . . . . . . . . . . . . . . . . .20,000”<br />
CLASS B<br />
104 Bypass Road . . . . . . . . . . . . . . . . . . . . . . . . .11,100<br />
7601 George Washington Memorial Highway . . . . .10,000<br />
Chartertowne Pr<strong>of</strong>essional Center . . . . . . . . . . . . . .12,800<br />
Greens Springs Office Park . . . . . . . . . . . . . . . . . . .37,000<br />
Kristinsand Office Park . . . . . . . . . . . . . . . . . . . . . .15,221<br />
Packets Executive Center . . . . . . . . . . . . . . . . . . . .23,000<br />
Quarterland Commons Office Condos . . . . . . . . .120,000<br />
Rivergate Center . . . . . . . . . . . . . . . . . . . . . . . . . . .36,000<br />
Wachovia Bank . . . . . . . . . . . . . . . . . . . . . . . . . . . .10,500<br />
Williamsburg Office Park . . . . . . . . . . . . . . . . . . . . .79,600<br />
Disclaimer: The information in this report is deemed reliable.<br />
The Old Dominion University E. V. Williams Center for <strong>Real</strong> <strong>Estate</strong><br />
and Economic Development makes no representation or<br />
warranty as to its accuracy.<br />
. . . . . . . . . . . . . . . . . . . . . . . . . . . . . . . . . . . . . . . . . . . . . .<br />
BOLD indicates change/addition from last year.
Office Submarkets<br />
Southside<br />
1 Airport/Northampton<br />
2 Chesapeake/Greenbrier<br />
3 Downtown Norfolk<br />
4 Central Norfolk<br />
5 Hilltop/Oceanfront<br />
6 Corporate Landing<br />
7 Kempsville<br />
8 Little Neck<br />
9 Lynnhaven<br />
10 Military Circle<br />
11 Newtown/Witchduck<br />
12 Northern Suffolk<br />
13 Pembroke<br />
14 Portsmouth<br />
Peninsula<br />
15 Downtown <strong>Hampton</strong><br />
16 <strong>Hampton</strong> <strong>Roads</strong> Center<br />
17 Coliseum Central<br />
18 Downtown Newport News<br />
19 Newmarket<br />
20 Oyster Point<br />
21 Suburban Newport News<br />
22 Williamsburg/<br />
James City Co./<br />
York County
RESIDENTIAL <strong>2011</strong><br />
HAMPTON ROADS<br />
REAL ESTATE<br />
MARKET REVIEW<br />
New Residential <strong>Market</strong><br />
Authors<br />
Data Analysis/<br />
Layout<br />
Blair Hardesty and Ron Wildermuth<br />
Residential DataBank<br />
Existing Residential <strong>Market</strong><br />
Author<br />
Data Analysis/<br />
Layout<br />
James Pritchard<br />
Manager, Data & Analytics<br />
<strong>Real</strong> <strong>Estate</strong> Information Network, Inc.<br />
<strong>Hampton</strong> <strong>Roads</strong> MLS<br />
Financial<br />
Support<br />
Disclosure<br />
The E. V. Williams Center for <strong>Real</strong> <strong>Estate</strong> and Economic<br />
Development (CREED) functions and reports are<br />
funded by donations from individuals, organizations<br />
and the CREED Council.<br />
The data used for this report are deemed reliable; however,<br />
neither Old Dominion University, the E. V. Williams Center for <strong>Real</strong> <strong>Estate</strong><br />
and Economic Development, nor sponsoring<br />
companies and/or individuals makes any representation or<br />
warranty as to its accuracy.<br />
51<br />
<strong>2011</strong> RESIDENTIAL
General Overview<br />
The <strong>Hampton</strong> <strong>Roads</strong> Residential market statistics covered in this report analyze the new home building industry<br />
and the existing home sales activity for the year 2010. Included are the cities <strong>of</strong> Chesapeake, <strong>Hampton</strong>, Newport<br />
News, Norfolk, Poquoson, Portsmouth, Suffolk, Virginia Beach, and<br />
Williamsburg, and the counties <strong>of</strong> Gloucester, Isle <strong>of</strong> Wight, James City, and York.<br />
The new homes portion <strong>of</strong> the report also includes information for Franklin and<br />
Southampton, while the existing homes part <strong>of</strong> the report contains additional information<br />
on Surry, Matthews and Currituck.The new construction data contained<br />
in this report was gathered from the actual deeds recorded and from the<br />
building permits issued by each city or county. The sales data and existing home<br />
closings data was gathered from the <strong>Real</strong> <strong>Estate</strong> Information Network.<br />
NEW CONSTRUCTION<br />
In 2010, home builders withstood more pricing challenges, lower site<br />
traffic counts, and cautious, reluctant buyers. Foreclosures and short sales<br />
continued to place a drag on new home sales. Builders continued to rethink pricing and features, redesign product, adjust<br />
square footages and reevaluate their margin and sales expectations.<br />
New construction closings in <strong>Hampton</strong> <strong>Roads</strong> declined 13.1 % in 2010 compared to 2009. Despite the decline there<br />
were many successes. These successes were due to several key factors. Some were the result <strong>of</strong> fresh new designs with compelling<br />
prices; others were due to superior locations, strong amenity packages, attractive community settings, unique and appealing<br />
home designs, outstanding sales and marketing teams or combinations <strong>of</strong> all <strong>of</strong> these factors.<br />
Overall, average sales prices held steady region wide in 2010 for new construction detached, townhomes, duplexes and<br />
multi-plex homes. Results varied widely by jurisdiction, and declines, as well as increases, were experienced. Multi-story condominiums<br />
withstood further price deterioration due to the wide disparity between supply and demand.<br />
The first time homebuyer made a strong showing in the spring thanks to government incentives, but most first time buyers<br />
were absent from the market in the summer and fall.<br />
During the year the inventory drawdown was dramatic. The inventory <strong>of</strong> new homes has all but evaporated. Detached new<br />
home inventory is below a four month supply and attached new construction priced below $350,000, excluding elevator-served<br />
condominiums, is down to a three month supply.<br />
Looking ahead to <strong>2011</strong>, expect foreclosure numbers to peak. Further pressure on prices is likely. Builder incentives will<br />
continue to play a key role in the selling process. Attractively priced lot opportunities will become more abundant as banks continue<br />
to adjust their portfolios. The bright spot is that the underlying unmet demand for housing, which has been building for<br />
three years, will begin to show itself in the marketplace toward the end <strong>of</strong> <strong>2011</strong> and into 2012 as consumers gain confidence<br />
and the economy gains strength.<br />
<strong>2011</strong> <strong>Hampton</strong> <strong>Roads</strong> <strong>Real</strong> <strong>Estate</strong> <strong>Market</strong> <strong>Review</strong><br />
52
<strong>2011</strong> R E S I D E N TIAL<br />
AVERAGE PRICES<br />
During 2010, the average price <strong>of</strong> a new construction, single family detached home in <strong>Hampton</strong> <strong>Roads</strong> was $357,939, holding<br />
steady with the 2009 average price <strong>of</strong> $358,884. The majority <strong>of</strong> municipalities have experienced declines in average closing<br />
prices year over year. Portsmouth had the largest percent decline in average closing price, down 10.6% to $215,883 for the year.<br />
York County also experienced a notable decline with a loss <strong>of</strong><br />
$33,150 down to $390,440 for the year.<br />
The largest percent increase in average closing price occurred<br />
in Norfolk where the price increased 6.4% to $340,412. The success<br />
at this year’s Tidewater Builder’s Association Homearama contributed<br />
in large part to the increase in average price. East Beach<br />
accounted for 25% <strong>of</strong> Norfolk’s new, detached housing in 2010 with<br />
21 closings recorded. These closings averaged $603,021.<br />
Virginia Beach had the highest average closing price for a<br />
new detached home in <strong>Hampton</strong> <strong>Roads</strong>. The average closing price<br />
for 2010 was $426,269. The average closing price for a fee simple<br />
detached home in Virginia Beach was $440,868. The average price<br />
for a detached condominium was $394,295.<br />
The average closing price <strong>of</strong> a multi-story condominium<br />
unit in an elevator- served building was $367,576. This is a decline<br />
<strong>of</strong> 28.6% from 2009. The average closing price <strong>of</strong> a multi-story condominium<br />
unit in a non-elevator served building was $171,791<br />
during 2010, down 4.8% from year ago numbers. Virginia Beach<br />
had the largest decline in average closing price for multi-story condominiums<br />
during 2010, down 30.8% to $271,988.<br />
TABLE I<br />
New Construction Permits And Closing Activity<br />
2009 VERSUS 2010<br />
All Product Types 2009 2010 + / - 2009 2010 + / -<br />
Area Permits Permits % Diff Closings Closings % Diff<br />
Chesapeake 646 734 13.6% 594 536 -9.8%<br />
Franklin/Southampton 59 46 -22.0% 29 16 -44.8%<br />
Gloucester 132 109 -17.4% 94 37 -60.6%<br />
<strong>Hampton</strong> 129 141 9.3% 111 106 -4.5%<br />
Isle <strong>of</strong> Wight 134 121 -9.7% 100 95 -5.0%<br />
James City County 319 469 47.0% 311 334 7.4%<br />
Newport News 80 183 128.8% 100 98 -2.0%<br />
Norfolk 244 173 -29.1% 226 165 -27.0%<br />
Portsmouth 82 61 -25.6% 68 45 -33.8%<br />
Suffolk 357 302 -15.4% 303 272 -10.2%<br />
Virginia Beach 509 585 14.9% 680 557 -18.1%<br />
Williamsburg 40 34 -15% 12 22 83.3%<br />
York County 181 149 -17.7% 143 126 -11.9%<br />
TOTALS 2,912 3,107 6.7% 2,771 2,409 -13.1%<br />
53<br />
<strong>2011</strong> RESIDENTIAL
The multi-plex condominium closing prices remained relatively unchanged in 2010 versus 2009. The average closing price<br />
for a new multi-plex condominium was $229,325, up 0.13%. The majority <strong>of</strong> municipalities had increases in average closing<br />
price with the largest percent increase occurring in York County, where the average price increased 8.2% to $336,490. York<br />
County currently has the highest average closing price for multiplexes in <strong>Hampton</strong> <strong>Roads</strong>.<br />
The largest percent decline occurred in Newport News, down 20.4%; however, only four closings were recorded which is<br />
not a large enough data set to conclude an accurate overall average price. Chesapeake had the only significant decline in average<br />
price for a multi-plex condominium. The average price was $210,398, down 2.7% from last year. The average price <strong>of</strong> a<br />
new multi-plex condominium unit in Chesapeake has declined over the last five years primarily due to the availability <strong>of</strong> smaller<br />
less expensive homes like The Dragas Companies is currently building in the Kempsville Road area.<br />
The average closing price for a new construction townhome or duplex was $268,376 during 2010 in <strong>Hampton</strong> <strong>Roads</strong>. This<br />
represents a slight increase <strong>of</strong> 1.3% year over year; however, only Norfolk and Virginia Beach saw increases in average closing<br />
prices, with increases <strong>of</strong> 20.3% and 10% respectively. Newport News had the largest decline in average closing price, with a<br />
drop <strong>of</strong> $28,522 (10.8%) from 2009. The current average closing price for a new construction townhome in Newport News is<br />
$181,541.<br />
In 2010, the City <strong>of</strong> Virginia Beach had the highest average closing price for a new townhome or duplex in <strong>Hampton</strong><br />
<strong>Roads</strong> at $338,092. The City <strong>of</strong> Portsmouth had the lowest average at $164,415.<br />
GRAPH I<br />
<strong>Hampton</strong> <strong>Roads</strong> Average Closing Price<br />
New Single Family Detached<br />
GRAPH II<br />
<strong>Hampton</strong> <strong>Roads</strong> Average Closing Price<br />
New Multi-Plex Condominium<br />
$500,000<br />
$300,000<br />
$280,000<br />
$450,000<br />
$260,000<br />
Price<br />
$400,000<br />
Price<br />
$240,000<br />
$350,000<br />
$220,000<br />
Price<br />
$300,000<br />
GRAPH III<br />
$700,000<br />
$600,000<br />
$500,000<br />
$400,000<br />
$300,000<br />
$200,000<br />
1Q 2Q 3Q 4Q 1Q 2Q 3Q 4Q 1Q 2Q 3Q 4Q 1Q 2Q 3Q 4Q 1Q 2Q 3Q 4Q<br />
06 06 06 06 07 07 07 07 08 08 08 08 09 09 09 09 10 10 10 10<br />
<strong>Hampton</strong> <strong>Roads</strong> Average Closing Price<br />
New Multi-Story Condominium<br />
1Q 2Q 3Q 4Q 1Q 2Q 3Q 4Q 1Q 2Q 3Q 4Q 1Q 2Q 3Q 4Q 1Q 2Q 3Q 4Q<br />
06 06 06 06 07 07 07 07 08 08 08 08 09 09 09 09 10 10 10<br />
$200,000<br />
GRAPH IV<br />
1Q<br />
$400,000<br />
$375,000<br />
$350,000<br />
$325,000<br />
$300,000<br />
$275,000<br />
$250,000<br />
$225,000<br />
$200,000<br />
10<br />
Price<br />
2Q 3Q 4Q 1Q 2Q 3Q 4Q 1Q 2Q 3Q<br />
06 06 06 06 07 07 07 07 08 08 08 4Q<br />
08 1Q<br />
09 2Q<br />
09 3Q<br />
09 4Q<br />
09 1Q<br />
10 2Q<br />
10 3Q<br />
10 4Q<br />
10<br />
<strong>Hampton</strong> <strong>Roads</strong> Average Closing Price<br />
New Townhome/Duplex<br />
1Q 2Q 3Q 4Q 1Q 2Q 3Q 4Q 1Q 2Q 3Q 4Q 1Q 2Q 3Q 4Q 1Q 2Q 3Q 4Q<br />
06 06 06 06 07 07 07 07 08 08 08 08 09 09 09 09 10 10 10 10<br />
<strong>2011</strong> <strong>Hampton</strong> <strong>Roads</strong> <strong>Real</strong> <strong>Estate</strong> <strong>Market</strong> <strong>Review</strong><br />
54
<strong>2011</strong> RESIDENTIAL<br />
$700,000<br />
<strong>Hampton</strong> <strong>Roads</strong> Average Closing Price<br />
Residential New Construction<br />
$600,000<br />
$500,000<br />
x<br />
SFD<br />
MSCO<br />
MPCO<br />
TH/DP<br />
Average Price<br />
$400,000<br />
$300,000<br />
x<br />
x<br />
x<br />
x<br />
x<br />
x<br />
x x x x x x<br />
x x x x<br />
x x x<br />
$200,000<br />
$100,000<br />
1Q 2Q 3Q 4Q 1Q 2Q 3Q 4Q 1Q 2Q 3Q 4Q 1Q 2Q 3Q 4Q 1Q 2Q 3Q<br />
06 06 06 06 07 07 07 07 08 08 08 08 09 09 09 09 10 10 10<br />
INDIVIDUAL MARKET SEGMENTS<br />
Single Family Detached homes still account for the majority <strong>of</strong> new construction in <strong>Hampton</strong> <strong>Roads</strong> with 61% <strong>of</strong> new<br />
construction closings and 68% <strong>of</strong> new construction permits during 2010. However, the market share <strong>of</strong> detached housing has<br />
dropped significantly from 2000, when detached housing accounted for 79% <strong>of</strong> all new residential closings and 82% <strong>of</strong> new residential<br />
building permits.<br />
There were 2,108 new single family detached permits issued in <strong>Hampton</strong> <strong>Roads</strong> during 2010. This is an increase <strong>of</strong> 9.1%<br />
year over year. More than 66% <strong>of</strong> the permits issued were on the Southside, with Chesapeake accounting for 22.3% <strong>of</strong> all detached<br />
permits issued. James City County experienced the largest increase in detached permits issued, up 52.7% to 342 from<br />
last year.<br />
Closings for 2010 were down 5.9% versus 2009, with 1,473<br />
recorded in <strong>Hampton</strong> <strong>Roads</strong>. James City County had the most notable<br />
increase in the number <strong>of</strong> closings recorded, up 31.6% to 204<br />
closings for the year. The largest percent decline occurred in Gloucester.<br />
During 2009 there were only 35 detached closings recorded, versus<br />
89 last year, down 60.7%. Chesapeake continues to account for<br />
a significant portion <strong>of</strong> new detached housing, with 352 closings recorded for a 23.8% market share. Virginia Beach was the second<br />
highest with 319 closings and a 21.6% housing market share <strong>of</strong> new detached homes.<br />
The top fee-simple, single family detached subdivision in <strong>Hampton</strong> <strong>Roads</strong> for permits and closings was Colonial Heritage<br />
by Lennar Corporation in James City County. There were 67 detached permits issued during 2010 in Colonial Heritage and<br />
there were 48 detached closings recorded with an average price <strong>of</strong> $342,991.<br />
The top detached condominium subdivision for 2010 was Sajo Farm in Virginia Beach. There were 46 permits issued during<br />
the year, 34 for Terry·Peterson Residential and 12 for Napolitano Homes. In addition, Terry·Peterson Residential was issued<br />
13 permits for Lakeside Cove at Sajo Farm, the paired home component <strong>of</strong> the neighborhood. Detached homes in Sajo<br />
Farm are currently starting in the low 300’s.<br />
The top detached condominium subdivision for closings was Sherwood Lakes in Virginia Beach with 42 closings recorded<br />
during 2010. Home Associates <strong>of</strong> Virginia Inc closed the majority <strong>of</strong> the units with 28 closings recorded. These units had an average<br />
price <strong>of</strong> $402,171, with a range <strong>of</strong> $350,105 to $508,616. HBD Build closed 13 units during 2010 with an average price<br />
<strong>of</strong> $478,368. There was one bank owned new construction closing, for a home built by Commonwealth Custom Home Builders.<br />
Ryan Homes was the top builder <strong>of</strong> new detached fee simple housing during 2010. Ryan had 89 permits issued and 62<br />
closings recorded in five communities on the Peninsula. Stonehouse Glen and Fenwick Hills, with 18 detached closings<br />
55<br />
There were 2,108 new single family detached permits<br />
issued in <strong>Hampton</strong> <strong>Roads</strong> during 2010. This is an<br />
increase <strong>of</strong> 9.1% year over year.<br />
<strong>2011</strong> RESIDENTIAL
ecorded in each community, netted the most closings for Ryan. Fenwick Hills had an average closing price <strong>of</strong> $287,825 and<br />
Stonehouse Glen had an average closing price <strong>of</strong> $409,521. Most recently, Ryan Homes has begun building at The Settlement<br />
at Powhatan Creek and Burlington Woods.<br />
Terry·Peterson Residential was the top builder <strong>of</strong> new detached condominiums during 2010. Terry·Peterson Residential<br />
had 54 detached condominium permits issued and 46 closings recorded in four separate communities on the Southside. Their<br />
latest community, Gables at Riverfront opened for sales in October. Additionally, Terry· Peterson had 26 permits issued and<br />
47 closings recorded for other product types.<br />
The Multi-Story Condominium market experienced very little activity during 2010.<br />
There were 147 permits issued for the year, less than 5% <strong>of</strong> all new residential permits. Of these, only 21 were for an<br />
elevator-served community, Windy Knoll’s, in Newport News. The remaining permits were issued to Colonial Crossing in<br />
Newport News, Southmoor at Ridgely Manor in Virginia<br />
Beach, and Kings Pointe at Western Branch in<br />
Chesapeake. There were 144 closings recorded, a<br />
decline <strong>of</strong> 26.5% year over year. There were 79<br />
closings for elevator served buildings and 65 for nonelevator<br />
served.<br />
Southmoor at Ridgely Manor by The Dragas<br />
Companies had the highest number <strong>of</strong> non-elevator<br />
served multi-story condominium closings recorded<br />
for the year. There were 55 closings recorded with<br />
an average closing price <strong>of</strong> $176,602. Compared to<br />
last year, Southmoor had a 33.7% drop in closings<br />
and a 2.2% reduction in average closing price.<br />
Old Beach Village by the Ainslie Group in<br />
Virginia Beach had the highest number <strong>of</strong> closings<br />
for an elevator-served multi-story condominium<br />
community. The community had 12 closings<br />
recorded with an average price <strong>of</strong> $367,363. These<br />
units had an average size <strong>of</strong> 1,601 square feet, yielding<br />
a price per square foot <strong>of</strong> $229.23.<br />
The Multi-Plex Condominium market held<br />
steady in the number <strong>of</strong> permits issued during 2010.<br />
There were 246 permits, only one permit less than<br />
2009. There were 233 closings recorded, a decrease<br />
GRAPH V<br />
100%<br />
75%<br />
50%<br />
25%<br />
0%<br />
<strong>of</strong> 24.8% from 2009. Chesapeake continues to have the most multi-plex activity with 53% <strong>of</strong> the permits issued and 46% <strong>of</strong><br />
the closings recorded.<br />
The top multi-plex condominium community for permits and closings was Brighton Park at Greenbrier by The Dragas<br />
Companies. The community had 71 closings recorded for the year with an average price <strong>of</strong> $207,549.<br />
The Dragas Companies continue to<br />
dominate the multi-plex condominium<br />
market in <strong>Hampton</strong> <strong>Roads</strong>. They currently<br />
have three multi-plex communities<br />
in Chesapeake — Brighton Park,<br />
Oakbrooke Crossing, and Kings Pointe.<br />
Kings Pointe is their newest community<br />
and is expected to open for sales this<br />
spring. The builder was issued 121<br />
building permits for new residential multi-plex units during 2010, nearly half <strong>of</strong> all multi-plex permits. They recorded 95 multiplex<br />
condominium closings during the year, representing 40.7% <strong>of</strong> the <strong>Hampton</strong> <strong>Roads</strong> multi-plex market.<br />
The number <strong>of</strong> Townhome and Duplex permits in 2010 was the same as 2009, with 606 issued. Permits were evenly<br />
distributed between the Southside and the Peninsula with 306 to the Southside areas and 300 to the Peninsula areas. Virginia<br />
Detached<br />
The number <strong>of</strong> Townhome and Duplex permits in 2010 was<br />
the same as 2009, with 606 issued. Permits were evenly<br />
distributed between the Southside and the Peninsula with<br />
306 to the Southside areas and 300 to the Peninsula areas.<br />
165<br />
247<br />
541<br />
438<br />
83<br />
<strong>Market</strong> Share for New Construction<br />
2010 Closings by Price Range<br />
24<br />
150<br />
467<br />
250<br />
Attached<br />
36<br />
$500K +<br />
$400K to $500K<br />
$300K to $400K<br />
$200K to $300K<br />
<strong>2011</strong> R E S I D E N TIAL<br />
Beach had the highest number <strong>of</strong> permits issued on the Southside with 115 and Newport News had the highest number on<br />
the Peninsula with 108.<br />
Closings for townhomes and duplexes had the smallest decline <strong>of</strong> the new attached market. There were 559 closings<br />
recorded, down 20% from 699 closings last year. Norfolk<br />
had the largest percent decline year over year, down<br />
32.8% to 43 closings. Only Newport News and the City<br />
<strong>of</strong> Williamsburg had small increases in the number <strong>of</strong> closings.<br />
Newport News closings increased 11.1% to 50<br />
recorded closings and the City <strong>of</strong> Williamsburg increased<br />
75% to 21 closings for the year. Virginia Beach had the<br />
largest number <strong>of</strong> townhome/duplex closings with 152<br />
recorded, 27.1% <strong>of</strong> the market.<br />
The 2010 top townhome/duplex community in<br />
<strong>Hampton</strong> <strong>Roads</strong> for permits was Meridian Parkside by<br />
HHHunt Homes in Newport News with 33 permits issued.<br />
For closings, the top community was Lakeside Cove at Sajo<br />
Farms in Virginia Beach by Terry·Peterson Residential with<br />
26 townhome closings. The Terry·Peterson units had an<br />
average price <strong>of</strong> $378,090, an average size <strong>of</strong> 2,562 square<br />
feet, and a price per square foot <strong>of</strong> $147.72.<br />
Ryan Homes had the largest number <strong>of</strong> townhome<br />
GRAPH VI<br />
23%<br />
Townhome/<br />
Duplex<br />
10%<br />
Multi-Plex<br />
6%<br />
Multi-Story<br />
New Construction Closings<br />
Product Mix 2010<br />
61%<br />
Single Family<br />
Detached<br />
and duplex permits issued in <strong>Hampton</strong> <strong>Roads</strong> during 2010. They had 70 permits issued across three communities on the<br />
Peninsula: Liberty Crossing, Whitehall, and Riverwalk Townes. Chesapeake Homes was the top builder for closings <strong>of</strong> townhomes<br />
and duplexes. The builder closed 74 units during the year, with a large percentage <strong>of</strong> the closings occurring in Nichols<br />
Park at Lexington in Virginia Beach. The community had 22 closings in 2010 with an average price <strong>of</strong> $287,905.<br />
AGE RESTRICTED COMMUNITIES<br />
There are currently 13 age restricted communities in <strong>Hampton</strong> <strong>Roads</strong>. During 2010 these communities were issued a<br />
total <strong>of</strong> 205 permits, an increase <strong>of</strong> 14.5% compared to 2009. There were 172 closings recorded, up 33.3% from 2009. This<br />
yields an absorption rate <strong>of</strong> 14.3 closings per month and an average <strong>of</strong> one closing per month per community. Based on the<br />
2010 closing pace and an estimated inventory <strong>of</strong> 130 units, there is a nine month supply.<br />
The top age restricted community in <strong>Hampton</strong> <strong>Roads</strong> was Colonial Heritage in James City County by the Lennar<br />
Corporation. There were 81 permits issued. The 68 closings recorded during 2010 consisted <strong>of</strong> 48 detached homes with an<br />
average price <strong>of</strong> $342,991 and 20 attached homes with an average price <strong>of</strong> $241,306.<br />
TOTAL MARKET NUMBERS<br />
For all housing types in the for-sale market, new residential permits are up 6.7% from 2009. The Southside areas accounted<br />
for 65% and the Peninsula accounted for 35%. Closings were down 13.1% year over year, with 2,409 new residential<br />
construction closings recorded. The Southside areas closed 1,686 homes or 70% <strong>of</strong> the market, while the Peninsula closed<br />
723 new homes.<br />
The average price for new construction homes in <strong>Hampton</strong> <strong>Roads</strong> was $319,896, a slight decline <strong>of</strong> 0.56% from 2009.<br />
The average price on the Southside was $329,627, down 1% and on the Peninsula the average price was $297,204 up 1.8%.<br />
The top builders for 2010 in <strong>Hampton</strong> <strong>Roads</strong> were The Dragas Companies, Ryan Homes and Chesapeake Homes. In<br />
terms <strong>of</strong> permits, Dragas was number one with 235 permits, followed by Ryan Homes with 159 and Chesapeake Homes with<br />
121. In terms <strong>of</strong> closings, Dragas was number one with 165 closings recorded, followed by Chesapeake with 137 and Ryan<br />
with 127. In terms <strong>of</strong> volume, Chesapeake Homes is number one with $38,690,774, followed by Ryan with $37,088,187 and<br />
Dragas with $33,790,273.<br />
57<br />
<strong>2011</strong> RESIDENTIAL
TABLE II<br />
Southside Top Subdivisions<br />
Ranked by Permits<br />
TABLE III<br />
Peninsula Top Subdivisions<br />
Ranked by Permits<br />
No. <strong>of</strong><br />
Permits<br />
# Community Builder Issued<br />
1 Kings Pointe, C Dragas Companies 72<br />
2 Southmoor, V Dragas Companies 66<br />
3 Sajo Farm, V Terry•Peterson Res 59<br />
& Napolitano Ent<br />
4 Brighton Park, C Dragas Companies 50<br />
5 Sherwood Lakes, V HAV Inc & HBD Build 47<br />
5 Oakbrooke Crossing, C Dragas Companies 47<br />
6 Culpepper Landing, C Various Builders 37<br />
7 Harbour Breeze <strong>Estate</strong>s, C Beco Homes, Ashdon Builders 34<br />
7 Woodbridge Point, V Various Builders 34<br />
8 East Beach, N Various Builders 33<br />
9 Heritage Park, V Various Builders 32<br />
10 Warrington Hall, C W H Builders & Corinth Homes 29<br />
No. <strong>of</strong><br />
Permits<br />
# Community Builder Issued<br />
1 Colonial Heritage, J Lennar Corp 81<br />
2 Whitehall, J Ryan Homes & 48<br />
HHHunt Homes<br />
3 Fords Colony, J Various Builders 34<br />
4 Hampshire Glen, H Various Builders 33<br />
4 Meridian at Parkside, NN HHHunt Homes 33<br />
4 Colonial Crossing, NN Moody Homes 33<br />
5 Orcutt Avenue, NN NN Redev & Hous Auth 30<br />
6 Village at Quarterpath, W Royal Dominion Homes 29<br />
7 Old Point, H North Shore Constr 27<br />
8 New Town, J GCR Inc & Atlantic Homes 26<br />
8 Riverwalk Townes, Y Ryan Homes 26<br />
9 Greensprings West, J Various Builders 25<br />
TABLE IV<br />
Southside Top Subdivisions<br />
Ranked by Closings<br />
TABLE V<br />
Peninsula Top Subdivisions<br />
Ranked by Closings<br />
No. <strong>of</strong><br />
Permits Average<br />
# Community Builder Issued Price<br />
1 Brighton Park, C Dragas Companies 71 $207,549<br />
2 Sajo Farm, V Terry•Peterson Res 60 $400,295<br />
& Napolitano Ent<br />
3 Southmoor, V Dragas Companies 55 $176,602<br />
4 Sherwood Lakes, V HAV Inc & HBD Build 42 $425,940<br />
5 Culpepper Various Builders 37 $339,961<br />
Landing, C<br />
6 Woodbridge Various Builders 33 $383,148<br />
Point, V<br />
7 East Beach, N Various Builders 32 $558,127<br />
8 Grassland Farms, V Pace Constr & Dev 29 $314,800<br />
9 Parkside, S Chesapeake Homes 27 $329,380<br />
9 Harbour Breeze Beco Homes,<br />
<strong>Estate</strong>s, C Ashdon Builders 27 $285,792<br />
10 Heritage Park, V Various Builders 26 $571,805<br />
10 <strong>Hampton</strong> <strong>Roads</strong> Terry•Peterson Res 26 $232,426<br />
Crossing, S<br />
No. <strong>of</strong><br />
Permits Average<br />
# Community Builder Issued Price<br />
1 Colonial Heritage, J Lennar Corp 68 $313,084<br />
2 Whitehall, J Ryan Homes & 37 $263,230<br />
HHHunt Homes<br />
3 Colonial Crossing, Moody Homes 32 $170,418<br />
NN<br />
4 Hampshire Glen, H Various Builders 26 $316,552<br />
4 Michelle Point, J Health E Community 26 $200,450<br />
5 Liberty Crossing, J Ryan Homes 23 $226,259<br />
6 New Town, J GCR Inc & Atlantic Homes22 $271,009<br />
7 Village at Royal Dominion Homes 21 $274,654<br />
Quarterpath, W<br />
7 Riverwalk Townes, Y Ryan Homes 21 $243,761<br />
8 Fenwick Hills, J Affordable Homes 20 $282,983<br />
& Ryan Homes<br />
9 Stonehouse, J Various Builders 19 $413,705<br />
9 Highgrove, Y Centex Homes 19 $262,481<br />
<strong>2011</strong> <strong>Hampton</strong> <strong>Roads</strong> <strong>Real</strong> <strong>Estate</strong> <strong>Market</strong> <strong>Review</strong><br />
58
<strong>2011</strong> R E S I D E N TIAL<br />
TABLE VI<br />
Top <strong>Hampton</strong> <strong>Roads</strong> Builders<br />
By Permits Issued, Closings Recorded & Total Revenue<br />
Permits Issued<br />
Closings<br />
# Of Closings Total Revenue<br />
Builder Permits Issued Builder Closings Builder Total Volume<br />
Recorded<br />
1 DRAGAS COMPANIES ........................235 1 DRAGAS COMPANIES . . . . . . . . . . 165 1 CHESAPEAKE HOMES . . . . . . 38,690,774<br />
2 RYAN HOMES ....................................159 2 CHESAPEAKE HOMES . . . . . . . . . . 137 2 RYAN HOMES . . . . . . . . . . . . 37,088,187<br />
3 CHESAPEAKE HOMES........................121 3 RYAN HOMES . . . . . . . . . . . . . . . . 127 3 DRAGAS COMPANIES . . . . . . 33,790,273<br />
4 LENNAR CORP.....................................81 4 TERRY/PETERSON RES . . . . . . . . . . 93 4 TERRY/PETERSON RES . . . . . 29,897,051<br />
5 TERRY/PETERSON RES ........................80 5 LENNAR CORP. . . . . . . . . . . . . . . . . 68 5 NAPOLITANO ENT INC . . . . . . 21,733,046<br />
6 HHHUNT HOMES .................................79 6 FRANCISCUS CO INC . . . . . . . . . . . . 63 6 LENNAR CORP. . . . . . . . . . . . 21,289,686<br />
7 NAPOLITANO ENT INC ..........................70 7 NAPOLITANO ENT INC . . . . . . . . . . . 58 7 MCQ BLDRS & DEV INC. . . . . 15,973,000<br />
8 FRANCISCUS CO INC...........................59 8 MCQ BLDRS & DEV INC. . . . . . . . . . 52 8 HOME ASSOCIATES OF VA . . . 15,186,501<br />
9 MCQ BLDRS & DEV INC.......................55 9 HEARNDON CONSTR CORP . . . . . . . 49 9 FRANCISCUS CO INC. . . . . . . 15,113,268<br />
10 BECO CONSTRUCTION INC ..................53 10 HHHUNT HOMES . . . . . . . . . . . . . . . 47 10 HEARNDON CONSTR CORP . . 14,324,785<br />
11 HOME ASSOCIATES OF VA....................49 11 L L BLDG CORP . . . . . . . . . . . . . . . . 45 11 HHHUNT HOMES . . . . . . . . . . 14,214,790<br />
12 ASHDON BUILDERS INC ......................41 12 PACE CONSTR & DEV CORP . . . . . . . 44 12 AINSLIE GROUP INC. . . . . . . . 12,953,106<br />
13 VILLA DEVELOPMENT...........................40 13 MOODY DEV CORP. . . . . . . . . . . . . . 41 13 PACE CONSTR & DEV CORP . . 12,546,010<br />
13 MOODY DEV CORP...............................40 14 CENTEX HOMES. . . . . . . . . . . . . . . . 36 14 L L BLDG CORP . . . . . . . . . . . 12,171,239<br />
14 CENTEX HOMES...................................38 15 HOME ASSOCIATES OF VA . . . . . . . . 35 15 BISHARD DEV CORP . . . . . . . 11,338,119<br />
15 PACE CONSTR & DEV CORP.................31 16 BISHARD DEV CORP . . . . . . . . . . . . 34 16 CENTEX HOMES. . . . . . . . . . . 10,457,531<br />
15 BISHARD DEV CORP............................31 17 VILLA DEVELOPMENT . . . . . . . . . . . . 31 17 VILLA DEVELOPMENT. . . . . . . 10,334,252<br />
16 STEPHEN ALEXANDER HOMES.............30 17 BECO CONSTRUCTION INC. . . . . . . . 31 18 ASHDON BUILDERS INC. . . . . . 9,612,781<br />
16 HEARNDON CONSTR CORP..................30 17 AINSLIE GROUP INC. . . . . . . . . . . . . 31 19 TERRY INDUSTRIES . . . . . . . . . 9,497,743<br />
16 ROYAL DOMINION HOMES ...................30 18 HEALTH E COMMUNITY ENT INC . . . . 27 20 SADLER BLDG CORP . . . . . . . . 9,483,154<br />
16 L L BLDG CORP....................................30 19 ETHERIDGE CONSTRUCTION. . . . . . . 26 21 L R HILL CUSTOM BLDR . . . . . . 8,904,378<br />
16 NORTH SHORE CONSTR CO.................30 20 SADLER BLDG CORP . . . . . . . . . . . . 25 22 STEPHEN ALEXANDER<br />
16 N N REDEV & HOUSING AUTH .............30 20 VIRGINIA ENT INC . . . . . . . . . . . . . . 25 HOMES INC . . . . . . . . . . . . . . . 8,666,366<br />
17 SUMMIT CONSTR CORP.......................27 21 ASHDON BUILDERS INC. . . . . . . . . . 24 23 SUMMIT CONSTR CORP . . . . . . 8,554,163<br />
18 SADLER BLDG CORP ...........................26 21 TERRY INDUSTRIES . . . . . . . . . . . . . 24 24 ETHERIDGE CONSTRUCTION. . . 8,320,925<br />
18 CMH HOMES INC.................................26 21 ASSOCIATED CONTR SVC INC. . . . . . 24 25 VIRGINIA ENT INC . . . . . . . . . . 7,973,880<br />
59<br />
26 BECO CONSTRUCTION INC. . . . 7,937,710<br />
<strong>2011</strong> RESIDENTIAL
EXISTING HOMES<br />
The existing residential real estate<br />
market in <strong>Hampton</strong> <strong>Roads</strong> experienced<br />
early highs, a sharp fall, and ended with<br />
signs <strong>of</strong> stabilizing and promise upon the<br />
horizon. The federal first-time homebuyer’s<br />
tax credit spawned a rush <strong>of</strong> home<br />
purchases during the first third <strong>of</strong> the year.<br />
But, once the tax credit expired, the existing<br />
home real estate market dropped<br />
sharply as the sting <strong>of</strong> sales being pulled<br />
forward was felt. Once the brunt <strong>of</strong> displaced<br />
sales was tamed, the market began<br />
to stabilize and ended with a key leading indicator<br />
pointing towards better sales activity<br />
in the near future.<br />
The number <strong>of</strong> existing homes actively<br />
for sale in the <strong>Hampton</strong> <strong>Roads</strong> region declined<br />
by 2.6%, as measured at the end <strong>of</strong><br />
the year, when compared to 2009. At the<br />
end <strong>of</strong> 2009, there were 10,077 existing homes for sale, but the active market fell to 9,809 existing homes for sale<br />
at the end <strong>of</strong> 2010. The continuing high<br />
amount <strong>of</strong> existing homes for sale, combined<br />
with the decline in the number <strong>of</strong><br />
closings, pushed the months’ supply <strong>of</strong> inventory<br />
in the <strong>Hampton</strong> <strong>Roads</strong> region to<br />
10.9 months. This change represents an<br />
increase <strong>of</strong> two months when compared<br />
to the months’ supply measured at the<br />
end <strong>of</strong> 2009.<br />
Distressed homes, those that are<br />
bank owned or short sales, comprised between<br />
17% and 25% <strong>of</strong> the active existing<br />
homes for sale in the region throughout the year. The monthly percentage distressed homes comprised <strong>of</strong> the total<br />
existing active market in 2010 was larger than any individual month during 2009 when the measure peaked at 16%<br />
in December 2009. The average percentage distressed homes comprised <strong>of</strong> the active existing market each month<br />
in 2009 was 13%, whereas in 2010, the average percentage climbed to 20% each month and peaked in December<br />
at 25% <strong>of</strong> the existing active market in the region.<br />
Distressed homes also continued to affect the market correction process as they increased as both a percentage<br />
<strong>of</strong> existing homes for sale and those that closed in 2010. For the year, distressed homes comprised 25.8% <strong>of</strong> existing<br />
residential closings. On a monthly basis, the percentage <strong>of</strong> closings that were distressed ranged from 21% to<br />
35% per month throughout 2010. The total number <strong>of</strong> existing distressed home closings in 2010 was up 28% to<br />
3,634 when compared to the 2,828 that closed in 2009. These distressed home sales had a negative impact on the<br />
median sale price <strong>of</strong> existing homes in the region by pulling it lower due to the median sale price <strong>of</strong> existing distressed<br />
homes for 2010 being $150,000, which is $70,000 lower than the median sale price for existing non-distressed<br />
homes. At $220,000, the median sale price <strong>of</strong> non-distressed homes saw a $5,000 increase from 2009. The median<br />
sale price <strong>of</strong> existing distressed homes dropped 9% from 2009 and negated the 2.3% gain in median sale price<br />
<strong>of</strong> non-distressed existing homes that closed in 2010.<br />
The federal first-time home-buyer’s tax credit spawned a rush<br />
<strong>of</strong> home purchases during the first third <strong>of</strong> the year. But, once<br />
the tax credit expired, the existing home real estate market<br />
dropped sharply as the sting <strong>of</strong> sales being pulled forward was<br />
felt. Once the brunt <strong>of</strong> displaced sales was tamed, the market<br />
began to stabilize and ended with a key leading indicator<br />
pointing towards better sales activity in the near future.<br />
<strong>2011</strong> <strong>Hampton</strong> <strong>Roads</strong> <strong>Real</strong> <strong>Estate</strong> <strong>Market</strong> <strong>Review</strong><br />
60
<strong>2011</strong> R E S I D E N TIAL<br />
25,000<br />
20,000<br />
15,000<br />
10,000<br />
5,000<br />
0<br />
16,612<br />
18,430<br />
19,604<br />
20,881<br />
$130,000<br />
$109,900 $117,050<br />
$99,999<br />
$51,000 $53,800 $55,200<br />
$49,300<br />
5,538<br />
4,873<br />
3,831<br />
2,801<br />
23,209<br />
24,207<br />
$194,500<br />
$157,900<br />
$215,000<br />
$224,900 $219,900<br />
$208,000<br />
$205,000<br />
$65,100 $67,900 $68,200<br />
$60,300<br />
$56,600 $59,100<br />
$64,199<br />
2,015<br />
2,093<br />
4,313<br />
6,982<br />
9,055<br />
10,077<br />
9,809<br />
2000 2001 2002 2003 2004 2005 2006 2007 2008 2009 2010<br />
Existing Active Homes for Sale Existing Home Closings Median Sale Price Household Median Income<br />
21,890<br />
18,572<br />
14,517<br />
15,526<br />
14,265<br />
$250,000<br />
$200,000<br />
$150,000<br />
$100,000<br />
$50,000<br />
$0<br />
The 2010 median sale price <strong>of</strong> all existing homes in the <strong>Hampton</strong> <strong>Roads</strong> region was $205,000, a 1.4% decline<br />
from 2009. The average sale price <strong>of</strong> all existing homes was relatively flat at $231,552, down 0.7% from 2009. The<br />
drops in both median and average sales prices were smaller than forecasted at the beginning <strong>of</strong> the year despite<br />
the average sale price to list price ratio remaining steady at 96% in 2010 from 2009. Only attached existing home<br />
sales experienced a slight decline in average sale price to list price ratio from 97% in 2009 to 96% in 2010.<br />
Williamsburg showed the only significant increase in the sale price to final list price ratio for individual cities<br />
and counties. Williamsburg’s percentage increased from 94% in 2009 to 96% in 2010. Mathews County and Isle<br />
<strong>of</strong> Wight County also showed gains in the sale price to list price ratio in addition to Williamsburg, though each was<br />
less than one percent. At the other end <strong>of</strong> the spectrum, <strong>Hampton</strong> and Portsmouth showed the largest declines,<br />
1.9% and 1.4% respectively. The majority <strong>of</strong> municipalities were relatively flat with the sale price to list price ratio<br />
each dropping less than one percent in 2010 from 2009.<br />
James City County had the highest median existing home sale price at $295,000 in 2010, down from a me-<br />
61<br />
<strong>2011</strong> RESIDENTIAL
100<br />
90<br />
80<br />
70<br />
60<br />
50<br />
40<br />
30<br />
20<br />
10<br />
0<br />
Average Days on the <strong>Market</strong><br />
84<br />
87 87<br />
69<br />
66<br />
61<br />
46<br />
48<br />
36<br />
27 28<br />
2000 2001 2002 2003 2004 2005 2006 2007 2008 2009 2010<br />
Existing <strong>Real</strong> <strong>Estate</strong> Closings<br />
2,500<br />
2,000<br />
Distressed Closings Closings % <strong>of</strong> Distressed Closings<br />
40%<br />
35%<br />
30%<br />
1,500<br />
25%<br />
1,000<br />
20%<br />
15%<br />
500<br />
10%<br />
5%<br />
0<br />
0%<br />
JAN<br />
09<br />
FEB<br />
09<br />
MAR<br />
09<br />
APR<br />
09<br />
MAY<br />
09<br />
JUN<br />
09<br />
JUL<br />
09<br />
AUG<br />
09<br />
SEP<br />
09<br />
OCT<br />
09<br />
NOV<br />
09<br />
DEC<br />
09<br />
JAN<br />
10<br />
FEB<br />
10<br />
MAR<br />
10<br />
APR<br />
10<br />
MAY<br />
10<br />
JUN<br />
10<br />
JUL<br />
10<br />
AUG<br />
10<br />
SEP<br />
10<br />
OCT<br />
10<br />
NOV<br />
10<br />
DEC<br />
10<br />
<strong>2011</strong> <strong>Hampton</strong> <strong>Roads</strong> <strong>Real</strong> <strong>Estate</strong> <strong>Market</strong> <strong>Review</strong><br />
62
<strong>2011</strong> R E S I D E N TIAL<br />
dian <strong>of</strong> $301,900 in 2009. For 2010, only Chesapeake and Surry County experienced rising median sale prices for existing homes <strong>of</strong><br />
significance, 2% and 29% respectively. Only two other areas avoided drops in median sale prices, Virginia Beach and Isle <strong>of</strong> Wight<br />
County. The median sale price in Virginia Beach was flat year-over-year at $230,000 and Isle <strong>of</strong> Wight County had a slight increase<br />
<strong>of</strong> 0.4%, otherwise all <strong>of</strong> the local cities and counties had median price declines when compared to 2009. Portsmouth and Mathews<br />
County experienced the largest declines in median sale prices <strong>of</strong> existing homes, 10% and 19% respectively.<br />
The average number <strong>of</strong> days a home spent on the active market for sale, or market time, for existing homes that closed in 2010<br />
in the <strong>Hampton</strong> <strong>Roads</strong> region was 87 days, the same as in 2009. This was the first year without an increase since 2004. The stabilizing<br />
<strong>of</strong> this measure may signify a leveling and strength in the real estate market, but the statistic is susceptible to manipulation and<br />
may not be truly indicative <strong>of</strong> the time it takes to sell a home. For instance, when the same measure is taken for all existing homes<br />
that exit the active market (i.e. the home becomes no longer for sale due to closing, listing expiration, contract fall through, or the listing<br />
is withdrawn from the active market) the average number <strong>of</strong> days on market was 128 for 2010, whereas it was 125 days for 2009,<br />
much larger than the market time <strong>of</strong> only those homes that closed.<br />
Detached homes accounted for 79% <strong>of</strong> all existing home closings in 2010, up 2% from 2009. The number <strong>of</strong> closings was down<br />
7% for detached existing homes in 2010 when compared to 2009. The median sale price for detached homes in 2010 was $220,000,<br />
down 2.2% from 2009’s measure. The Southside’s cities and counties comprised 72% <strong>of</strong> all the existing detached home closings in<br />
2010. Virginia Beach had the highest percentage, 26%, for any single city or county for the <strong>Hampton</strong> <strong>Roads</strong> region.<br />
Existing Homes Median Sale Prices<br />
$350,000<br />
$300,000<br />
$250,000<br />
$200,000<br />
$150,000<br />
$225,500<br />
$230,000<br />
$232,500<br />
$213,750<br />
$200,000<br />
$198,350<br />
$169,250<br />
$155,000<br />
$254,950<br />
$256,000<br />
$301,900<br />
$295,000<br />
$265,000<br />
$215,000<br />
$183,900<br />
$172,250<br />
$175,000<br />
$164,900<br />
$293,700<br />
$270,000<br />
$150,500<br />
$135,000<br />
$230,000<br />
$214,800<br />
$135,000<br />
$173,500<br />
$230,000<br />
$230,000<br />
$229,000<br />
$215,500<br />
$290,000<br />
$279,000<br />
$100,00<br />
$50,000<br />
$0<br />
CHES<br />
CURR<br />
GLOC<br />
HAMP<br />
IWC<br />
JCC<br />
MATC<br />
NNEW<br />
NORF<br />
POQ<br />
2009 Median SP 2010 Median SP<br />
PORT<br />
SUFF<br />
SURC<br />
VBCH<br />
WMBG<br />
YORK<br />
<strong>2011</strong> RESIDENTIAL<br />
63
As for attached homes, the median sale price <strong>of</strong> existing homes that closed in<br />
2010 was $165,900, a drop <strong>of</strong> 2.4% from 2009. Existing attached home closings<br />
were down 17% when compared to 2009. As with detached existing homes, the majority<br />
<strong>of</strong> attached existing homes were sold in the Southside cities and counties, 80%.<br />
Virginia Beach comprised 55% <strong>of</strong> all the attached existing home closings in the<br />
<strong>Hampton</strong> <strong>Roads</strong> region and 68% <strong>of</strong> the attached existing home closings on the Southside.<br />
Looking forward, early <strong>2011</strong> existing real estate closings show promise. This is<br />
based, in part, by the rise <strong>of</strong> homes under contract in December 2010. The number<br />
<strong>of</strong> homes that go under contract during a month is <strong>of</strong>ten referred to as a key leading<br />
indicator <strong>of</strong> the real estate market. In December 2010, the <strong>Hampton</strong> <strong>Roads</strong> region<br />
experienced a 1.8% increase over December 2009. Though not all <strong>of</strong> these homes<br />
will likely become closed existing home sales, the majority will and that should translate<br />
into the beginnings <strong>of</strong> growth in the residential real estate market for <strong>Hampton</strong><br />
<strong>Roads</strong> in <strong>2011</strong>.<br />
Closings By Type and City<br />
City/ DET DET ATT ATT<br />
County Sold Sold % Sold Sold % Total Total %<br />
2009 2010 Change 2009 2010 Change 2009 2010 Change<br />
CHES 1817 1804 -0.72% 438 333 -23.97% 2255 2137 -5.23%<br />
CURR 26 26 0.00% 0 0 N/A 26 26 0.00%<br />
GLOC 243 209 -13.99% 3 7 133.33% 246 216 -12.20%<br />
HAMP 1080 941 -12.87% 156 118 -24.36% 1236 1059 -14.32%<br />
IWC 215 195 -9.30% 21 32 52.38% 236 227 -3.81%<br />
JCC 344 359 4.36% 79 76 -3.80% 423 435 2.84%<br />
MATC 27 19 -29.63% 0 0 N/A 27 19 -29.63%<br />
NNEW 1312 1098 -16.31% 346 232 -32.95% 1658 1330 -19.78%<br />
NORF 1598 1507 -5.69% 247 206 -16.60% 1845 1713 -7.15%<br />
POQ 66 67 1.52% 4 10 150.00% 70 77 10.00%<br />
PORT 863 819 -5.10% 125 104 -16.80% 988 923 -6.58%<br />
SUFF 766 684 -10.70% 107 81 -24.30% 873 765 -12.37%<br />
SURC 19 24 26.32% 0 0 N/A 19 24 26.32%<br />
VBCH 3162 2979 -5.79% 1878 1617 -13.90% 5040 4596 -8.81%<br />
WMBG 32 32 0.00% 16 23 43.75% 48 55 14.58%<br />
YORK 397 342 -13.85% 140 112 -20.00% 537 454 -15.46%<br />
<strong>2011</strong> <strong>Hampton</strong> <strong>Roads</strong> <strong>Real</strong> <strong>Estate</strong> <strong>Market</strong> <strong>Review</strong><br />
64
<strong>2011</strong> R E S I D E N TIAL<br />
About the Data:<br />
The underlying data the resale home closing statistics are based upon is the collection<br />
<strong>of</strong> those closings belonging to <strong>Real</strong> <strong>Estate</strong> Information Network, Inc. (REIN) members<br />
only. The data for each sales transaction was input by hand and therefore may<br />
contain some errors at the individual home sale level. But, as a collection, this data represents<br />
the timeliest and most accurate dataset <strong>of</strong> resale homes for the entire <strong>Hampton</strong><br />
<strong>Roads</strong> region.<br />
The strength <strong>of</strong> the data set lies within its proximity to origin and depth. The MLS<br />
(Multiple Listing Service) data is considered the deepest <strong>of</strong> any resale home database<br />
due to the sheer number <strong>of</strong> rich data fields within the database and the information contained<br />
within. The information is also being keyed by either the actual listing agent or<br />
administrative staff <strong>of</strong> the same real estate firm. The combination <strong>of</strong> these two key elements<br />
allows the MLS data to be more precise than many other information repositories<br />
and vastly timelier.<br />
But, MLS data does have weaknesses. Most notably is the portion <strong>of</strong> the dataset at<br />
the edges <strong>of</strong> the MLS’s boundaries. Usually, MLS membership wanes around the borders<br />
<strong>of</strong> the coverage area, due to overlapping MLSes. In such overlap areas, any given<br />
real estate broker may choose to join only one <strong>of</strong> the two or more MLSes that cover the<br />
particular area. For the local MSA and the region covered by REIN, this translates into<br />
less than ideal accountability for sales in North Carolina, Northern Neck areas <strong>of</strong> Virginia,<br />
and the Williamsburg area.<br />
As for REIN, it is an independent MLS owned by broker stockholder members. Currently,<br />
there are approximately 485 real estate firms with over 6,100 real estate agents<br />
serving the entire <strong>Hampton</strong> <strong>Roads</strong> region.<br />
65<br />
<strong>2011</strong> RESIDENTIAL
To Franklin and<br />
Southampton<br />
Residential Submarkets (New Construction)<br />
Residential Submarkets (Existing Homes)<br />
Southside<br />
Chesapeake.<br />
Franklin/Southampton<br />
Isle <strong>of</strong> Wight Co<br />
Norfolk<br />
Portsmouth<br />
Suffolk<br />
Virginia Beach<br />
Peninsula<br />
Gloucester<br />
<strong>Hampton</strong><br />
James City County<br />
Newport News<br />
York County<br />
Southside<br />
Chesapeake<br />
Currituck<br />
Isle <strong>of</strong> Wight Co<br />
Matthews<br />
Norfolk<br />
Portsmouth<br />
Suffolk<br />
Surry<br />
Virginia Beach<br />
Peninsula<br />
Gloucester<br />
<strong>Hampton</strong><br />
James City County<br />
Newport News<br />
York County
MULTI-FAMILY<br />
<strong>2011</strong><br />
HAMPTON ROADS<br />
REAL ESTATE<br />
MARKET REVIEW<br />
Author<br />
Data Analysis/<br />
Layout<br />
Financial<br />
Support<br />
Disclosure<br />
Charles Dalton<br />
<strong>Real</strong> Data<br />
The E. V. Williams Center for <strong>Real</strong> <strong>Estate</strong> and Economic<br />
Development (CREED) functions and reports are<br />
funded by donations from individuals, organizations<br />
and the CREED Council.<br />
The data used for this report are deemed reliable; however,<br />
neither Old Dominion University, the E. V. Williams Center for<br />
<strong>Real</strong> <strong>Estate</strong> and Economic Development, nor sponsoring<br />
companies and/or individuals makes any representation or<br />
warranty as to its accuracy.<br />
67<br />
<strong>2011</strong> MULTI-FAMILY
General Overview<br />
The Virginia Beach-Norfolk-Newport News Apartment Report,<br />
published by <strong>Real</strong> Data, is a detailed analysis <strong>of</strong> the rental market<br />
within conventional apartment communities in the <strong>Hampton</strong> <strong>Roads</strong> region.<br />
The area has been divided into nine submarkets: Chesapeake, <strong>Hampton</strong>,<br />
Newport News, Norfolk, Portsmouth, Suffolk, Virginia Beach,<br />
Williamsburg and York. Combined, these areas contain a survey base <strong>of</strong><br />
over 92,000 units within conventional apartment communities <strong>of</strong> 50 or<br />
more units each.<br />
The Virginia Beach-Norfolk-Newport News market is divided into two<br />
portions by the James River. The Peninsula area is north <strong>of</strong> the James<br />
River and contains <strong>Hampton</strong>, Newport News, Williamsburg and York. The<br />
Southside area is south <strong>of</strong> the James River and contains Chesapeake,<br />
Norfolk, Portsmouth, Suffolk and Virginia Beach. The cities with the<br />
highest concentration <strong>of</strong> units are Virginia Beach and Newport News,<br />
which accounts for nearly one half <strong>of</strong> the region’s apartment units.<br />
Like the rest <strong>of</strong> the country, the <strong>Hampton</strong> <strong>Roads</strong> apartment market<br />
weakened in 2008 and 2009 as the housing bubble collapsed and the<br />
economy entered into a recession. Occupancy rates fell to their lowest level in over ten years in the first quarter <strong>of</strong><br />
2009 and rent growth was stagnant for most <strong>of</strong> 2008 and 2009. Since that time, occupancies have steadily improved<br />
with average occupancy rising to 94.7% in the fourth quarter <strong>of</strong> 2010. The turnaround is due to strengthening demand<br />
for rentals in lieu <strong>of</strong> home ownership and a limited development<br />
pipeline which has kept supply in check.<br />
Submarket Percentages<br />
Development activity remains moderate. As <strong>of</strong> October 2010,<br />
2%<br />
there were only 1,100 units under construction; however, there were<br />
4%<br />
York County<br />
more than 4,000 units proposed. Many <strong>of</strong> the proposed projects are<br />
Williamsburg 11%<br />
struggling to obtain financing in the current lending environment even<br />
1%<br />
Chesapeake<br />
Suffolk<br />
though market fundamentals look favorable through 2012.<br />
The average quoted rental rate is $900, with one-bedroom rents 25%<br />
Virginia<br />
averaging $803 per month, two-bedroom units averaging $905 per<br />
Beach<br />
month, and three-bedroom units reporting an average rental rate <strong>of</strong><br />
$1,080 per month. Average rental rates from existing inventory<br />
increased by $15.48 in the last twelve months, while this is a modest<br />
increase over last year, it does indicate an improving market in terms<br />
8%<br />
<strong>of</strong> rent growth. Approximately 20% <strong>of</strong> rental communities are <strong>of</strong>fering<br />
Portsmouth<br />
some type <strong>of</strong> rental concessions, but in terms <strong>of</strong> the market as a whole,<br />
14%<br />
the concessions are only moderate with overall rents rising.<br />
Norfolk<br />
11%<br />
<strong>Hampton</strong><br />
23%<br />
Newport<br />
News<br />
<strong>2011</strong> <strong>Hampton</strong> <strong>Roads</strong> <strong>Real</strong> <strong>Estate</strong> <strong>Market</strong> <strong>Review</strong><br />
68
<strong>2011</strong> M U LTI-FAMILY<br />
HISTORICAL APARTMENT DEVELOPMENT<br />
Virginia Beach-Norfolk-Newport News<br />
Development <strong>of</strong> apartment units in this market peaked during two<br />
time periods, the early 1970s and the late 1980s. Although current development<br />
activity is being slowed by tighter lending restrictions, there are more<br />
than 5,000 units in some level <strong>of</strong> planning, many <strong>of</strong> which are waiting to secure<br />
financing.<br />
TABLE I<br />
Historical Apartment Development<br />
25,000<br />
20,000<br />
Number <strong>of</strong> Units<br />
15,000<br />
10,000<br />
5,000<br />
0<br />
Pre-‘64 ‘65-‘69 ‘70-‘74 ‘75-‘79 ‘80-‘84 ‘85-‘89 ‘90-‘94 ‘95-‘99 ‘00-‘04 ‘05- ‘09 ‘10-‘11<br />
69<br />
Year Built<br />
<strong>2011</strong> MULTI-FAMILY
HISTORICAL APARTMENT DEVELOPMENT<br />
Historical Multi-Family Building Permits<br />
Virginia Beach-Norfolk-Newport News<br />
Overall housing development in the region was at its peak from 2002-2006 with more than 10,000 total housing<br />
permits issued annually (single and multi-family combined). With the slowdown in the overall housing market, residential<br />
permits issued fell to 5,223 in 2009 which is less than half <strong>of</strong> the activity at the peak <strong>of</strong> the market in 2005.<br />
Based on single and multifamily permits issued year to date, the slowdown in new housing starts is expected to continue<br />
with less than 4,000 units permitted in 2010.<br />
Multi-family permit activity, which includes rental and for-sale units, was strongest in 2005. However, much <strong>of</strong><br />
the permit activity up until 2009 had not been rental apartments, but instead for-sale condominiums and townhouses,<br />
especially in recent years when a decline in interest rates made it easier for many people to get into the for-sale arena.<br />
It is expected that 2010 will record the lowest permit activity since 2000, although most <strong>of</strong> the permits in the last year<br />
are for rentals versus the for-sale market.<br />
TABLE II<br />
Annual Multi-Family Permit Activity<br />
Permits Issued<br />
3,200<br />
3,000<br />
2,800<br />
2,600<br />
2,400<br />
2,200<br />
2,000<br />
1,800<br />
1,600<br />
1,400<br />
1,200<br />
1,000<br />
800<br />
600<br />
400<br />
200<br />
0<br />
1,102<br />
1,216<br />
1,384<br />
684<br />
1,519<br />
2,355<br />
2,292<br />
1997 1998 1999 2000 2001 2002 2003 2004 2005 2006 2007 2008 2009 2010<br />
(thru Nov.)<br />
2,339<br />
3,085<br />
1,159<br />
1,315<br />
1,811<br />
2,336<br />
848<br />
<strong>2011</strong> <strong>Hampton</strong> <strong>Roads</strong> <strong>Real</strong> <strong>Estate</strong> <strong>Market</strong> <strong>Review</strong><br />
70
<strong>2011</strong> M U LTI-FAMILY<br />
TABLE III<br />
Multi-Family Permits Issued – Past Year<br />
500<br />
Number <strong>of</strong> Permits<br />
400<br />
300<br />
200<br />
100<br />
325<br />
197<br />
20<br />
231<br />
151<br />
69<br />
132<br />
124<br />
70<br />
45<br />
67<br />
199<br />
0<br />
Nov.<br />
2009<br />
Dec.<br />
2009<br />
0<br />
Jan.<br />
2010<br />
Feb.<br />
2010<br />
Mar.<br />
2010<br />
Apr.<br />
2010<br />
May<br />
2010<br />
Jun.<br />
2010<br />
Jul.<br />
2010<br />
Aug.<br />
2010<br />
Sep.<br />
2010<br />
Oct.<br />
2010<br />
Nov.<br />
2010<br />
APARTMENT DEVELOPMENT ACTIVITY<br />
As <strong>of</strong> October 2010, there were only 1,106 apartment units under construction within eight communities in the Virginia<br />
Beach-Norfolk-Newport News market. There are an additional 4,100 apartment units proposed to start construction within the<br />
next year. Norfolk, Chesapeake, and <strong>Hampton</strong> are the most active areas for new apartment development with 11 communities<br />
either underway or in planning.<br />
TABLE IV Apartment Development Activity (October 2010)<br />
1,500<br />
1,400<br />
1,300<br />
1,200<br />
1,100<br />
Under Construction<br />
Proposed<br />
1,000<br />
Number <strong>of</strong> Units<br />
900<br />
800<br />
700<br />
600<br />
500<br />
400<br />
300<br />
200<br />
100<br />
0<br />
Chesapeake <strong>Hampton</strong> Newport News Norfolk Portsmouth Suffolk Virginia Beach Williamsburg York County<br />
<strong>2011</strong> MULTI-FAMILY
ABSORPTION<br />
Absorption is defined as the net change in occupied units. Therefore, positive absorption occurs when previously vacant<br />
or newly built dwellings become occupied. Based on historical performance, the Virginia Beach-Norfolk-Newport News area<br />
is expected to absorb between 600 and 900 units annually. The collapse <strong>of</strong> the housing markets nationwide and the weakening<br />
economy caused a significant drop in demand for all types <strong>of</strong> housing in 2008. The area experienced a surge in demand<br />
for rental units in 2009 and 2010. This was due in part to the difficulties in the for-sale housing market.<br />
TABLE V<br />
Absorption<br />
Units Absorbed (Demand)<br />
2000<br />
1800<br />
1600<br />
1400<br />
1200<br />
1000<br />
800<br />
600<br />
400<br />
200<br />
0<br />
-200<br />
-400<br />
-600<br />
-800<br />
2001 2002 2003 2004 2005 2006 2007 2008 2009 2010<br />
TABLE VI Submarket Absorption 2010<br />
700<br />
Absorption (Annual)<br />
600<br />
500<br />
400<br />
300<br />
200<br />
100<br />
0<br />
Chesapeake <strong>Hampton</strong> Newport News Norfolk Portsmouth Suffolk Virginia Beach Williamsburg York County<br />
<strong>2011</strong> <strong>Hampton</strong> <strong>Roads</strong> <strong>Real</strong> <strong>Estate</strong> <strong>Market</strong> <strong>Review</strong><br />
72
<strong>2011</strong> M U LTI-FAMILY<br />
VACANCY<br />
The overall vacancy rate for the Virginia Beach-Norfolk-Newport News market as <strong>of</strong> October 2010 was 5.7%, its lowest<br />
level since 2007. Vacancy rates are expected to remain in the 5-6% range in <strong>2011</strong>.<br />
TABLE VII<br />
Overall Vacancy<br />
Vacancy Rate (Annual)<br />
7.5<br />
7.0<br />
6.5<br />
6.0<br />
5.5<br />
5.0<br />
4.5<br />
4.0<br />
3.5<br />
3.0<br />
2.5<br />
2.0<br />
1.5<br />
1.0<br />
.5<br />
0<br />
2001 2002 2003 2004 2005 2006 2007 2008 2009 2010<br />
73<br />
<strong>2011</strong> MULTI-FAMILY
<strong>2011</strong> M U LTI-FAMILY<br />
Multi-Family Submarkets<br />
Southside<br />
Chesapeake<br />
Norfolk<br />
Portsmouth<br />
Suffolk<br />
Virginia Beach<br />
Williamsburg<br />
Peninsula<br />
<strong>Hampton</strong><br />
Newport News<br />
York County
Most submarkets saw an improvement in vacancy rates over the past year. Chesapeake, Norfolk, Portsmouth, Williamsburg,<br />
and Suffolk experienced the greatest improvement in vacancy rates. Newport News saw its vacancy rates rise due to weakened<br />
demand in the last year as a number <strong>of</strong> new communities came on-line.<br />
TABLE VIII<br />
Vacancy<br />
Rate<br />
9%<br />
8%<br />
7%<br />
6%<br />
5%<br />
4%<br />
3%<br />
2%<br />
1%<br />
0%<br />
Chesapeake <strong>Hampton</strong> Newport<br />
News<br />
Norfolk Portsmouth Suffolk Virginia<br />
Beach<br />
October 2009<br />
October 2010<br />
Williamsburg York County Overall<br />
RENTAL RATES<br />
As <strong>of</strong> October 2010, the average rental rate in Virginia Beach-Norfolk-Newport News was $900.<br />
TABLE IX Average Rental Rates (New & Existing Communities)<br />
$1000<br />
$900<br />
$800<br />
$700<br />
Average Rental Rate<br />
$600<br />
$500<br />
$400<br />
$300<br />
$200<br />
$100<br />
$0<br />
2001 2002 2003 2004 2005 2006 2007 2008 2009 2010<br />
<strong>2011</strong> <strong>Hampton</strong> <strong>Roads</strong> <strong>Real</strong> <strong>Estate</strong> <strong>Market</strong> <strong>Review</strong><br />
76
<strong>2011</strong> M U LTI-FAMILY<br />
AVERAGE RENTS<br />
Average overall rents ranged from a low <strong>of</strong> $806 in Newport News to a high <strong>of</strong> $997 in Chesapeake.<br />
Newport News, Portsmouth, Norfolk and Suffolk all reported rents lower than the average rent <strong>of</strong> $900<br />
per month, while <strong>Hampton</strong>, Williamsburg, York County, Virginia Beach and Chesapeake all reported<br />
rents higher than the average overall rent.<br />
TABLE X Average Rent by Submarket – October 2010<br />
$1000<br />
$900<br />
Average Rent (Lowest to Highest)<br />
$800<br />
$700<br />
$600<br />
$500<br />
$400<br />
$300<br />
$200<br />
$100<br />
$0<br />
Newport News Portsmouth Norfolk Suffolk Overall <strong>Hampton</strong> Williamsburg York County Virginia Beach Chesapeake<br />
77<br />
<strong>2011</strong> MULTI-FAMILY
MANAGEMENT<br />
There were over 470 conventional apartment communities with more than 50 units surveyed in the <strong>Hampton</strong> <strong>Roads</strong><br />
region in October. Of the 92,000 apartment units surveyed, the top five firms manage nearly one-third <strong>of</strong> these units.<br />
TABLE XI Top 10 Management Companies<br />
S.L. Nusbaum<br />
Great Atlantic<br />
Drucker & Falk<br />
Lawson Companies<br />
Breeden Management<br />
WMCI<br />
Kotarides Companies<br />
Ripley-Heatwole<br />
Harbor Group<br />
Perrel Management<br />
0% 1% 2% 3% 4% 5% 6% 7% 8% 9% 10%<br />
REGIONAL TRENDS<br />
Roanoke<br />
Roanoke has fewer than 10,000 conventional apartment units among communities <strong>of</strong> at least 30 units. Roanoke’s apartment<br />
market coped better than most markets during the past recession. This was due in large part to the fact that there<br />
has been minimal new apartment development in Roanoke over the past several years which has kept the rental supply at<br />
a manageable level. Occupancy rates in 2010 were 93.5% with rent growth <strong>of</strong> just under 2% for the year.<br />
Richmond<br />
Richmond has over 60,000 conventional apartment units within communities <strong>of</strong> at least 50 units. The area’s apartments<br />
hit bottom in the fourth quarter <strong>of</strong> 2009 and first quarter <strong>of</strong> 2010 when occupancies fell to 90% and rents declined by<br />
3.5% for the year. Since that time Richmond has seen a strong resurgence in rental demand and occupancies reached<br />
nearly 93% by August <strong>of</strong> 2010. Rents also showed strong growth in latter half <strong>of</strong> 2010 with rents now averaging $823.<br />
<strong>2011</strong> <strong>Hampton</strong> <strong>Roads</strong> <strong>Real</strong> <strong>Estate</strong> <strong>Market</strong> <strong>Review</strong><br />
78
INVESTMENT<br />
<strong>2011</strong><br />
HAMPTON ROADS<br />
REAL ESTATE<br />
MARKET REVIEW<br />
Author<br />
J. Scott Adams, CCIM<br />
Regional President, CB Richard Ellis/<strong>Hampton</strong> <strong>Roads</strong><br />
Financial<br />
Support<br />
Disclosure<br />
The E. V. Williams Center for <strong>Real</strong> <strong>Estate</strong> and Economic<br />
Development (CREED) functions and reports are<br />
funded by donations from individuals, organizations<br />
and the CREED Council.<br />
The data used for this report are deemed reliable; however,<br />
neither Old Dominion University, the E. V. Williams Center for <strong>Real</strong> <strong>Estate</strong><br />
and Economic Development, nor sponsoring<br />
companies and/or individuals makes any representation or<br />
warranty as to its accuracy.<br />
<strong>2011</strong> INVESTMENT<br />
79
General Overview<br />
The sun is back out again for commercial real estate investment.<br />
On nearly every possible metric, commercial real estate showed signs<br />
<strong>of</strong> stabilizing in 2010 with even more optimism for an improved <strong>2011</strong> as<br />
well. There is particular optimism within capital markets as national U.S.<br />
sales transactions for <strong>of</strong>fice, industrial, retail, and multifamily assets doubled<br />
in 2010, and many experts believe that volume could more than double<br />
again in <strong>2011</strong>.<br />
The health <strong>of</strong> the commercial real estate industry begins with the<br />
health <strong>of</strong> the overall U.S. economy. By all accounts, the recession has ended<br />
and a more protracted expansion phase has begun. The painful reductions<br />
in employment have begun to turn around, particularly in the higher growth<br />
industries <strong>of</strong> technology, education, and health care. Many economists expect<br />
job growth to accelerate in <strong>2011</strong> as corporate America has been reporting<br />
strong pr<strong>of</strong>itability and productivity gains that allow more room to<br />
make increased “people investments”. As businesses increase hiring, the<br />
commercial real estate markets should show continued positive absorption<br />
<strong>of</strong> space.<br />
During 2010 the <strong>of</strong>fice and multi-family property types showed particular<br />
evidence <strong>of</strong> recovery. Both <strong>of</strong> these property types ended 2010 with<br />
positive absorption and vacancy factors well below the previous cyclical peak<br />
vacancies <strong>of</strong> the early 1990s. Within the <strong>of</strong>fice sector, CB Richard Ellis reported<br />
11 million square feet <strong>of</strong> positive absorption in 2010, led particularly<br />
by the Eastern region <strong>of</strong> the country.<br />
The retail and industrial property types showed signs <strong>of</strong> stabilization in<br />
2010 with even stronger signs <strong>of</strong> recovery expected in <strong>2011</strong>. The industrial<br />
and retail markets remained at the highest vacancy rate in the last 20 years at year-end 2010, but the return <strong>of</strong> bank<br />
credit for small businesses, consumer spending, and rising trade volumes all point to better days ahead.<br />
While the market resurgence is clearly underway, there remains a sense <strong>of</strong> “survival <strong>of</strong> the fittest” throughout the<br />
entire industry. Investors and lenders remain cautious about what to move forward on, although the market optimism<br />
to some degree benefits all assets in all markets.<br />
<strong>2011</strong> <strong>Hampton</strong> <strong>Roads</strong> <strong>Real</strong> <strong>Estate</strong> <strong>Market</strong> <strong>Review</strong><br />
80
<strong>2011</strong> I N V E S T M E N T<br />
INVESTMENT SALES ACTIVITY WITH DRAMATIC GROWTH DURING 2010<br />
While we are coming up from a relatively low base compared to the investment sales peak period <strong>of</strong> 2005 to 2007, it remains<br />
encouraging that sales volume doubled from 2009 to 2010, as reported by <strong>Real</strong> Capital Analytics (“RCA”) in the below chart. For<br />
purposes <strong>of</strong> this metric, RCA tracks sales <strong>of</strong> $5 million or more for assets in the <strong>of</strong>fice, industrial, retail, and multifamily properties.<br />
In fact, December’s volume <strong>of</strong> over $21 billion was the highest monthly amount recorded since the end <strong>of</strong> 2007.<br />
Annual Investment Sales Volume<br />
$600<br />
$500<br />
$400<br />
Billions<br />
$300<br />
$200<br />
$100<br />
0<br />
2003 2004 2005 2006 2007 2008 2009 2010<br />
Source: © <strong>Real</strong> Capital Analytics, Inc. <strong>2011</strong><br />
Among the many factors that can be attributed to the rise in real estate sales volume, a key factor is the fundamental faith in the<br />
economic recovery that allows underwriting <strong>of</strong> tenant creditworthiness and more accurate prediction <strong>of</strong> investment returns. Investors<br />
remain challenged to find higher yields in alternative investment types, and the low cost <strong>of</strong> debt allows positive leverage<br />
to accentuate real estate investment returns.<br />
In terms <strong>of</strong> favored asset types, not much has changed since 2009. There continues to be strong demand for apartments as favorable<br />
government-sponsored financing remains available while rental demand is buoyed by the home ownership struggles that<br />
unfortunately continue for millions <strong>of</strong> Americans. Investors also continue to favor well-located grocery anchored retail centers,<br />
premier <strong>of</strong>fice buildings, medical <strong>of</strong>fice properties, and long-term single-tenant leased assets.<br />
<strong>2011</strong> INVESTMENT<br />
81
Within these property types, investment volumes have been particularly heavy for premium assets in primary markets.<br />
Given investors’ preference to obtain higher yields with the lowest risk possible, the push toward “top-shelf” assets is backed by<br />
a belief that these assets hold value better in downturns and appreciate more in strong economies.<br />
Investment volumes are also rising because more buyers realize that they should not expect huge price discounts on all assets<br />
available for sale. NCREIF, a national investment industry organization, reports that overall commercial real estate prices<br />
have already risen 30% from their trough, and as much as 50% for the premier properties in premier markets.<br />
VOLUME OF DISTRESSED ASSETS HAS STABILIZED<br />
A significant area <strong>of</strong> concern for the commercial real estate investment market has been the dramatic rise in distressed assets<br />
that occurred during 2008 and 2009. An encouraging sign for the real estate investment markets in 2010 was the clear<br />
stabilization <strong>of</strong> outstanding distress properties, along with increased volume <strong>of</strong> worked-out loans that are no longer considered<br />
in distress. The chart below prepared<br />
again by <strong>Real</strong> Capital Analytics shows<br />
that a rising percentage <strong>of</strong> the overall<br />
tracked distress properties has been<br />
Outstanding Worked Out<br />
worked out either through asset sale, loan<br />
restructuring, or loan extension.<br />
$250<br />
It is also interesting to note that the<br />
rise in 2010 investment volume has a<br />
$200<br />
strong correlation to the rise in worked<br />
out loans in 2010. In fact, RCA reports<br />
$150<br />
that over 22% <strong>of</strong> the total sales volume<br />
was <strong>of</strong> distressed assets. Numerous wellcapitalized<br />
investors remain positioned to<br />
$50<br />
take advantage <strong>of</strong> the buying opportunities<br />
from distress, but for the most part<br />
$0<br />
they have been very disappointed by the<br />
07Q1 08Q1 09Q1 10Q1<br />
limited availability <strong>of</strong> high-quality investment<br />
product through that medium.<br />
Rather than a large tidal wave <strong>of</strong> opportunities<br />
in the short term, it appears that the overall maturity wave <strong>of</strong> loans will more likely lead to lower volumes <strong>of</strong> sales opportunities<br />
over each <strong>of</strong> the next five years.<br />
The reason for that longer time frame is that Foresight Analytics estimates that $1.4 trillion <strong>of</strong> commercial real estate debt<br />
will come due between <strong>2011</strong> and 2014. Much <strong>of</strong> the debt coming due in 2012 and 2013, in particular, had a five year loan<br />
term on assets that were acquired at peak market pricing during 2007 and 2008. A large number <strong>of</strong> these associated assets have<br />
current values below the current loan balance and remain at risk to become distressed as the loan maturity dates get closer.<br />
What is unknown is how the debt industry will change its patterns <strong>of</strong> dealing with borrowers in the years ahead. To date,<br />
many lenders have preferred to extend and amend loans to buy time for market recovery rather than moving forward to take title<br />
to the properties. Many experts expect lenders to be less willing to continue to do so if the individual property fundamentals<br />
and the borrower cannot show sufficient additional equity to bring to the table. The overlying market recovery should also<br />
make a big positive impact on the probability <strong>of</strong> a successful workout in each <strong>of</strong> these cases.<br />
Cumulative Distress<br />
<strong>2011</strong> <strong>Hampton</strong> <strong>Roads</strong> <strong>Real</strong> <strong>Estate</strong> <strong>Market</strong> <strong>Review</strong><br />
82
<strong>2011</strong> I N V E S T M E N T<br />
POSITIVE SIGNS IN THE COMMERCIAL REAL ESTATE LENDING MARKET<br />
The Mortgage Bankers Association (“MBA”) recently reported that the commercial real estate lending spiked in the fourth<br />
quarter <strong>of</strong> 2010 with the highest quarter over quarter increase in lending volume since mid-2007. Within that total volume, the<br />
MBA noted that the insurance industry originated more loans in the fourth quarter than any time since 2005. The year’s overall<br />
reported volume <strong>of</strong> over $110 billion was a 36% increase over 2009.<br />
While the MBA also reported that bank lending remained generally flat during the fourth quarter, most industry experts expect<br />
bank lending to show robust growth in <strong>2011</strong> as banks show improved pr<strong>of</strong>itability and seek to generate even higher earnings<br />
with their excess reserves and low cost <strong>of</strong> funds. The FDIC reports that year-over-year earnings improved for the fifth consecutive<br />
quarter in the third quarter <strong>of</strong> 2010.<br />
As with the overall investment sales market, to date lenders have largely preferred to focus on lower leverage loans from well<br />
capitalized and experienced investors on premium properties in premium locations. As lenders have more confidence in overall<br />
real estate markets, lending volume for other non-premium assets (i.e. Class B properties or secondary market areas) should rise,<br />
particularly with more assets expected to<br />
be <strong>of</strong>fered for sale in <strong>2011</strong>.<br />
Another encouraging sign in the<br />
lending market is the re-emergence <strong>of</strong><br />
conduit lenders which adds to the market<br />
liquidity. Numerous well-known institutions<br />
including JP Morgan and<br />
Citigroup are rolling out conduit <strong>of</strong>ferings<br />
(also referred to as Commercial Mortgage<br />
Backed Securities, or CMBS) with attractive<br />
loan terms including lower pricing,<br />
higher loan-to-value, and<br />
non-recourse terms. CMBS volume grew<br />
somewhat in 2010, but still 75% below the peak annual level in 2007.<br />
As with the overall investment sales market, to date lenders<br />
have largely preferred to focus on lower leverage loans from<br />
well capitalized and experienced investors on premium<br />
properties in premium locations. As lenders have more<br />
confidence in overall real estate markets, lending volume<br />
for other non-premium assets (i.e. Class B properties or<br />
secondary market areas) should rise, particularly with more<br />
assets expected to be <strong>of</strong>fered for sale in <strong>2011</strong>.<br />
As all areas <strong>of</strong> lending sources show signs <strong>of</strong> improvement, the competition among lenders for the better <strong>of</strong>ferings available<br />
is expected to lead to less stringent borrower terms. And <strong>of</strong> course, less stringent borrower terms are expected to add<br />
further momentum to the increase in sale prices as buyers have more favorable access to capital.<br />
<strong>2011</strong> INVESTMENT<br />
83
Investment Sales Activity in <strong>Hampton</strong> <strong>Roads</strong> Area in 2010<br />
Over $151 million <strong>of</strong> <strong>of</strong>fice, industrial, retail, and multifamily assets sold in 2010 transactions <strong>of</strong> $5 million or more. The<br />
eight qualifying transactions are detailed below:<br />
Property Name Property Purchase Size $/Size Purchaser Seller<br />
Type Price<br />
Prime Outlets Williamsburg Retail $78,424,068 274,000 SF $286.22/SF Simon Property Prime Outlets<br />
Group<br />
Alta Great Bridge Multi-Family $26,675,000 192 Units $138,932/Unit Bell Partners Wood Partners<br />
Harbour View Medical Office $12,550,000 48,517 SF $258.67/SF Health Care REIT Lingerfelt Investments<br />
Arts Building<br />
Southport Center Office $8,300,000 61,594 SF $134.75/SF <strong>College</strong> Properties, LLC Guardian <strong>Real</strong>ty<br />
Battlefield Corporate Center Office $8,000,000 96,720 SF $82.71/SF First Potomac Mackenzie Fibres<br />
<strong>Real</strong>ty Trust International<br />
Cape Henry Plaza Retail $6,400,000 58,424 SF $109.54/SF Suburban Asset Phillips Edison<br />
Management & Company<br />
201 Dexter Street Industrial $6,000,000 445,000 SF $13.48/SF 201 Dexter, LLC Chesapeake<br />
Hardwood Products<br />
Battlefield Woods Apartments Multi-Family $5,047,500 102 Units $49,485/Unit Lawson Continental <strong>Real</strong>ty<br />
<strong>Real</strong>ty Corporation<br />
Services<br />
TOTAL $151,396,568<br />
The largest sale <strong>of</strong> the year was a retail complex in Williamsburg that was part <strong>of</strong> a national portfolio <strong>of</strong> outlet centers.<br />
The Prime Outlets was one <strong>of</strong> twenty-one outlet store properties in a $2.3 billion transaction by Simon Property Group, a leading<br />
national retail owner.<br />
Each <strong>of</strong> the other seven sales was a “one-<strong>of</strong>f” sale, three <strong>of</strong> which were two national buyers showing confidence in the<br />
<strong>Hampton</strong> <strong>Roads</strong> area. Two <strong>of</strong> the national buyers were public <strong>Real</strong> <strong>Estate</strong> Investment Trusts which purchased individual <strong>of</strong>fice<br />
buildings in the area. Another two <strong>of</strong> the sales were multi-family transactions, one <strong>of</strong> which was to a major national buyer<br />
based in North Carolina. A local investor purchased the one other qualifying retail asset, a well-located grocery-anchored center<br />
in Virginia Beach.<br />
It is also <strong>of</strong> note that two <strong>of</strong> the qualifying sales were owner-occupant transactions. Both Southport Center and 201 West<br />
Dexter (the one qualifying industrial sale) were purchased by investors that intended to occupy a large portion <strong>of</strong> the building<br />
for its own use. Debt financing remains readily available for these types <strong>of</strong> transactions, and recent changes to financial<br />
accounting regulations may point to even more investment sales to space users in the future.<br />
We expect that <strong>Hampton</strong> <strong>Roads</strong>’ continued economic stability should attract many national buyers in the months and<br />
years ahead as investors move beyond focusing exclusively on the top tier markets. <strong>Hampton</strong> <strong>Roads</strong> received national endorsement<br />
from the Brookings Institution as one <strong>of</strong> only five areas in the country that had positive job growth all four quarters<br />
<strong>of</strong> 2010.<br />
<strong>2011</strong> <strong>Hampton</strong> <strong>Roads</strong> <strong>Real</strong> <strong>Estate</strong> <strong>Market</strong> <strong>Review</strong><br />
84