Total Retail Product By Type New Average Number <strong>of</strong> Construction Small Shop Average Properties GLA in SF in SF Vacant SF % Vacant Rate PSF CAM PSF Neighborhood Center 162 12,224,492 18,880 1,379,030 11.28% $15.11 $2.54 Community Center 58 10,073,618 - 1,218,966 12.10% $15.79 $2.39 Fashion/Specialty Center 10 1,488,711 - 115,009 7.73% $23.78 $3.94 Power Center 29 10,350,350 - 901,629 8.71% $20.41 $3.27 Theme Festival Center 1 100,000 - - No data No data No data Outlet Center 1 349,927 - - No data No data No data Other 64 2,391,469 - 286,287 11.97% $15.67 $2.92 Freestanding 77 8,050,908 - 397,674 4.94% $12.44 $3.08 Mall 10 7,538,487 - 400,952 5.32% $20.50 $17.75 Total 412 52,567,962 18,880 4,699,547 8.94% $16.00 $2.70 Southside By Type New Average Number <strong>of</strong> Construction Small Shop Average Properties GLA in SF in SF Vacant SF % Vacant Rate PSF CAM PSF Neighborhood Center 115 8,781,549 18,880 989,334 11.27% $15.30 $2.55 Community Center 37 6,159,227 - 618,745 10.05% $15.60 $2.38 Fashion/Specialty Center 8 1,005,711 - 54,846 5.45% $23.50 $3.94 Power Center 19 6,267,303 - 336,250 5.37% $20.15 $3.27 Theme Festival Center 1 100,000 - - No data No data No data Outlet Center - - - - No data No data No data Other 44 1,556,985 - 149,645 9.61% $15.90 $2.95 Freestanding 43 4,499,135 - 61,870 1.38% $13.63 $3.08 Mall 7 5,649,645 - 313,064 5.54% $20.50 $18.86 Total 274 34,019,555 18,880 2,523,754 7.42% $16.16 $2.79 Peninsula By Type New Average Number <strong>of</strong> Construction Small Shop Average Properties GLA in SF in SF Vacant SF % Vacant Rate PSF CAM PSF Neighborhood Center 47 3,442,943 - 389,696 11.32% $14.66 $2.15 Community Center 21 3,914,391 - 600,221 15.33% $16.12 $2.35 Fashion/Specialty Center 2 483,000 - 60,163 12.46% $26.00 $5.03 DPower Center 10 4,083,047 - 565,379 13.85% $20.85 $2.79 Theme Festival Center - - - - No data No data No data Outlet Center 1 349,927 - - No data No data No data Other 20 834,484 - 136,642 16.37% $15.20 $2.38 Freestanding 34 3,551,773 - 335,804 9.45% $11.25 $2.24 Mall 3 1,888,842 - 87,888 4.65% No data $17.75 Total 138 18,548,407 - 2,175,793 11.73% $15.65 $2.51 <strong>2011</strong> <strong>Hampton</strong> <strong>Roads</strong> <strong>Real</strong> <strong>Estate</strong> <strong>Market</strong> <strong>Review</strong> 18
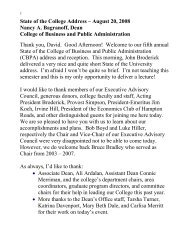
<strong>2011</strong> R E TA I L Big Box Vacancy Big Box Vacancy in <strong>Hampton</strong> <strong>Roads</strong> decreased in 2010 to 1,717,593 square feet, a decrease <strong>of</strong> 373,805 square feet over last year’s numbers. This number represents 37% <strong>of</strong> the total retail vacancy in the market. We did see some Big Box activity this past year. Wal-Mart is under construction at Edinburgh in Chesapeake on a site purchased in 2009 and Restaurant Depot opened in the former Value City on Virginia Beach Boulevard. Big Box Vacancy 4,000,000 Vacant Square Feet 3,500,000 3,000,000 2,500,000 2,000,000 1,500,000 1,000,000 500,000 0 Southside Peninsula TOTAL 1998 1999 2000 2001 2002 2003 2004 2005 2006 2007 2008 2009 2010 Big Box Vacancy 2004 2005 2006 2007 2008 2009 2010 Southside 1,513,523 1,142,319 957,887 948,288 907,688 1,102,093 880,568 Peninsula 1,141,207 982,263 819,163 827,360 880,805 989,305 837,025 TOTAL 2,654,730 2,124,582 1,777,050 1,775,648 1,788,493 2,091,398 1,717,593 <strong>2011</strong> RETAIL 19