2011 Hampton Roads Real Estate Market Review - College of ...
2011 Hampton Roads Real Estate Market Review - College of ...
2011 Hampton Roads Real Estate Market Review - College of ...

Create successful ePaper yourself
Turn your PDF publications into a flip-book with our unique Google optimized e-Paper software.
<strong>2011</strong> O F F I C E<br />
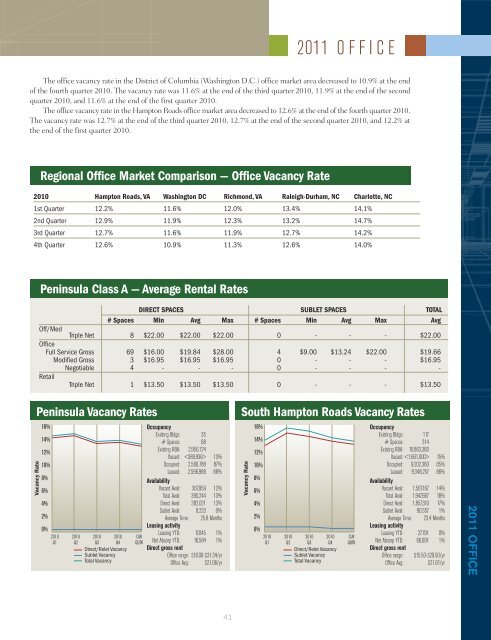
The <strong>of</strong>fice vacancy rate in the District <strong>of</strong> Columbia (Washington D.C.) <strong>of</strong>fice market area decreased to 10.9% at the end<br />
<strong>of</strong> the fourth quarter 2010. The vacancy rate was 11.6% at the end <strong>of</strong> the third quarter 2010, 11.9% at the end <strong>of</strong> the second<br />
quarter 2010, and 11.6% at the end <strong>of</strong> the first quarter 2010.<br />
The <strong>of</strong>fice vacancy rate in the <strong>Hampton</strong> <strong>Roads</strong> <strong>of</strong>fice market area decreased to 12.6% at the end <strong>of</strong> the fourth quarter 2010.<br />
The vacancy rate was 12.7% at the end <strong>of</strong> the third quarter 2010, 12.7% at the end <strong>of</strong> the second quarter 2010, and 12.2% at<br />
the end <strong>of</strong> the first quarter 2010.<br />
Regional Office <strong>Market</strong> Comparison — Office Vacancy Rate<br />
2010 <strong>Hampton</strong> <strong>Roads</strong>, VA Washington DC Richmond, VA Raleigh-Durham, NC Charlotte, NC<br />
1st Quarter 12.2% 11.6% 12.0% 13.4% 14.1%<br />
2nd Quarter 12.9% 11.9% 12.3% 13.2% 14.7%<br />
3rd Quarter 12.7% 11.6% 11.9% 12.7% 14.2%<br />
4th Quarter 12.6% 10.9% 11.3% 12.6% 14.0%<br />
Peninsula Class A — Average Rental Rates<br />
DIRECT SPACES SUBLET SPACES TOTAL<br />
# Spaces Min Avg Max # Spaces Min Avg Max Avg<br />
Off/Med<br />
Triple Net 8 $22.00 $22.00 $22.00 0 - - - $22.00<br />
Office<br />
Full Service Gross 69 $16.00 $19.84 $28.00 4 $9.00 $13.24 $22.00 $19.66<br />
Modified Gross 3 $16.95 $16.95 $16.95 0 - - - $16.95<br />
Negotiable 4 - - - 0 - - - -<br />
Retail<br />
Triple Net 1 $13.50 $13.50 $13.50 0 - - - $13.50<br />
Vacancy Rate<br />
Peninsula Vacancy Rates<br />
16%<br />
14%<br />
12%<br />
10%<br />
8%<br />
6%<br />
4%<br />
2%<br />
0%<br />
2010<br />
Q1<br />
2010<br />
Q2<br />
2010 2010<br />
Q3 Q4<br />
Direct/Relet Vacancy<br />
Sublet Vacancy<br />
Total Vacancy<br />
CUR<br />
QUTR<br />
Occupancy<br />
Existing Bldgs: 35<br />
# Spaces: 88<br />
Existing RBA: 2,956,724<br />
Vacant: 13%<br />
Occupied: 2,566,788 87%<br />
Leased: 2,596,988 88%<br />
Availability<br />
Vacant Avail: 367,959 12%<br />
Total Avail: 390,244 13%<br />
Direct Avail: 382,021 13%<br />
Sublet Avail: 8,223 0%<br />
Average Time: 25.8 Months<br />
Leasing activity<br />
Leasing YTD: 17,045 1%<br />
Net Absorp YTD: 16,584 1%<br />
Direct gross rent<br />
Office range: $16.00-$31.34/yr<br />
Office Avg: $21.06/yr<br />
South <strong>Hampton</strong> <strong>Roads</strong> Vacancy Rates<br />
Vacancy Rate<br />
16%<br />
14%<br />
12%<br />
10%<br />
8%<br />
6%<br />
4%<br />
2%<br />
0%<br />
2010<br />
Q1<br />
2010<br />
Q2<br />
2010 2010<br />
Q3 Q4<br />
Direct/Relet Vacancy<br />
Sublet Vacancy<br />
Total Vacancy<br />
CUR<br />
QUTR<br />
Occupancy<br />
Existing Bldgs: 117<br />
# Spaces: 314<br />
Existing RBA: 10,863,360<br />
Vacant: 15%<br />
Occupied: 9,202,360 85%<br />
Leased: 9,348,257 86%<br />
Availability<br />
Vacant Avail: 1,567,167 14%<br />
Total Avail: 1,947,667 18%<br />
Direct Avail: 1,857,310 17%<br />
Sublet Avail: 90,357 1%<br />
Average Time: 23.4 Months<br />
Leasing activity<br />
Leasing YTD: 27,791 0%<br />
Net Absorp YTD: 66,691 1%<br />
Direct gross rent<br />
Office range: $15.50-$29.50/yr<br />
Office Avg: $21.61/yr<br />
<strong>2011</strong> OFFICE<br />
41