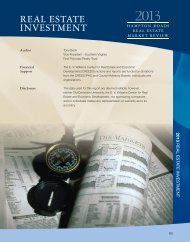
2011 Hampton Roads Real Estate Market Review - College of ...
2011 Hampton Roads Real Estate Market Review - College of ...
2011 Hampton Roads Real Estate Market Review - College of ...

Create successful ePaper yourself
Turn your PDF publications into a flip-book with our unique Google optimized e-Paper software.
<strong>2011</strong> O F F I C E<br />
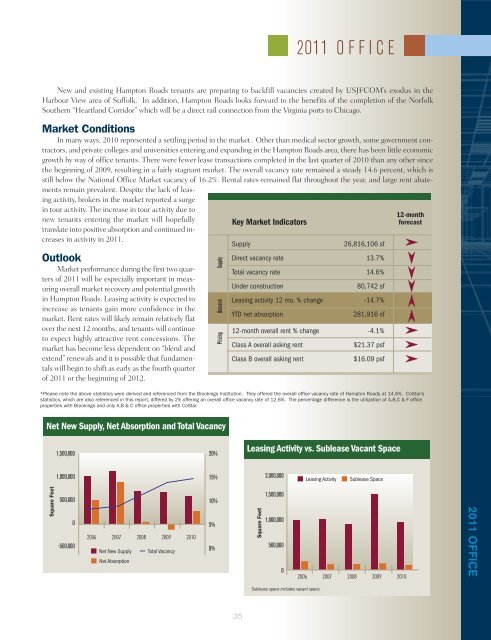
New and existing <strong>Hampton</strong> <strong>Roads</strong> tenants are preparing to backfill vacancies created by USJFCOM’s exodus in the<br />
Harbour View area <strong>of</strong> Suffolk. In addition, <strong>Hampton</strong> <strong>Roads</strong> looks forward to the benefits <strong>of</strong> the completion <strong>of</strong> the Norfolk<br />
Southern “Heartland Corridor” which will be a direct rail connection from the Virginia ports to Chicago.<br />
<strong>Market</strong> Conditions<br />
In many ways, 2010 represented a settling period in the market. Other than medical sector growth, some government contractors,<br />
and private colleges and universities entering and expanding in the <strong>Hampton</strong> <strong>Roads</strong> area, there has been little economic<br />
growth by way <strong>of</strong> <strong>of</strong>fice tenants. There were fewer lease transactions completed in the last quarter <strong>of</strong> 2010 than any other since<br />
the beginning <strong>of</strong> 2009, resulting in a fairly stagnant market. The overall vacancy rate remained a steady 14.6 percent, which is<br />
still below the National Office <strong>Market</strong> vacancy <strong>of</strong> 16.2%. Rental rates remained flat throughout the year, and large rent abatements<br />
remain prevalent. Despite the lack <strong>of</strong> leasing<br />
activity, brokers in the market reported a surge<br />
in tour activity. The increase in tour activity due to<br />
new tenants entering the market will hopefully<br />
translate into positive absorption and continued increases<br />
in activity in <strong>2011</strong>.<br />
Outlook<br />
<strong>Market</strong> performance during the first two quarters<br />
<strong>of</strong> <strong>2011</strong> will be especially important in measuring<br />
overall market recovery and potential growth<br />
in <strong>Hampton</strong> <strong>Roads</strong>. Leasing activity is expected to<br />
increase as tenants gain more confidence in the<br />
market. Rent rates will likely remain relatively flat<br />
over the next 12 months, and tenants will continue<br />
to expect highly attractive rent concessions. The<br />
market has become less dependent on “blend and<br />
extend” renewals and it is possible that fundamentals<br />
will begin to shift as early as the fourth quarter<br />
<strong>of</strong> <strong>2011</strong> or the beginning <strong>of</strong> 2012.<br />
Pricing Demand Supply<br />
Key <strong>Market</strong> Indicators<br />
Supply<br />
26,816,106 sf<br />
Direct vacancy rate 13.7%<br />
Total vacancy rate 14.6%<br />
Under construction<br />
80,742 sf<br />
Leasing activity 12 mo. % change -14.7%<br />
YTD net absorption<br />
281,916 sf<br />
12-month overall rent % change -4.1%<br />
Class A overall asking rent<br />
Class B overall asking rent<br />
$21.37 psf<br />
$16.09 psf<br />
12-month<br />
forecast<br />
*Please note the above statistics were derived and referenced from the Brookings Institution. They <strong>of</strong>fered the overall <strong>of</strong>fice vacancy rate <strong>of</strong> <strong>Hampton</strong> <strong>Roads</strong> at 14.6%. CoStar’s<br />
statistics, which are also referenced in this report, differed by 2% <strong>of</strong>fering an overall <strong>of</strong>fice vacancy rate <strong>of</strong> 12.6%. The percentage difference is the utilization <strong>of</strong> A,B,C & F <strong>of</strong>fice<br />
properties with Brookings and only A,B & C <strong>of</strong>fice properties with CoStar.<br />
Net New Supply, Net Absorption and Total Vacancy<br />
1,500,000<br />
20%<br />
Leasing Activity vs. Sublease Vacant Space<br />
1,000,000<br />
15%<br />
2,000,000<br />
Leasing Activity<br />
Sublease Space<br />
Square Feet<br />
500,000<br />
0<br />
-500,000<br />
2006 2007 2008 2009 2010<br />
Net New Supply Total Vacancy<br />
Net Absorption<br />
10%<br />
5%<br />
0%<br />
Square Feet<br />
1,500,000<br />
1,000,000<br />
500,000<br />
0<br />
2006 2007 2008 2009 2010<br />
<strong>2011</strong> OFFICE<br />
Sublease space includes vacant space.<br />
35