2011 Hampton Roads Real Estate Market Review - College of ...
2011 Hampton Roads Real Estate Market Review - College of ...
2011 Hampton Roads Real Estate Market Review - College of ...

You also want an ePaper? Increase the reach of your titles
YUMPU automatically turns print PDFs into web optimized ePapers that Google loves.
<strong>2011</strong> R E S I D E N TIAL<br />
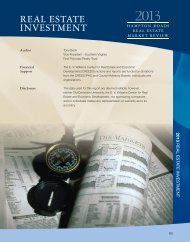
dian <strong>of</strong> $301,900 in 2009. For 2010, only Chesapeake and Surry County experienced rising median sale prices for existing homes <strong>of</strong><br />
significance, 2% and 29% respectively. Only two other areas avoided drops in median sale prices, Virginia Beach and Isle <strong>of</strong> Wight<br />
County. The median sale price in Virginia Beach was flat year-over-year at $230,000 and Isle <strong>of</strong> Wight County had a slight increase<br />
<strong>of</strong> 0.4%, otherwise all <strong>of</strong> the local cities and counties had median price declines when compared to 2009. Portsmouth and Mathews<br />
County experienced the largest declines in median sale prices <strong>of</strong> existing homes, 10% and 19% respectively.<br />
The average number <strong>of</strong> days a home spent on the active market for sale, or market time, for existing homes that closed in 2010<br />
in the <strong>Hampton</strong> <strong>Roads</strong> region was 87 days, the same as in 2009. This was the first year without an increase since 2004. The stabilizing<br />
<strong>of</strong> this measure may signify a leveling and strength in the real estate market, but the statistic is susceptible to manipulation and<br />
may not be truly indicative <strong>of</strong> the time it takes to sell a home. For instance, when the same measure is taken for all existing homes<br />
that exit the active market (i.e. the home becomes no longer for sale due to closing, listing expiration, contract fall through, or the listing<br />
is withdrawn from the active market) the average number <strong>of</strong> days on market was 128 for 2010, whereas it was 125 days for 2009,<br />
much larger than the market time <strong>of</strong> only those homes that closed.<br />
Detached homes accounted for 79% <strong>of</strong> all existing home closings in 2010, up 2% from 2009. The number <strong>of</strong> closings was down<br />
7% for detached existing homes in 2010 when compared to 2009. The median sale price for detached homes in 2010 was $220,000,<br />
down 2.2% from 2009’s measure. The Southside’s cities and counties comprised 72% <strong>of</strong> all the existing detached home closings in<br />
2010. Virginia Beach had the highest percentage, 26%, for any single city or county for the <strong>Hampton</strong> <strong>Roads</strong> region.<br />
Existing Homes Median Sale Prices<br />
$350,000<br />
$300,000<br />
$250,000<br />
$200,000<br />
$150,000<br />
$225,500<br />
$230,000<br />
$232,500<br />
$213,750<br />
$200,000<br />
$198,350<br />
$169,250<br />
$155,000<br />
$254,950<br />
$256,000<br />
$301,900<br />
$295,000<br />
$265,000<br />
$215,000<br />
$183,900<br />
$172,250<br />
$175,000<br />
$164,900<br />
$293,700<br />
$270,000<br />
$150,500<br />
$135,000<br />
$230,000<br />
$214,800<br />
$135,000<br />
$173,500<br />
$230,000<br />
$230,000<br />
$229,000<br />
$215,500<br />
$290,000<br />
$279,000<br />
$100,00<br />
$50,000<br />
$0<br />
CHES<br />
CURR<br />
GLOC<br />
HAMP<br />
IWC<br />
JCC<br />
MATC<br />
NNEW<br />
NORF<br />
POQ<br />
2009 Median SP 2010 Median SP<br />
PORT<br />
SUFF<br />
SURC<br />
VBCH<br />
WMBG<br />
YORK<br />
<strong>2011</strong> RESIDENTIAL<br />
63