Red Snapper Management Measures - SAFMC.net
Red Snapper Management Measures - SAFMC.net
Red Snapper Management Measures - SAFMC.net

You also want an ePaper? Increase the reach of your titles
YUMPU automatically turns print PDFs into web optimized ePapers that Google loves.
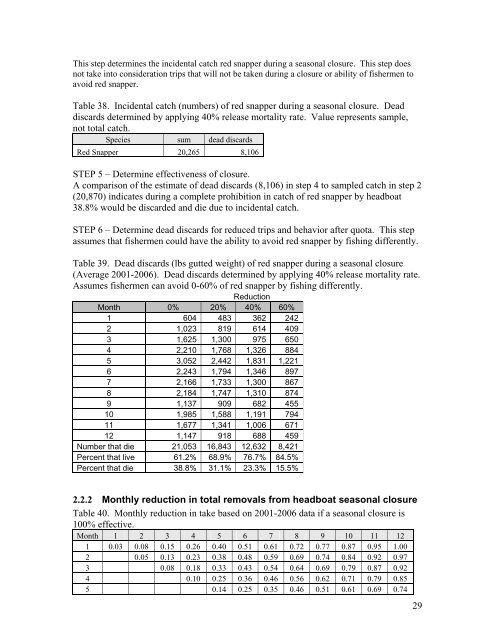
This step determines the incidental catch red snapper during a seasonal closure. This step does<br />
not take into consideration trips that will not be taken during a closure or ability of fishermen to<br />
avoid red snapper.<br />
Table 38. Incidental catch (numbers) of red snapper during a seasonal closure. Dead<br />
discards determined by applying 40% release mortality rate. Value represents sample,<br />
not total catch.<br />
Species sum dead discards<br />
<strong>Red</strong> <strong>Snapper</strong> 20,265 8,106<br />
STEP 5 – Determine effectiveness of closure.<br />
A comparison of the estimate of dead discards (8,106) in step 4 to sampled catch in step 2<br />
(20,870) indicates during a complete prohibition in catch of red snapper by headboat<br />
38.8% would be discarded and die due to incidental catch.<br />
STEP 6 – Determine dead discards for reduced trips and behavior after quota. This step<br />
assumes that fishermen could have the ability to avoid red snapper by fishing differently.<br />
Table 39. Dead discards (lbs gutted weight) of red snapper during a seasonal closure<br />
(Average 2001-2006). Dead discards determined by applying 40% release mortality rate.<br />
Assumes fishermen can avoid 0-60% of red snapper by fishing differently.<br />
<strong>Red</strong>uction<br />
Month 0% 20% 40% 60%<br />
1 604 483 362 242<br />
2 1,023 819 614 409<br />
3 1,625 1,300 975 650<br />
4 2,210 1,768 1,326 884<br />
5 3,052 2,442 1,831 1,221<br />
6 2,243 1,794 1,346 897<br />
7 2,166 1,733 1,300 867<br />
8 2,184 1,747 1,310 874<br />
9 1,137 909 682 455<br />
10 1,985 1,588 1,191 794<br />
11 1,677 1,341 1,006 671<br />
12 1,147 918 688 459<br />
Number that die 21,053 16,843 12,632 8,421<br />
Percent that live 61.2% 68.9% 76.7% 84.5%<br />
Percent that die 38.8% 31.1% 23.3% 15.5%<br />
2.2.2 Monthly reduction in total removals from headboat seasonal closure<br />
Table 40. Monthly reduction in take based on 2001-2006 data if a seasonal closure is<br />
100% effective.<br />
Month 1 2 3 4 5 6 7 8 9 10 11 12<br />
1 0.03 0.08 0.15 0.26 0.40 0.51 0.61 0.72 0.77 0.87 0.95 1.00<br />
2 0.05 0.13 0.23 0.38 0.48 0.59 0.69 0.74 0.84 0.92 0.97<br />
3 0.08 0.18 0.33 0.43 0.54 0.64 0.69 0.79 0.87 0.92<br />
4 0.10 0.25 0.36 0.46 0.56 0.62 0.71 0.79 0.85<br />
5 0.14 0.25 0.35 0.46 0.51 0.61 0.69 0.74<br />
29