Red Snapper Management Measures - SAFMC.net
Red Snapper Management Measures - SAFMC.net
Red Snapper Management Measures - SAFMC.net

You also want an ePaper? Increase the reach of your titles
YUMPU automatically turns print PDFs into web optimized ePapers that Google loves.
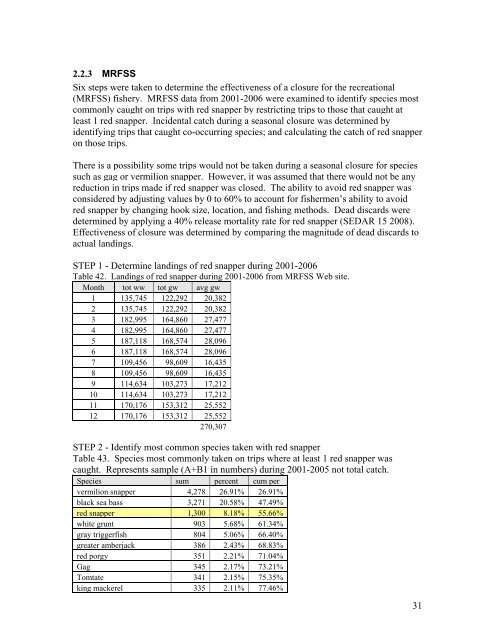
2.2.3 MRFSS<br />
Six steps were taken to determine the effectiveness of a closure for the recreational<br />
(MRFSS) fishery. MRFSS data from 2001-2006 were examined to identify species most<br />
commonly caught on trips with red snapper by restricting trips to those that caught at<br />
least 1 red snapper. Incidental catch during a seasonal closure was determined by<br />
identifying trips that caught co-occurring species; and calculating the catch of red snapper<br />
on those trips.<br />
There is a possibility some trips would not be taken during a seasonal closure for species<br />
such as gag or vermilion snapper. However, it was assumed that there would not be any<br />
reduction in trips made if red snapper was closed. The ability to avoid red snapper was<br />
considered by adjusting values by 0 to 60% to account for fishermen’s ability to avoid<br />
red snapper by changing hook size, location, and fishing methods. Dead discards were<br />
determined by applying a 40% release mortality rate for red snapper (SEDAR 15 2008).<br />
Effectiveness of closure was determined by comparing the magnitude of dead discards to<br />
actual landings.<br />
STEP 1 - Determine landings of red snapper during 2001-2006<br />
Table 42. Landings of red snapper during 2001-2006 from MRFSS Web site.<br />
Month tot ww tot gw avg gw<br />
1 135,745 122,292 20,382<br />
2 135,745 122,292 20,382<br />
3 182,995 164,860 27,477<br />
4 182,995 164,860 27,477<br />
5 187,118 168,574 28,096<br />
6 187,118 168,574 28,096<br />
7 109,456 98,609 16,435<br />
8 109,456 98,609 16,435<br />
9 114,634 103,273 17,212<br />
10 114,634 103,273 17,212<br />
11 170,176 153,312 25,552<br />
12 170,176 153,312 25,552<br />
270,307<br />
STEP 2 - Identify most common species taken with red snapper<br />
Table 43. Species most commonly taken on trips where at least 1 red snapper was<br />
caught. Represents sample (A+B1 in numbers) during 2001-2005 not total catch.<br />
Species sum percent cum per<br />
vermilion snapper 4,278 26.91% 26.91%<br />
black sea bass 3,271 20.58% 47.49%<br />
red snapper 1,300 8.18% 55.66%<br />
white grunt 903 5.68% 61.34%<br />
gray triggerfish 804 5.06% 66.40%<br />
greater amberjack 386 2.43% 68.83%<br />
red porgy 351 2.21% 71.04%<br />
Gag 345 2.17% 73.21%<br />
Tomtate 341 2.15% 75.35%<br />
king mackerel 335 2.11% 77.46%<br />
31