Short Range Transit Plan 2006-2011 - Omnitrans
Short Range Transit Plan 2006-2011 - Omnitrans
Short Range Transit Plan 2006-2011 - Omnitrans

Create successful ePaper yourself
Turn your PDF publications into a flip-book with our unique Google optimized e-Paper software.
OMNITRANS<br />
1700 West Fifth Street San Bernardino California 92411<br />
Phone: 909.379.7100 Fax: 909.889.5779 Web site: www.omnitrans.org<br />
OMNITRANS<br />
Fiscal Year <strong>2006</strong> - <strong>2011</strong> <strong>Short</strong> <strong>Range</strong> <strong>Transit</strong> <strong>Plan</strong><br />
June 1, 2005<br />
Prepared by:<br />
<strong>Omnitrans</strong> <strong>Plan</strong>ning Department<br />
Proudly serving the municipalities of:<br />
Chino, Chino Hills, Colton, Fontana, Grand Terrace, Highland, Loma Linda, Montclair, Ontario, Rancho<br />
Cucamonga, Redlands, Rialto, San Bernardino, Upland, Yucaipa and portions of San Bernardino County
<strong>Short</strong> <strong>Range</strong> <strong>Transit</strong> <strong>Plan</strong><br />
FY <strong>2006</strong>-11<br />
Table of Contents<br />
Section I. Introduction ...................................................................... 1<br />
<strong>Omnitrans</strong> Mission/Vision<br />
Vision for 2015<br />
Purpose of SRTP<br />
Recent Events & Accomplishments<br />
East Valley and West Valley LCNG Stations<br />
Environmental Review of <strong>Omnitrans</strong> Facilities<br />
Hybrid Vehicles<br />
Bus Rapid <strong>Transit</strong> Major Investment Study<br />
Future Investment Study<br />
Fontana <strong>Transit</strong> Center Expansion<br />
Chino/Ontario Agricultural Preserve<br />
<strong>Transit</strong> <strong>Plan</strong><br />
Chino Transcenter<br />
Implementation of Employee Kiosks<br />
90% Customer Satisfaction<br />
Redlands Trolley<br />
Access Zone Restructuring<br />
September 2003 Fare Change<br />
Facility Expansion<br />
Trapeze Software Implementation<br />
SRTP Relationship to Other<br />
<strong>Omnitrans</strong> Documents<br />
Annual Management <strong>Plan</strong>, Marketing <strong>Plan</strong>,<br />
Service <strong>Plan</strong> and Budget<br />
Long <strong>Range</strong> <strong>Transit</strong> <strong>Plan</strong><br />
San Bernardino Valley Bus Rapid <strong>Transit</strong> (BRT)<br />
Study<br />
Future <strong>Transit</strong> Investment Study<br />
<strong>Omnitrans</strong> Relationship to Other Agencies<br />
And their documents<br />
Federal and State Agencies<br />
Regional Agencies<br />
County Agencies<br />
Member Cities<br />
Other <strong>Transit</strong> Districts/Transportation<br />
Providers<br />
i
Table of Contents<br />
ii<br />
Section II. System Background..................................................... 19<br />
System Description<br />
Board of Directors<br />
Employees & Contract Employees<br />
Security Measures<br />
<strong>Omnitrans</strong> Website<br />
Major Components of <strong>Omnitrans</strong> Existing<br />
Capital Facilities<br />
Revenue Vehicles<br />
<strong>Omnitrans</strong> Transfer Centers<br />
Administration, Operations, Yards & Storage<br />
Fares & Interagency Coordination<br />
Transfer and Cooperative Agreements<br />
Section III. Current Performance and Conditions................... 31<br />
Fixed-Route Services<br />
Description of Services<br />
Fare Structure<br />
Rider Profile<br />
System-Wide Performance<br />
ADA Paratransit Service<br />
Omnilink Services<br />
Regional <strong>Transit</strong> Services and <strong>Plan</strong>s<br />
Neighboring <strong>Transit</strong> Providers<br />
Regional Transportation Agencies and <strong>Plan</strong>s<br />
Regional Profile<br />
Area Boundaries<br />
Demographics of the Study Area<br />
Inland Empire Job and Worker Growth<br />
Inland Empire’s Competitive Advantages<br />
Lead to Growth in Blue Collar and Service<br />
Sector Jobs<br />
Growth in Blue Collar and<br />
Non-professional Jobs<br />
Growth in High Paying Professional<br />
Service Jobs<br />
Community Specific Effect of Economic<br />
Change on Population, Employment<br />
Growth, and <strong>Transit</strong> Use<br />
Regional Conditions Report<br />
Journey to Work<br />
Place of Work<br />
Travel Time to Work<br />
Leave for Work<br />
Mode of Travel
<strong>Transit</strong> Dependence<br />
Federal and State Compliance Information<br />
Environmental Justice<br />
Energy Contingency<br />
ADA Compliance<br />
Section IV. Service Design Guidelines &<br />
Performance Standards.................................................................141<br />
What is <strong>Transit</strong> For?<br />
Overview & Background<br />
Service Design Guidelines Background<br />
Service Development<br />
Evaluation<br />
Budgeting<br />
Public Accountability<br />
Title VI<br />
Goals and Objectives<br />
Introduction<br />
Principles<br />
Service Design Guidelines<br />
Route Network Structure Objective<br />
Productivity Objective<br />
Passengers per Revenue Hour<br />
Seat Utilization<br />
Service Coverage & Minimum Service<br />
Quality Objective<br />
Maximum Occupancy Objective<br />
Service Reliability Objective<br />
Transportation Network Role Objective<br />
New Service Warrants<br />
Fixed Route Bus<br />
Omnilink<br />
Express Bus<br />
Section V. Service <strong>Plan</strong> .................................................................183<br />
Existing Conditions Overview<br />
Financially Constrained Scenario<br />
Service <strong>Plan</strong><br />
Route Changes FY <strong>2006</strong><br />
Resource Requirements<br />
FY04-08 Fare Policy and Implementation<br />
<strong>Plan</strong><br />
Up to Design Guidelines Scenario<br />
Service <strong>Plan</strong><br />
Route Changes<br />
New Routes<br />
iii
Resource Requirements<br />
Financially Unconstrained Scenario –<br />
Fixed Route and Demand Response Services<br />
Service <strong>Plan</strong><br />
Route Changes<br />
New Routes<br />
Resource Requirements<br />
Financially Unconstrained Scenario-<br />
Bus Rapid <strong>Transit</strong> Element<br />
Bus Rapid <strong>Transit</strong><br />
Future <strong>Transit</strong> Demand<br />
Access Service Changes<br />
Observations and Findings<br />
Future Opportunities and<br />
Recommendations<br />
Emergency Preparedness <strong>Plan</strong><br />
Benefits of System Security and Emergency<br />
Preparedness<br />
Section VI. Agency 5-Year Fiscal Picture .................................245<br />
Operating Costs and Service<br />
Farebox Revenues and Passengers<br />
Financially Constrained <strong>Plan</strong><br />
Revenue Sources<br />
Federal Funds<br />
State Funding<br />
Local and Regional Funding<br />
Capital <strong>Plan</strong><br />
Constrained Scenario<br />
Up to Standards Scenario<br />
Unconstrained Scenario<br />
Capital <strong>Plan</strong> Summary & Funding Strategy<br />
Appendix-A: Glossary & Acronyms<br />
Appendix-B: Current Vehicle Listing & Description of Coaches<br />
Appendix-C: Transcenters & Facilities Description Report<br />
Appendix-D: Capital Project Sheets<br />
Appendix-E: Up-to-Design/Unconstrained<br />
Maps and Schedules<br />
Appendix-F: Performance Indicators<br />
Under Separate Cover (available upon request)<br />
Appendix-G: City/County Profiles<br />
Appendix-H: Implementation Strategy<br />
Appendix-I: Public Comments<br />
Existing Conditions Report, Volumes I and II<br />
Table of Contents<br />
iv
Table of Figures<br />
Figure II-1:<br />
Figure II-2:<br />
Figure II-3:<br />
Figure II-4:<br />
Revenue Vehicle and Summary<br />
Fixed-Route & Regional Express<br />
Bus Fares Effective September 2003<br />
Omnilink Bus Fares Effective<br />
September 2003<br />
Access Bus Fares Effective<br />
September 2003<br />
Figure III-1: <strong>Omnitrans</strong> Existing Service Map –<br />
West Valley<br />
Figure III-2: <strong>Omnitrans</strong> Existing Service Map –<br />
East Valley<br />
Figure III-3: Weekday Service Frequency by Route<br />
Figure III-4: Saturday Service Frequency by Route<br />
Figure III-5: Sunday Service Frequency by Route<br />
Figure III-6: <strong>Omnitrans</strong> Fixed Route Services Operating<br />
Data and Performance Indicators<br />
Figure III-7: Map of East Valley Boardings<br />
Figure III-8: Map of West Valley Boardings<br />
Figure III-9: Top 15 Bus Stop Locations<br />
By Boardings<br />
Figure III-10: Weekday Boardings per Line<br />
Figure III-11: Departure Schedule Adherence<br />
Figure III-12: Percent of Arrivals Late by Route<br />
Figure III-13: Weekday Passenger Boardings<br />
By Route<br />
Figure III-14: Weekday Revenue Hours by Route<br />
Figure III-15: Weekday Passengers by Revenue<br />
Hour by Route<br />
Figure III-16: Weekday Revenue Miles by Route<br />
Figure III-17: Weekday Passenger per Revenue<br />
Mile by Route<br />
Figure III-18: Weekday Seat Utilization<br />
by Route (Seat Miles)<br />
Figure III-19: Weekday Operating Cost by Route<br />
Figure III-20:<br />
Figure III-21:<br />
Weekday Operating Ratio by Route<br />
Weekday Cost per Passenger<br />
Boarding by Route<br />
v
Figure III-22: Access Service Days and<br />
Span of Service<br />
Figure III-23: Access Service Fare Policy<br />
Figure III-24: Access Service Passengers<br />
by Category, FY2004<br />
Figure III-25: Access Service Historical Ridership<br />
Trends<br />
Figure III-26: Access Service Historical Comparison- Core &<br />
Non-Core Service<br />
Figure III-27: Access Service Performance<br />
Statistics FY2004<br />
Figure III-28: Access Services Operating Data and<br />
Performance Indicators<br />
Figure III-29: Peer Review Performance Results<br />
FY 2001 – Totals<br />
Figure III-30 Peer Review Performance Results<br />
FY 2001 – Per Unit<br />
Figure III-31: Access Trip Origin/Destination – West Valley<br />
Figure III-32: Access Trip Origin/Destination – East Valley<br />
Figure III-33: Cancellations, No Shows and<br />
On-Time Performance – May 2004<br />
Figure III-34: Major Trip Destinations<br />
Figure III-35: Access Service Ride Time – May 2004<br />
Figure III-36: Omnilink Days & Hours of Service<br />
Effective January 2002<br />
Figure III-37: Omnilink Fare Structure<br />
Effective September 2004<br />
Figure III-38: Omnilink Passengers by Category –<br />
FY 2004<br />
Figure III-39: Omnilink Performance Statistics –<br />
May 2004<br />
Figure III-40: Omnilink Performance Statistics<br />
Figure III-41: HOV Lane Closures<br />
Figure III-42: HOV Connector Projects<br />
Figure III-43: Mixed Flow Freeway Projects<br />
Figure III-44: Population and Employment Density – West<br />
Figure III-45:<br />
Valley<br />
Population and Employment Density – East<br />
Valley<br />
Figure III-46: 2010 Population and Employment Density –<br />
West Valley<br />
Figure III-47: 2010 Population and Employment Density –<br />
East Valley<br />
Table of Contents<br />
vi
Figure III-48: 2015 Population and Employment Density –<br />
West Valley<br />
Figure III-49: 2015 Population and Employment Density –<br />
East Valley<br />
Figure III-50: Largest Projected Growth Industries<br />
Blue Collar & Non-Professional<br />
Occupations 1999-<strong>2006</strong><br />
Figure III-51: Largest Projected Growth<br />
Occupations - Occupations Related<br />
to Blue-Collar Jobs 2001-2008<br />
Figure III-52: Largest Projected Growth<br />
Industries – Professional Service<br />
Sector 1999-<strong>2006</strong><br />
Figure III-53: City of San Bernardino Population<br />
Figure III-54: City of Ontario Population<br />
Figure III-55: Comparison of Workers that Work<br />
and Live in County<br />
Figure III-56: Travel Time to Work<br />
Figure III-57: Leave for Work, West Valley<br />
Figure III-58: Leave for Work, Mid-Valley West<br />
Figure III-59: Leave for Work, Mid-Valley East<br />
Figure III-60: Leave for Work, East Valley<br />
Figure III-61: San Bernardino Valley, Mode<br />
Travel to Work<br />
Figure III-62: Mode of Travel per Work-Trip<br />
Figure III-63: Distribution of Ages per City<br />
Figure III-64: Definition of Poverty<br />
Figure III-65: Percent of Population Living Below<br />
the Poverty Line<br />
Figure III-66: Available Vehicles per Household<br />
Figure III-67: Correlation between Poverty and<br />
Vehicle Ownership<br />
Figure III-68: Low Income & Minority Populations,<br />
West Valley Beyond 15-Minute <strong>Omnitrans</strong> Service<br />
Figure III-69: Low Income & Minority Populations,<br />
East Valley Beyond 15-Minute <strong>Omnitrans</strong> Service<br />
Figure III-70: Low Income & Minority Populations,<br />
West Valley Beyond 30-Minute <strong>Omnitrans</strong> Service<br />
Figure III-71: Low Income & Minority Populations,<br />
East Valley Beyond 30-Minute <strong>Omnitrans</strong> Service<br />
Figure III-72: Low Income & Minority Populations,<br />
West Valley Beyond 60-Minute <strong>Omnitrans</strong> Service<br />
vii
Figure III-73:<br />
Figure III-74:<br />
Figure III-75:<br />
Figure III-76:<br />
Figure III-77:<br />
Figure IV-1:<br />
Figure IV-2:<br />
Figure IV-3:<br />
Figure IV-4:<br />
Figure IV-5:<br />
Figure IV-6:<br />
Figure IV-7:<br />
Figure IV-8:<br />
Figure IV-9:<br />
Figure IV-10:<br />
Figure IV-11:<br />
Figure IV-12:<br />
Figure IV-13:<br />
Figure IV-14:<br />
Figure IV-15:<br />
Figure IV-16:<br />
Low Income & Minority Populations,<br />
East Valley Beyond 60-Minute <strong>Omnitrans</strong> Service<br />
Headways, East Valley<br />
LIM and Non-LIM Populations<br />
Served by <strong>Omnitrans</strong><br />
Percentage of LIM and Non-LIM<br />
Populations near <strong>Omnitrans</strong> Bus Stop<br />
Amenities<br />
Bus stops, Benches, and Shelters – East Valley<br />
Bus stops, Benches, and Shelters – West Valley<br />
Proposed Minimum Average Distance<br />
Based Utilization Standards for Bus<br />
Services<br />
Proposed Minimum Average Time<br />
Based Utilization Standards for Bus<br />
Service<br />
Span of Service Guidelines<br />
Residential <strong>Transit</strong> Orientation Index – West Valley<br />
Residential <strong>Transit</strong> Orientation Index – East Valley<br />
Span of Service, East Valley,<br />
Weekdays, AM<br />
Span of Service, East Valley,<br />
Weekdays, PM<br />
Span of Service, East Valley,<br />
Saturdays, AM<br />
Span of Service, East Valley,<br />
Saturdays, PM<br />
Span of Service, East Valley,<br />
Sundays, AM<br />
Span of Service, East Valley,<br />
Sundays, PM<br />
Span of Service, West Valley,<br />
Weekdays, AM<br />
Span of Service, West Valley,<br />
Weekdays, PM<br />
Span of Service, West Valley,<br />
Saturdays, AM<br />
Span of Service, West Valley,<br />
Saturdays, PM<br />
Span of Service, West Valley,<br />
Sundays, AM<br />
Table of Contents<br />
viii
Figure IV-17: Span of Service, West Valley,<br />
Sundays, PM<br />
Figure IV-18: Stop Spacing Analysis, FY 2004<br />
Figure IV-19: Minimum Square Feet of Floor Space<br />
Per Standing Passenger<br />
Figure IV-20: Seats and Standing Areas by<br />
Bus Type<br />
Figure IV-21: Maximum Passenger Occupancy<br />
By Bus Type, Time Period and<br />
Number of Wheelchairs<br />
Figure V-1: Existing FY 2005 Bus Service Hours<br />
By Route and Division<br />
Figure V-2: Existing FY 2005 Bus Service Miles<br />
By Route and Division<br />
Figure V-3: Financially Constrained Scenario<br />
West Valley Service Map<br />
Figure V-4: Financially Constrained Scenario<br />
East Valley Service Map<br />
Figure V-5: Weekday FY <strong>2006</strong> Service Frequency<br />
By Route<br />
Figure V-6: Saturday FY <strong>2006</strong> Service Frequency<br />
By Route<br />
Figure V-7: Sunday FY <strong>2006</strong> Service Frequency<br />
By Route<br />
Figure V-8: Fleet Requirements, Financially<br />
Constrained Scenario<br />
Figure V-9: Financially Constrained FY <strong>2006</strong> Bus<br />
Service Hours and Peak Fleet by Route<br />
and Division<br />
Figure V-10: Financially Constrained FY <strong>2006</strong> Bus<br />
Service Miles by Route and Division<br />
Figure V-11: Proposed Fare Structure Changes<br />
(Fixed Route)<br />
Figure V-12: Proposed Fare Structure Changes<br />
(Access and Omnilink)<br />
Figure V-13: Up to Design Scenario FY <strong>2006</strong><br />
West Valley Service Map<br />
Figure V-14: Up to Design Scenario FY <strong>2006</strong><br />
East Valley Service Map<br />
Figure V-15: Up to Design Scenario FY <strong>2006</strong><br />
Weekday Service Frequency<br />
ix
Figure V-16: Up to Design Scenario FY <strong>2006</strong><br />
Saturday Service Frequency<br />
Figure V-17: Up to Design Scenario FY <strong>2006</strong><br />
Sunday Service Frequency<br />
Figure V-18: Up to Design Scenario FY <strong>2006</strong><br />
Hours and Miles<br />
Figure V-19: Financially Unconstrained Scenario<br />
FY <strong>2006</strong> West Valley Service Map<br />
Figure V-20: Financially Unconstrained Scenario<br />
FY <strong>2006</strong> East Valley Service Map<br />
Figure V-21: Financially Unconstrained Scenario<br />
FY <strong>2006</strong> Weekday Service Frequencies<br />
By Route and Division<br />
Figure V-22: Financially Unconstrained Scenario<br />
FY <strong>2006</strong> Saturday Service Frequencies<br />
By Route and Division<br />
Figure V-23: Financially Unconstrained Scenario<br />
FY <strong>2006</strong> Sunday Service Frequencies<br />
By Route and Division<br />
Figure V-24: Financially Unconstrained Scenario FY <strong>2006</strong><br />
Hours and Miles<br />
Figure V-25: Candidate BRT Corridors<br />
Figure V-26: Candidate BRT Corridors (map)<br />
Figure V-27: Access Service – Hours by Scenario<br />
Figure VI-1: Revenue Service Hours<br />
Figure VI-2: Operation Costs<br />
Figure VI-3: Operating Costs per Revenue Hour<br />
Figure VI-4: Passengers<br />
Figure VI-5: Passengers per Revenue Hour<br />
Figure VI-6: Farebox Revenues<br />
Figure VI-7a: Operating Ratio – General Public Service<br />
Figure VI-7b: Operating Ratio – Specialized Service<br />
Figure VI-8a: Financially Constrained <strong>Plan</strong><br />
Figure VI-8: LTF Requirements for the Financially<br />
Constrained <strong>Plan</strong><br />
Figure VI-9: Performance Indicators by Service Type –<br />
Financially Constrained <strong>Plan</strong><br />
Figure VI-10: State <strong>Transit</strong> Assistance Funding<br />
(STAF) Flow<br />
Figure VI-11: How Local Transportation Funding<br />
(LTF) Flows<br />
Figure VI-12: Summary of Revenue Sources<br />
Table of Contents<br />
x
Figure VI-13: Fleet Requirements, Financially<br />
Constrained Scenario<br />
Figure VI-14: Paratransit/Demand Response Vehicle<br />
Requirements<br />
Figure VI-15: Support Vehicle Requirements<br />
Figure VI-16: Six-Year Capital <strong>Plan</strong> – Constrained <strong>Plan</strong><br />
Figure VI-17: Revenues for the Six-Year Capital <strong>Plan</strong><br />
Figure VI-18: Discretionary Funding<br />
Figure VI-19: Six-Year Capital <strong>Plan</strong> –<br />
Up to Standards<br />
Figure VI-20: Six Year Capital <strong>Plan</strong> –<br />
Unconstrained<br />
xi
Section I: Introduction<br />
Reduce your plan to<br />
writing. The moment you<br />
complete this, you will<br />
have definitely given<br />
concrete form to the<br />
intangible desire.<br />
- Napoleon Hill
Introduction<br />
<strong>Omnitrans</strong> is the largest transit operator within San<br />
Bernardino County. The agency was established in 1976<br />
through a Joint Powers Agreement and today includes 15<br />
cities and portions of the unincorporated area of San<br />
Bernardino County. In addition to the southwestern corner<br />
of San Bernardino County, <strong>Omnitrans</strong> provides service to<br />
parts of Riverside and Los Angeles Counties. <strong>Omnitrans</strong><br />
currently carries about 17 million passengers per year, and<br />
although the system has enjoyed strong growth in recent<br />
years the trend has leveled off and ridership has actually<br />
declined slightly in the most recent 24-month period.<br />
<strong>Omnitrans</strong> currently operates 34 fixed routes as well as a<br />
general public dial-a-ride service, “Omnilink”, and a<br />
paratransit service for the disabled, “Access.”<br />
The Inland Empire region – and San Bernardino County, in<br />
particular – is one of the fastest growing regions in<br />
California. This presents several challenges for <strong>Omnitrans</strong>,<br />
particularly in the current environment of constrained<br />
financial resources. The growth in population and jobs is<br />
matched with increasing roadway congestion. Some parts<br />
of the service area are seeing an increase in densities, which<br />
facilitates the provision of transit service. However sprawling,<br />
auto-oriented development continues to be the dominant<br />
form of growth. In the west there are strong and growing<br />
linkages to Los Angeles County, while in the south and east<br />
the linkages to Riverside County are dominant.<br />
1
<strong>Omnitrans</strong> Mission/Vision<br />
Each year, the Management <strong>Plan</strong>’s goals and objectives are<br />
reviewed and updated to identify what will enhance overall<br />
system performance. The mission statement for <strong>Omnitrans</strong><br />
generally helps guide the agency and gives a picture of what<br />
drives employees on a daily basis:<br />
“To provide the San Bernardino Valley with comprehensive<br />
public mass transportation services which maximize<br />
customer use, comfort, safety, and satisfaction while<br />
efficiently using financial and other resources, in an<br />
environmentally sensitive manner.”<br />
In addition to the mission, the vision for 2015 helps<br />
determine the annual goals and objectives that the agency<br />
strives toward, and helps provide the framework for<br />
documents, such as the SRTP, which are created not only to<br />
meet mandates at the federal, state, and local levels, but also<br />
to give the agency direction and plans for the future.<br />
Vision for 2015<br />
<strong>Omnitrans</strong> is accepted by the public as the prime<br />
provider of quality transportation service.<br />
<strong>Omnitrans</strong> is one of the best places of employment in<br />
the Inland Empire.<br />
<strong>Omnitrans</strong> is recognized in our industry as an<br />
innovative leader in providing transportation services.<br />
<strong>Omnitrans</strong> ensures that there are adequate resources<br />
to achieve our visions.<br />
Purpose of the SRTP<br />
Aside from legal requirements, the objective of this <strong>Short</strong><br />
<strong>Range</strong> <strong>Transit</strong> <strong>Plan</strong> (SRTP) is to provide a plan to guide the<br />
development of <strong>Omnitrans</strong> from <strong>2006</strong> to <strong>2011</strong>. This plan<br />
reviews the current regional environment, performance of<br />
the system and the status of its plant and equipment. The<br />
plan sets out service design guidelines that provide a policy<br />
basis for evaluating existing service and designing new<br />
services. The operations plan, capital plan, financial plan and<br />
Section I<br />
Introduction<br />
2
implementation plan are designed to guide development of<br />
the agency over the next six years.<br />
This document is designed to be a tool to assist in the daily<br />
operation, planning, financing and management of the<br />
transit system. Over the course of the implementation<br />
period it is possible that events may arise that were not<br />
foreseen at the time the plan was written.<br />
Recent Events and Accomplishments<br />
Over the past four years, <strong>Omnitrans</strong> has worked to improve<br />
the services it provides to the public, while remaining as costefficient<br />
and environmentally sound as possible. Blending<br />
these three goals is not always an easy task to accomplish,<br />
however, each year we work towards this with the well<br />
defined goals and objectives we have in place. The<br />
following items by no means describe each and every<br />
accomplishment and event that have occurred in the past<br />
four years, but focuses on some of the highlights.<br />
East Valley and West Valley LCNG Stations<br />
<strong>Omnitrans</strong> began operation of both its new, odorless<br />
liquefied compressed natural gas (LCNG) fueling stations at<br />
the San Bernardino and Montclair operations facilities by<br />
June 2002. The stations fuel the agency's alternatively<br />
fueled fleet of more than 100 buses. The east valley station<br />
houses two 30,000 gallon, double-walled storage tanks and<br />
the west valley station houses a 20,000 gallon double-walled<br />
storage tank. The tanks store liquefied natural gas (LNG) at -<br />
250 degrees Fahrenheit, using vacuum pressure and<br />
insulation to keep the fuel cold. As needed, the liquid is<br />
pumped out of the tanks and passed through a vaporizer,<br />
which changes the fuel from a liquid to compressed gas<br />
state for transfer to the bus fuel tanks. In order to keep up<br />
with approximately 11,000 gallons of fuel demand daily, and<br />
to ensure that tanks are "topped off," LNG is delivered to the<br />
facility six days per week via tanker truck.<br />
<strong>Omnitrans</strong><br />
San Bernardino Facility<br />
LCNG Storage<br />
3
Environmental Review of <strong>Omnitrans</strong> Facilities<br />
In March 2004, Komex H2O Science completed a study to<br />
evaluate any potential environmental and health impacts of<br />
<strong>Omnitrans</strong>' three fueling facilities, located at 1700 W. Fifth<br />
Street, 234 South I Street in San Bernardino, and 4748 Arrow<br />
Hwy. in Montclair. The study was mandated by legislation<br />
(SB1927) authored by State Senator Nell Soto, and its<br />
purpose was to determine whether or not <strong>Omnitrans</strong>’<br />
fueling facilities pose a health threat to surrounding<br />
neighborhoods. It was found that the risk from <strong>Omnitrans</strong><br />
does not exceed risk management guidelines set out by the<br />
United States Environmental Protection Agency and the<br />
California Environmental Protection Agency.<br />
Hybrid Vehicles<br />
In November 2002, <strong>Omnitrans</strong> put the nation’s first<br />
electric/gasoline hybrid transit bus into service. Since then,<br />
an additional bus has become operational, and the final of<br />
the three hybrid buses is being tested. The bus utilizes the<br />
latest in alternative fuel technology to drastically cut smogproducing<br />
emissions.<br />
<strong>Omnitrans</strong> was the first<br />
transit agency in the nation<br />
to put a hybrid<br />
electric/gasoline vehicle into<br />
service in 2002<br />
The <strong>Omnitrans</strong> hybrid buses are the first in the United States<br />
to feature the ISE Research ThunderVolt TB40-H drive<br />
system, combining unleaded gasoline with electricity instead<br />
of diesel or compressed natural gas (CNG) fuel. According to<br />
a study conducted by the California Air Resources Board, this<br />
combination provides a significant reduction in smogproducing<br />
emissions, over and above both diesel and<br />
comparable alternatively-fueled vehicles. The final vehicle<br />
currently being tested has been awarded the Air Resources<br />
Board’s first – and only – non-diesel hybrid certification for<br />
use as an alternative fuel system in California’s transit<br />
vehicles. Simply replacing one diesel bus with another that<br />
utilizes the Siemens-ISE-Ford ThunderVolt hybrid system (as<br />
<strong>Omnitrans</strong>’ does) has the same effect on emissions as<br />
removing more than 200 cars per year from the road.<br />
The Board’s certification opens the door to the widespread<br />
use of this electric/gasoline hybrid system, which combines<br />
unleaded gasoline with electricity instead of diesel or<br />
compressed natural gas (CNG). This combination has proven<br />
to create the lowest emission system of any type for a 40-foot<br />
Section I<br />
Introduction<br />
4
vehicle. In terms of nitrous oxides (NOx) emissions, for<br />
example, <strong>Omnitrans</strong>’ electric/gasoline hybrid bus releases 4<br />
grams per mile, compared to 30 grams per mile for a diesel<br />
bus and 14.34 grams for a CNG bus.<br />
Similarly, when measuring particulate matter (PM) emissions,<br />
<strong>Omnitrans</strong>’ electric/gasoline hybrid bus releases NO<br />
measurable particulate matter, in comparison to nearly 0.25<br />
grams per mile of emissions from a diesel bus, and 0.03<br />
grams for a CNG bus.<br />
Bus Rapid <strong>Transit</strong> Major Investment Study<br />
In response to the community’s growth and the increasing<br />
demand for faster, more convenient transit service,<br />
<strong>Omnitrans</strong> is in the process of implementing a Bus Rapid<br />
<strong>Transit</strong> (BRT) system. A BRT system is based on a light-rail<br />
transit principle, but instead of trains and tracks, it uses buses<br />
that are integrated with key components of the automobile<br />
transportation infrastructure, such as roads and right-of-way,<br />
intersections, and traffic signals. Our first step to incorporate<br />
the technologies is to conduct a comprehensive Major<br />
Investment Study of the E Street Corridor. This Study which<br />
began in Fiscal Year 2003, is scheduled for completion in<br />
Fiscal Year <strong>2006</strong>.<br />
Future <strong>Transit</strong> Investment Study<br />
A Future <strong>Transit</strong> Investment Study (FTIS) was created in fiscal<br />
year 2003 to develop transit, and related funding, to meet<br />
the needs of the growing number of people and jobs in the<br />
San Bernardino Valley. The FTIS includes programs designed<br />
to accommodate the expected population and employment<br />
growth, and an increasingly aging population. It was also<br />
the first step to identifying the future BRT corridors for the<br />
San Bernardino Valley. The renewal of Measure I in<br />
November 2004 was the necessary step to making this study<br />
a reality.<br />
Bus Rapid <strong>Transit</strong> (BRT) in<br />
Brazil. <strong>Omnitrans</strong> is looking<br />
into a similar BRT system for<br />
the San Bernardino Valley.<br />
Fontana <strong>Transit</strong> Center Expansion<br />
In fiscal year 2003, <strong>Omnitrans</strong>, in coordination with the City<br />
of Fontana, completed a renovation and expansion of the<br />
Fontana <strong>Transit</strong> Center, located at Orange Way and Sierra<br />
Avenue in the City of Fontana. The renovation/expansion<br />
added 4 bus bays and permits easier transfers between bus<br />
routes and Metrolink, as now all bus transfers occur within<br />
5
the Center, and not on the adjacent streets. More<br />
information on this transcenter can be found in Appendix C.<br />
Chino/Ontario Agricultural Preserve <strong>Transit</strong> <strong>Plan</strong><br />
In fiscal year 2004, <strong>Omnitrans</strong>, the City of Chino, and the City<br />
of Ontario were awarded a grant by Caltrans to develop a<br />
specific transportation plan for the newly developing<br />
Agricultural Preserve areas of Chino and Ontario. This area<br />
in particular presents a unique opportunity in that it is the<br />
largest undeveloped area left in Southern California. By<br />
integrating transit into the design initially, a community can<br />
be built around multiple modes of transportation, rather<br />
than just the automobile, giving the residents the<br />
opportunity to choose how they like to travel, rather than<br />
restrict them to the automobile.<br />
The benefits of performing the transit planning tasks before<br />
development goes in is that the infrastructure that needs to<br />
be in place to support transit such as right-of-way,<br />
easements, sidewalks, curb cuts and bus turnouts can be<br />
planned and designed during the development review<br />
period and the engineering phase rather than after the fact.<br />
Advanced planning will result in fewer costs to the agencies<br />
involved and more expeditious delivery of service to the<br />
occupants of the area.<br />
Chino <strong>Transit</strong> Center<br />
Construction of the Chino <strong>Transit</strong> Center was completed in<br />
January 2005. This facility is located on Sixth Street in<br />
between Chino Avenue and “D” Street. There are seven bus<br />
bays with shelters, information kiosks, and a Coach Operator<br />
restroom facility. In February, Foothill <strong>Transit</strong> Line 497 started<br />
providing service from the Chino <strong>Transit</strong> Center, to the Chino<br />
Park-and-Ride, City of Industry Park-and-Ride, and<br />
Downtown Los Angeles. Future transit operators that may<br />
stop at this facility include Orange County Transportation<br />
Authority (OCTA) and Riverside <strong>Transit</strong> Agency (RTA). Rail<br />
service has also been identified as a possibility linking the<br />
<strong>Transit</strong> Center to the Pomona Metrolink Station to the north<br />
along an existing rail spur. More information on this<br />
transcenter can be found in Appendix C.<br />
Section I<br />
Introduction<br />
6
Implementation of Employee Kiosks<br />
During Fiscal Year 2004, <strong>Omnitrans</strong> undertook the goal of<br />
employee retention and promotion through a two part<br />
program, the first being the implementation of Employee<br />
Kiosks throughout the agency. Funded by a grant from the<br />
Workforce Investment Act, <strong>Omnitrans</strong> worked closely with<br />
the County of San Bernardino Jobs and Employment Services<br />
and Workforce Investment Board to develop an interactive<br />
system of kiosks available throughout its facilities. The kiosks<br />
offer the opportunity for employees, who may be out of the<br />
office during normal business hours (8:00 a.m. to 5:00 p.m.)<br />
to communicate with administrative staff, and also to<br />
investigate promotional opportunities available within the<br />
agency and through educational advancement. Interest has<br />
been shown at the State and Federal levels in the program<br />
that was developed, and <strong>Omnitrans</strong> is being looked at for<br />
the success we have with the program. After the program<br />
period is completed in January 2005, an evaluation will be<br />
done to determine if it can be emulated in other Agencies<br />
nationwide.<br />
90% Customer Satisfaction<br />
In February, 2004 <strong>Omnitrans</strong> customers gave the transit<br />
agency their seal of approval in a recent Attitude and<br />
Awareness Study, more than nine in ten riders gave<br />
<strong>Omnitrans</strong> a positive performance rating. Since the agency<br />
earned its first 90 percent customer satisfaction rating in its<br />
2000 Awareness Study, this is its second consecutive<br />
customer service milestone.<br />
Redlands Trolley<br />
In coordination with the City of Redlands, <strong>Omnitrans</strong> began<br />
operation of the Redlands Trolley in September 2003. This<br />
trial program was made possible through grants from the<br />
Federal <strong>Transit</strong> Administration 5309 program and<br />
Congestion Mitigation and Air Quality Program. Three<br />
trolley-replica’s were purchased and circulate through the<br />
City of Redlands. This program has been a welcome addition<br />
to the city and will remain in demonstration through<br />
September <strong>2006</strong>, at which time it will be evaluated for<br />
continuation using regular operating funds.<br />
7
Access Zone Restructuring<br />
Also in September 2003, in conjunction with a fare change,<br />
the Access Zone system was simplified from 39 small zones<br />
to 6 large ones. This change not only simplifies riding the<br />
system for passengers, but also for dispatchers and drivers,<br />
who need to determine the correct fare payment.<br />
September 2003 Fare Change<br />
In September 2003, a fare change was implemented. It had<br />
been 4 years since the previous fare structure was put in<br />
place. Within the four years, the cost of providing transit<br />
services for <strong>Omnitrans</strong> increased to a point that it was no<br />
longer possible to obtain 20% of the cost of providing the<br />
trips from passengers (commonly referred to as farebox<br />
recovery). This 20% “farebox recovery” is a mandate at the<br />
State level in order to continue to receive operating and<br />
capital funds. The fare change also eliminated the 10-trip<br />
pass, but added a new 7-day pass to the system. In addition,<br />
the standard for children riding free was changed, so that it<br />
is no longer age based (previously it was 2 children under 4<br />
years of age rode free with a paying adult), but height<br />
based. Children under 46” now ride free. This simplified the<br />
boarding and payment procedures for both the coach<br />
operators and passengers.<br />
Facility Expansion<br />
In March 2003, new office space was created at the<br />
<strong>Omnitrans</strong> Montclair Facility. This expansion was necessary<br />
to accommodate the growth that has occurred in the west<br />
end of <strong>Omnitrans</strong> service area, and necessary staff additions<br />
to meet this growth. With a complete overhaul, new office<br />
space, dispatch office, drivers lounge, workout room, and<br />
kitchen were created. Prior to the expansion, many spaces<br />
had to perform double duty. Additional expansions are<br />
planned in the coming years, as the future mid-valley facility<br />
in Rancho Cucamonga becomes funded and additional<br />
space is required at <strong>Omnitrans</strong> East Valley facility in San<br />
Bernardino.<br />
Trapeze Software Implementation<br />
In Fiscal Year 2004, <strong>Omnitrans</strong> began the process of<br />
upgrading its existing radio system to a more sophisticated<br />
and useful voice-data radio communication system. The<br />
existing radio system for the paratransit fleet, installed in<br />
Section I<br />
Introduction<br />
8
1987 and the fixed route fleet, installed in 1994 have<br />
become outdated and unreliable, and do not have the<br />
functionality that is possible with the use of current<br />
communications technologies. In addition, the system is no<br />
longer supported, as the manufacturer is no longer in the<br />
transit market. The new system will assist in operating<br />
efficiencies, ensure appropriate emergency response and full<br />
compliance with the provisions of the Americans with<br />
Disabilities Act (ADA) and provide valuable data that can be<br />
used to analyze performance and usage. Installation of the<br />
new system is expected to be completed in late fiscal year<br />
2005/early fiscal year <strong>2006</strong>.<br />
SRTP Relationship to Other<br />
<strong>Omnitrans</strong> Documents<br />
Annual Management <strong>Plan</strong>, Marketing <strong>Plan</strong>, Service <strong>Plan</strong>,<br />
and Budget<br />
The FY05 Annual Management <strong>Plan</strong>, Marketing <strong>Plan</strong>, Service<br />
<strong>Plan</strong>, and Budget were presented and adopted by the Board<br />
of Directors in June 2004, prior to the start of the 2005 Fiscal<br />
Year on July 1, 2004. The FY05 Management <strong>Plan</strong> provides<br />
the basis for the operations and financial outlook of the<br />
future, which then in turn, allows future year budget<br />
decisions to be made within a long-term context. The SRTP<br />
includes a detailed analysis of revenue and expense<br />
components related to the annual operating budget, as well<br />
as a picture of how these components will translate into<br />
service on the street.<br />
Long <strong>Range</strong> <strong>Transit</strong> <strong>Plan</strong><br />
Currently, the San Bernardino Associated Governments is<br />
preparing a Long <strong>Range</strong> <strong>Transit</strong> <strong>Plan</strong> (LRTP). The LRTP serves<br />
as a blueprint that guides San Bernardino's transportation<br />
development over a 25-30 year period, and this document,<br />
the SRTP, will feed critical information about <strong>Omnitrans</strong> and<br />
its operations to the LRTP. Central to that blueprint is the<br />
protection of the value of investments already made in<br />
developing the transportation system, while providing<br />
resources to pursue innovative solutions to mobility<br />
constraints and enhancing travel choices available. The LRTP<br />
specifically looks at major transportation planning concerns<br />
9
such as environmental/air quality; complete access to<br />
transportation; alternative transportation modes (e.g., air,<br />
rail, water, bicycle, pedestrian); the impact of land<br />
development on the transportation system; highway<br />
congestion; and maintenance of the existing infrastructure.<br />
Since 1990, several changes in federal legislation have had a<br />
substantial impact on how Metropolitan <strong>Plan</strong>ning<br />
Organizations (MPOs), SANBAG, and local transit providers,<br />
such as <strong>Omnitrans</strong>, conduct transportation planning. These<br />
include the Clean Air Act Amendments (CAAA) of 1990, the<br />
Americans with Disabilities Act (ADA) of 1990, the<br />
Intermodal Transportation Efficiency Act (ISTEA) of 1991 and<br />
the Transportation Equity Act for the 21st Century (TEA-21)<br />
of 1998. Collectively, this legislation addresses such major<br />
urban transportation planning concerns as:<br />
Environmental quality;<br />
Access to transportation;<br />
Alternative transportation modes;<br />
The transportation - land use linkage; and<br />
Highway traffic congestion and maintenance of the<br />
existing transportation infrastructure.<br />
As previously stated, changes in legislation, changes in our<br />
communities, and changes in transportation priorities direct<br />
the planning focus of agencies such as SANBAG and<br />
<strong>Omnitrans</strong> to these new areas of concern, and thus requires<br />
a dynamic vision of the Long-<strong>Range</strong> Transportation <strong>Plan</strong>. In<br />
the preparation of the LRTP, we will be examining and<br />
considering any changes in the current and forecasted<br />
transportation and land use conditions and trends.<br />
Rendering of a Bus Rapid<br />
<strong>Transit</strong> vehicle<br />
San Bernardino Valley Bus Rapid <strong>Transit</strong> (BRT) Study<br />
As the name implies, Bus Rapid <strong>Transit</strong> (BRT) is an enhanced<br />
transit system where speed and convenience of the<br />
customer is a priority. Along major streets, or corridors,<br />
where current transit systems simply do not meet the<br />
growing demand for service, BRT is an option that can speed<br />
up the system, provide more frequent service for patrons,<br />
and can provide more comfortable, energy efficient vehicles.<br />
BRT combines the quality of rail transit and the flexibility of<br />
buses. It can operate on exclusive transitways, HOV lanes,<br />
expressways, or ordinary streets. A BRT system combines<br />
intelligent transportation systems technology, priority for<br />
Section I<br />
Introduction<br />
10
transit, cleaner and quieter vehicles, rapid and convenient<br />
fare collection, and integration with land use policy.<br />
While many different corridors have been identified for BRT<br />
in the future, <strong>Omnitrans</strong> is currently undergoing a Major<br />
Investment Study of the E Street corridor through San<br />
Bernardino and Loma Linda for its first BRT. This corridor is<br />
currently served by <strong>Omnitrans</strong> Route 2, at 15 minute<br />
intervals, and provides connections to many key destinations<br />
in the San Bernardino Valley along the way. This BRT<br />
corridor is planned for implementation in 2010.<br />
As the SRTP covers from <strong>2006</strong>-<strong>2011</strong>, it is critical that it include<br />
the necessary elements to assure that the BRT can be<br />
funded, and the service it will provide integrated with the<br />
regular fixed route bus lines that <strong>Omnitrans</strong> currently<br />
operates. More information on the BRT can be found in<br />
Section V: Service <strong>Plan</strong>.<br />
Future <strong>Transit</strong> Investment Study<br />
The Future <strong>Transit</strong> Investment Study was undertaken during<br />
fiscal year 2003 and fiscal year 2004. Its’ purpose was to<br />
identify a program of projects and services that need to be<br />
funded over the next 30-years, partially from Measure I<br />
revenues. On November 2, 2004 80.03% of county voters<br />
approved continuation of Measure I, the half-cent sales tax<br />
for transportation improvements. This renewal provided<br />
<strong>Omnitrans</strong> with the opportunity to shape transit funding for<br />
the next generation. Many of the recommendations in the<br />
Future <strong>Transit</strong> Investment Study, including senior transit and<br />
bus rapid transit (BRT) were included with the Measure I<br />
renewal package, and therefore need to be incorporated<br />
into the SRTP for implementation in the near future.<br />
11
<strong>Omnitrans</strong> Relationship to Other<br />
Agencies and their documents<br />
Federal and State Agencies<br />
Federal <strong>Transit</strong> Administration<br />
The Federal <strong>Transit</strong> Administration (FTA) is the primary<br />
federal entity with which <strong>Omnitrans</strong> has relations, and which<br />
is under the umbrella of the United States Department of<br />
Transportation (USDOT). The FTA has review authority over<br />
the federal environmental documentation produced on<br />
<strong>Omnitrans</strong> projects. Also, a large portion of the capital grant<br />
funding programmed to <strong>Omnitrans</strong> passes through the<br />
FTA’s accounts. Many of these programming decisions are<br />
made at a regional or county level (see below) with follow<br />
up grant applications and paperwork sent to the FTA. More<br />
information about the USDOT can be found on their web<br />
page at www.dot.gov. Similarly, the FTA web page is at<br />
www.fta.dot.gov.<br />
California Transportation Commission<br />
At the State level, the primary decision making body on the<br />
funding of capital projects is the California Transportation<br />
Commission (CTC), although the Governor and the State<br />
Legislature occasionally have a direct impact on the funding<br />
of transportation projects. The CTC was created in 1978 and<br />
is responsible for the programming and allocating of funds<br />
for the construction of highway, passenger rail and transit<br />
improvements throughout California. The CTC adopts the<br />
State <strong>Transit</strong> Improvement Program (STIP) – which details all<br />
agency expenditures over the next 5 years - on a biannual<br />
basis. Every change that is made to <strong>Omnitrans</strong> capital and<br />
operating programs must ultimately be approved by the<br />
CTC, before it can be included in a grant that goes to the<br />
FTA. More information can be obtained about the CTC on<br />
their web site at www.catc.ca.gov.<br />
Caltrans<br />
The California Department of Transportation, otherwise<br />
known as Caltrans, is mostly known for its involvement in<br />
streets and roads projects. However, Caltrans also acts as<br />
staff to implement the actual programming, transfer and<br />
Section I<br />
Introduction<br />
12
monitoring of grant funded projects decided upon by the<br />
CTC for transit. <strong>Omnitrans</strong> is located within Caltrans District<br />
8. Caltrans website is located at www.dot.ca.gov.<br />
Regional Agencies<br />
Southern California Association of Governments<br />
The Southern California Association of Governments (SCAG)<br />
has been operated by the cities and counties of Imperial, Los<br />
Angeles, Orange, Riverside, Ventura, and San Bernardino for<br />
the past three decades. SCAG is the largest of nearly 700<br />
councils of government in the United States, functioning as<br />
the Metropolitan <strong>Plan</strong>ning Organization for these six<br />
counties. The region encompasses a population exceeding<br />
15 million persons in an area of more than 38,000 square<br />
miles.<br />
As the designated Metropolitan <strong>Plan</strong>ning Organization,<br />
SCAG researches and draws up plans for transportation,<br />
growth management, hazardous waste management, and<br />
air quality. More information about SCAG can be found at<br />
www.scag.ca.gov.<br />
Southern California Air Quality Management District<br />
The Southern California Air Quality Management District<br />
(AQMD) is the air pollution control agency for all of Orange<br />
County and the urban portions of Los Angeles, Riverside and<br />
San Bernardino counties. This area of 10,000 square miles is<br />
home to nearly 16 million people - about half the population<br />
of the whole state of California.<br />
AQMD is responsible for controlling emissions from<br />
stationary sources of air pollution as well as mobile sources<br />
of pollution, such as buses. Guided by State and federal<br />
laws that require this area to meet existing clean air<br />
standards by the year 2010, AQMD has implemented Rule<br />
1192, which requires public transit fleet operators with 15 or<br />
more vehicles to acquire alternative fuel heavy-duty vehicles<br />
when procuring or leasing these vehicles to reduce air toxic<br />
and criteria pollutant emissions. In addition, AQMD provides<br />
incentive funding through grant programs to procure<br />
alternative fuel vehicles. More information can be found on<br />
the AQMD at www.aqmd.gov.<br />
13
County Agencies<br />
San Bernardino Associated Governments<br />
San Bernardino Associated Governments (SANBAG) is the<br />
council of governments and transportation planning agency<br />
for San Bernardino County. SANBAG is responsible for<br />
cooperative regional planning and furthering an efficient<br />
multi-modal transportation system countywide. SANBAG<br />
serves the 1.8 million residents of San Bernardino County.<br />
As the County Transportation Commission, SANBAG<br />
supports freeway construction projects, regional and local<br />
road improvements, train and bus transportation, railroad<br />
crossings, call boxes, ridesharing, congestion management<br />
efforts and long-term planning studies. More information can<br />
be found about SANBAG by reviewing their website at<br />
www.sanbag.ca.gov.<br />
County of San Bernardino<br />
The County of San Bernardino provides for the health, safety,<br />
well being, and quality of life of its residents. The County also<br />
holds five seats on the <strong>Omnitrans</strong> Board of Directors. Its<br />
array of services directly link with <strong>Omnitrans</strong> services because<br />
the services it provides often impact, and are impacted by,<br />
the services <strong>Omnitrans</strong> has available for the resident. More<br />
information can be found about the County and its services<br />
at www.sbcounty.gov.<br />
Section I<br />
Introduction<br />
14
Member Cities<br />
Each <strong>Omnitrans</strong> member city holds a seat on the <strong>Omnitrans</strong><br />
Board of Directors. As the population grows, and city<br />
populations expand, <strong>Omnitrans</strong> needs to help meet the<br />
transportation needs of each city’s residents. <strong>Omnitrans</strong><br />
works closely with each city, monitoring new developments,<br />
environmental reviews, and general plan updates, to assure<br />
that there is a transit component that is considered through<br />
the review processes.<br />
Member cities include:<br />
City of Chino<br />
City of Chino Hills<br />
City of Colton<br />
City of Fontana<br />
City of Grand Terrace<br />
City of Highland<br />
City of Loma Linda<br />
City of Montclair<br />
City of Ontario<br />
City of Rancho Cucamonga<br />
City of Redlands<br />
City of Rialto<br />
City of San Bernardino<br />
City of Upland<br />
City of Yucaipa<br />
www.cityofchino.org<br />
www.chinohills.org<br />
www.ci.colton.ca.us<br />
www.fontana.org<br />
www.cityofgrandterrace.org<br />
www.ci.highland.ca.us<br />
www.ci.loma-linda.ca.us<br />
www.ci.montclair.ca.us<br />
www.ci.ontario.ca.us<br />
www.ci.rancho-cucamonga.ca.us<br />
www.ci.redlands.ca.us<br />
www.ci.rialto.ca.us<br />
www.ci.san-bernardino.ca.us<br />
www.ci.upland.ca.us<br />
www.yucaipa.org<br />
15
Other <strong>Transit</strong> Districts/Transportation Providers<br />
Finally, <strong>Omnitrans</strong> has a direct link with other transit<br />
providers, and transit districts, that provide service into and<br />
around the San Bernardino Valley. It is critical to ensure<br />
open lines of communication with each of the adjacent<br />
transit agencies, so that services can be coordinated for our<br />
passengers, and to improve transit as a whole in Southern<br />
California.<br />
Neighboring <strong>Transit</strong> Districts/Agencies include:<br />
Foothill <strong>Transit</strong><br />
Metrolink<br />
Mountain Area Regional <strong>Transit</strong><br />
Authority (MARTA)<br />
Greyhound<br />
Amtrak<br />
Metropolitan <strong>Transit</strong> Authority<br />
(LAMTA)<br />
Riverside <strong>Transit</strong> Agency (RTA)<br />
Sunline <strong>Transit</strong> Agency<br />
Victor Valley <strong>Transit</strong> Agency<br />
Morongo Basin <strong>Transit</strong><br />
Authority (MBTA)<br />
Barstow Area <strong>Transit</strong> (BAT)<br />
Orange County <strong>Transit</strong><br />
Authority (OCTA)<br />
www.foothilltransit.org<br />
www.metrolinktrains.org<br />
www.marta.cc<br />
www.greyhound.com<br />
www.amtrak.com<br />
www.mta.net<br />
www.riversidetransit.com<br />
www.sunline.org<br />
www.vvta.org<br />
www.mbtabus.com<br />
www.barstowca.org<br />
www.octa.net<br />
Section I<br />
Introduction<br />
16
Notes:<br />
17
Section I<br />
Introduction<br />
18<br />
Notes:
Section II: System Background<br />
Those who cannot<br />
remember the past are<br />
condemned to repeat it.<br />
- George Santayana, poet
System Background<br />
System Description<br />
Under authority of Title 1, Division 7, Chapter 5, as amended,<br />
of the Government Code of the State of California,<br />
<strong>Omnitrans</strong> was created in 1976 by a joint powers agreement<br />
among the County of San Bernardino and the cities of Chino,<br />
Colton, Fontana, Loma Linda, Montclair, Ontario, Redlands,<br />
Rialto, San Bernardino and Upland. Since that time five<br />
additional cities have joined and make up the current JPA.<br />
(See Section I: Introduction for complete list of JPA<br />
members.) <strong>Omnitrans</strong> was created primarily to provide a<br />
standardized system of fares, a universal system of transfers,<br />
and expanded transit services and facilities for the benefit of<br />
the residents of its parties.<br />
Board of Directors<br />
<strong>Omnitrans</strong> is administered by a Board of Directors, made up<br />
of the Mayor or Council Member from each member-City and<br />
all five Supervisors of the County of San Bernardino. Each<br />
City has one alternate Board Member who is designated by<br />
the City Council. The County representatives have no<br />
alternates. The alternates vote only in the absence of the<br />
official representatives.<br />
It is required under the JPA that the Board of Directors meet<br />
at least one time each quarter of each fiscal year. The Board<br />
of Directors holds its regularly scheduled meeting on the first<br />
Wednesday of each month at 8:00 a.m. in <strong>Omnitrans</strong> Metro<br />
Facility (San Bernardino) Board Room. All meetings are held<br />
in compliance with the Ralph M. Brown Act.<br />
Board meetings are presided by the Board-appointed Chair.<br />
In addition, a Vice-Chair is elected by the Board. The<br />
CEO/General Manager is the Secretary to the Board of<br />
Directors. The Board of Directors is responsible for such acts<br />
as adopting the budget, appointing the CEO/General<br />
Manager, appointing a technical committee, establishing<br />
policy, and adopting rules and regulations for the conduct of<br />
business.<br />
19
Employees & Contract Employees<br />
<strong>Omnitrans</strong> has both directly operated services and<br />
contracted services. At the present time, directly operated<br />
services are provided by both represented and nonrepresented<br />
employees. Administrative staff is made up of a<br />
combination of employees represented by the San<br />
Bernardino Public Employees Association (SBPEA) and<br />
employees who are not represented by a union. Mechanical<br />
and facility personnel are also represented by the SBPEA.<br />
Coach Operators are represented by the Amalgamated<br />
<strong>Transit</strong> Union (ATU).<br />
Contracted services are currently provided by the private<br />
transportation company, Transportation Concepts. Effective<br />
September, 2005, they will provide demand response and<br />
paratransit ADA service for <strong>Omnitrans</strong>. The base contract<br />
with Transportation Concepts for demand response services<br />
began July 1, 2001 and ended June 30, 2003. The<br />
<strong>Omnitrans</strong> Board of Directors has extended this contract<br />
twice, for a period of one year each time. One additional<br />
option year remains, to end June 30, <strong>2006</strong>. The current base<br />
contract with Transportation Concepts for fixed route<br />
services (routes 7, 8, 9, 90, and Redlands Trolley) began<br />
September 1, 2003 and will end August 31, 2005. Approved<br />
by the Board of Directors in April 2005, it has been<br />
determined that this will not be extended.<br />
Security Measures<br />
With the events surrounding September 11, 2001,<br />
<strong>Omnitrans</strong> has increased its security measures drastically, to<br />
assure the safety of its passengers, its employees, and its<br />
assets. A state-of-the-art camera system is installed on each<br />
fixed route vehicle <strong>Omnitrans</strong> operates. The system is made<br />
up of five (5) cameras on each coach, a microphone near the<br />
front entrance of the coach and a hard drive that downloads<br />
and stores all the activities that occur on the vehicle.<br />
Through radio download each day, the data that is collected<br />
is stored electronically on compact discs. If an incident<br />
occurs on a coach, or outside a coach, the recording can be<br />
“flagged” by the coach operator, and/or can be reviewed at<br />
<strong>Omnitrans</strong> facilities to determine who/what caused the<br />
damage/injury on board the bus. This system has saved the<br />
agency a significant amount of money since they were<br />
installed in replacement of assets that were damaged by<br />
Section II<br />
Background<br />
20
graffiti and tagging. In addition, the camera system has<br />
been responsible for apprehending and convicting people<br />
that assault <strong>Omnitrans</strong> coach operators.<br />
In addition to the system on board the buses, <strong>Omnitrans</strong><br />
facilities have been better secured by the introduction of 24-<br />
hour security services in fiscal year 2002. The security guards<br />
are on duty at <strong>Omnitrans</strong> 5 th Street and Montclair facilities 24<br />
hours a day, seven days a week. Paratransit facilities located<br />
on ‘I’ Street in San Bernardino and in Rancho Cucamonga<br />
have security in the evenings from 6:00 p.m. to 6:00 a.m.,<br />
with 24 hour security on weekends and holidays. Key cards<br />
have been introduced to improve building access and<br />
security; employee and visitor parking placards are now used<br />
to assure that a vehicle is authorized to be on the property;<br />
and cameras have been installed around the facilities to<br />
monitor activities.<br />
With the addition of the Voice-Data Communication System,<br />
which will allow real time data transfer, additional security<br />
measures will be available for passengers and employees<br />
alike such as real-time emergency routing information and<br />
real-time vehicle location information. This will ensure fast<br />
response from emergency service agencies such as police<br />
departments and paramedics if the need arises.<br />
<strong>Omnitrans</strong> Website<br />
<strong>Omnitrans</strong> is also actively utilizing the most current webenabled<br />
applications to improve its services to customers and<br />
the general public. Information about routes and schedules<br />
and new programs and press releases as well as requests for<br />
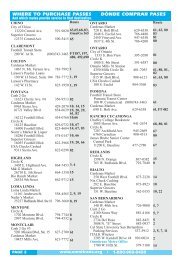
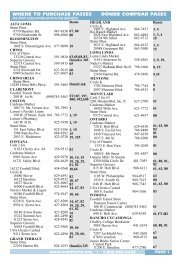
proposals are available online. In addition, <strong>Omnitrans</strong><br />
passengers are now able to purchase their passes online,<br />
eliminating the need to make an extra trip and come into<br />
<strong>Omnitrans</strong> offices or pass outlets to get a new pass.<br />
<strong>Omnitrans</strong> website is located at www.omnitrans.org.<br />
21
Major Components of <strong>Omnitrans</strong><br />
Existing Capital Facilities<br />
At the initial operation of <strong>Omnitrans</strong>, and with the creation<br />
of a Joint Powers Agreement (JPA) between the member<br />
cities and the County in 1976, all the equipment and facilities<br />
previously owned by the <strong>Omnitrans</strong> members became the<br />
property of <strong>Omnitrans</strong>. At initiation, <strong>Omnitrans</strong> capital<br />
facilities and equipment helped operate 22 routes and two<br />
dial-a-ride systems.<br />
Today, while the capital equipment has changed, the<br />
intention is still the same. Each and every dollar of capital<br />
outlay helps to operate a complex network of 34 routes,<br />
three Omnilink systems, and the ADA-mandated Access<br />
system.<br />
Revenue Vehicles<br />
<strong>Omnitrans</strong> currently operates a fleet of 175 fixed route<br />
vehicles and a fleet of 101 Omnilink/Access vehicles. Figure<br />
II-1, <strong>Omnitrans</strong> Revenue Vehicle Summary gives information<br />
related to the different coach types currently in <strong>Omnitrans</strong>’<br />
fleet. In addition to its Revenue Vehicle fleet, <strong>Omnitrans</strong> also<br />
has an original 1958 GM TDH 4801, which has been<br />
restored with <strong>Omnitrans</strong> original paint scheme and logo and<br />
is used for local events. Also shown in figure II-1 is the new<br />
hybrid electric buses, of which one is currently in active<br />
service. Although a total of three are on-site, work is still<br />
being completed on two of the coaches to assure the safety<br />
and reliability of them. A detailed list of <strong>Omnitrans</strong> current<br />
Revenue Vehicles can be found in Appendix-B<br />
Section II<br />
Background<br />
22
Figure II-1: Revenue Vehicle Summary (eff. 7/2004)<br />
Vehicle Type Manufacture Numbe Vehicle Seats Fuel Type<br />
Date<br />
r in Length Available<br />
Fleet<br />
TMC 1992 – 1993 24 40.0’ – 37 Diesel<br />
40.3’<br />
Orion 1996 24 40.8’ 37 CNG<br />
Neoplan 1997 7 40.6’ 37 CNG<br />
New Flyer<br />
Hybrid<br />
2000 3 40.8’ 37 Gasoline/<br />
Electric<br />
Ford Goshen 2000 91 23.8’ 16 – 20 Gasoline<br />
New Flyer 2000 – 2004 104 39.9’ – 37 CNG<br />
40.8’<br />
Thomas 2003 12 32.9’ CNG<br />
Specialty 2003 3 27.0’ CNG<br />
Trolley<br />
El Dorado<br />
Aerotech<br />
2004 10 23.1’ 16 Gasoline<br />
<strong>Omnitrans</strong> Transfer Centers<br />
With the opening of the Chino <strong>Transit</strong> Center in fiscal year<br />
2005, <strong>Omnitrans</strong> will have a total of seven (7) Centers which<br />
it provides service to. Centers are located in Pomona,<br />
Montclair, Chino, Ontario, San Bernardino, and 2 in Fontana.<br />
Each Center varies in size and amenities. A description of<br />
each Transfer Center is included in Appendix-C.<br />
In addition to Transfer Centers, <strong>Omnitrans</strong> also provides<br />
transfers at six (6) regional destinations. These include<br />
Montclair Plaza, Ontario Airport (transfer to Airport Shuttle<br />
only), Ontario Mills, Arrowhead Regional Medical Center,<br />
Inland Center Mall, and Redlands Mall. Descriptions of each<br />
of these facilities are also included in Appendix-C.<br />
In the future, <strong>Omnitrans</strong> has plans to expand the Transfer<br />
Centers in its service area to include Chaffey College and<br />
Yucaipa. In addition, plans are underway to relocate the San<br />
Bernardino Transfer Facility to enhance passenger transfers.<br />
The new location will have many new amenities, and will<br />
add additional Metrolink access, as well as access to the<br />
future Bus Rapid <strong>Transit</strong> (BRT) Corridor which will travel<br />
north-south on E Street.<br />
Administration, Operations, Yards and Shops<br />
The majority of <strong>Omnitrans</strong> administrative staff and coach<br />
operators are located at its San Bernardino Facility on 5 th<br />
23
Street. Also located at this facility is the main maintenance<br />
facility which was updated in December 1999 and includes a<br />
full service spray booth, bus wash, and fuel island (diesel,<br />
gasoline, CNG), fare, and vacuum facility. This facility can<br />
house up to 155 fixed route buses, and also houses the<br />
larger of two dispatching facilities.<br />
Redlands Train Station then…<br />
and now.<br />
<strong>Omnitrans</strong> also operates a smaller staff and approximately 70<br />
large buses out of its West Valley Facility located on Arrow<br />
Highway in Montclair. This facility was expanded by 3,000<br />
square feet in 2003. Administrative staff and coach<br />
operators from the Operations department as well as<br />
Maintenance staff work out of this facility. In addition, a staff<br />
member from Human Resources provides support twice a<br />
week.<br />
In Fiscal Year 2000, <strong>Omnitrans</strong> also purchased a facility on “I”<br />
Street in San Bernardino to operate its East Valley Access as<br />
well as Yucaipa and Colton/Grand Terrace Omnilink services.<br />
The operations are run by a contractor, Transportation<br />
Concepts. A total of 70 vans can be parked at this facility.<br />
The final piece of property owned by <strong>Omnitrans</strong> is located<br />
on Arrow Route in Rancho Cucamonga. Purchased in July<br />
2001, this property is slated for the Mid-Valley Facility which<br />
will accommodate future expansion needs. This property is<br />
28.8 acres in size and is located just east of the I-15 freeway.<br />
<strong>Omnitrans</strong> contracted services also operates out of a leased<br />
facility in Rancho Cucamonga and a facility owned by<br />
Transportation Concepts in Riverside. The Rancho<br />
Cucamonga Facility accommodates Access Services as well<br />
as the Chino Hills Omnilink. Transportation Concepts facility<br />
in Riverside houses all of <strong>Omnitrans</strong> contracted fixed routes<br />
(Regional Express Route 90; Local Routes 7, 8, and 9; and<br />
Redlands Trolley).<br />
Section II<br />
Background<br />
24
Fares & Interagency Coordination<br />
In September 2003, <strong>Omnitrans</strong> implemented a fare increase<br />
and structure change – the first change since July 1999.<br />
<strong>Omnitrans</strong> fares cover approximately 20% of the overall<br />
operating cost for the agency. This is an important<br />
percentage, as it is also a state requirement that transit<br />
agencies recover at least 20% of its costs from fares, in order<br />
to receive the supplemental money necessary to operate its<br />
services.<br />
Fare Policy Goals, as set out in <strong>Omnitrans</strong> adopted Fare<br />
Policy are to:<br />
Optimize fare revenues and other financial resources<br />
to ensure that <strong>Omnitrans</strong> can successfully meet its<br />
ridership goals and service delivery objectives.<br />
Develop a market driven fare policy that attracts<br />
people to transit as the region grows by promoting<br />
the benefits and worth of transit<br />
To support the overall goals, the following system objectives<br />
were developed:<br />
Build ridership while maximizing revenue<br />
Price fares so that passengers pay a reasonable<br />
amount and <strong>Omnitrans</strong> achieves systemwide farebox<br />
recovery targets<br />
Maintain ease of understanding, use, enforcement,<br />
and customer convenience of the fare structure and<br />
ensure fare media are recognizable and durable<br />
Provide fare media options that meet rider needs<br />
Promote regional fare integration and common fare<br />
media with connecting transit services and build intercounty<br />
ridership<br />
Minimize boarding times through fare technology<br />
and media options<br />
Provide for regular fare structure reviews and<br />
adjustments<br />
Leverage opportunities to effectively and efficiently<br />
leverage fare technology to implement fare policies<br />
25
The following sections illustrate <strong>Omnitrans</strong> current fare<br />
policy.<br />
Figure II-2: Fixed-Route &<br />
Regional Express Bus Fares<br />
Effective September 2003<br />
Cash Fares<br />
Regular $ 1.15<br />
Senior & Disabled $ 0.50<br />
Children 46" and under<br />
Free<br />
Day Passes<br />
Full Fare $ 2.75<br />
Senior & Disabled $ 1.25<br />
7-Day Pass<br />
Full Fare $ 16.00<br />
Senior & Disabled $ 8.00<br />
31-Day Pass<br />
Full Fare $ 41.00<br />
Senior & Disabled $ 20.50<br />
Student Fare $ 29.50<br />
Figure II-3: Omnilink Bus Fares<br />
Effective September 2003<br />
Regular $ 2.50<br />
Senior & Disabled $ 1.25<br />
Children 46" and under<br />
Free<br />
Section II<br />
Background<br />
26
Figure II-4: Access Bus Fares<br />
Effective September 2003<br />
Passenger<br />
1 zone $ 2.05<br />
2 zones $ 2.05<br />
3 zones $ 2.05<br />
4 zones $ 2.80<br />
5 zones $ 3.55<br />
6 zones $ 4.30<br />
7 or more zones n/a<br />
Attendant<br />
Free<br />
Companion<br />
1 zone $ 2.30<br />
2 zones $ 2.30<br />
3 zones $ 2.30<br />
4 zones $ 3.05<br />
5 zones $ 3.80<br />
6 zones $ 4.55<br />
7 or more zones n/a<br />
Children 4 and under<br />
n/a<br />
Children 46" and under<br />
Free<br />
Figure II-4: Access Bus Fares<br />
Effective September 2003 (continued)<br />
Subscription Passes<br />
1 zone $ 172.50<br />
2 zones $ 172.50<br />
3 zones $ 172.50<br />
4 zones $ 228.50<br />
5 zones $ 285.00<br />
6 zones $ 341.00<br />
More information on <strong>Omnitrans</strong> fare policy can be found in<br />
Section VI: Service <strong>Plan</strong>.<br />
27
Transfer and Cooperative Agreements<br />
<strong>Omnitrans</strong> and its surrounding transit agencies work<br />
cooperatively to provide transit services throughout the<br />
region. To effectively accomplish this, <strong>Omnitrans</strong> enters into<br />
Cooperative Service Agreements with other agencies so that<br />
the roles and responsibilities are clearly defined.<br />
Foothill <strong>Transit</strong> – Transfers, Passes, etc are good towards the<br />
passengers’ base fare within the prevailing fare zone at the<br />
point of transfer. Standard rates for passes and transfers<br />
apply.<br />
Los Angeles County Metropolitan <strong>Transit</strong> Agency (LACMTA)<br />
– Schedules are coordinated to the extent possible to ease<br />
transfers between the systems. <strong>Omnitrans</strong> accepts MTA’s EZ<br />
<strong>Transit</strong> Pass towards the passengers’ base fare within the<br />
prevailing fare zone at the point of transfer.<br />
Metrolink – Metrolink passes are good toward the<br />
passengers’ base fare within <strong>Omnitrans</strong> service area, at the<br />
point of transfer only. <strong>Omnitrans</strong> passes are not honored on<br />
Metrolink.<br />
Mountain Area Regional <strong>Transit</strong> Authority (MARTA) –<br />
Transfers, Passes, etc are good toward the passengers’ base<br />
fare within the prevailing fare zone at the point of transfer.<br />
Standard rates for passes and transfers apply.<br />
Riverside <strong>Transit</strong> Agency (RTA) – Transfer media is good<br />
toward the passengers’ base fare within the prevailing fare<br />
zone at the point of transfer. Standard rates for passes and<br />
transfers apply.<br />
Victor Valley <strong>Transit</strong> Authority (VVTA) – <strong>Omnitrans</strong> accepts<br />
VVTA’s VVC One Ride Ticket, VVC Ten Trip Pass and the VVC<br />
Monthly Pass toward the passengers’ applicable fare at<br />
designated transfer zones (4 th Street <strong>Transit</strong> Mall and Ontario<br />
Mills). VVTA does not offer a discount to <strong>Omnitrans</strong>’<br />
passengers for its Victor Valley Commuter Service.<br />
Section II<br />
Background<br />
28
Notes:<br />
29
Section II<br />
Background<br />
30<br />
Notes:
Section III: Current Performance<br />
and Conditions<br />
Good plans shape good<br />
decisions. That’s why good<br />
planning helps to make<br />
elusive dreams come true.<br />
- Lester Robert Bittel<br />
(b. 1918), Writer
<strong>Omnitrans</strong> Existing Services<br />
<strong>Omnitrans</strong> operates throughout the urbanized area of<br />
southwestern San Bernardino County: south of the San<br />
Bernardino Mountains, from Upland, Montclair, and Chino in<br />
the west to Redlands and Yucaipa in the east. The<br />
<strong>Omnitrans</strong> service area covers approximately 480 square<br />
miles. <strong>Omnitrans</strong>’ fixed-route system and service area for FY<br />
2004 are illustrated in Figures III-1 and III-2. Major<br />
destinations within the <strong>Omnitrans</strong> service area include<br />
transportation centers, medical centers, educational facilities,<br />
shopping malls, business parks, and community centers.<br />
<strong>Omnitrans</strong> currently operates three types of services:<br />
Fixed-Route Services. The fixed-route services are comprised<br />
of 34 local fixed-routes including one peak-hour only service,<br />
two peak hour trippers, and one regional express route<br />
(Route 90). Routes are operated with 40-foot buses running<br />
primarily along major east-west and north-south corridors.<br />
Headways vary from 15-minute to hourly service, with<br />
approximately 18 hours of service on weekdays, 13 hours on<br />
Saturdays, and 12 hours on Sundays.<br />
Access Services. Access provides public transportation<br />
services for persons who are physically or cognitively unable<br />
to use regular bus service (ADA certified and/or <strong>Omnitrans</strong><br />
Disability Identification Card holders). Access operates curbto-curb<br />
service with minibuses or vans, complementing the<br />
<strong>Omnitrans</strong> fixed-route bus system. The Access service area is<br />
defined as up to 3/4 mile on either side of an existing fixedroute.<br />
Service is available on the same days and at the same<br />
times that fixed-route services operate.<br />
Omnilink. Omnilink is a general-public, demand-responsive<br />
service that operates in Grand Terrace/South Colton,<br />
Yucaipa, and Chino Hills. This service circulates through a<br />
defined, low-density service-area with minibuses picking up<br />
and dropping off passengers. Every hour, the bus returns to<br />
a timed-transfer point, for direct, timed connections to the<br />
fixed-route system. This type of service is a more efficient<br />
way to provide coverage in low-density areas compared to<br />
traditional fixed-route service. Service operates<br />
approximately 11 hours on weekdays, 10 hours on<br />
Saturdays, and six hours on Sundays.<br />
31
Fixed-route Services<br />
Description of Services<br />
Figures III-1 and III-2 show all 34 <strong>Omnitrans</strong> fixed-routes,<br />
color-coded by frequency, while Figures III-3, III-4, and III-5<br />
show the routes' operating characteristics. Figure III-6 shows<br />
all performance data and performance indicators from FY<br />
2002 through FY 2005. <strong>Omnitrans</strong> also provides Access and<br />
Omnilink services. These services are described on pages 60<br />
and 75 respectively.<br />
Routes can be grouped into three categories (according to<br />
their service-frequency) as follows:<br />
<strong>Omnitrans</strong> Route 1 at Historic<br />
San Bernardino Depot<br />
Tier One Routes: Tier One routes are those routes with 15-<br />
minute headways and that operate seven days a week. In<br />
addition, the freeway express route – Route 90 – would be<br />
considered Tier One service.<br />
Tier Two Routes: Tier Two routes provide service on 30-<br />
minute headways and operate seven days a week.<br />
Tier Three Routes: Tier Three routes provide service on 60-<br />
minute headways or serve only the peak hours.<br />
Fare Structure<br />
<strong>Omnitrans</strong> offers both standard daily fares and discounted<br />
multi-trip and multi-day passes. Special fares are also offered<br />
to seniors, persons with disabilities, and students.<br />
Information on <strong>Omnitrans</strong>’ fare structure can be found in<br />
Section II.<br />
Section III: Current<br />
Performance & Conditions<br />
32
33<br />
Figure III-1: <strong>Omnitrans</strong> Existing Service Map – West Valley
Section III: Current<br />
Performance & Conditions<br />
34<br />
Figure III-2: <strong>Omnitrans</strong> Existing Service Map – East Valley<br />
Insert fold out map #2 here
35<br />
Figure III-3: Weekday Service Frequency by Route<br />
Weekday Frequency (in minutes)<br />
AM Peak Base PM Peak Evening Night Service<br />
Route Route Name to 8:29 8:30 - 2:29 2:30 - 17:59 18:00 - 21:59 22:00 to Hours<br />
1 ARMC - San Bernardino - Del Rosa 30 - 15 30 - 15 30 - 15 30 - 15 30 4:38 - 22:49<br />
2 Cal State – E Street - Loma Linda 85 - 30 15 15 30 30 - 60 4:25 - 22:40<br />
3 Baseline - Highland - San Bernardino 60 - 15 15 15 15 - 30 30 4:28 - 23:11<br />
4 Baseline - Highland - San Bernardino 60 - 15 15 15 15 - 30 30 4:33 - 22:40<br />
5 San Bernardino - Del Rosa - Cal State 30 30 30 30 30 5:28 - 22:40<br />
10 Fontana - Baseline - San Bernardino 60 - 30 30 30 30 No Service 5:35 - 20:25<br />
11 San Bernardino - Muscoy - Cal State 30 30 30 30 30 5:25 - 22:50<br />
14 Fontana - Foothill - San Bernardino 50 - 15 15 15 15 - 30 60 3:55 - 22:57<br />
15 Fontana - San Bndo/Highland - Redlands 30 30 30 30 30 5:08 - 22:39<br />
19 Redlands - Colton – Fontana 30 30 30 30 - 60 60 4:50 - 22:25<br />
20 Fontana Metrolink - Via Hemlock - Kaiser 30 30 30 30 No Service 5:32 - 20:27<br />
22 North Rialto - Riverside Ave – ARMC 30 - 15 15 15 15 - 30 No Service 4:48 - 22:14<br />
28 Southridge - Slover Ave – Kaiser 60 60 60 60 No Service 7:02 - 18:57<br />
29 Bloomington - Valley Blvd – Kaiser 60 60 60 60 No Service 6:45 - 18:35<br />
60 Ontario Conv Cntr - Chaffey College - Ont Mills 60 60 60 60 60 4:40 - 22:26<br />
61 Fontana - Ontario Mills – Pomona 30 - 15 15 15 15 15 - 30 4:20 - 22:49<br />
62 Montclair - Ontario – Chino 30 - 60 30 - 60 30 - 60 30 - 60 No Service 5:23 - 21:41<br />
63 Chino - Ontario – Upland 60 - 30 30 30 30 - 60 No Service 5:52 - 22:15<br />
64 Montclair - N Upland - Chaffey College 60 60 60 60 No Service 7:00 - 19:50<br />
65 Montclair - Chino Hills 30 30 30 30 30 4:50 - 22:44<br />
66 Fontana - Foothill – Montclair 45 - 30 30 30 30 - 60 No Service 4:31 - 22:38<br />
67 Ontario - Baseline – Fontana 60 60 60 60 No Service 5:30 - 20:25<br />
68 Chino - Montclair - Chaffey College 60 - 30 30 30 30 - 60 60 4:49 - 22:55<br />
70 Ontario - Creekside - Ontario Mills 60 60 60 60 No Service 6:34 - 18:47<br />
71 Kaiser - South Ridge - Rancho Cucamonga 60 60 60 60 No Service 5:06 - 22:27<br />
75<br />
140<br />
202<br />
Ontario - Via Francis - Ontario Mills 60 60 60 No Service No Service<br />
Fontana - Chaffey College Tripper Tripper Tripper No Service No Service<br />
San Bernardino - T.E.A.M. House No Service Tripper Tripper No Service No Service<br />
6:05 - 9:58<br />
15:05 - 18:57<br />
8:05 - 8:51<br />
15:23 - 16:09<br />
8:40 - 8:55<br />
14:30 - 14:48<br />
7 N. San Bernardino - Sierra Way - San Bndo 60 - 30 30 - 60 30 - 60 30 - 60 No Service 4:53 - 19:52<br />
8 San Bernardino - Mentone – Yucaipa 60 60 60 60 No Service 4:30 - 20:30<br />
9 San Bernardino - Redlands – Yucaipa 60 60 60 60 No Service 5:33 - 21:48<br />
30 Redlands Trolley (Red Line) 60 60 60 60 No Service 6:07 - 21:25<br />
31 Redlands Trolley (Blue Line) 60 60 60 60 No Service 7:00 - 19:55<br />
90 Inland Empire Connection 45 - 50 45 - 60 35 - 45 35 - 60 60 4:40 - 22:25
Section III: Current<br />
Performance & Conditions<br />
36<br />
Figure III-4: Saturday Service Frequency by Route<br />
Saturday Frequency (in minutes)<br />
AM Peak Base PM Peak Evening Night Service<br />
Route Route Name to 8:29 8:30 - 2:29 2:30 - 17:59 18:00 - 21:59 22:00 to Hours<br />
1 ARMC - San Bernardino - Del Rosa 30 - 15 30 - 15 30 - 15 30 - 15 No Service 6:38 - 19:28<br />
2 Cal State - E Street - Loma Linda 15 15 15 15 No Service 6:35 - 19:15<br />
3 Baseline - Highland - San Bernardino 30 - 15 15 15 15 No Service 7:13 - 19:19<br />
4 Baseline - Highland - San Bernardino 30 - 15 15 15 15 No Service 7:03 - 19:27<br />
5 San Bernardino - Del Rosa - Cal State 30 30 30 30 No Service 6:28 - 19:10<br />
10 Fontana - Baseline - San Bernardino 60 60 60 60 No Service 6:35 - 19:25<br />
11 San Bernardino - Muscoy - Cal State 30 30 30 30 No Service 6:55 - 19:20<br />
14 Fontana - Foothill - San Bernardino 30 - 15 15 15 30 - 40 No Service 6:30 - 20:05<br />
15 Fontana - San Bndo/Highland - Redlands 30 30 30 30 No Service 6:38 - 19:55<br />
19 Redlands - Colton – Fontana 30 30 30 30 No Service 7:10 - 19:05<br />
20 Fontana Metrolink - Via Hemlock - Kaiser 30 30 30 30 No Service 6:32 - 18:27<br />
22 North Rialto - Riverside Ave - ARMC 20 20 20 20 No Service 7:40 - 19:14<br />
28 Southridge - Slover Ave – Kaiser No Service No Service No Service No Service No Service na<br />
29 Bloomington - Valley Blvd – Kaiser 60 60 60 60 No Service 7:45 - 18:35<br />
60 Ontario Conv Cntr - Chaffey College - Ont Mills 60 60 60 60 No Service 6:45 - 19:39<br />
61 Fontana - Ontario Mills – Pomona 30 30 30 30 No Service 6:39 - 19:48<br />
62 Montclair - Ontario – Chino 60 60 60 60 No Service 6:50 - 18:44<br />
63 Chino - Ontario – Upland 60 60 60 60 No Service 6:52 - 18:46<br />
64 Montclair - N Upland - Chaffey College 60 60 60 60 No Service 7:00 - 19:50<br />
65 Montclair - Chino Hills 60 60 60 60 No Service 6:20 - 19:15<br />
66 Fontana - Foothill – Montclair 40 - 30 30 30 30 No Service 6:45 - 19:09<br />
67 Ontario - Baseline – Fontana 60 60 60 60 No Service 6:35 - 19:30<br />
68 Chino – Montclair - Chaffey College 60 60 60 60 No Service 6:10 - 19:52<br />
70 Ontario - Creekside - Ontario Mills 60 60 60 60 No Service 6:45 - 18:37<br />
71 Kaiser - South Ridge - Rancho Cucamonga 60 60 60 60 No Service 6:35 - 20:28<br />
75 Ontario - Via Francis - Ontario Mills No Service No Service No Service No Service No Service na<br />
140 Fontana - Chaffey College No Service No Service No Service No Service No Service na<br />
202 San Bernardino - T.E.A.M. House No Service No Service No Service No Service No Service na<br />
7 N. San Bernardino - Sierra Way - San Bndo 60 60 60 60 No Service 6:50 - 18:50<br />
8 San Bernardino - Mentone - Yucaipa 60 60 60 60 No Service 6:40 - 19:20<br />
9 San Bernardino - Redlands - Yucaipa 60 60 60 60 No Service 6:33 - 20:28<br />
30 Redlands Trolley (Red Line) 60 60 60 60 No Service 7:30 - 19:25<br />
31 Redlands Trolley (Blue Line) 60 60 60 60 No Service 7:37 - 18:55<br />
90 Inland Empire Connection 50 - 45 45 45 45 - 60 60 5:30 - 22:40
37<br />
Figure III-5: Sunday Service Frequency by Route<br />
Sunday Frequency (in minutes)<br />
AM Peak Base PM Peak Evening Night Service<br />
Route Route Name to 8:29 8:30 - 2:29 2:30 - 17:59 18:00 - 21:59 22:00 to Hours<br />
1 ARMC - San Bernardino - Del Rosa 60 - 30 60 - 30 60 - 30 60 - 30 No Service 6:32 - 19:25<br />
2 Cal State - E Street - Loma Linda 60 60 - 15 15 30 No Service 6:56 - 19:03<br />
3 Baseline - Highland - San Bernardino 45 - 30 15 15 30 No Service 7:05 - 19:15<br />
4 Baseline - Highland - San Bernardino 30 - 15 15 15 30 No Service 7:05 - 19:12<br />
5 San Bernardino - Del Rosa - Cal State 60 60 60 60 No Service 6:38 - 19:20<br />
10 Fontana - Baseline - San Bernardino 60 60 60 60 No Service 7:35 - 19:25<br />
11 San Bernardino - Muscoy - Cal State 60 60 60 60 No Service 7:25 - 19:20<br />
14 Fontana - Foothill - San Bernardino 30 - 15 15 15 15 - 30 No Service 7:15 - 19:10<br />
15 Fonana - San Bndo/Highland - Redlands 30 30 30 30 No Service 7:00 - 19:30<br />
19 Redlands - Colton – Fontana 60 60 60 60 No Service 7:15 - 18:50<br />
20 Fontana Metrolink - Via Hemlock - Kaiser 30 30 30 No Service No Service 6:32 - 17:57<br />
22 North Rialto - Riverside Ave – ARMC 45 45 45 45 No Service 7:00 - 19:36<br />
28 Southridge - Slover Ave – Kaiser No Service No Service No Service No Service No Service na<br />
29 Bloomington - Valley Blvd – Kaiser No Service No Service No Service No Service No Service na<br />
60 Ontario Conv Cntr - Chaffey College – Ont Mills 60 60 60 60 No Service 6:45 - 19:40<br />
61 Fontana - Ontario Mills – Pomona 30 30 30 30 No Service 6:39 - 19:47<br />
62 Montclair - Ontario – Chino 60 60 60 60 No Service 6:50 - 18:44<br />
63 Chino - Ontario – Upland 60 60 60 60 No Service 6:52 - 19:44<br />
64 Montclair - N Upland - Chaffey College 60 60 60 60 No Service 7:00 - 19:50<br />
65 Montclair - Chino Hills 60 60 60 60 No Service 6:31 - 18:26<br />
66 Fontana - Foothill – Montclair 60 60 60 60 No Service 7:07 - 18:52<br />
67 Ontario - Baseline – Fontana No Service No Service No Service No Service No Service na<br />
68 Chino – Montclair - Chaffey College 60 60 60 60 No Service 7:06 - 18:52<br />
70 Ontario - Creekside - Ontario Mills 60 60 60 60 No Service 6:45 - 18:40<br />
71 Kaiser - South Ridge - Rancho Cucamonga 60 60 60 60 No Service 6:35 - 18:55<br />
75 Ontario - Via Francis - Ontario Mills No Service No Service No Service No Service No Service na<br />
140 Fontana - Chaffey College No Service No Service No Service No Service No Service na<br />
202 San Bernardino - T.E.A.M. House No Service No Service No Service No Service No Service na<br />
7 N. San Bernardino - Sierra Way - San Bndo 60 60 60 No Service No Service 7:30 - 17:55<br />
8 San Bernardino - Mentone – Yucaipa 120 120 120 120 No Service 8:05 - 19:05<br />
9 San Bernardino - Redlands – Yucaipa 120 120 120 120 No Service 7:10 - 18:30<br />
30 Redlands Trolley (Red Line) 60 60 60 60 No Service 8:07 - 18:25<br />
31 Redlands Trolley (Blue Line) 60 60 60 No Service No Service 8:00 - 17:32<br />
90 Inland Empire Connection 60 60 - 55 60 - 45 60 No Service 6:50 - 20:02
Figure III-6: <strong>Omnitrans</strong> Fixed-route Services Operating Data<br />
and Performance Indicators<br />
FY 2002<br />
Actual<br />
FY2003<br />
Actual<br />
FY2004<br />
Actual<br />
FY2005<br />
Budgeted<br />
Performance Measures<br />
Fare Revenue<br />
($000's) 10,935 10,611 10,914 11,436<br />
Annual Change -3.0% 2.9% 4.8%<br />
Operating Cost<br />
($000's) 38,203 46,914 48,585 51,114<br />
Annual Change 22.8% 3.6% 5.2%<br />
Performance Indicators<br />
Revenue Miles of<br />
Operation (000's) 7,087 7,780 7,116 7,363<br />
Annual Change 9.8% -8.5% 3.5%<br />
Service Miles of<br />
Operation (000's) 7,848 8,468 7,219 8,251<br />
Annual Change 7.9% -14.7% 14.3%<br />
Revenue Hours of<br />
Operation (000's) 605 601 566 581<br />
Annual Change -0.7% -5.8% 2.6%<br />
Service Hours of<br />
Operation 000's) 634 627 576 626<br />
Annual Change -1.0% -8.2% 8.6%<br />
Total Passengers<br />
Carried (000's) 16,381 15,981 14,278 15,381<br />
Annual Change -2.4% -10.7% 7.7%<br />
Service Performance Measures<br />
Operating Cost per<br />
Passenger ($) $2.33 $2.94 $3.40 $3.32<br />
Annual Change 25.9% 15.9% -2.3%<br />
Operating Cost per<br />
Revenue Hour ($) $63.11 $78.05 $85.84 $88.03<br />
Annual Change 23.7% 10.0% 2.5%<br />
Passengers per<br />
Revenue Hour 27.06 26.59 25.23 26.49<br />
Annual Change -1.8% -5.1% 5.0%<br />
Passengers per<br />
Revenue Mile 2.31 2.05 2.01 2.09<br />
Annual Change 11.9% 13.2% 1.7%<br />
Fare Recovery Ratio 29% 23% 22% 22%<br />
Annual Change -21.0% -0.7% -0.4%<br />
Section III: Current<br />
Performance & Conditions<br />
38
Unlike many agencies, <strong>Omnitrans</strong> does not issue transfers for<br />
one-way cash fares. Passengers who plan to ride more than<br />
two buses over the course of one day are encouraged to<br />
purchase a one-day pass. The pass allows for unlimited<br />
travel on local buses for one full day.<br />
Rider Profile<br />
Based on the 2003 <strong>Omnitrans</strong> Rider Attitude and Awareness<br />
Study, the typical <strong>Omnitrans</strong> rider is a woman, is more likely<br />
Hispanic, is 34 years old or under, rides the bus five or more<br />
times per week, has graduated from high school, is<br />
employed full-time outside of his/her home, and does not<br />
have a valid driver’s license.<br />
He/She rides the bus primarily for work or personal business,<br />
and secondarily for medical appointments, school, shopping,<br />
and recreational or social purposes. The household income<br />
is $34,999 or less per year; there is at least one car in the<br />
household and a small chance of driving it alone.<br />
System-Wide Performance<br />
<strong>Omnitrans</strong> has a portion of the bus fleet equipped with<br />
Automatic Passenger Counters (APC). These buses are<br />
circulated throughout the fleet. This provides an excellent<br />
source of detailed information on the performance of the<br />
system, hours, miles, running time, loads, boardings, stops<br />
and segments of individual routes. Detailed performance<br />
statistics for each fixed-route and route segments is provided<br />
in the Existing Conditions Report. This report and analysis<br />
was compiled based on APC data collected during the first<br />
four months of 2004.<br />
This Chapter provides a system-wide performance overview<br />
from the APCs.<br />
Boardings<br />
The APC data indicated that <strong>Omnitrans</strong> has 55,394 unlinked<br />
boardings per weekday. The busiest stop locations are<br />
located at the seven Transcenters, as well as destinations<br />
such as Ontario Mills, Arrowhead Regional Medical Center,<br />
and the San Bernardino Metrolink Station. Chaffey College,<br />
Cal State, and major hospitals and shopping centers in the<br />
service area account for most of the remaining busy stop<br />
locations.<br />
39
Figures III-7 and III-8 illustrate the number of weekday<br />
boardings by stop in the East and West Valleys. The maps<br />
clearly show the busiest stop locations. In addition, the maps<br />
indicate that the area north and east of downtown San<br />
Bernardino clearly has the greatest concentration of<br />
ridership.<br />
Figure III-9 shows the 15 busiest bus stops in order of the<br />
number of boardings observed by the APCs.<br />
Figure III-10 presents weekday boardings for all fixed-route<br />
services as well as revenue hours and passengers per<br />
revenue hour. <strong>Omnitrans</strong>’ fixed-route services carried an<br />
average of 27 passengers per revenue hour in FY 2004.<br />
Section III: Current<br />
Performance & Conditions<br />
40
Section III: Current<br />
Performance & Conditions<br />
41<br />
41<br />
Figure III-7: East Valley Boardings<br />
Figure III-6: East Valley Boardings
Section III: Current<br />
Performance & Conditions<br />
42<br />
ction III: Current<br />
Performance & Conditions<br />
Figure III-8: West Valley Boardings<br />
Figure III-7: Map of West Valley Boardings
Figure III-9: Top 15 Bus Stop Locations by Boardings<br />
Bus Stop Location<br />
Boardings<br />
Fontana Metrolink 3101<br />
4 th & E, San Bernardino 1662<br />
Ontario TC 1299<br />
4 th & Arrowhead, San Bernardino 1143<br />
E & Court, San Bernardino 1035<br />
Arrowhead Regional Medical Center 997<br />
Ontario Mills Mall 781<br />
South Fontana TC 665<br />
Montclair TC 623<br />
San Bernardino Metrolink 592<br />
Redlands Mall TC 586<br />
California State University San Bernardino 565<br />
Pomona TC 534<br />
Sterling & Date Place 471<br />
Chaffey College 454<br />
The Fontana Metrolink Transcenter is the busiest single stop<br />
location, with an average of 3,101 boardings per day.<br />
However, downtown San Bernardino has more boardings in<br />
total, but they are spread over several stops due to the<br />
nature of the Transcenter. Arrowhead Regional Medical<br />
Center (ARMC) also serves as a transfer point, which is a likely<br />
reason why the ARMC has more activity than other hospitals<br />
in the region. Ontario Mills, which has the largest retail<br />
concentration in the region, has the largest volume of<br />
passengers at any shopping center.<br />
43
East Valley<br />
West Valley<br />
Contracted<br />
Figure III-10: Weekday Boardings per Line<br />
% of<br />
Total<br />
Revenue<br />
Hours<br />
Passengers<br />
Per<br />
Revenue<br />
Hour<br />
Route<br />
Passenger<br />
Boardings<br />
% of Total<br />
Passengers<br />
Revenue<br />
Hours<br />
1 4,170 7.5% 113.25 5.46% 36.6<br />
2 4,726 8.5% 124.95 6.02% 38.1<br />
3 3,565 6.4% 92.03 4.44% 37.5<br />
4 3,744 6.8% 85.23 4.11% 41.9<br />
5 1,945 3.5% 65.02 3.13% 29.5<br />
10 1,853 3.3% 52.33 2.52% 35.0<br />
11 1,407 2.5% 66.67 3.21% 21.1<br />
14 4,521 8.2% 102.35 4.93% 43.6<br />
15 2,659 4.8% 122.67 5.91% 22.1<br />
19 2,875 5.2% 102.12 4.92% 27.8<br />
20 768 1.4% 28.83 1.39% 26.9<br />
22 2,120 3.8% 91.80 4.43% 22.9<br />
28 134 0.2% 11.92 0.57% 11.6<br />
29 217 0.4% 11.83 0.57% 18.1<br />
60 688 1.2% 50.65 2.44% 14.0<br />
61 5,806 10.5% 199.28 9.61% 28.9<br />
62 1,097 2.0% 47.92 2.31% 21.7<br />
63 1,260 2.3% 55.47 2.67% 22.4<br />
64 265 0.5% 25.67 1.24% 10.2<br />
65 1,133 2.0% 68.93 3.32% 16.3<br />
66 1,809 3.3% 76.28 3.68% 23.0<br />
67 694 1.3% 41.70 2.01% 16.5<br />
68 1,819 3.3% 106.02 5.11% 17.4<br />
70 606 1.1% 26.92 1.30% 30.4<br />
71 1,024 1.8% 48.95 2.36% 20.8<br />
75 213 0.4% 8.59 0.41% 20.7<br />
140 59 0.1% 1.53 0.07% 0.0<br />
202 16 0.0% 0.55 0.03% 0.0<br />
7 1,089 2.0% 40.35 1.95% 25.8<br />
8 892 1.6% 44.33 2.14% 19.2<br />
9 1,211 2.2% 46.00 2.22% 26.7<br />
30 64 0.1% 15.30 0.74% 6.1<br />
31 92 0.2% 12.92 0.62% 8.6<br />
90 853 1.5% 85.93 4.14% 10.9<br />
Total 55,394 100.0% 2074.29 100.00% 26.7<br />
Section III: Current<br />
Performance & Conditions<br />
44
Schedule Adherence<br />
The APCs collect information on the actual times at all<br />
scheduled timepoints. The units record the actual arrival and<br />
departure times at each stop. However, for the analysis of<br />
schedule adherence, only the performance at published<br />
timepoints is utilized.<br />
Arrival times are published by <strong>Omnitrans</strong> for all timepoints.<br />
Departure times are also published at selected locations that<br />
are usually major transfer points. Buses are considered to be<br />
on time if they arrive at timing points on time, early, or not<br />
more than five minutes late. Early arrivals are not considered<br />
to be a negative, as they would not impact transfer<br />
connections, and it is unlikely any passengers would be<br />
unhappy about an early arrival.<br />
Where departure times are published, early departures and<br />
departures more than five minutes late are considered to be<br />
not on time. Figure III-11 shows the departure schedule<br />
adherence results. The graph on the left shows that 4 of the<br />
34 routes depart late on at least 10 percent of trips. The<br />
worst performance is by Route 31(Blue Trolley Line),<br />
departing late approximately on 18% of trips and also<br />
arriving late on 13% of trips, suggesting inadequate running<br />
time given for the route.<br />
Additional routes which report frequent occurrences of<br />
arriving and departing late include Routes 19, 62, 63, & 90.<br />
Route 15 is the second worst performing route, with about<br />
13 percent late departures, but does not have a high late<br />
arrival rate, a sign of extra running time. Route 30 (Red<br />
Trolley Line) and 67, similar to route 15, often depart late,<br />
but arrive early, which is an indication of excessive running<br />
time in the schedule.<br />
Early departures appear to be a significant problem for<br />
<strong>Omnitrans</strong>. <strong>Omnitrans</strong> operates on a timed-transfer basis<br />
and early departures are an indication that transfers are not<br />
being properly accommodated. The right hand graph in<br />
Figure III-11 shows that all but 7 routes have more than 10<br />
percent early departures. The routes that operate with a<br />
high number of early departures and a low rate of late<br />
arrivals are routes 11, 14, 15, 29, 140, and 202. This pattern<br />
may be explained by various reasons such as spare running<br />
45
time, not enough running time between certain segments,<br />
or the need for relocation of layover points to facilitate coach<br />
operator relief. The routes with the greatest numbers of<br />
early departures such as routes 68, 3, 5, 4, and 90 also have<br />
problems with late arrivals, which may be an indicator of<br />
insufficient running time in the schedule overall or the need<br />
for re-distribution of running time throughout different<br />
segments due to traffic or passenger delays. An assessment<br />
of running time data will allow for determination of where<br />
schedule adherence is compromised in order for appropriate<br />
schedule adjustments to take place.<br />
Figure III-12 illustrates the arrival schedule adherence results.<br />
The graph shows that 25 of 34 routes experienced arrival<br />
times (at timing points) more than five minutes late, on at<br />
least 10 percent of all trips. This is well below the<br />
performance level expected at <strong>Omnitrans</strong> and below the<br />
level of performance expected at most transit systems.<br />
Section III: Current<br />
Performance & Conditions<br />
46
31<br />
15<br />
19<br />
30<br />
67<br />
61<br />
62<br />
63<br />
7<br />
90<br />
60<br />
2<br />
1<br />
71<br />
9<br />
11<br />
5<br />
29<br />
66<br />
68<br />
8<br />
65<br />
70<br />
4<br />
10<br />
14<br />
3<br />
22<br />
20<br />
28<br />
64<br />
202<br />
140<br />
75<br />
47<br />
Figure III-11: Departure Schedule Adherence<br />
Percent of Departures Late by Route<br />
Percent of Departures Early By Route<br />
202<br />
29<br />
15<br />
140<br />
68<br />
14<br />
3<br />
11<br />
5<br />
4<br />
90<br />
67<br />
22<br />
28<br />
30<br />
60<br />
19<br />
2<br />
66<br />
1<br />
71<br />
20<br />
62<br />
61<br />
63<br />
65<br />
10<br />
70<br />
64<br />
7<br />
9<br />
8<br />
75<br />
31<br />
0% 10% 20% 30% 40% 50% 60% 70% 80% 90% 100%<br />
Percent Departing Late<br />
0% 10% 20% 30% 40% 50% 60% 70% 80% 90% 100%<br />
Percent Departing Early<br />
Route<br />
Route
Figure III-12: Percent of Arrivals Late by Route<br />
(5 minutes behind schedule or more)<br />
Percent of Arrivals Late by Route<br />
(5 minutes behind schedule or more)<br />
Route<br />
75<br />
20<br />
9<br />
64<br />
8<br />
10<br />
65<br />
4<br />
70<br />
66<br />
3<br />
63<br />
22<br />
90<br />
71<br />
67<br />
31<br />
62<br />
1<br />
5<br />
61<br />
2<br />
68<br />
19<br />
28<br />
30<br />
140<br />
7<br />
14<br />
29<br />
60<br />
11<br />
15<br />
202<br />
0% 10% 20% 30% 40% 50% 60% 70% 80% 90% 100%<br />
Percent Arriving Late<br />
Section III: Current<br />
Performance & Conditions<br />
48
Route Performance<br />
The APC data collected by <strong>Omnitrans</strong> allows detailed, routeby-route<br />
and segment-by-segment analysis of the<br />
performance of the transit system. This section presents<br />
summary data for each route in a system-wide format that<br />
permits ranking and comparison of services.<br />
The hours, miles, and ridership data used to prepare the<br />
graphs that are provided in Figures III-13 through III-21 have<br />
been derived from the APCs.<br />
The cost data used in some of the graphs has been derived<br />
from the cost allocation model used by <strong>Omnitrans</strong> to project<br />
expenses over the life of this project. All of the services,<br />
except Routes 7, 8, 9, 30, 31, and 90, use the same cost<br />
factors to determine the cost of operation. Routes 7, 8, 9, 30,<br />
31, and 90 use different cost data, also based on the cost<br />
allocation model because a contractor currently operates<br />
them and <strong>Omnitrans</strong> does not pay for deadhead hours<br />
(effective September 2005, these routes will be brought in<br />
house.) This means that the cost data does not reflect actual<br />
differences in costs that might be occurring due to the use of<br />
different fuel types or vehicle types.<br />
The revenue data used in some of the graphs was derived<br />
from a system-wide average fare of $0.69 for each boarding.<br />
This means that revenue has not been allocated based on<br />
distance traveled, time spent on the bus, or the type of<br />
passenger (i.e. adult, senior, child, cash, monthly pass or day<br />
pass). <strong>Short</strong> and long trips have been allocated the same<br />
amount of revenue.<br />
The derivations of the major data types (hours; miles;<br />
ridership; costs; revenues) means that the addition of costs or<br />
revenues to the indicators will generally not change the<br />
relative ranking of routes. However, the inclusion of these<br />
factors does provide a greater understanding of some of the<br />
financial challenges facing <strong>Omnitrans</strong>.<br />
49
Figure III-13 summarizes weekday passenger boardings by<br />
route. The five routes with the most boardings in the system<br />
are: Route 61 (serving Fontana – Ontario Mills - Pomona);<br />
Route 2 (serving between Cal State and Loma Linda); Route<br />
14 (linking Fontana and San Bernardino); Route 1 (serving<br />
Colton and San Bernardino); and Route 4 (between<br />
Highland and San Bernardino). All of them are cross-town<br />
and operate with 15-minute headways on weekdays.<br />
Figure III-13: Weekday Passenger Boardings by Route<br />
Weekday Passenger Boardings by Route<br />
Route<br />
61<br />
2<br />
14<br />
1<br />
4<br />
3<br />
19<br />
15<br />
22<br />
5<br />
10<br />
68<br />
66<br />
11<br />
63<br />
9<br />
65<br />
62<br />
7<br />
71<br />
8<br />
90<br />
20<br />
67<br />
60<br />
70<br />
64<br />
29<br />
75<br />
28<br />
31<br />
30<br />
140<br />
202<br />
0 1000 2000 3000 4000 5000 6000<br />
Passenger Boardings<br />
Section III: Current<br />
Performance & Conditions<br />
50
Figure III-14 shows the number of revenue hours per route,<br />
per weekday. The routes with the most revenue hours again<br />
have 15-minute headways. They are followed by long<br />
routes with half-hourly service, while the routes with the<br />
least number of hours are peak-period single trippers.<br />
Figure III-14: Weekday Revenue Hours by Route<br />
Weekday Revenue Hours by Route<br />
Route<br />
61<br />
2<br />
15<br />
1<br />
68<br />
14<br />
19<br />
3<br />
22<br />
90<br />
4<br />
66<br />
65<br />
11<br />
5<br />
63<br />
10<br />
60<br />
71<br />
62<br />
9<br />
8<br />
67<br />
7<br />
20<br />
70<br />
64<br />
30<br />
31<br />
28<br />
29<br />
75<br />
140<br />
202<br />
0 50 100 150 200 250<br />
Revenue Hours<br />
51
Figure III-15 shows the average number of revenue<br />
passengers by hour for each route. Routes 4, 14, 3, and 2<br />
are busy throughout the entire day. Route 140 does not<br />
operate all day but rather as a peak tripper, making each trip<br />
almost full.<br />
Figure III-15: Weekday Passengers by Revenue<br />
Hour by Route<br />
Weekday Passengers by Revenue Hour by Route<br />
Route<br />
4<br />
14<br />
3<br />
2<br />
140<br />
1<br />
10<br />
202<br />
70<br />
5<br />
61<br />
71<br />
19<br />
9<br />
20<br />
7<br />
66<br />
22<br />
63<br />
15<br />
62<br />
67<br />
11<br />
75<br />
8<br />
29<br />
68<br />
65<br />
60<br />
28<br />
90<br />
64<br />
31<br />
30<br />
0 5 10 15 20 25 30 35 40 45 50<br />
Passengers Per Revenue Hour<br />
Section III: Current<br />
Performance & Conditions<br />
52
Figure III-16 shows the number of revenue miles operated by<br />
each route. Routes with large number of trips throughout<br />
the day and longer trips appear at the top. Route 90<br />
appears higher up the list than in previous figures because of<br />
its higher average speeds and long distance trips. Overall,<br />
routes are in the same relative position as in the graph of<br />
revenue hours.<br />
Figure III-16: Weekday Revenue Miles by Route<br />
Weekday Revenue Miles by Route<br />
Route<br />
61<br />
90<br />
15<br />
2<br />
22<br />
19<br />
1<br />
68<br />
3<br />
14<br />
4<br />
66<br />
65<br />
5<br />
11<br />
63<br />
71<br />
9<br />
8<br />
10<br />
62<br />
67<br />
7<br />
64<br />
20<br />
70<br />
75<br />
31<br />
28<br />
30<br />
29<br />
60<br />
140<br />
202<br />
0 500 1000 1500 2000 2500 3000<br />
Revenue Miles<br />
53
Figure III-17 illustrates the number of passengers per revenue<br />
mile by route. The top-ranked route is Route 202.<br />
Figure III-17: Weekday Passenger Per<br />
Revenue Mile by Route<br />
Weekday Passenger Per Revenue Mile by Route<br />
Route<br />
202<br />
14<br />
4<br />
1<br />
2<br />
3<br />
10<br />
5<br />
19<br />
7<br />
61<br />
20<br />
140<br />
70<br />
11<br />
62<br />
63<br />
9<br />
66<br />
15<br />
29<br />
22<br />
68<br />
71<br />
60<br />
67<br />
8<br />
65<br />
75<br />
28<br />
64<br />
31<br />
90<br />
30<br />
0 1 2 3 4 5 6 7 8 9<br />
Passengers Per Revenue Mile<br />
Section III: Current<br />
Performance & Conditions<br />
54
Figure III-18 illustrates one of the most useful indicators,<br />
weekday seat utilization based on passenger miles per seat<br />
mile. This indicator provides the percentage of time (in<br />
distance) that a seat on the bus is occupied over the entire<br />
service day. It literally measures the amount of service being<br />
put on the road that is being consumed. The indicator only<br />
uses actual information that is collected by the APC, and is<br />
not influenced by assumed averages such as revenue per<br />
passenger.<br />
Figure III-18: Weekday Seat Utilization<br />
by Route (Seat Miles)<br />
Weekday Seat Utilization by Route (Seat Miles)<br />
Route<br />
9<br />
8<br />
14<br />
3<br />
7<br />
10<br />
61<br />
1<br />
66<br />
5<br />
2<br />
19<br />
70<br />
202<br />
71<br />
15<br />
4<br />
11<br />
68<br />
67<br />
60<br />
140<br />
90<br />
62<br />
63<br />
20<br />
29<br />
75<br />
22<br />
65<br />
64<br />
28<br />
31<br />
30<br />
0% 10% 20% 30% 40% 50% 60%<br />
Seat Utilization<br />
*Seat Utilization by Distance Standard is 20% for all routes and 25% for Express Route 90<br />
55
Figure III-19 compares the operating costs by route. Since<br />
operating costs are constant rates per hour and per mile<br />
across all services (except contracted Routes 7, 8, 9, 30, 31,<br />
and 90), the graph is very similar to the graph of service<br />
hours (Figure III-14), except that the bottom axis is calibrated<br />
in dollars, rather than hours. There are some changes in<br />
ranking due to the variable costs on the contracted routes<br />
and some differences in the average scheduled speed of<br />
service.<br />
Figure III-19: Weekday Operating Cost by<br />
Route<br />
Weekday Operating Cost by Route<br />
Route<br />
61<br />
2<br />
15<br />
1<br />
68<br />
14<br />
19<br />
22<br />
3<br />
4<br />
66<br />
65<br />
11<br />
5<br />
90<br />
63<br />
10<br />
62<br />
71<br />
60<br />
67<br />
8<br />
9<br />
7<br />
20<br />
64<br />
70<br />
29<br />
28<br />
75<br />
30<br />
31<br />
140<br />
202<br />
$0 $2,000 $4,000 $6,000 $8,000 $10,000 $12,000 $14,000 $16,000 $18,000<br />
Cost<br />
Section III: Current<br />
Performance & Conditions<br />
56
Figure III-20 shows the operating ratio for each route. The<br />
operating ratio is the percentage of operating costs covered<br />
by farebox receipts. The results of this graph should be<br />
viewed with caution since they are heavily dependent on<br />
allocated costs and revenue assumptions.<br />
Figure III-20: Weekday Operating Ratio by Route<br />
Weekday Operating Ratio by Route<br />
Route<br />
4<br />
14<br />
140<br />
3<br />
2<br />
1<br />
9<br />
10<br />
7<br />
70<br />
5<br />
202<br />
61<br />
19<br />
20<br />
8<br />
66<br />
22<br />
63<br />
15<br />
62<br />
11<br />
75<br />
71<br />
29<br />
68<br />
67<br />
65<br />
90<br />
60<br />
31<br />
28<br />
64<br />
30<br />
0% 5% 10% 15% 20% 25% 30% 35% 40% 45% 50%<br />
Operating Ratio<br />
57
Section III: Current<br />
Performance & Conditions<br />
58<br />
Figure III-21 shows the cost per passenger per boarding by<br />
route. Route 30 is the most expensive route per passenger<br />
because of the low level of ridership. An influence in this<br />
low ridership is explained by the nature of the route, which<br />
serves University of Redlands as a common northeastern<br />
loop with route 31 (third most expensive route per<br />
passenger) and the data collection process. Manual data<br />
was collected during July 2004 with classes out of session<br />
(due to mechanical failure of trolley equipped with APC).<br />
This sampling period captured data for part of the alignment<br />
that is not reflective of the ridership throughout the regular<br />
school year. As classes are opened and student life is active<br />
in the fall, ridership is anticipated to rise, eventually lowering<br />
the cost per passenger.
Figure III-21: Weekday Cost per Passenger<br />
Boarding by Route<br />
Weekday Average Cost Per Boarding by Route<br />
Route<br />
30<br />
64<br />
31<br />
28<br />
60<br />
90<br />
65<br />
67<br />
68<br />
29<br />
71<br />
75<br />
11<br />
62<br />
15<br />
63<br />
22<br />
66<br />
8<br />
20<br />
19<br />
61<br />
202<br />
5<br />
70<br />
7<br />
10<br />
9<br />
1<br />
2<br />
3<br />
140<br />
14<br />
4<br />
$0.00 $2.00 $4.00 $6.00 $8.00 $10.00 $12.00 $14.00 $16.00 $18.00 $20.00<br />
Average Cost Per Passenger Boarding<br />
59
Access (ADA) Paratransit Service<br />
The Americans with Disabilities Act (ADA) requires that fixedroute<br />
transit operators provide, or ensure the provision of,<br />
“complementary” (i.e., comparable) paratransit service for<br />
those individuals who, because of their disability, cannot use<br />
the regular general-public fixed-route service. <strong>Omnitrans</strong> had<br />
an area-wide community transit program serving seniors,<br />
persons with disabilities, and social service agencies prior to<br />
the ADA civil rights regulations enacted in 1991. With<br />
implementation of its ADA Complementary Paratransit <strong>Plan</strong>,<br />
<strong>Omnitrans</strong> continued to provide community transit through<br />
its Core Access Service, but expanded the days and hours of<br />
operation for persons eligible for ADA complementary<br />
paratransit service to match the times of fixed-route<br />
availability. Today, <strong>Omnitrans</strong> Access Service provides a<br />
combination of subscription and ADA paratransit services.<br />
The subscription service is available to persons with an<br />
<strong>Omnitrans</strong> disability photo identification card (D-card).<br />
Access is provided on a curb-to-curb basis. The current<br />
contractor is Transportation Concepts, Inc.<br />
Typical <strong>Omnitrans</strong> Access<br />
Vehicle<br />
According to U.S. Census data, Access’ client base is<br />
growing, although perhaps not quite at the same rate as the<br />
rest of the county. While the total countywide population<br />
grew by 20.5 percent from 1990 to 2000, those aged 65 and<br />
older increased by 17.3 percent (from 124,900 to 146,459).<br />
Seniors comprised 8.8 percent of the total population in<br />
1990, but only 8.6 percent in 2000 (compared to a statewide<br />
average of 10.6 percent that year). Seniors are not allowed<br />
to ride Access based solely on the fact that they are seniors,<br />
but nevertheless, a large portion of Access' ridership base is<br />
made up of seniors. Comparison of data for persons with<br />
disabilities is not as readily available, due to changes in<br />
reporting definitions and categories, but a total of 302,693<br />
individuals in San Bernardino County reported some form of<br />
disability in 2000 (19.8 percent of the civilian noninstitutionalized<br />
population aged 5 or older).<br />
Access Service Characteristics and Fare Policy<br />
Figure III-22 provides a schedule of Access days and hours of<br />
operation.<br />
Section III: Current<br />
Performance & Conditions<br />
60
Figure III-22: Access Service Days and Span of Service<br />
Days<br />
Monday - Friday<br />
Monday - Friday<br />
Saturday<br />
Sunday<br />
Hours of Service<br />
7:00 a.m. - 6:00 p.m.<br />
4:00 a.m. - 7:00 a.m. and 6:00<br />
p.m. to 11:00 p.m.<br />
7:00 a.m. - 7:00 p.m.<br />
7:00 a.m. - 7:00 p.m.<br />
Category<br />
Core Service<br />
Non-Core<br />
Service<br />
Non-Core<br />
Non-Core<br />
Core Access service is available to D-card holders and social<br />
service agencies with which commitments existed prior to<br />
ADA. Core service is also available to persons with ADA<br />
certification. Non-Core service is available only to persons<br />
with ADA certification for extended weekday hours and on<br />
weekends. Therefore, ADA-certified persons can use Access<br />
during all times of service, while non-ADA and social service<br />
riders may only ride during Core times.<br />
The fare policy is the same for Core and Non-Core service, as<br />
shown in Figure III-23. In September 2003, <strong>Omnitrans</strong> went<br />
from a 39 zone fare structure to a 6 zone fare structure. This<br />
greatly improved the fare payment system for both the<br />
passenger and the drivers. More information on <strong>Omnitrans</strong><br />
fare policy can be found in Section II.<br />
Figure III-23: Access Service Fare Policy<br />
Base Fare $2.05 for first 3 zones; $2.80 for 4<br />
zones; $3.55 for 5 zones; $4.30<br />
for 6 zones.<br />
Companion $2.05 for first 3 zones; $2.80 for 4<br />
zones; $3.55 for 5 zones; $4.30<br />
for 6 zones.<br />
Personal Care Attendant<br />
(PCA)<br />
Children<br />
(46" tall and under)<br />
Free. Must be indicated on ADA<br />
rider Identification Card to ride<br />
free.<br />
Free. Limit two free per paying<br />
adult.<br />
It is important to note that consistent with the federal<br />
regulations, the actual additional “zonal” fare for both ADA<br />
riders and their companions is twice the base fixed-route<br />
fare, but the direct charge to ADA passengers is subsidized<br />
$0.25 through Measure I, which provides a program of<br />
reduced fares and enhanced service for seniors and disabled<br />
transit users in the Valley region, through the San<br />
61
Bernardino County Transportation Authority in cooperation<br />
with transit service agencies. In addition, a “subscription<br />
pass” is available for riders, primarily agency clients, who<br />
have subscription trips enrolled with Access. As an added<br />
benefit, holders of this pass can also use it for nonsubscription<br />
trips.<br />
Passenger Characteristics and Ridership Trends<br />
Figure III-24 shows Access service passengers by category for<br />
FY 2004. The West Valley has a higher percentage of<br />
agency trips (i.e., subscription and nutrition programs)<br />
compared to the East Valley. The East Valley, however, has a<br />
higher percentage of ADA trips. It is interesting to note that<br />
with the subscription fare change in September 2003, the<br />
percent of ADA passengers versus subscription passengers<br />
increased. In FY2001, the number of ADA and subscription<br />
trips were approximately equal. It is clear that the fare<br />
increase has shifted a number of people from subscription to<br />
ADA service. One could expect this gap to continue to<br />
increase in future years, due to the fact that the fare increase<br />
occurred during FY2004.<br />
Figure III-24: Access Service Passengers<br />
by Category, FY2004<br />
Category Total Access West Valley East Valley<br />
Companions 1.1% 0.8% 1.4%<br />
Regular 0.0% 0.1% 0.0%<br />
Disabled 4.3% 3.6% 5.0%<br />
ADA 71.3% 67.3% 75.5%<br />
Subscription 16.4% 22.3% 10.3%<br />
Personal Care<br />
6.8% 5.9% 7.6%<br />
Attendants (PCA’s)<br />
Free 0.1% 0.1% 0.1%<br />
Total Passengers<br />
100% 100% 100%<br />
456,922 230,919 226,003<br />
Ridership growth has been 13.5 percent between FY98 to<br />
FY04, as shown in Figure III-25, although the amount of<br />
service provided (as measured in revenue hours) has grown<br />
somewhat more.<br />
Section III: Current<br />
Performance & Conditions<br />
62
Figure III-25: Access Service<br />
Historical Ridership Trends<br />
Access Service Historical Comparison<br />
Category FY98 FY99 FY00 FY01 FY02 FY03 FY04 %<br />
Change<br />
FY98-04<br />
Total<br />
Access<br />
Passengers 425,812 402,489 419,686 432,093 455,746 468,186 456,922 7.7%<br />
Revenue<br />
Hours<br />
130,871 140,511 134,830 151,621 156,179 162,533 163,498 28.2%<br />
Passengers/<br />
Revenue Hr<br />
3.3 2.9 3.1 2.8 2.9 2.9 2.8<br />
In general, many-to-one (“gather”) and one-to-many<br />
(“scatter”) trip patterns related to group sites are more<br />
effectively served than many-to-many (e.g., individual) trips.<br />
ADA trips during the Core period also tend to be to key<br />
destinations. In the Non-Core times, trips are many-to-many.<br />
Figure III-26 indicates the impact of trip patterns on the<br />
productivity of Core and Non-Core Services.<br />
The decline in productivity is partially attributable to an<br />
increase in average trip length. In FY98, trips on demand<br />
response services operated by <strong>Omnitrans</strong> averaged 6.8 miles<br />
compared to 11.4 miles in FY04. This decrease in<br />
productivity has significantly impacted the average<br />
passengers per revenue hour carried during core service<br />
hours. Traffic, development patterns and increases in<br />
population are all major contributing factors to this. This also<br />
contributes to the significant increase in passengers carried<br />
during non-core hours. As the population increases in San<br />
Bernardino valley, travel patterns are shifting so that the<br />
ability to travel beyond typical daylight time is becoming<br />
important to Access passengers.<br />
63
Figure III-26: Access Service Historical Comparison –<br />
Core & Non- Core Service<br />
%<br />
Change<br />
Category FY98 FY99 FY00 FY01 FY02 FY03 FY04<br />
FY98-<br />
FY04<br />
Total Access<br />
Passengers 425,812 402,489 419,686 432,093 455,746 468,186 456,922 7%<br />
Revenue Hours 130,871 140,511 146,840 151,621 156,179 162,533 163,498 25%<br />
Passengers/<br />
Revenue Hour<br />
3.3 2.9 2.9 2.8 2.9 2.9 2.8 -14%<br />
Core Service<br />
Passengers 407,720 385,513 401,561 411,392 436,703 444,140 424,691 4%<br />
Revenue Hours 116,669 126,790 131,833 135,118 143,758 147,302 146,211 25%<br />
Passengers/<br />
Revenue Hour<br />
3.5 3.0 3.0 3.0 3.0 3.0 2.9 -17%<br />
Non-Core<br />
Passengers 18,092 16,976 18,125 20,701 19,043 24,046 32,231 78%<br />
Revenue Hours 14,202 13,721 15,006 16,503 12,422 15,231 17,287 22%<br />
Passengers/<br />
Revenue Hour<br />
1.3 1.2 1.2 1.3 1.5 1.6 1.9 46%<br />
Access Performance Results<br />
Performance statistics for FY 2004 are shown on the<br />
following page in figure III-27 for all Access service and two<br />
groupings: (1) Core and Non-Core; and (2) West and East<br />
Valleys. ACCESS services operating data and performance<br />
indicators for FY 2002 to 2005 are presented in Figure III-28.<br />
If the current cost structure had been in effect in FY01,<br />
Access service would have failed to meet the 10 percent<br />
farebox recovery requirement. The East Valley has the best<br />
performance of all the groupings shown.<br />
Section III: Current<br />
Performance & Conditions<br />
64
Here, trips are more highly concentrated and have a higher<br />
percentage of group trips with passengers paying a higher<br />
average fare.<br />
Figure III-27: Access Service<br />
Performance Statistics FY 2004<br />
Category Total West East Valley Core Non-Core<br />
Access Valley<br />
Total Passengers 456,922 230,919 226,003 424,691 32,231<br />
Total Miles 3,090,888 1,368,989 1721,899 2,745,629 345,259<br />
Total Hours 194,644 93,784 100,861 173,399 21,246<br />
Revenue Miles 2,528,935 1,104,457 1,424,478 1,104,457 1,424,478<br />
Revenue Hours 163,498 77,700 85,798 146,211 17,287<br />
Passenger $ 151,265 $ 47,386 $ 103,879 $ 138,508 $ 12,757<br />
Revenue<br />
Operating Cost (a) $7,707,297 $3,615,387 $ 3,940,645 $6,753,873 $ 802,159<br />
Net Subsidy $7,556,032 $3,615,387 $ 3,940,645 $6,753,873 $ 802,159<br />
Cost Per Revenue<br />
Hour<br />
Subsidy Per<br />
Passenger<br />
Passengers Per<br />
Revenue Hour<br />
Average Fare Per<br />
Passenger<br />
Farebox Recovery<br />
Ratio<br />
(a) Operating Costs are based on FY04 budgeted.<br />
$ 47.14 $ 47.14 $ 47.14 $ 47.14 $ 47.14<br />
$ 16.54 $ 15.66 $ 17.44 $ 15.90 $ 24.89<br />
2.8 3.0 2.6 2.9 1.9<br />
$ 0.33 $ 0.21 $ 0.46 $ 0.33 $ 0.40<br />
2.0% 1.3% 2.6% 2.0% 1.6%<br />
65
Figure III-28: ACCESS Services Operating Data and<br />
Performance Indicators<br />
FY<br />
2002<br />
Actual<br />
FY2003<br />
Actual<br />
FY2004<br />
Actual<br />
FY2005<br />
Budgeted<br />
Performance Measures<br />
Fare Revenue<br />
($000's) 930 926 855 783<br />
Annual Change -0.4% -7.7% -8.4%<br />
Operating Cost<br />
($000's) 5,895 6,487 7,708 8,072<br />
Annual Change 10.0% 18.8% 4.7%<br />
Performance Indicators<br />
Revenue Miles of<br />
Operation (000's) 2,447 2,544 2,529 2,645<br />
Annual Change 4.0% -0.6% 4.6%<br />
Service Miles of<br />
Operation (000's) 3,015 3,088 3,091 3,162<br />
Annual Change 2.4% 0.1% 2.3%<br />
Revenue Hours of<br />
Operation (000's) 156 163 163 174<br />
Annual Change 4.1% 0.6% 6.4%<br />
Service Hours of<br />
Operation 000's) 191 194 195 205<br />
Annual Change 1.4% 0.4% 5.5%<br />
Total Passengers<br />
Carried (000's) 456 468 457 499<br />
Annual Change 2.7% -2.4% 9.3%<br />
Service Performance Measures<br />
Operating Cost per<br />
Passenger ($) 12.93 13.85 16.87 16.17<br />
Annual Change 7.1% 21.8% -4.1%<br />
Operating Cost per<br />
Revenue Hour ($) 37.74 39.91 47.14 46.39<br />
Annual Change 5.7% 18.1% -1.6%<br />
Passengers per<br />
Revenue Hour 2.92 2.88 2.79 2.87<br />
Annual Change -1.3% -3.0% 2.7%<br />
Passengers per<br />
Revenue Mile 0.19 0.18 0.18 0.19<br />
Annual Change 5.8% 19.5% 0.1%<br />
Fare Recovery Ratio 16% 14% 11% 10%<br />
Annual Change -9.5% -22.3% -12.6%<br />
Section III: Current<br />
Performance & Conditions<br />
66
The impact of trip length between the East and West Valleys<br />
has a significant impact on performance, as illustrated on the<br />
following page where Core trip origins and destinations are<br />
plotted. Clearly, the trips in the East Valley are longer than<br />
those in the West Valley.<br />
<strong>Omnitrans</strong> has a policy of “no denials” for ADA trips, which<br />
contributes to the low productivity of Non-Core service.<br />
While this has been an issue of some controversy<br />
nationwide, due to expansive interpretations of the<br />
regulations in the late 1990s by FTA staff and some courts, a<br />
recent legal submittal prepared jointly by USDOT and the<br />
federal Department of Justice (DOJ) in the case of Anderson<br />
v. Rochester-Gennesee Regional Transportation Authority<br />
(dated October 25, 2002) clarifies that <strong>Omnitrans</strong>’ practice is<br />
consistent with the current interpretation. The DOT/DOJ<br />
letter states clearly that the regulations “impose an<br />
affirmative obligation on transit agencies to design, fund,<br />
and implement a next-day service to meet the foreseeable<br />
needs of all ADA-eligible individuals”, although<br />
circumstances truly beyond the transit system’s control might<br />
be dealt with on a case-by-case basis.<br />
Peer Review Performance Results<br />
In order to compare <strong>Omnitrans</strong> Access service to other<br />
providers, the most recent, audited, National <strong>Transit</strong><br />
Database data was consulted. <strong>Omnitrans</strong> Access service<br />
performance in FY 2001 is strong compared to peers with<br />
similar services, as shown in Figures III-29 and III-30. Peers<br />
were selected, both within and outside California, primarily<br />
on the basis of fleet size and/or general community<br />
characteristics.<br />
67
Figure III-29: Peer Review Performance Results FY 2001 – Totals<br />
Santa Cruz<br />
Metropolitan<br />
<strong>Transit</strong><br />
San Mateo<br />
County <strong>Transit</strong><br />
District<br />
Vehicles<br />
Operating<br />
Cost<br />
68 $ 2,388,700<br />
Revenue<br />
Hours<br />
Revenue<br />
Miles<br />
54,800 670,900<br />
Unlinked<br />
Passengers<br />
101,500<br />
Passenger<br />
Miles<br />
558,500<br />
69 $ 7,011,900 155,100 1,878,800<br />
211,800 1,779,200<br />
San Diego MTDB 81 $ 6,182,700 174,000 2,520,400<br />
679,800 3,051,400<br />
South Coast<br />
Area <strong>Transit</strong>,<br />
12 $ 1,350,600<br />
66,000<br />
26,400 460,300<br />
Ventura<br />
449,000<br />
Riverside <strong>Transit</strong><br />
49 $ 3,482,000<br />
Agency<br />
101,800 1,618,500<br />
225,600 1,549,800<br />
Sunline <strong>Transit</strong><br />
20 $ 2,405,500<br />
Agency<br />
43,800 778,400<br />
123,700 1,242,200<br />
Sacramento RTD 88 $ 8,576,300 135,100 2,314,200<br />
237,500 2,092,100<br />
Fort Worth<br />
Transportation 81 $ 2,791,200<br />
Authority<br />
91,400 2,401,000<br />
240,000 2,640,400<br />
Greater<br />
Richmond<br />
<strong>Transit</strong> Company<br />
40 $ 2,891,100 100,900 1,517,600<br />
184,500 1,886,200<br />
Maryland DOT 96 $ 9,879,800 312,000 5,151,000<br />
584,400 5,446,000<br />
Rivercity <strong>Transit</strong><br />
Authority, KY<br />
74 $ 6,750,400 187,700 3,275,700<br />
331,800 2,875,400<br />
<strong>Omnitrans</strong> 82 $ 5,289,500 166,100 2,304,000<br />
481,500 4,161,400<br />
Section III: Current<br />
Performance & Conditions<br />
68
Santa Cruz<br />
Metropolitan<br />
<strong>Transit</strong><br />
San Mateo County<br />
<strong>Transit</strong> District<br />
Figure III-30: Peer Review Performance Results<br />
(FY 2001) – Per Unit<br />
Cost/Hour Cost/<br />
Pass. Mile<br />
Passengers/<br />
Hour<br />
Ave. Op.<br />
Speed<br />
Ave. Trip<br />
Length<br />
Cost/<br />
Passenger<br />
$ 43.59 $ 4.28 1.85 12.24 5.50 $ 23.53<br />
$ 45.21 $ 3.94 1.37 12.11 8.40 $ 33.11<br />
San Diego MTDB $ 35.53 $ 2.03 3.91 14.49 4.49 $ 9.09<br />
South Coast Area $ 51.16 $ 3.01 2.50 17.44 6.80 $ 20.46<br />
<strong>Transit</strong>, Ventura<br />
Riverside <strong>Transit</strong> $ 34.20 $ 2.25 2.22 15.90 6.87 $ 15.43<br />
Agency<br />
Sunline <strong>Transit</strong> $ 54.92 $ 1.94 2.82 17.77 10.04 $ 19.45<br />
Agency<br />
Sacramento RTD $ 63.48 $ 4.10 1.76 17.13 8.81 $ 36.11<br />
Fort Worth $ 30.54 $ 1.06 2.63 26.27 11.00 $ 11.63<br />
Transportation<br />
Authority<br />
Greater Richmond $ 28.65 $ 1.53 1.83 15.04 10.22 $ 15.67<br />
<strong>Transit</strong> Company<br />
Maryland DOT $ 31.67 $ 1.81 1.87 16.51 9.32 $ 16.91<br />
Rivercity <strong>Transit</strong><br />
$ $ 1.77 17.45 8.67 $ 20.34<br />
Authority, KY<br />
35.96 2.35<br />
<strong>Omnitrans</strong> $ 31.85 $ 1.27 2.90 13.87 8.64 $ 10.99<br />
Source: National <strong>Transit</strong> Database, FY2001<br />
Reservations and Scheduling Practices<br />
Telephone reservation hours are daily from 8:00 a.m. to 5:00<br />
p.m. ADA passengers may book individual trips up to 14<br />
days in advance. Persons with an <strong>Omnitrans</strong> Disability ID<br />
may request trips for Core hours (7 a.m. to 6 p.m.), on a<br />
space-available basis, by calling in the day before. If trips<br />
cannot be immediately fit into a run when the customer<br />
calls, they are batched and scheduled when possible, with a<br />
callback to the customer, usually the evening before the trip<br />
time. Reservations must be made no later than the day prior<br />
to the requested travel date, although same-day service<br />
requests are met as permitted by available space.<br />
Occasionally, same-day requests must be denied due to<br />
Dispatch’s inability to contact an available vehicle by radio.<br />
Maps of trip origins for the West and East Valleys are shown<br />
in Figures III-31 and III-32 and are reflective of the high<br />
percentage of regular trips for group and other key<br />
destinations.<br />
69
Figure III-31
Figure III-32
Access passengers are encouraged to telephone at least two<br />
hours in advance for cancellations. Failure to cancel will<br />
result in a “No Show.” Repeated no shows can result in<br />
denial of service to that individual. Figure III-33 indicates<br />
that cancellations for trip requests outside the Core period<br />
(including weekends) tend to be higher than during the<br />
Core period. Figure III-34 shows major destinations that<br />
Access passengers travel to within the service area.<br />
Figure III-33: Cancellations, No Shows and<br />
On-Time Performance – May 2004<br />
Service Type Cancelled On-Time<br />
No Show<br />
Late<br />
No Show<br />
On Time Late<br />
Complete Complete<br />
% No<br />
Show<br />
Total % On Time<br />
Trips of Trips<br />
Scheduled Attempted<br />
EV Core 9% 5% 1% 73% 12% 6% 17,726 86%<br />
WV Core 5% 5% 0% 85% 5% 5% 13,754 94%<br />
EV Non-Core 13% 5% 1% 71% 10% 6% 2,009 87%<br />
WV Non-Core 7% 6% 1% 82% 4% 7% 2,163 94%<br />
EV Saturday 19% 8% 1% 67% 5% 9% 513 93%<br />
WV Saturday 10% 11% 1% 69% 9% 12% 249 89%<br />
EV Sunday 24% 8% 2% 59% 7% 10% 335 88%<br />
WV Sunday 24% 11% 1% 60% 3% 12% 217 94%<br />
Section III: Current<br />
Performance & Conditions<br />
72
Figure III-34: Major Trip Destinations<br />
Street Address<br />
City<br />
%<br />
Standing<br />
Order<br />
Template<br />
Adult Day Care 5.7%<br />
10221 Trademark St. Rancho Cucamonga 0.2%<br />
201 W. Mill St. San Bernardino 0.2%<br />
190 N. Arrowhead Rialto 0.4%<br />
12980 2nd St. Yucaipa 0.6%<br />
10550 Ramona Ave. Montclair 0.7%<br />
1235 E. Francis St. Ontario 0.8%<br />
268 N. Mcarthur Way Upland 1.2%<br />
11406 Loma Linda Dr. Loma Linda 1.6%<br />
Disabled Services 0.9%<br />
2032 E. Olive St. Ontario 0.1%<br />
25787 Mesa Ct. San Bernardino 0.1%<br />
2107 Jane St. Highland 0.2%<br />
6913 Buchanan Ave. Highland 0.2%<br />
7119 Beryl St. Alta Loma 0.3%<br />
Medical Facilities 2.2%<br />
399 E. Highland Ave. San Bernardino 0.1%<br />
4445 Riverside Dr. Chino 0.2%<br />
11375 Anderson St. Loma Linda 0.2%<br />
1471 Riverside Ave. Rialto 0.2%<br />
1500 N. Waterman Ave. San Bernardino 0.2%<br />
1850 N. Riverside Ave. Rialto 0.4%<br />
636 Brier Dr. San Bernardino 0.4%<br />
400 N. Pepper Colton 0.5%<br />
Schools 6.8%<br />
557 W. 5th St. Ontario 0.2%<br />
5500 University Parkway San Bernardino 0.3%<br />
932 W. Cypress Ave. Redlands 0.3%<br />
27215 E. Baseline Highland 0.4%<br />
118 E. Foothill Rialto 0.5%<br />
701 S. Mt. Vernon San Bernardino 0.5%<br />
2145 E. Highland Ave. San Bernardino 0.6%<br />
9820 Citrus Ave. Fontana 0.6%<br />
455 E. Olive St. San Bernardino 0.6%<br />
5885 Haven Ave. Rancho Cucamonga 0.6%<br />
17500 Foothill Blvd. Fontana 0.8%<br />
796 E. 6th St. San Bernardino 1.3%<br />
Street Address<br />
City<br />
%<br />
Standing<br />
Order<br />
Template<br />
Workshops 17.5%<br />
250 S. Date Ave Rialto 0.4%<br />
2364 N. Del Rosa Ave. San Bernardino 0.4%<br />
4669 Holt Blvd Montclair 0.6%<br />
609 Lemon Ave. Ontario 0.8%<br />
8880 Benson Ave. Montclair 0.9%<br />
9007 Arrow Route Rancho Cucamonga 1.0%<br />
8520 Archibald Ave. Rancho Cucamonga 1.3%<br />
8333 Almeria Ave. Fontana 1.6%<br />
740 S. Allen St. San Bernardino 1.7%<br />
8129 Palm Lane San Bernardino 1.8%<br />
4650 Brooks St. Montclair 2.0%<br />
8675 Boston Pl Rancho Cucamonga 2.1%<br />
8939 Vernon Ave. Montclair 2.7%<br />
Miscellaneous 3.7%<br />
5913 Portsmouth St. Chino 0.1%<br />
1642 W 27th St. San Bernardino 0.1%<br />
24317 4th St. San Bernardino 0.1%<br />
34460 Yucaipa Blvd. Yucaipa 0.1%<br />
1700 W 5th St San Bernardino 0.1%<br />
1 Mills Circle Ontario 0.2%<br />
10532 Acacia St. Rancho Cucamonga 0.2%<br />
2134 Hickory Ave. Ontario 0.3%<br />
5000 South Plaza Lane Montclair 0.3%<br />
2326 S. Cucamonga Ave. Ontario 0.6%<br />
165 W. Hospitality Ln San Bernardino 0.7%<br />
4650 Arrow Hwy Montclair 0.9%<br />
73
Stakeholder comments indicate that on-time performance is<br />
better now than in the past. At the same time, stakeholders<br />
and drivers both noted that some of the passenger ride times<br />
seem excessive. Figure III-35 shows that about 77 percent of<br />
Core period trips are 60 minutes or less. There are, however,<br />
a number of trips that exceed two hours, and a small<br />
percentage of these are more than three hours.<br />
Figure III-35: Access Service Ride Time – May 2004<br />
Service Type 30<br />
Minutes<br />
or Less<br />
31 – 60<br />
Minutes<br />
61 – 90<br />
Minutes<br />
91 –<br />
120<br />
Minutes<br />
2+<br />
Hours<br />
# Trips<br />
2+<br />
Hours<br />
Total<br />
Trips<br />
Completed<br />
EV Core 37% 33% 19% 8% 3% 480 14,444<br />
WV Core 40% 37% 16% 5% 1% 178 16,200<br />
EV Non-Core 39% 26% 18% 11% 5% 55 1,034<br />
WV Non-Core 39% 28% 29% 2% 1% 4 529<br />
EV Saturday 73% 19% 4% 1% 2% 7 435<br />
WV Saturday 69% 24% 4% 3% .4% 1 239<br />
EV Sunday 74% 19% 5% 1% .7% 2 303<br />
WV Sunday 78% 15% 6% .6% 0% 0 162<br />
There are opportunities to improve scheduling efficiency and<br />
improve customer service by reducing ride times through<br />
load balancing between vehicles. Improving productivity is<br />
a worthy goal, but not when ride times become excessive.<br />
However, it should also be noted that some fixed-route trips<br />
across the County could also be quite (comparably) lengthy.<br />
Certification Policies and Practices<br />
The Access eligibility process for ADA passengers is based on<br />
a “self-certification” application form that is submitted to<br />
<strong>Omnitrans</strong> and reviewed by in-house staff. Many agencies<br />
today are moving toward variations on an in-person<br />
interview or assessment to determine the extent to which an<br />
individual can or cannot use the regular fixed-route service.<br />
One of the most comprehensive of these is the Access<br />
Services, Inc. program in neighboring Los Angeles County.<br />
While in the future, <strong>Omnitrans</strong> may look at a system similar<br />
to Los Angeles County’s Access Services, Inc. program, today<br />
this level of analysis is not done due to staffing and<br />
budgetary requirements of such a service.<br />
Section III: Current<br />
Performance & Conditions<br />
74
In addition, any individual who has the less-stringent<br />
<strong>Omnitrans</strong> Disability ID card (for riding the fixed-route system<br />
at the federally-required discount fare) can ride Access on a<br />
space available basis, during the Core period (7:00 a.m. to<br />
6:00 p.m.).<br />
Omnilink Services<br />
In January 2002, <strong>Omnitrans</strong> began a new program of<br />
community link services to provide coverage in low-density<br />
areas that are difficult to serve effectively with traditional<br />
fixed-route bus service. This service is called Omnilink and<br />
includes the following:<br />
<br />
<br />
<br />
Yucaipa Omnilink – the existing Yucaipa/ Calimesa<br />
Dial-A-Ride service was renamed.<br />
Grand Terrace and South Colton Omnilink – service<br />
combines a fixed-route in South Colton and a dial-aride<br />
service for Grand Terrace. The current fixed-route<br />
travels to Kaiser Clinic, and on an as-needed basis to<br />
the V.A. Hospital in Loma Linda.<br />
Chino Hills Omnilink – provides new dial-a-ride service<br />
in Chino Hills west of SR-71 to the County Line.<br />
Service is provided to the Chino Senior Center as<br />
requested.<br />
Omnilink provides general<br />
public demand response<br />
service in the cities of<br />
Chino Hills, Colton/ Grand<br />
Terrace, and Yucaipa.<br />
In addition to providing policy-based service coverage in<br />
low-density areas, Omnilink service is designed to provide<br />
feeder service to/from <strong>Omnitrans</strong> bus routes.<br />
Omnilink Service Characteristics and Fare Policy<br />
A private company, under contract to <strong>Omnitrans</strong>, provides<br />
Omnilink service. The Omnilink service provider is also the<br />
Access Service provider. Omnilink services operate seven<br />
days as shown in Figure III-36.<br />
75
Figure III-36: Omnilink Days & Hours of Service<br />
Effective January 2002<br />
Days<br />
Monday - Friday<br />
Saturday<br />
Sunday<br />
Hours of Service<br />
7:00 a.m. - 6:00 p.m.<br />
7:30 a.m. - 5:30 p.m.<br />
8:00 a.m. - 2:00 p.m.<br />
Telephone reservation hours begin 30-minutes before<br />
service begins and ends 30-minutes before service ends.<br />
Passengers may make reservations up to three days in<br />
advance of the trip. Same-day service is also provided.<br />
Passengers making the same trip three or more days per<br />
week may request “Repeater” service where one reservation<br />
is made for all trips in the upcoming month.<br />
Passengers are encouraged to telephone at least two hours<br />
in advance for cancellations. Failure to cancel will result in a<br />
“No Show.” Three passenger no-shows in an unspecified<br />
time period will result in denial of advance reservation<br />
service for six months. Repeated no-shows can result in<br />
denial of service.<br />
Current fares for Omnilink service are more than double the<br />
regular cash fare for fixed-route service. This reflects the<br />
premiere nature of curb-to-curb service. The special<br />
introductory fare that was being offered on the Chino Hills<br />
and Grand Terrace/South Colton services expired in<br />
September 2003. However, effective January 2004,<br />
<strong>Omnitrans</strong> 1-day, 7-day and 31-day bus passes were allowed<br />
for payment of the Omnilink fare. In addition, free transfers<br />
to <strong>Omnitrans</strong> fixed-route buses are available at connecting<br />
locations. Passengers give the fixed-route driver the transfer,<br />
and a day pass is issued, good for travel all day on the fixedroute<br />
buses. The Omnilink fare structures are in Figure III-37.<br />
Section III: Current<br />
Performance & Conditions<br />
76
Figure III-37: Omnilink Fare Structure<br />
(Effective September 2004)<br />
Fare Categories (one-way)<br />
Regular $ 2.50<br />
Seniors (60 and over)* $ 1.25<br />
Persons with a Disability* $ 1.25<br />
Students* $ 1.25<br />
Children (46" and under) **<br />
Free<br />
* Proof of eligibility required for discount.<br />
**Limit two free per fare-paying adult.<br />
Passenger Characteristics and Utilization<br />
Figure III-38 provides an overview of Omnilink passengers by<br />
type of passenger for FY 2004. Student fares are not tracked<br />
separately and are included as Regular fares in the<br />
summaries provided.<br />
The Yucaipa Omnilink service is a long standing which was<br />
called Yucaipa Dial-A-Ride prior to the implementation of<br />
Omnilink in FY 2002. This is reflected in the high ridership<br />
numbers. Despite the fare incentive, seniors, Nutrition<br />
Program, ADA, and Disabled passengers prefer the Yucaipa<br />
Omnilink service to that of Access. This may be explained by<br />
the fact that the Yucaipa service is open to the general public<br />
whereas Access requires advance certification. In addition,<br />
the Yucaipa service pre-dates that of Access.<br />
Figure III-38 Omnilink Passengers by Category –FY2004<br />
Category Yucaipa Chino<br />
Hills<br />
Grand<br />
Terrace<br />
South Colton<br />
Fixed-route<br />
Regular & Companion 19.5% 58.1% 30.1% 30.3%<br />
Senior 54.5% 19.9% 25.1% 19.0%<br />
Nutrition Program 0.0% 0.0% 0.0% 0.0%<br />
Disabled 23.4% 14.5% 42.0% 39.5%<br />
ADA Certified 2.1% 5.5% 0.1% 8.1%<br />
Subscription 0.0% 0.0% 0.0% 0.0%<br />
Transfer 0.0% 0.0% 0.0% 0.0%<br />
Free Attendant 0.2% 1.3% 0.1% 0.7%<br />
Free Children 0.3% 0.7% 2.6% 2.4%<br />
Total Passengers 100.0% 100.0% 100.0% 100.0%<br />
Total Passengers 36,821 6,423 1,399 1085<br />
% of OmniLink Service 80.5% 14.0% 3.1% 2.4%<br />
The Chino Hills service has the highest regular ridership of<br />
the Omnilink services. Approximately 58 percent are regular<br />
(includes student riders). This is down from FY2002, where<br />
approximately 87% of ridership was regular. This reduction<br />
is mostly due to the elimination of the reduced introductory<br />
77
fare, and the students that took advantage of the program.<br />
The Grand Terrace/South Colton fixed-route Omnilink<br />
services have significantly lower ridership than the other<br />
Omnilink services. The Grand Terrace/South Colton<br />
Omnilink services, however, are more balanced in terms of<br />
ridership, with seniors and persons with disabilities making<br />
up a higher percentage of the ridership.<br />
Performance Results<br />
Performance statistics for Omnilink service are shown in<br />
Figure III-39. May 2004 statistics were used for the analysis.<br />
At this point, ridership and performance have declined since<br />
the last SRTP.<br />
Figure III-39: Omnilink Performance Statistics – May 2004<br />
Yucaipa Chino Hills Grand Terrace/<br />
South Colton<br />
Passengers 2,992 661 73<br />
Total Miles 21,145 6,599 2,105<br />
Total Hours 1,272 573 215<br />
Revenue Miles 13,995 4,954 1,523<br />
Revenue Hours 1,101 460 163<br />
Passenger Revenue $ 3,618 $ 1,042 $ 217<br />
Operating Cost 65,342.64 21,722.43 8,163.55<br />
Net Cost $ 61,724.64 $ 20,680.43 $ 7,946.55<br />
Cost per Revenue Hour $ 59.35 $ 47.22 $ 50.08<br />
Subsidy Per Passenger $ 20.63 $ 31.29 $ 108.86<br />
Passengers per Revenue Hour 2.7 1.4 0.4<br />
Farebox Recovery Ratio 6% 5% 3%<br />
None of the services meet even a 10-percent farebox<br />
recovery ratio. At five passengers per hour and the current<br />
fare, two services would achieve a 10 percent farebox<br />
recovery ratio.<br />
The productivity of Omnilink service, measured by<br />
passengers per revenue hour, is below the targets<br />
established in the <strong>Omnitrans</strong> FY 2004 – FY 2009 <strong>Short</strong> <strong>Range</strong><br />
<strong>Transit</strong> <strong>Plan</strong> (i.e., five passengers per hour).<br />
The Yucaipa service is the best at 2.7 passengers per revenue<br />
hour. Chino Hills Omnilink service is down from the last SRTP<br />
at 1.4 passengers per hour. Performance on the Grand<br />
Terrace/South Colton service is poor.<br />
Section III: Current<br />
Performance & Conditions<br />
78
It is unlikely that any of these services will achieve<br />
productivity targets in the near future, even with<br />
restructuring and changes in hours of service and vehicle<br />
deployment. Other agencies with mature demand response<br />
feeder service have been lucky to achieve three-to-four<br />
passengers per hour. The Yucaipa service is mature at 2.7<br />
passengers per hour and has been declining over time. The<br />
Chino Hills service may achieve three-to-four passengers per<br />
hour with tweaking and the creation of peak-period routes<br />
into Los Angeles, Riverside, and Orange Counties.<br />
Figure III-40 presents operating data and performance<br />
indicators for the three Omnilinks (Grand Terrace, Yucaipa,<br />
and Chino Hills). Performance continues to decline on the<br />
Yucaipa service, as shown in Figure III-40. This may be due,<br />
in part, because the less expensive, and very similar, Access<br />
service is available to persons with disabilities. Additionally,<br />
the demographics have been changing.<br />
While the overall population is growing, both the numbers<br />
of elderly and low-income persons are declining. Further, as<br />
development expands outward in the Yucaipa area, the<br />
efficiency of the service will decline.<br />
79
Figure III-40: Omnilink Performance Statistics<br />
Yucaipa Chino Hills Grand Terrace/S. Colton<br />
FY03 FY04 FY03 FY04 FY03 FY04<br />
Passengers 40,640 36,821 8,153 6,423 3,314 1,399<br />
Total Miles 206,477 219,076 54,941 66,694 28,308 23,838<br />
Total Hours 15,815 15,523 4,145 5,431 2,152 2,353<br />
Revenue Miles 13,127 147,527 42,402 47,647 20,252 17,947<br />
Revenue Hours 13,534 13,298 3,637 4,318 1,972 1,978<br />
Passenger Revenue $ 54,135 $ 48,173 $ 9,010 $ 10,850 $ 4,308 $ 3,945<br />
Operating Cost (a) $ 812,416.55 $ 797,416.51 $ 157,136.95 $ 205,889.21 $ 81,711.44 $ 89,343.41<br />
Net Subsidy $ 758,281.55 $ 749,243.51 $ 148,126.95 $ 195,039.21 $ 77,403.44 $ 85,398.41<br />
Cost per Revenue<br />
Hour<br />
$ 60.03 $ 59.97 $ 43.21 $ 47.68 $ 41.44 $ 45.17<br />
Subsidy Per<br />
Passenger<br />
$ 18.66 $ 20.35 $ 18.17 $ 30.37 $ 23.36 $ 61.04<br />
Passengers per<br />
Revenue Hour<br />
3.0 2.8 2.2 1.5 1.7 0.7<br />
Farebox Recovery<br />
Ratio<br />
7% 6% 6% 5% 5% 4%<br />
(a) Operating Costs based on Board Adopted Cost Allocation <strong>Plan</strong>. $51.37 per total hour for Yucaipa; $37.97 per total hour for Grant<br />
Terrace/S. Colton; and $37.91 for Chino Hills.<br />
Section III: Current<br />
Performance & Conditions<br />
80
Regional <strong>Transit</strong> Services and <strong>Plan</strong>s<br />
As part of the existing conditions analysis it is important to<br />
take into account the plans of other agencies that may have<br />
an impact on <strong>Omnitrans</strong>’ service.<br />
Below is a brief agency-by-agency look at planned projects<br />
and service changes (or recently implemented changes) that<br />
are expected to have some impact on <strong>Omnitrans</strong> and its<br />
riders.<br />
The agencies studied include Riverside <strong>Transit</strong> Agency, Victor<br />
Valley <strong>Transit</strong> Authority, Foothill <strong>Transit</strong>, Mountain Area<br />
Regional <strong>Transit</strong> Authority, Los Angeles County Metropolitan<br />
Transportation Authority, SunLine <strong>Transit</strong> Agency, Metrolink,<br />
Southern California Association of Governments (SCAG), and<br />
freeway and roadway projects that have been approved<br />
with the passing of Measure I (SANBAG).<br />
Neighboring <strong>Transit</strong> Providers<br />
Riverside <strong>Transit</strong> Authority (RTA)<br />
Riverside <strong>Transit</strong> Agency realigned their Route 36 to operate<br />
between Highland Springs Avenue in Banning to the<br />
Redlands Mall. Specifically, routing between Banning and<br />
Calimesa City Hall/Calimesa Senior Center remained<br />
unchanged. However, when the route 36 departs the<br />
Calimesa City Hall, it travels on County Line Road to the 10<br />
freeway to reach the Redlands Mall from the Orange Street<br />
freeway exit. Operating times are between 7:30 a.m. and<br />
5:30 p.m. weekdays and between 8:00 a.m. and 4:00 p.m. on<br />
Saturday. The realignment, effective July 5, 2004, connects<br />
with <strong>Omnitrans</strong> Routes 8, 9, 15, 19, 30 (Red Line), & 31 (Blue<br />
Line), at the Redlands Mall.<br />
Foothill <strong>Transit</strong><br />
Foothill <strong>Transit</strong>, the main service provider to Los Angeles<br />
County’s San Gabriel Valley, has implemented some changes<br />
to routes that connect with <strong>Omnitrans</strong>. In September 2002,<br />
a 12% increase in service went into force, but ridership<br />
declined considerably. In response to this issue, Foothill<br />
<strong>Transit</strong> reduced its services, effective on September 5, 2004.<br />
The following Foothill <strong>Transit</strong> Lines that join <strong>Omnitrans</strong><br />
Routes were altered:<br />
81
Line 191 (Pomona-Cal Poly), which allows transfers to<br />
<strong>Omnitrans</strong> at the Pomona Transcenter, reduced weekend<br />
evening service, with the last trip at Pomona Transcenter<br />
leaving one hour earlier, westbound, and arriving one hour<br />
earlier, eastbound. This line is served by peak headways of<br />
30 minutes and one-hour headways during non-peak<br />
periods on weekdays, and hourly on weekends.<br />
Line 193 (Pomona-Cal Poly), which allows transfers at the<br />
Pomona Transcenter, reduced eastbound weekend evening<br />
service, with the last trip arriving at Pomona Transcenter one<br />
hour earlier. This line is served by peak headways of 30<br />
minutes and one-hour headways during non-peak periods<br />
on weekdays, and hourly on weekends.<br />
Line 292 (Claremont-Pomona), which previously allowed<br />
transfers at the Montclair Transcenter and Pomona<br />
Transcenter, will eliminate stops at the Montclair Transcenter.<br />
Operation times also changed to peak hours only on<br />
weekdays (half hourly) and weekends (hourly). This line<br />
previously operated with Line 294 and was served by<br />
headways of 120 minutes throughout the day on weekdays.<br />
Line 480 (Montclair - West Covina - El Monte - Express Service<br />
to Downtown Los Angeles), which allows transfers at the<br />
Montclair Transcenter and Pomona Transcenter, decreased<br />
Sunday service frequencies from 15 minutes to 20 minutes.<br />
Line 294 (Claremont-Montclair-Pomona), which met with<br />
<strong>Omnitrans</strong> at the Montclair Transcenter and Pomona<br />
Transcenter, was eliminated. This line previously operated<br />
with Line 292 and was served by headways of 120 minutes<br />
throughout the day on weekdays and weekends.<br />
Foothill <strong>Transit</strong> is planning to extend service on Route 497 to<br />
meet with <strong>Omnitrans</strong> at the Chino <strong>Transit</strong> Center in March of<br />
2005. Route 497 is planned to travel from Downtown Los<br />
Angeles to City of Industry Park and Ride, Chino Park and<br />
Ride, and Chino <strong>Transit</strong> Center. This line is currently<br />
operating with 10-20 minute frequencies on weekdays only.<br />
Section III: Current<br />
Performance & Conditions<br />
82
Victor Valley <strong>Transit</strong> Authority (VVTA)<br />
Due to funding insufficiencies and ridership decline, the<br />
Victor Valley Commuter has reduced its service, effective July<br />
1, 2004. The down-the-hill commuter service reduced bus<br />
service to both San Bernardino and Rancho Cucamonga<br />
during the AM and PM peak hours. There are three inbound<br />
buses and three out-bound buses to/from San<br />
Bernardino (with stops at 4th Street, the Metrolink Station,<br />
and Cal State University San Bernardino). The stop at Cal<br />
State San Bernardino is a new addition. There are three inbound<br />
and three out-bound buses to/from Rancho<br />
Cucamonga (with stops at Metrolink Station and Ontario<br />
Mills).<br />
SunLine <strong>Transit</strong> Agency<br />
Sunline <strong>Transit</strong> Agency has suspended its regional weekday<br />
service to the Inland Empire entirely, effective July 1, 2004.<br />
Sunlink has provided weekday service from Palm Desert and<br />
Palm Springs to Cabazon, Banning, Beaumont, Loma Linda<br />
and Riverside’s downtown transit Metrolink stations since<br />
January 2000. At Loma Linda, Sunlink connected with<br />
<strong>Omnitrans</strong> routes 2, 8, 9, & 19. In efforts to reduce operating<br />
cost with minimal system impact, the commuter service was<br />
determined to be halted until revenue sources are available.<br />
Mountain Area Regional Transportation Authority (MARTA)<br />
MARTA has no upcoming changes to its service that will<br />
impact <strong>Omnitrans</strong> service.<br />
Los Angeles County Metropolitan Transportation Authority<br />
(LACMTA)<br />
The Los Angeles County transit operators have established a<br />
monthly pass program that gives EZ <strong>Transit</strong> Pass holders<br />
unlimited local transfers into most of the county and<br />
municipal transit operators at no additional charge. The<br />
LACMTA began generating the Regional Los Angeles<br />
County EZ <strong>Transit</strong> Pass as of July 1, 2003. The EZ <strong>Transit</strong> Pass<br />
is accepted as valid base fare at the point of transfer<br />
between intersecting Los Angeles County EZ <strong>Transit</strong> Pass<br />
services (e.g. Foothill <strong>Transit</strong>) and <strong>Omnitrans</strong> services.<br />
83
Regional Transportation Agencies and <strong>Plan</strong>s<br />
Metrolink<br />
The Interagency Service Transfer Agreement between<br />
Southern California Regional Rail Authority<br />
(SCRRA)/Metrolink and <strong>Omnitrans</strong> was revised as of January<br />
2004. The contract between both parties consists of the<br />
agreement and an amended provision of transfer services of<br />
Metrolink tickets, honored by <strong>Omnitrans</strong>.<br />
Metrolink has added two additional weekday a.m. peak trips<br />
on the San Bernardino Line, (to Los Angeles) from San<br />
Bernardino at 4:35 a.m. to Montclair at 5:15 a.m., and (to San<br />
Bernardino) from Montclair at 5:20 a.m. to San Bernardino at<br />
6:10 a.m. Also on the San Bernardino Line (to Los Angeles),<br />
the last trip departing from San Bernardino, will leave five<br />
minutes earlier, at 7:15 p.m. <strong>Omnitrans</strong> Routes 1 and 90<br />
currently connect with Metrolink at the San Bernardino<br />
Metrolink Station. The schedule change occurred in October<br />
2004.<br />
A 4 percent increase in Metrolink fares took effect in July 1,<br />
2004.<br />
Freeway and Roadway Projects (SANBAG)<br />
San Bernardino Associated Governments (SANBAG) is<br />
undertaking a number of freeway improvement projects;<br />
some are currently under construction and some are<br />
projected for coming years.<br />
Construction on State Route 210, the Foothill Freeway, is<br />
currently in progress. Construction began on the last eight<br />
miles of State Route 210 in Rialto in July 2003. Construction<br />
is expected to start on the portion of the freeway in San<br />
Bernardino in the fall of 2004. The final eight miles of Route<br />
210 will extend through a small portion of Fontana, and<br />
then cross through the cities of Rialto and San Bernardino.<br />
Once completed, it will link to the existing Route 30 in San<br />
Bernardino and include an interchange with Interstate 215<br />
in San Bernardino. The estimated date of completion for this<br />
last section of the freeway is 2007. <strong>Omnitrans</strong> does not<br />
currently operate on Route 210.<br />
Section III: Current<br />
Performance & Conditions<br />
84
Construction of the I-10 truck climbing lane is expected to<br />
finish in late calendar year 2004. This project will add an<br />
extra lane for trucks on the steep incline between Ford Street<br />
in Redlands and Live Oak Canyon Road in Yucaipa in order<br />
to remove the trucks from the mixed-flow lanes and reduce<br />
congestion. <strong>Omnitrans</strong> does not currently operate on this<br />
stretch of I-10.<br />
The widening of Interstate 10 in Redlands is in its final design<br />
phase. This phase will prepare the project for construction,<br />
which is scheduled to begin in early calendar year 2005 and<br />
last about two years. The project would add one lane in<br />
each direction between Orange Street and Ford Street (2.5<br />
miles) in order to match the four lanes in each direction that<br />
are found west of Orange Street, and thereby reducing the<br />
current bottleneck. The additional eastbound lane will<br />
match a new eastbound lane being built as part of the I-10<br />
Truck-Climbing Lane project. The new lanes will be built next<br />
to the freeway median and will feature a new freeway<br />
barrier. <strong>Omnitrans</strong> does not currently operate on this stretch<br />
of I-10.<br />
SANBAG is in the detailed design stages for the addition of a<br />
High Occupancy Vehicle lane in both the northbound and<br />
southbound directions on I-215 between I-10 and SR-30. A<br />
number of other improvements will be made, including the<br />
widening of bridges and reconstruction of interchanges.<br />
The project is slated for completion by 2010. Route 90<br />
currently operates on I-215 between I-10 and downtown<br />
San Bernardino. This improvement will improve the<br />
reliability of <strong>Omnitrans</strong> Route 90 and reduce travel times.<br />
SANBAG is working with the Riverside County<br />
Transportation Commission to complete preliminary<br />
engineering and environmental documents for the widening<br />
of Interstate 215, south of Interstate 10. This 6.5-mile project<br />
will extend from the Orange Show Road interchange in San<br />
Bernardino through the cities of Colton, Grand Terrace and<br />
Riverside. The project will include the possible addition of a<br />
carpool lane and mixed flow lane, both northbound and<br />
southbound. This work began in December 2003 and is<br />
expected to take 5-7 years. The widening of I-215 will<br />
improve the reliability of <strong>Omnitrans</strong> Route 90 and reduce<br />
travel times.<br />
85
Several grade separations (the division of railroad tracks from<br />
surface streets) throughout San Bernardino County were<br />
scheduled to receive funding from the state’s Traffic<br />
Congestion Relief Program. These projects were in detailed<br />
design when the state recommended suspending the<br />
funding for the Traffic Congestion Relief Program in<br />
December 2002, due to California’s budget crisis. Since that<br />
time, work has stopped on the grade separation projects,<br />
due to the funding uncertainty. Had full funding been made<br />
available from the Traffic Congestion Relief Program (or if<br />
funding is restored in the future), the projects would have<br />
helped reduce traffic from delays at train crossings.<br />
SANBAG has been supporting two additional interchange<br />
projects at I-10 and Live Oak Canyon (Yucaipa) and I-10 and<br />
Tippecanoe (Loma Linda, San Bernardino). Work on the Live<br />
Oak Canyon Road project has stopped, due to funding<br />
uncertainties from the state’s Traffic Congestion Relief<br />
Program (see above). Instead, traffic signals will be installed<br />
at this intersection to improve traffic flow through the area.<br />
The signals are in design and are expected to be installed by<br />
early 2005. Work is continuing on the Tippecanoe Avenue<br />
interchange. This project is in preliminary engineering<br />
stages, and SANBAG is continuing to collect funding for the<br />
construction of the interchange. Funding may be provided if<br />
San Bernardino County voters continue Measure I, the halfcent<br />
per dollar transportation sales tax, beyond its 2010<br />
expiration date.<br />
Southern California Association of Governments (SCAG)<br />
<strong>Omnitrans</strong>’ service area falls within the boundaries of the<br />
Southern California Association of Governments (SCAG), the<br />
Metropolitan <strong>Plan</strong>ning Organization (MPO) for six counties<br />
within Southern California. The purpose of the MPO is to<br />
cooperate with federal, state, and local transportation<br />
providers for carrying out the metropolitan transportation<br />
planning requirements as mandated through federal<br />
highway and transit legislation. Federal and State dollars<br />
used for transportation projects are funneled through the<br />
MPO and distributed to local, regional, and transit agencies<br />
to improve mobility within its jurisdictions. Deciding how<br />
that money gets spent is initiated through the development<br />
of a Regional Transportation <strong>Plan</strong> (RTP).<br />
Section III: Current<br />
Performance & Conditions<br />
86
On April 1, 2004, SCAG adopted the 2004 Regional<br />
Transportation <strong>Plan</strong> (RTP) titled Destination 2030. One of<br />
the primary goals of the plan is to “focus on improving the<br />
balance between land use and the current as well as future<br />
transportation systems.” Contained in the plan are several<br />
projects that will improve mobility, accessibility, and air<br />
quality for all residents of the region. It is important for<br />
<strong>Omnitrans</strong> to recognize these projects as it presents an<br />
opportunity for enhancing transit services for the residents of<br />
our community and improving mobility throughout the<br />
region.<br />
The highway and arterial improvements acknowledged in<br />
the RTP not only improves automobile mobility, but can<br />
provide opportunities for transit vehicles to efficiently and<br />
safely access the regional network with minimal conflict with<br />
the automobile.<br />
The following is a list of High Occupancy Vehicle (HOV) lane<br />
construction identified in the RTP.<br />
Figure III-41: HOV Lane Closures<br />
FREEWAY (Segment)<br />
<strong>Plan</strong>ned<br />
Completion<br />
County<br />
I-215 (SR-60/I-215/SR-91 to<br />
Riverside<br />
2015<br />
San Bernardino Co)<br />
I-10 (I-15 to Yucaipa) 2020 San Bernardino<br />
I-10 (Yucaipa to Riverside Co) 2025 San Bernardino<br />
I-15 (Riverside Co to I-215) 2025 San Bernardino<br />
I-15 (I-215 to D St) 2020 San Bernardino<br />
I-215 (Riverside Co to I-10) 2015 San Bernardino<br />
I-215 (SR-30 to I-15) 2025 San Bernardino<br />
Source: SCAG RTP 2004<br />
HOV connectors are an important element of the regional<br />
HOV system because they minimize weaving conflicts on the<br />
freeway and assist in maintaining speeds. The following<br />
projects have been identified in the 2004 RTP as HOV<br />
connector projects in our service area.<br />
87
Figure III-42: HOV Connector Projects<br />
FREEWAY (Segment)<br />
<strong>Plan</strong>ned<br />
Completion<br />
County<br />
I-10 / I-215 2025 San Bernardino<br />
I-10 / I-15 2025 San Bernardino<br />
Source: SCAG RTP 2004<br />
Gaps in the freeway network create traffic bottlenecks<br />
during peak use. Several new mixed-flow freeway lanes are<br />
proposed to close gaps, increase capacity in certain<br />
congested commuter corridors and address county-tocounty<br />
travel (especially from population-rich to<br />
employment-rich areas). Several routes are under<br />
consideration in the Four Corners area where Los Angeles,<br />
Orange, Riverside and San Bernardino Counties converge.<br />
The following projects have been identified in the 2004 RTP<br />
as mixed flow projects that are significant in our service area.<br />
Figure III-43: Mixed Flow Freeway Projects<br />
FREEWAY (Segment)<br />
<strong>Plan</strong>ned<br />
Completion<br />
County<br />
SR-71 (San Bernardino Co to<br />
Riverside<br />
2030<br />
SR-91)<br />
I-10 (Yucaipa to Ford<br />
San Bernardino<br />
2015<br />
westbound)<br />
I-215 (Riverside Co to SR-30) 2015 San Bernardino<br />
I-215 (SR-30 to I-15) 2025 San Bernardino<br />
SR-210 (I-215 to I-10) 2020 San Bernardino<br />
Source: SCAG RTP 2004<br />
SCAG also initiates, coordinates, or participates in<br />
transportation studies that examines and identifies<br />
opportunities to improve mobility in key areas. There are<br />
two studies within the current <strong>Omnitrans</strong> service area which<br />
will improve transit options for people that live in the service<br />
area.<br />
CHINO-ONTARIO COMMUNITY BASED TRANSPORTATION STUDY<br />
Located south of Ontario and east of Chino, an area named<br />
the Agricultural Preserve has been annexed by both the<br />
Cities of Chino and Ontario. More than 13,000 acres have<br />
been annexed into the cities for the opportunity to develop<br />
Section III: Current<br />
Performance & Conditions<br />
88
esidential and commercial areas over a 30-year period.<br />
Recognizing the need for transit services, the City of Chino<br />
listed public transportation as a “mitigation measure”<br />
towards the development of the area. This decision became<br />
the catalyst for this study.<br />
In 2004, Chino, Ontario, <strong>Omnitrans</strong>, and SCAG initiated this<br />
study to look at how transit services will be implemented<br />
during the development of the Agricultural Preserve area.<br />
The outcome of the study will show how transit will serve<br />
the newly developing area as well as how it will connect to<br />
the regional transit service. The plan completion date is<br />
anticipated in 2005 with Chino City Council and <strong>Omnitrans</strong><br />
Board of Directors adopting the plan and Ontario City<br />
Council supporting the plan.<br />
ONTARIO AIRPORT-VICINITY GROUND ACCESS PLAN (GAP)<br />
In 2003, SCAG initiated this plan in order to accommodate<br />
future growth in local and regional transportation demand<br />
due to the expansion of the Ontario Airport. The purpose of<br />
this study is to identify the most effective ground access<br />
improvements and the most appropriate institutional<br />
arrangements that are capable of achieving these objectives<br />
with the most efficient use of public funds. As the need for<br />
public transportation grows within this area, it will be<br />
important to implement transit service that will be beneficial<br />
to the Airport, all stakeholders, and <strong>Omnitrans</strong>.<br />
IMPROVING LAND USE AND TRANSPORTATION<br />
Through the RTP, SCAG has identified that there is a need to<br />
better coordinate transit and land use. Land use decisions<br />
are determined through the different local jurisdictions<br />
within <strong>Omnitrans</strong>’ service area. In the beginning of 2004,<br />
<strong>Omnitrans</strong> staff initiated an extensive outreach effort to talk<br />
with City Staff to assist in identifying areas of new<br />
development. This proved to be beneficial as it gave<br />
<strong>Omnitrans</strong> a better understanding of where development<br />
will occur in local areas as well as assist in developing transit<br />
services for these new areas.<br />
Since <strong>Omnitrans</strong> does not have any authority in land use<br />
decisions, it is important to communicate with our member<br />
cities on how land use decisions affect transit services.<br />
89
Regional Profile<br />
The <strong>Omnitrans</strong> service area and the greater Inland Empire<br />
have experienced dramatic change for the past decade. In<br />
coming years, new job creation, population growth, and<br />
continued economic diversification will further impact the<br />
region.<br />
This section’s focus is threefold:<br />
The first part presents a brief overview of the <strong>Omnitrans</strong><br />
service area and discusses current and projected population<br />
and employment densities throughout the San Bernardino<br />
Valley.<br />
The second part of this section reviews employment growth<br />
projections for San Bernardino County.<br />
The third part of this section reviews employment and<br />
population growth by city or sub-region. It identifies cities<br />
and sub-regions with the propensity for attracting transit<br />
riders based on specific job sectors, employee income, and<br />
community characteristics.<br />
Area Boundaries<br />
San Bernardino County can be divided into three distinct<br />
regions. The High desert represents the majority of the<br />
County area. The Mountain region encompasses the San<br />
Bernardino National Forest and portions of the San Gabriel<br />
National Forest to the south of the desert regions. The San<br />
Bernardino Valley encompasses the valley south of the<br />
Mountain region bordered by the Los Angeles County Line<br />
to the west and the Riverside County Line to the south.<br />
Orange County also borders San Bernardino County at the<br />
southwestern most end of the County at Chino Hills State<br />
Park.<br />
Demographics of the Study Area<br />
Two of the most critical factors determining transit demand<br />
are population and employment density. Density more than<br />
anything determines the number of people and/or activities<br />
that are likely to be accessible by transit.<br />
Section III: Current<br />
Performance & Conditions<br />
90
Figures III-44 through III-49 show the current (2000) and<br />
projected (2010 and 2015) population and employment<br />
densities in the <strong>Omnitrans</strong> service area. This data is available<br />
through the Southern California Association of Governments<br />
(SCAG). The update of SCAG’s Regional Transportation <strong>Plan</strong><br />
titled Destination 2030 gave SCAG staff the opportunity to<br />
project future population and employment figures for each<br />
City in the region. For the purpose of this study, projections<br />
on population and employment were obtained in 5-year<br />
increments beginning in 2000 and ending in 2015. Maps<br />
were then produced for the <strong>Omnitrans</strong> service area, using<br />
SCAG’s projections, to identify population densities and<br />
employment densities within the area.<br />
Population density is defined as the number of residents per<br />
square mile. Likewise, job density is defined as the number<br />
of jobs per acre. The maps are essentially an aggregate of<br />
the total population and job densities in a color-coded index<br />
format. The legend shows the index of combined job and<br />
population densities. White indicates Census tracts that have<br />
few residents per acre and/or jobs per acre. Dark red<br />
indicate a high concentration of both residents and jobs per<br />
acre in the Census tract. Gray indicates a higher<br />
concentration of residents per acre while red indicates more<br />
jobs per acre.<br />
91
Figure III-42: 2000 population<br />
Figure III-44
Figure III-45
Figure III-46
Figure III-47
Figure III-48
Figure III-49
Dark red areas on the map are especially important because<br />
they highlight areas that have a mix of both jobs and<br />
housing. These areas have the highest concentrations of<br />
both population and employment and generally represent<br />
areas with the greatest transit demand. An area with a good<br />
mix of both housing and jobs can generate and attract work<br />
trips. This in turn, means the potential of filling buses in both<br />
directions is greater than an area that is less mixed. Filling<br />
buses in both directions is not only more efficient for the<br />
transit agency, but less costly than operating buses empty in<br />
one direction. This phenomenon in inefficiencies is typical of<br />
communities that are rich in either housing or jobs, but not<br />
both.<br />
As shown in Figures III-44 and III-45, there are only a few<br />
areas with a high mix of both population and jobs. These<br />
areas include:<br />
Fontana, west of Sierra Avenue and north of Valley<br />
Boulevard;<br />
San Bernardino, south of Highland Avenue and west<br />
of Mount Vernon Avenue;<br />
Downtown San Bernardino; and<br />
Loma Linda University.<br />
In 2010, areas with the largest concentrations in both<br />
population and jobs (defined as areas with more than 8<br />
residents per acre and more than 15 jobs per acre) will be<br />
located in the following areas (Figures III-46 and III-47):<br />
The City of Chino between SR-60 and Riverside Drive;<br />
South Montclair between Mission Boulevard and the I-<br />
10;<br />
Upland along Arrow Highway;<br />
Downtown Fontana;<br />
Downtown Rialto;<br />
Colton along Mount Vernon Avenue just south of San<br />
Bernardino Valley College; and<br />
Downtown San Bernardino.<br />
By 2015, areas identified in 2010 as having significant<br />
densities will gain additional jobs (15-30 jobs per acre) but<br />
lose residents (8-12 residents per acre). The migration of<br />
residents in these areas can be attributed to factors such as<br />
Section III: Current<br />
Performance & Conditions<br />
98
more housing opportunities elsewhere in the region. One<br />
area that will have more jobs than housing is the City of<br />
Chino between Monte Vista Avenue and Mountain Avenue,<br />
south of SR-60. SCAG predicts that the jobs will increase in<br />
this part of the City from 2010 to 2015.<br />
Inland Empire Job<br />
and Worker Growth<br />
This section focuses on employment growth within the San<br />
Bernardino County. Data used for this section has been<br />
extrapolated from the State of California’s Employment<br />
Development Department, Labor Market Information (LMI)<br />
Division.<br />
The Inland Empire has undergone a transformation from an<br />
area that was once noted for having huge quantities of land,<br />
a small population, and a narrow job base into a major force<br />
in the Southland’s economy with both population and job<br />
levels continuing to grow.<br />
Data obtained from LMI shows that there has been<br />
incremental growth in the labor force between 1999 and<br />
June 2004. Overall, there has been a 20.7% increase in the<br />
labor force. Individuals in the labor force that were<br />
employed increased by 19.4% between the years of 1999<br />
and 2004. Unemployment figures also increased with the<br />
growing labor force by 46.1% from 1999 to 2004.<br />
Unemployment figures have not recovered from a high<br />
unemployment rate recorded in 2002.<br />
LMI also provides projections of job sector growth beginning<br />
in 2001 up to 2008. These projections are based on trends<br />
created by the U.S. Department of Labor Statistics and<br />
historic trends within San Bernardino County. It is important<br />
to note that these are just trends and that change in job<br />
sectors, natural disasters, and development can have a<br />
drastic effect on employment opportunities.<br />
99
According to the California State Employment Development<br />
Department, nonfarm employment will grow to a total of<br />
123,400 jobs in San Bernardino County, a 22.2 % increase<br />
from 2001 to 2008. The services sector will be the largest<br />
contributor of jobs which will add 38,500 jobs. Jobs in the<br />
trade sector will add 26,100 jobs. Government jobs will<br />
increase by 20,600. Manufacturing employment will grow<br />
by 14,900 jobs. Construction will continue to grow by<br />
adding 13,100 jobs into the County. Transportation and<br />
public utilities will increase by 6,700 jobs. Finance,<br />
insurance, and real estate employment will grow by 3,600<br />
additional new jobs. Finally, mining will remain unchanged<br />
at 700 jobs. Increases in different job sectors are determined<br />
by development patterns, sufficient infrastructure to support<br />
job sectors, and demand for services.<br />
Simultaneously, the Southern California Association of<br />
Governments (SCAG) creates employment estimates for the<br />
number of jobs within its six-county planning area in five<br />
year increments. According to SCAG, the number of jobs<br />
within the 15 incorporated cities in the San Bernardino<br />
Valley will increase by 26.6% from 2000 to 2010, or more<br />
than 68,300 additional jobs.<br />
Inland Empire’s Competitive Advantages Lead to Growth<br />
in Blue Collar and Service Sector Jobs<br />
Southern California is rapidly reaching the point where the<br />
limited supply of undeveloped land in Southern California is<br />
becoming increasingly expensive compared to land located<br />
east of Los Angeles. Industrial and manufacturing sectors<br />
need to be able to compete in the global market which<br />
requires key factors to be set in place in order to succeed.<br />
These land uses require large tracts of land, access to major<br />
arterials and freeways, access to railroad facilities, the ability<br />
to build and utilize state-of-the-art technological<br />
infrastructure, and a strong blue-collar labor force in order to<br />
meet the demands of production and the shipment of goods<br />
at an international level. San Bernardino County has<br />
encouraged the development of industrial and<br />
manufacturing land uses that have become the driving force<br />
behind the economic strength of the Inland Empire. The<br />
lower cost of undeveloped land, a blue-collar labor force,<br />
transportation advantages (access to freeways, railroads, and<br />
the Ontario International Airport), and state-of-the-art<br />
Section III: Current<br />
Performance & Conditions<br />
100
uildings and warehouses all contribute to the success of<br />
these industries in the region.<br />
Growth in Blue Collar and Non-professional Jobs<br />
Growth in blue collar and non-professional jobs can be<br />
attributed to land-use patterns that create a demand for<br />
certain job industries. Because of the increasing residential<br />
population, there is a growing demand for retail,<br />
educational, and municipal services. Moreover, the<br />
development of the logistics, construction, and<br />
manufacturing businesses in San Bernardino County has<br />
necessitated the need for employment to ensure that these<br />
industries remain competitive.<br />
Given the economic growth patterns within different areas<br />
of California, the State of California’s Employment<br />
Development Department, Labor Market Information<br />
Division (LMI) provides projections of growing industries<br />
throughout the state. According to County Snapshots,<br />
published through the LMI, the only blue-collar, nonprofessional<br />
occupation that will have the most growth is<br />
retail trade (Figure III-50).<br />
Figure III-50: Largest Projected Growth Industries<br />
Blue Collar & Non-Professional Occupations<br />
1999-<strong>2006</strong><br />
Industry<br />
Retail Trade (Salespersons, Cashiers,<br />
Food Preparation and Serving<br />
workers, and Waiters and<br />
Waitresses).<br />
Source: County Snapshots, 2003<br />
Percent<br />
Growth<br />
Job Growth<br />
19.9% 19,900<br />
Not considered as one of the largest projected growing<br />
industries are Transportation and Material Moving<br />
Occupations (Logistics and Goods Movement), Construction,<br />
and Production (Manufacturing). This could be due to the<br />
fact that the cumulative growth in retail trade occupations<br />
will surpass other blue-collar industries in the following years.<br />
However, projections of blue-collar employment will provide<br />
a significant number of jobs in the County. Figure III-51<br />
presents the fastest growing occupations related to bluecollar<br />
industries.<br />
101
Figure III-51: Largest Projected Growth Occupations<br />
Occupations Related to Blue-Collar Jobs 2001-2008<br />
Industry Occupation Percent<br />
Growth<br />
Additional<br />
Jobs<br />
Transportation and Truck Drivers (Heavy) 25.9 2,660<br />
Material Moving Laborers & Freight, Stock, 20.7 2,420<br />
(Logistics)<br />
and Material Movers<br />
Packers and Packagers 25.0 1,730<br />
Truck Drivers (Light or<br />
23.5 1,320<br />
Delivery services)<br />
Industrial Truck & Tractor<br />
Operators<br />
21.8 960<br />
Driver/Sales Workers 13.8 600<br />
Construction Carpenters 35.7 2,590<br />
Construction Laborers 35.6 1,490<br />
Electricians 42.2 950<br />
First-Line Supervisors/<br />
Managers<br />
33.9 630<br />
Sheet Metal Workers 40.0 580<br />
Production<br />
Team Assemblers 21.3 1,780<br />
(Manufacturing) Welders, Cutters,<br />
32.9 680<br />
Soderers, and Brazers<br />
Helpers—Production<br />
Workers<br />
23.4 660<br />
First-Line Supervisors/<br />
18.0 610<br />
Managers<br />
Source: Labor Market Information Division<br />
Growth in High Paying Professional Service Jobs<br />
Over the next several years, the aggressive growth of the<br />
Inland Empire’s population-related jobs and blue-collar jobs<br />
are a given. The only issue is that of speed. More difficult to<br />
anticipate is the growth in service sectors involving<br />
technology and professional and regional corporate offices.<br />
Here, the Inland Empire’s performance has been modest as<br />
its natural advantages of lower land and blue-collar labor<br />
costs have not been very important to these firms. However,<br />
the rise in population will require additional municipal<br />
services to ensure the health, safety, and welfare of the<br />
residents that live in the area.<br />
Section III: Current<br />
Performance & Conditions<br />
102
Again, LMI provides projections of growing industries<br />
throughout the state. According to County Snapshots,<br />
published through the LMI, the two industries that will grow<br />
the most under the professional service category in San<br />
Bernardino County include services and government (Figure<br />
III-52).<br />
Figure III-52: Largest Projected Growth Industries<br />
Professional Service Sector 1999-<strong>2006</strong><br />
Largest Projected Growth Industries 1999-<strong>2006</strong><br />
Industry Percent Growth Job Growth<br />
Services (includes<br />
elementary and middle 30.2% 39,700<br />
school teachers, teacher<br />
assistants, and<br />
registered nurses)<br />
Government (Police and<br />
Sheriff Patrol Officers, 24.2% 25,400<br />
Correctional Officers,<br />
Mail Carriers, and Fire<br />
Fighters)<br />
Source: County Snapshots<br />
Two occupations with the greatest job growth between<br />
2001 and 2008, which fall under this section, are General<br />
and Operations Managers and Computer Support Specialists.<br />
According to LMI’s projections into 2008, General and<br />
Operations Managers will add an additional 1,560 jobs, a<br />
21.6% increase during the period of 2001 to 2008.<br />
Computer Support Specialists will add an additional 730 jobs<br />
in the County, or a 71.6% increase between 2001 and 2008.<br />
Both occupations are important to the growing industries in<br />
San Bernardino County. Since many logistic and<br />
manufacturing firms are beginning to depend on computer<br />
information systems to track goods and supplies, computer<br />
technicians can provide technical support to trouble-shoot<br />
system problems. More employees that work for industrial<br />
sectors also require more managers to oversee operations<br />
and ensure that the businesses remain competitive in the<br />
regional market.<br />
103
Community-Specific Effects of Economic Change on<br />
Population, Employment Growth, and <strong>Transit</strong> Use.<br />
The communities in San Bernardino have experienced<br />
different growth patterns over the last decade. Communities<br />
in the western portion of the County have grown faster than<br />
eastern communities. The City of San Bernardino, the<br />
traditional economic center, has maintained its primacy, but<br />
other communities, such as Ontario have grown significantly<br />
over the past years. The following section provides<br />
information on the two most populous Cities in the San<br />
Bernardino County, the Cities on San Bernardino and<br />
Ontario. For each City, population and employment growth<br />
trends will be examined.<br />
City of San Bernardino<br />
Even with faster growth rates in other cities and some<br />
local economic downturns, population and employment<br />
growth within San Bernardino are expected to continue at a<br />
steady pace. As Figure III-53 illustrates, the population is<br />
projected to grow by more than 12% over a fifteen-year<br />
period beginning in 2000 (185,772) to 2015 (208,000). San<br />
Bernardino’s dominance in terms of residential and<br />
employment population will not change significantly over<br />
the period, but Ontario’s population—growing at a much<br />
faster rate—will surpass that of San Bernardino.<br />
Section III: Current<br />
Performance & Conditions<br />
104
Figure III-53: City of San Bernardino Population<br />
250000<br />
City of San Bernardino Current and Projected Trends<br />
Pop/House/Employment<br />
200000<br />
150000<br />
100000<br />
185772<br />
81115<br />
199035<br />
88791<br />
207021 208860<br />
99337<br />
110056<br />
50000<br />
0<br />
2000<br />
2005<br />
Year<br />
2010<br />
2015<br />
Population<br />
Employment<br />
Employment Growth in San Bernardino<br />
By 2015, the number of jobs in San Bernardino will grow to<br />
more than 110,000 jobs, an increase of almost 36%. Growth<br />
in different industries is not identified as part of the<br />
projections provided through SCAG. However, it is difficult<br />
to determine which industries will grow faster than others.<br />
Changes in the economy, shifts in the land use patterns, and<br />
technological advances can all play a role in which industries<br />
will grow in the following years. Nonetheless, SCAG predicts<br />
that areas east of the I-215 will have the highest<br />
concentration of population and jobs within the City.<br />
City of Ontario<br />
Ontario is expected to surpass San Bernardino as the most<br />
populous City in the County. As Figure III-54 illustrates,<br />
Ontario will have a population of more than 212,000 people,<br />
an increase of 34%. Population growth will soar between<br />
the period of 2010 and 2015 with the City reaching 200,000<br />
105
esidents. The reason for this growth is possibly due to the<br />
amount of available land for development and the City’s<br />
aggressive development efforts.<br />
250000<br />
City of Ontario Current and Projected Trends<br />
Pop/House/Employment<br />
200000<br />
150000<br />
100000<br />
50000<br />
158331<br />
76927<br />
171154<br />
85536<br />
180059<br />
97366<br />
212734<br />
109637<br />
0<br />
2000<br />
2005<br />
Year<br />
2010<br />
2015<br />
Population<br />
Employment<br />
Figure III-54<br />
Employment Growth in Ontario<br />
By 2015, the number of jobs in Ontario will grow to more<br />
than 109,000, 29% increase over a 15 year period. Growth<br />
in different industries is not identified as part of the<br />
projections provided through SCAG. Unlike San Bernardino,<br />
some areas of Ontario remain undeveloped and have the<br />
potential to be developed into commercial or industrial landuses.<br />
This presents a unique opportunity for the City to<br />
pursue development that will yield the most benefits. Both<br />
commercial and industrial opportunities along the eastern<br />
end of the City are possible while residential development in<br />
the New Model Colony is currently planned. Should the City<br />
decide to alter any of these land-uses, jobs within industries<br />
will fluctuate but would continue to provide employment<br />
opportunities.<br />
Section III: Current<br />
Performance & Conditions<br />
106
Regional Conditions Report<br />
The San Bernardino Valley represents a diverse mix of<br />
people, needs, and opportunities in an area that continues to<br />
grow. Located just east of Los Angeles County, the Valley<br />
has experienced a building boom and has become a hub of<br />
activity with a growing labor force and housing market.<br />
Each City in the Valley contributes significantly to the growth<br />
of Southern California as more people begin to migrate into<br />
the area to live, work, and play.<br />
<strong>Omnitrans</strong> provides public transportation services in this<br />
growing area. Several fixed bus routes, ADA-mandated<br />
demand-response, and three community shuttle programs<br />
are designed to provide public transit services to major<br />
destinations within the Valley and connect to the regional<br />
transit network. Three <strong>Omnitrans</strong> routes extend into Los<br />
Angeles or Riverside Counties. Each City has something in<br />
common: the need for adequate public transportation<br />
service to meet the residents’ needs. The following chapter<br />
is used to identify commonalities within each community<br />
and to foster dialogue that will help in identifying<br />
transportation service needs.<br />
This section gives an overview of the <strong>Omnitrans</strong> service area,<br />
outlining broad city-by-city comparisons of demographic<br />
information and journey to work statistics using data derived<br />
from the U.S. Census 2000. Appendix G (under separate<br />
cover) provides a more detailed discussion of each individual<br />
city, its areas of development, and a list of <strong>Transit</strong> Goals that<br />
can be applied to ensure that transit needs of each City are<br />
identified.<br />
It should be noted that there are four unincorporated areas<br />
that have been measured by the U.S. Census. Statistics for<br />
these areas have been included in the service area totals.<br />
The four unincorporated areas include Bloomington (located<br />
south of Rialto), Mentone (located northeast of Redlands),<br />
Muscoy (located north and west of San Bernardino), and San<br />
Antonio Heights (located north of Upland).<br />
Journey to Work<br />
The Journey to Work is defined as the conditions as how<br />
residents within a particular City/area travel to work, how<br />
long it takes, the mode used to get to work. The information<br />
is derived from U.S. Census 2000, Summary File 3 (SF-3),<br />
107
which surveys one-in-six households. Responses are<br />
weighted to reflect the entire population. Therefore, each<br />
responding household represents six or seven other<br />
households.<br />
The following tables and charts were created using data<br />
from SF-3 data. The purpose of the table is to compare<br />
commute patterns and social-economic data in each of the<br />
member cities. Such comparisons are helpful in identifying<br />
areas where transit use is best utilized and in identifying<br />
missing links that can be improved that can enhance transit<br />
service.<br />
Place of Work<br />
Investigating the number of employees that work inside the<br />
County provides an indication of how many work-trips are<br />
local in nature. This is shown in Figure III-55. Of the 15 cities<br />
in the <strong>Omnitrans</strong> service area, just over 64% of workers that<br />
live in the San Bernardino Valley work in the same County.<br />
The Cities of Highland, Redlands, Loma Linda, and San<br />
Bernardino have the highest number of employees that live<br />
and work in San Bernardino County (80% and above) while<br />
the Cities of Chino Hills, Montclair, and Chino have more<br />
residents working outside of the County (50% or more).<br />
Reasons for working outside the County can stem from the<br />
residents’ proximity to County borders or to employment<br />
opportunities inside and outside the service area.<br />
Figure III-55<br />
Comparison of Workers that Work and Live in County<br />
Percent<br />
90.0<br />
80.0<br />
70.0<br />
60.0<br />
50.0<br />
40.0<br />
30.0<br />
20.0<br />
10.0<br />
0.0<br />
San Bernardino Valley (Total)<br />
Highland<br />
Muscoy<br />
Redlands<br />
Loma Linda<br />
Mentone<br />
San Bernardino<br />
Yucaipa<br />
Colton<br />
Rialto<br />
Bloomington<br />
Grand Terrace<br />
Work in County<br />
Census Area<br />
Rancho Cucamonga<br />
Fontana<br />
San Antonio Heights<br />
Ontario<br />
Upland<br />
Chino<br />
Montclair<br />
Chino Hills<br />
Work Outside County<br />
Section III: Current<br />
Performance & Conditions<br />
108
Travel Time to Work<br />
Figure III-56 shows the travel time to work for people that<br />
live in the service area. While these figures are likely to have<br />
changed since the U.S. 2000 Census, the relative rankings<br />
are still interesting. Residents of Loma Linda enjoy the<br />
shortest commute times with more than 78% of the workers<br />
surveyed commuting less than 30-minutes to work followed<br />
by Redlands, and Grand Terrace. Residents of Chino Hills<br />
commute the longest to work with more than 63% traveling<br />
30-minutes or longer to work.<br />
Figure III-56<br />
Travel Time to Work<br />
100%<br />
80%<br />
Percentage<br />
60%<br />
40%<br />
20%<br />
0%<br />
Bloomington<br />
Chino<br />
Chino Hills<br />
Colton<br />
Fontana<br />
Grand Terrace<br />
Highland<br />
Loma Linda<br />
Mentone<br />
Montclair<br />
Muscoy<br />
Ontario<br />
Census Area<br />
Rancho Cucamonga<br />
Redlands<br />
Rialto<br />
San Antonio Heights<br />
San Bernardino<br />
Upland<br />
Yucaipa<br />
San Bernardino Valley (Total)<br />
Less than 10 Minutes 10-29 Minutes 30-59 Minutes 60+ Minutes<br />
109
Leave for Work<br />
Figures III-57 through III-60 show the times that residents<br />
leave for work. The U.S. Census time period begins at 12:00<br />
a.m. to 4:59 a.m. and extends every half hour after 5:00 a.m.<br />
After 9:00 a.m., time sets are combined. The percentage of<br />
work-trips tends to be higher when hours are clustered<br />
together.<br />
For areas in the West Valley (Chino, Chino Hills, Montclair,<br />
San Antonio Heights, and Upland) a majority of the trips<br />
originate before 8:00 a.m. and begin to drop after 8:00 a.m.<br />
(Figure III-58).<br />
Figure III-57<br />
Leave for Work, West Valley<br />
Percentage<br />
20.0<br />
18.0<br />
16.0<br />
14.0<br />
12.0<br />
10.0<br />
8.0<br />
6.0<br />
4.0<br />
2.0<br />
0.0<br />
12:00<br />
a.m. to<br />
4:59<br />
a.m.<br />
5:00<br />
a.m. to<br />
5:29<br />
a.m.<br />
5:30<br />
a.m. to<br />
5:59<br />
a.m.<br />
6:00<br />
a.m. to<br />
6:29<br />
a.m.<br />
6:30<br />
a.m. to<br />
6:59<br />
a.m.<br />
7:00<br />
a.m. to<br />
7:29<br />
a.m.<br />
7:30<br />
a.m. to<br />
7:59<br />
a.m.<br />
8:00<br />
a.m. to<br />
8:29<br />
a.m.<br />
Time of Day<br />
8:30<br />
a.m. to<br />
8:59<br />
a.m.<br />
9:00<br />
a.m. to<br />
9:59<br />
a.m.<br />
10:00<br />
a.m. to<br />
10:59<br />
a.m.<br />
11:00<br />
a.m. to<br />
11:59<br />
a.m.<br />
12:00<br />
p.m. to<br />
3:59<br />
p.m.<br />
4:00<br />
p.m. to<br />
11:59<br />
p.m.<br />
Chino Chino Hills Montclair San Antinio Heights Upland<br />
Section III: Current<br />
Performance & Conditions<br />
110
For Mid-Valley West (cities of Fontana, Ontario, and Rancho<br />
Cucamonga), most trips are generated from 7:00 a.m. to 7:29<br />
a.m. (Figure III-58). Compared to West Valley, a significant<br />
amount of trips during the day begin in the afternoon and<br />
evening hours. This suggests that there may be a number of<br />
residents that work night and/or graveyard shifts.<br />
Figure III-58<br />
Leave for Work, Mid-Valley West<br />
Percentage<br />
16.0<br />
14.0<br />
12.0<br />
10.0<br />
8.0<br />
6.0<br />
4.0<br />
2.0<br />
0.0<br />
12:00<br />
a.m. to<br />
4:59<br />
a.m.<br />
5:00<br />
a.m. to<br />
5:29<br />
a.m.<br />
5:30<br />
a.m. to<br />
5:59<br />
a.m.<br />
6:00<br />
a.m. to<br />
6:29<br />
a.m.<br />
6:30<br />
a.m. to<br />
6:59<br />
a.m.<br />
7:00<br />
a.m. to<br />
7:29<br />
a.m.<br />
7:30<br />
a.m. to<br />
7:59<br />
a.m.<br />
8:00<br />
a.m. to<br />
8:29<br />
a.m.<br />
Time of Day<br />
8:30<br />
a.m. to<br />
8:59<br />
a.m.<br />
9:00<br />
a.m. to<br />
9:59<br />
a.m.<br />
10:00<br />
a.m. to<br />
10:59<br />
a.m.<br />
11:00<br />
a.m. to<br />
11:59<br />
a.m.<br />
12:00<br />
p.m. to<br />
3:59<br />
p.m.<br />
4:00<br />
p.m. to<br />
11:59<br />
p.m.<br />
Fontana Ontario Rancho Cucamonga<br />
111
Commute patterns for the Mid-Valley East Cities of Colton,<br />
Rialto, San Bernardino, and the unincorporated area of<br />
Bloomington are similar throughout the day. Commute trips<br />
originating from the unincorporated area of Muscoy is high<br />
from 6:00 a.m. to 6:29 a.m. Commute trips originating from<br />
Grand Terrace is high from 7:00 a.m. to 7:29 a.m. The<br />
availability of a private vehicle in each of these areas<br />
suggests that since residents from Muscoy have limited<br />
access to a private vehicle and must depend on other modes<br />
of travel, Muscoy residents need to leave earlier to get to a<br />
place of employment. On the other hand, Grand Terrace<br />
residents tend to have more private vehicles accessible,<br />
allowing for more independence when commuting to work;<br />
hence residents can begin their commute trip at a later time.<br />
Interestingly enough, Grand Terrace has one of the highest<br />
rates of drive-alone commutes while Muscoy has one of the<br />
highest public-transit use compared to other areas in the San<br />
Bernardino Valley.<br />
Figure III-59<br />
Leave for Work, Mid-Valley East<br />
Percentage<br />
20.0<br />
18.0<br />
16.0<br />
14.0<br />
12.0<br />
10.0<br />
8.0<br />
6.0<br />
4.0<br />
2.0<br />
0.0<br />
12:00<br />
a.m. to<br />
4:59<br />
a.m.<br />
5:00<br />
a.m. to<br />
5:29<br />
a.m.<br />
5:30<br />
a.m. to<br />
5:59<br />
a.m.<br />
6:00<br />
a.m. to<br />
6:29<br />
a.m.<br />
6:30<br />
a.m. to<br />
6:59<br />
a.m.<br />
7:00<br />
a.m. to<br />
7:29<br />
a.m.<br />
7:30<br />
a.m. to<br />
7:59<br />
a.m.<br />
8:00<br />
a.m. to<br />
8:29<br />
a.m.<br />
Time of Day<br />
8:30<br />
a.m. to<br />
8:59<br />
a.m.<br />
9:00<br />
a.m. to<br />
9:59<br />
a.m.<br />
10:00<br />
a.m. to<br />
10:59<br />
a.m.<br />
11:00<br />
a.m. to<br />
11:59<br />
a.m.<br />
12:00<br />
p.m. to<br />
3:59<br />
p.m.<br />
4:00<br />
p.m. to<br />
11:59<br />
p.m.<br />
Bloomington Colton Grand Terrace Muscoy Rialto San Bernardino<br />
Section III: Current<br />
Performance & Conditions<br />
112
Commuters from cities in the East Valley tend to leave during<br />
the 7:00 a.m. hour. Commute origins for these Cities do not<br />
vary much compared to the other three areas (West Valley,<br />
Mid-Valley West, and Mid-Valley East). Commuters from<br />
these cities also have a higher tendency to work in the San<br />
Bernardino County.<br />
Figure III-60<br />
Leave for Work, East Valley<br />
Percentage<br />
20.0<br />
18.0<br />
16.0<br />
14.0<br />
12.0<br />
10.0<br />
8.0<br />
6.0<br />
4.0<br />
2.0<br />
0.0<br />
12:00<br />
a.m. to<br />
4:59<br />
a.m.<br />
5:00<br />
a.m. to<br />
5:29<br />
a.m.<br />
5:30<br />
a.m. to<br />
5:59<br />
a.m.<br />
6:00<br />
a.m. to<br />
6:29<br />
a.m.<br />
6:30<br />
a.m. to<br />
6:59<br />
a.m.<br />
7:00<br />
a.m. to<br />
7:29<br />
a.m.<br />
7:30<br />
a.m. to<br />
7:59<br />
a.m.<br />
8:00<br />
a.m. to<br />
8:29<br />
a.m.<br />
Time of Day<br />
8:30<br />
a.m. to<br />
8:59<br />
a.m.<br />
9:00<br />
a.m. to<br />
9:59<br />
a.m.<br />
10:00<br />
a.m. to<br />
10:59<br />
a.m.<br />
11:00<br />
a.m. to<br />
11:59<br />
a.m.<br />
12:00<br />
p.m. to<br />
3:59<br />
p.m.<br />
4:00<br />
p.m. to<br />
11:59<br />
p.m.<br />
Highland Loma Linda Mentone Redlands Yucaipa<br />
113
Mode of Travel<br />
The car is by far the dominant mode of travel to work in the<br />
<strong>Omnitrans</strong> service area accounting for 92% of work trips<br />
(both single-occupant and carpools). Within the San<br />
Bernardino Valley, 75% drove alone, 17.4% carpooled, 1.5%<br />
used bus transit, 0.7% used another form of public transit,<br />
3.1% used other means to get to work, and the remainder<br />
worked at home (Figure III-61). “Other” denotes motorcycle,<br />
bicycle, walk, or another method of transit.<br />
Figure III-61<br />
Work at Home<br />
Other means<br />
<strong>Transit</strong> (Other)<br />
<strong>Transit</strong> (Bus)<br />
Carpool<br />
Drive Alone<br />
San Bernardino Valley, Mode Travel to Work<br />
Figure III-62 shows the mode choice per City/unincorporated<br />
area in the service area. Bus use tends to be the higher<br />
mode of travel when comparing public transit services.<br />
However, other alternative modes of travel (walking, bicycle,<br />
motorcycle) are more highly utilized than public<br />
transportation. Loma Linda boasts the highest percentage of<br />
alternative mode use at 7.1% followed by Redlands at 5.4%.<br />
Carpooling tends to be a popular mode of transportation per<br />
work-trip (with the exception of drive-alone). Muscoy has a<br />
high percentage of carpoolers (25.0%) followed by<br />
Bloomington (23.3%) and Ontario (22.5%).<br />
Muscoy has the highest bus transit use (3.7%) followed by<br />
San Bernardino (3.4%), Montclair (2.9%), and Ontario (2.7%).<br />
Rancho Cucamonga (1.2%), Chino Hills (1.2%), and Fontana<br />
(1.1%) have higher percentages of workers using rail transit.<br />
Section III: Current<br />
Performance & Conditions<br />
114
Figure III-62: Mode of Travel Per Work-Trip (Percentage)<br />
Percent that<br />
drive alone<br />
Percent that<br />
Carpool<br />
Percent that Use<br />
Public<br />
Transportation<br />
Percent that<br />
Use Bus<br />
Percent that use other<br />
Public Transportation Percent Other<br />
Percent that<br />
work at<br />
Home<br />
San Bernardino<br />
Valley (Total) 74.5 17.4 2.2 1.5 0.7 3.1 2.7<br />
Bloomington 68.1 23.3 1.0 0.5 0.5 3.3 4.3<br />
Chino 74.9 16.8 1.4 0.9 0.5 4.0 2.8<br />
Chino Hills 80.1 13.4 2.0 0.8 1.2 1.2 3.3<br />
Colton 73.2 19.3 1.8 1.3 0.5 3.4 2.3<br />
Fontana 73.2 19.6 2.5 1.3 1.1 2.6 2.1<br />
Grand Terrace Mentone 77.9 15.1 1.3 0.8 0.5 4.0 1.7<br />
81.6 12.6 0.8 0.4 0.4 1.3 3.7<br />
Highland 74.2 18.5 1.9 1.4 0.4 2.5 3.0<br />
Loma Linda 74.4 13.5 1.7 1.2 0.5 7.1 3.3<br />
Montclair 71.0 19.7 2.9 2.3 0.7 4.5 1.9<br />
Muscoy 62.0 25.0 3.7 3.7 0.0 3.2 6.1<br />
Ontario 69.8 22.5 2.7 1.9 0.7 2.9 2.2<br />
Rancho<br />
Cucamonga 80.6 12.5 2.0 0.8 1.2 1.9 3.0<br />
Redlands 77.4 12.9 1.4 1.1 0.3 5.4 2.8<br />
Rialto 72.7 20.1 2.4 1.6 0.8 2.4 2.5<br />
San Antonio<br />
Heights 77.7 11.7 1.9 0.5 1.4 0.6 8.2<br />
San Bernardino 69.3 20.2 3.4 3.0 0.3 4.4 2.8<br />
Upland 77.2 13.6 2.5 1.5 1.0 3.5 3.1<br />
Yucaipa 78.1 15.6 0.7 0.5 0.2 2.5 3.1<br />
115
<strong>Transit</strong> Dependence<br />
<strong>Transit</strong> dependence is the measure of a household’s<br />
dependence on public transportation to access employment,<br />
shopping, and housing opportunities. Age, household<br />
income, and automobile ownership are all useful indicators<br />
of transit dependence.<br />
Age<br />
An analysis of age looks at three age groups, which have a<br />
higher propensity to use transit. These include seniors (age<br />
65 and older), college-aged residents (aged 18 to 24) and<br />
high school students (age 14 to 17).<br />
Seniors are a large and growing market for transit systems.<br />
Seniors have a high propensity to use transit due to factors<br />
such as income, and the ability to own and drive an<br />
automobile.<br />
Many college students have limited budgets and choose to<br />
use transit in order to reduce their cost of living. Limited or<br />
expensive parking at college campuses can also stimulate<br />
transit use. The 18-24 age group is used as a surrogate for<br />
the student population as this age group is where most<br />
college students are found.<br />
Similarly, the younger high school students represent a<br />
strong market for transit as they have increased mobility<br />
needs, but are too young or too poor to own and operate a<br />
private car.<br />
Figure III-63 shows the age distribution of transit-dependent<br />
populations per City.<br />
Section III: Current<br />
Performance & Conditions<br />
116
Figure III- 63: Distribution of Ages Per City<br />
(percentage)<br />
Age 15-17 Age 18-24 Age 25-29 Age 65+<br />
San<br />
Bernardino<br />
Valley (Total) 5.1 10.4 7.3 7.4<br />
Bloomington 5.5 10.5 6.8 7.5<br />
Chino 4.7 12.3 7.8 5.9<br />
Chino Hills 5.1 7.4 6.0 4.2<br />
Colton 4.9 11.9 8.8 6.4<br />
Fontana 5.3 10.3 7.7 4.7<br />
Grand Terrace<br />
4.2 9.0 7.2 10.7<br />
Highland 5.2 9.0 6.5 6.5<br />
Loma Linda 3.4 10.2 11.4 15.4<br />
Mentone 6.1 9.9 6.7 9.0<br />
Montclair 5.3 10.7 7.8 8.3<br />
Muscoy 6.8 12.2 6.4 5.8<br />
Ontario 5.0 11.2 8.5 5.9<br />
Rancho<br />
Cucamonga 5.2 9.9 6.9 6.1<br />
Redlands 4.7 10.7 6.5 12.6<br />
Rialto 6.0 10.4 6.7 6.4<br />
San Antonio<br />
Heights 4.6 7.3 3.9 14.6<br />
San<br />
Bernardino 5.1 11.0 7.3 8.2<br />
Upland 4.6 9.6 6.8 10.8<br />
Yucaipa 5.2 7.6 5.1 15.5<br />
According to the U.S. Census, the Cities of Rialto (6.0%),<br />
Fontana (5.3%), and Montclair (5.3%) have the highest<br />
percentage of high school students. Loma Linda has the<br />
smallest amount (3.4%). The Cities with the highest number<br />
of college students age 18 to 24 are in Chino (12.3%), Colton<br />
(11.9%), and Ontario (11.2%). The lowest is in Chino Hills<br />
(7.4%) and Yucaipa (7.6%). Loma Linda (11.4%), Colton<br />
(8.8%), and Ontario (8.5%) have the highest numbers of<br />
young adults age 25-29 when compared to the other cities.<br />
Yucaipa (5.1%) and Chino Hills (6.0%) have the least amount<br />
of young adults. Finally, more seniors can be found in the<br />
Cities of Yucaipa, Loma Linda, and Redlands while Chino Hills<br />
(4.2%) and Fontana (4.7%) have the least.<br />
117
Income<br />
Low-income persons were identified by the number of<br />
persons below the federal standard for poverty. Many of the<br />
people that fall under the poverty line do not have adequate<br />
personal transportation and thus rely on public transit for<br />
their everyday transportation. Consequently, it is important<br />
to understand where persons in poverty reside within the<br />
<strong>Omnitrans</strong> service area.<br />
Thresholds for poverty are adjusted every year to account for<br />
changes in the Consumer Price Index. The Department of<br />
Health and Human Services updates the poverty guidelines<br />
annually and releases these guidelines in the Federal<br />
Register.<br />
Poverty, as defined by the U.S. Census<br />
Poverty is determined by comparing the family’s income to a<br />
set of weighted average thresholds for a given family size. If<br />
a family’s total income is less than the threshold for the<br />
family’s size composition, the family and everyone in it are<br />
considered poor. If a person is not living with anyone<br />
related by birth, marriage, or adoption, the person’s own<br />
income is compared with his or her poverty threshold as an<br />
“unrelated individual.” It is important to note that poverty<br />
status was determined for everyone except those in<br />
institutions, military group quarters, or college dormitories,<br />
and unrelated individuals under 15 years old.<br />
The following table (Figure III-64) shows the Poverty<br />
Thresholds (Annual Dollar Amounts) by size of family and<br />
number of related children under 18 years old in 1999.<br />
Section III: Current<br />
Performance & Conditions<br />
118
Figure III-64: Definition of Poverty<br />
Size of family unit<br />
Weighted<br />
average<br />
threshold ($)<br />
One person<br />
(unrelated<br />
individual) 8,501<br />
Under 65 years 8,667 8,667<br />
65 years and over 7,990 7,990<br />
Related children under 18 years living in Household ($)<br />
None One Two Three Four Five Six Seven<br />
Eight or<br />
more<br />
Two people 10,869<br />
Householder<br />
under 65 years 11,214 11,156 11,483<br />
Householder 65<br />
years and over 10,075 10,070 11,440<br />
Three people 13,290 13,032 13,410 13,423<br />
Four people 17,029 17,184 17,465 16,895 16,954<br />
Five people 20,127 20,723 21,024 20,380 19,882 19,578<br />
Six people 22,727 23,835 23,930 23,436 22,964 22,261 21,845<br />
Seven people 25,912 27,425 27,596 27,006 26,595 25,828 24,934 23,953<br />
Eight people 28,967 30,673 30,944 30,387 29,899 29,206 28,327 27,412 27,180<br />
Nine people or<br />
more 34,417 36,897 37,076 36,583 36,169 35,489 34,554 33,708 33,499 32,208<br />
Source: U.S. Census Bureau, Current Population Survey
The following figure (Figure III-65) shows the poverty rates<br />
for areas in the San Bernardino Valley. The percentages<br />
indicated in the table denote the percentage of persons that<br />
fall below the poverty line with the U.S. Census thresholds.<br />
Figure III-65: Percent of Population<br />
Living Below the Poverty Level<br />
San Bernardino Valley (Total) 15.6<br />
Bloomington 25.3<br />
Chino 8.3<br />
Chino Hills 5.1<br />
Colton 19.6<br />
Fontana 14.7<br />
Grand Terrace 7.4<br />
Highland 21.5<br />
Loma Linda 15.1<br />
Mentone 10.4<br />
Montclair 17.4<br />
Muscoy 36.5<br />
Ontario 15.5<br />
Rancho Cucamonga 7.1<br />
Redlands 10.5<br />
Rialto 17.4<br />
San Antonio Heights 6.9<br />
San Bernardino 27.6<br />
Upland 12.0<br />
Yucaipa 11.2<br />
The unincorporated area of Muscoy had the highest<br />
percentage of persons that fall below the poverty line.<br />
According to the 2000 U.S. Census, more than one-third of<br />
the residents that live in Muscoy (36.5%) fall below the<br />
poverty line. The City of San Bernardino had the second<br />
highest rate of poverty with 27.6% of its residents falling<br />
below the poverty line.<br />
The City of Chino Hills and the unincorporated area of San<br />
Antonio Heights had the lowest rates of poverty (5.1 and 6.9<br />
respectively).<br />
Section III: Current<br />
Performance & Conditions<br />
120
Vehicle Availability<br />
Vehicle availability per household is also an indication of<br />
transit dependence. Limited access to a private vehicle<br />
entails that there is dependence on other modes of<br />
transportation such as carpooling, public transit, bicycle, or<br />
other method of travel.<br />
According to the U.S. Census, 31.8% of households in the<br />
San Bernardino Valley only have access to one (1) vehicle<br />
while 8.3% do not have access to a vehicle (Figure III-66). Of<br />
the fifteen cities and four unincorporated areas, San<br />
Bernardino has the highest rate of households without<br />
access to an automobile (15.2%) followed by Loma Linda<br />
(11.2%) and Colton (10.8%).<br />
Figure III-66: Available Vehicles per Household<br />
(percentage)<br />
0<br />
Cars<br />
1 Vehicle<br />
2<br />
Vehicles<br />
3+<br />
Vehicles<br />
San Bernardino Valley<br />
(Total) 8.3 31.8 40.4 21.9<br />
Bloomington 6.6 30.6 36.4 26.4<br />
Chino 6.0 25.6 49.8 41.0<br />
Chino Hills 1.8 17.5 50.2 30.5<br />
Colton 10.8 39.2 34.2 15.8<br />
Fontana 7.5 26.9 42.4 23.2<br />
Grand Terrace 3.5 29.5 45.1 21.9<br />
Highland 9.9 30.7 38.6 20.8<br />
Loma Linda 11.2 40.5 34.7 13.6<br />
Mentone 6.5 31.8 43.6 18.2<br />
Montclair 8.6 32.5 35.7 23.2<br />
Muscoy 14.1 32.9 32.6 20.4<br />
Ontario 8.3 31.7 38.2 21.9<br />
Rancho Cucamonga 4.3 26.7 44.4 24.6<br />
Redlands 7.1 36.6 37.4 18.9<br />
Rialto 8.7 32.7 36.0 22.6<br />
San Antonio Heights 1.3 14.9 44.6 39.2<br />
San Bernardino 15.2 38.1 32.7 14.0<br />
Upland 6.4 35.6 37.8 20.2<br />
Yucaipa 8.4 35.2 34.6 21.8<br />
There is a correlation between the percentage of poverty in<br />
a given area and the availability of vehicles per household<br />
121
(Figure III-67). Areas with a high percentage of poverty also<br />
have a high percentage of “one or zero” vehicles present per<br />
given household. Areas with a lower poverty rates have<br />
higher rates of vehicle ownership.<br />
Figure III-67: Correlation between Poverty<br />
and Vehicle Ownership (Percentage)<br />
Percent in<br />
Poverty<br />
0<br />
Vehicles 1 Vehicle<br />
2<br />
Vehicles<br />
3+<br />
Vehicles<br />
Muscoy 36.5 14.1 32.9 32.6 20.4<br />
San<br />
Bernardino 27.6 15.2 38.1 32.7 14.0<br />
Bloomington 25.3 6.6 30.6 36.4 26.4<br />
Highland 21.5 9.9 30.7 38.6 20.8<br />
Colton 19.6 10.8 39.2 34.2 15.8<br />
Montclair 17.4 8.6 32.5 35.7 23.2<br />
Rialto 17.4 8.7 32.7 36.0 22.6<br />
Ontario 15.5 8.3 31.7 38.2 21.9<br />
Loma Linda 15.1 11.2 40.5 34.7 13.6<br />
Fontana 14.7 7.5 26.9 42.4 23.2<br />
Upland 12.0 6.4 35.6 37.8 20.2<br />
Yucaipa 11.2 8.4 35.2 34.6 21.8<br />
Redlands 10.5 7.1 36.6 37.4 18.9<br />
Mentone 10.4 6.5 31.8 43.6 18.2<br />
Chino 8.3 6.0 25.6 49.8 41.0<br />
Grand Terrace<br />
7.4 3.5 29.5 45.1 21.9<br />
Rancho<br />
Cucamonga<br />
7.1 4.3 26.7 44.4 24.6<br />
San Antonio<br />
Heights<br />
6.9 1.3 14.9 44.6 39.2<br />
Chino Hills 5.1 1.8 17.5 50.2 30.5<br />
The unincorporated area of Muscoy and the City of San<br />
Bernardino both have a high percentage of persons that live<br />
below the poverty level and limited access to private<br />
vehicles. This could explain the high dependence on public<br />
transportation for both these areas. On the other hand,<br />
Chino Hills and San Antonio Heights have the lowest rates of<br />
poverty and higher rates of multiple private-vehicle<br />
ownership per household when compared to others areas.<br />
Yet the proportion of public transportation use is not as low<br />
Section III: Current<br />
Performance & Conditions<br />
122
(2.0 and 1.9 percent respectively) compared to other areas in<br />
the Valley. Both Yucaipa (0.7%) and Grand Terrace (0.8%)<br />
residents tend to use public transit less and tend to drive<br />
alone to work. This is the result of numerous transportation<br />
options (e.g. commuter rail, express bus service, etc.) into jobrich<br />
destinations to the west and limited transit options and<br />
job opportunities to the east.<br />
Federal and State Compliance<br />
Information<br />
Environmental Justice<br />
Environmental justice has become a significant issue for<br />
transit properties and the communities they serve. A 1994<br />
Presidential Executive Order required every federal agency<br />
to “make achieving environmental justice part of its mission<br />
by identifying and addressing, as appropriate<br />
disproportionately high and adverse human health or<br />
environmental effects of its programs policies and activities<br />
on minority populations and low income populations.” In<br />
the context of transit, this means that <strong>Omnitrans</strong> must<br />
ensure that its services are provided without discrimination<br />
towards minority or low-income populations. As a recipient<br />
of federal funding, <strong>Omnitrans</strong> is obligated to ensure that no<br />
one is denied the benefit of transit service on the basis of<br />
race, color, national origin or economic status. In order to<br />
evaluate the current situation the 2000 Census data was<br />
analyzed using GIS techniques.<br />
San Bernardino has a large minority population (here<br />
defined as all non-whites and Hispanic whites) and it is<br />
widely dispersed throughout the <strong>Omnitrans</strong> service area.<br />
Minority populations are evenly distributed throughout the<br />
service area but are generally higher in the East Valley than<br />
the West Valley. However, the East Valley areas of Redlands,<br />
Yucaipa and Highland generally have a lower proportion of<br />
minority residents.<br />
In order to assess the degree to which <strong>Omnitrans</strong> meets Title<br />
VI of the federal regulations, a spatial analysis was<br />
conducted comparing populations of lower income groups<br />
and minorities (LIM) with the presence of transit services and<br />
facilities. The spatial distribution of the LIM population is<br />
123
Section III: Current<br />
Performance & Conditions<br />
124<br />
shown in Figures III-68 and III-73. These population maps<br />
were then evaluated against four sets of route maps based<br />
on service coverage and frequency to determine if the LIM<br />
populations received better or worse service than non-LIM<br />
populations.
Figure III-68
Figure III-69
Figure III-70
Figure III-71
Figure III-72
Figure III-73
Service<br />
The four sets of service maps were based on a one-half mile<br />
walking distance to a bus route, which represents the<br />
current <strong>Omnitrans</strong> standard. The first map was limited to the<br />
network of services that operate with a frequency of every<br />
15 minutes or better (Figures III-68 and III-69). The second<br />
map was based on services that operate every 30 minutes or<br />
better (Figures III-70 and III-71), while the final map was<br />
based on all services that operate every 60 minutes or better<br />
(Figures III-72 and III-73).<br />
In the next step of the analysis the populations living within<br />
one-half mile of each level of service (15 minute, 30 minute,<br />
or all headways) was determined. The data drawn from the<br />
maps in Figures III-68 through III-73 were then used to<br />
calculate the total populations, LIM and non-LIM populations<br />
with the half mile walking distance of the service. The results<br />
consistently found that the populations within the walking<br />
distance zone had a higher proportion of LIM residents to<br />
non-LIM residents. For example, all services with a<br />
proportion of LIM residents within a half-mile of bus service<br />
was 55.3%, compared to the service area proportion of<br />
52.4% for LIMs. This population of LIMs also represents 89.1<br />
% of all LIMs living in the service area (Figure III-74).<br />
131
Figure III-74 LIM and Non-LIM Populations Served by<br />
<strong>Omnitrans</strong><br />
Total<br />
POP<br />
Total<br />
Non-Lim<br />
Total<br />
LIM<br />
%<br />
Non-<br />
LIM<br />
% LIM<br />
Service<br />
Area 1,278,077 608,448 669,629 47.6% 52.4%<br />
% of<br />
Total<br />
Non-<br />
LIM<br />
% of<br />
Total<br />
LIM<br />
Half-mile of Any (60-Minute and less) service<br />
Within 1,078,367 481,927 596,440 44.7% 55.3% 79.2% 89.1%<br />
Not Within 199,710 126,521 73,189 63.4% 36.6% 20.8% 10.9%<br />
30-Minute Service<br />
Within 824,994 338,191 486,803 41.0% 59.0% 55.6% 72.7%<br />
Not Within 453,083 270,257 182,826 59.6% 40.4% 44.4% 27.3%<br />
15-Minute Service<br />
Within 328,384 104,286 224,098 31.8% 68.2% 17.1% 33.5%<br />
Not Within 949,693 504,162 445,531 53.1% 46.9% 82.9% 66.5%<br />
Facilities<br />
The table in Figure III-75 shows that at stops with benches or<br />
shelters, the proportion of LIM population exceeds that of<br />
the LIM in the general population. For example 63.7% of the<br />
population within a half-mile of a shelter is LIM, compared to<br />
the overall system where 52.4% percent of the population<br />
within a half-mile of any stop is LIM. Overall 54.0% of the<br />
population within a half-mile of a stop with a shelter is LIM,<br />
compared to 33.9% percent that is not LIM.<br />
The maps in Figures III-76 and III-77 illustrate the distribution<br />
of passenger facilities or amenities in the <strong>Omnitrans</strong> service<br />
area. The maps specifically identify bus stops with or without<br />
benches and shelters. An analysis was conducted to<br />
determine if <strong>Omnitrans</strong> was meeting its Title VI obligations<br />
by ensuring that the distribution of passenger amenities<br />
does not discriminate against LIM populations.<br />
Section III: Current<br />
Performance & Conditions<br />
132
133<br />
Figure III-75 Percentage of LIM and Non-LIM Populations Near <strong>Omnitrans</strong> Bus Stop Amenities<br />
Total POP Total Non-Lim Total LIM<br />
%<br />
Non-LIM % LIM<br />
% of Total<br />
Non-LIM<br />
% of<br />
Total LIM<br />
Service<br />
Area 1,278,077 608,448 669,629 47.6% 52.4% 0.0% 0.0%<br />
Half-mile walk of any Stop<br />
Within 1,093,288 491,846 601,442 45.0% 55.0% 80.8% 89.8%<br />
Not<br />
Within 184,789 116,602 68,187 63.1% 36.9% 19.2% 10.2%<br />
Half-mile walk of any Stop with bench<br />
Within 765,014 316,488 448,526 41.4% 58.6% 52.0% 67.0%<br />
Not<br />
Within 513,063 291,960 221,103 56.9% 43.1% 48.0% 33.0%<br />
Half-mile walk of any Stop with shelter<br />
Within 567,466 205,964 361,502 36.3% 63.7% 33.9% 54.0%<br />
Not<br />
Within 710,611 402,484 308,127 56.6% 43.4% 66.1% 46.0%
Section III: Current<br />
Performance & Conditions<br />
134<br />
Figure III-76
135<br />
Figure III-77
Energy Contingency<br />
<strong>Omnitrans</strong> has developed an Emergency Preparedness <strong>Plan</strong><br />
and an Energy Contingency <strong>Plan</strong> to undertake appropriate<br />
corrective measures in case of emergencies relative to<br />
natural or human-caused disasters. Both plans are designed<br />
to provide “transparent” transportation services in the event<br />
of an emergency. The Energy Contingency <strong>Plan</strong> was<br />
updated in 2002 and renamed the Contingency Fleet <strong>Plan</strong>.<br />
The Contingency Fleet <strong>Plan</strong> more accurately describes the<br />
need for contingency buses and the purpose for a<br />
contingency fleet. The Contingency Fleet <strong>Plan</strong> not only<br />
includes issues pertaining to energy related emergencies.<br />
Rather, it applies to all emergencies that require additional<br />
buses beyond <strong>Omnitrans</strong>’ normal compliment. To be in<br />
compliance with FTA requirements, the plan required this<br />
renaming. Otherwise, a new Contingency <strong>Plan</strong> would have<br />
had to be developed.<br />
The FTA compliant Contingency Fleet <strong>Plan</strong> established the<br />
framework by which the contingency buses would be<br />
utilized by <strong>Omnitrans</strong> in response to an emergency.<br />
The Contingency Fleet at <strong>Omnitrans</strong> will consist of seven<br />
large retired buses. The following buses constitute the<br />
contingency fleet for 2004-05: 1639, 1640, 1641, 1642,<br />
1660, 1670, and 1674. The specific bus numbers will change<br />
as “better” or “newer” buses are retired. <strong>Omnitrans</strong>’ objective<br />
is to have five percent of the fleet in a contingency status in<br />
preparation for emergencies. The reason for this is that in<br />
recent years increasing emphasis has been placed on interagency<br />
coordination and cooperation among emergency<br />
services. <strong>Omnitrans</strong> is an essential transportation provider. As<br />
such, <strong>Omnitrans</strong> needs to maintain a fleet of buses in a level<br />
of readiness to fill gaps in the regional transportation system.<br />
This contingent fleet of <strong>Omnitrans</strong> buses is ready for<br />
purposes of evacuation, emergency medical need, fire, or<br />
capacity needs. These needs are directly linked to <strong>Omnitrans</strong>’<br />
Emergency Preparedness <strong>Plan</strong>. This fleet is also authorized<br />
for use as replacement vehicles for other vehicles being<br />
repaired in a long-term campaign.<br />
In cases of emergencies, <strong>Omnitrans</strong> will first utilize all of the<br />
existing fleet of service ready buses and operational spares.<br />
Once all of these buses have been placed into service and<br />
Section III: Current<br />
Performance & Conditions<br />
136
there is an ongoing need for additional buses based on the<br />
emergency, <strong>Omnitrans</strong> will activate the contingency fleet.<br />
The Director of Maintenance, after consultation with the<br />
Director of Operations will provide Operations buses from<br />
the contingency fleet to address the emergency. Once the<br />
emergency has expired, the contingency buses will be<br />
removed from service and returned to contingency status.<br />
In conjunction with <strong>Omnitrans</strong>’ Contingency Fleet <strong>Plan</strong> and<br />
<strong>Omnitrans</strong>’ Emergency Preparedness <strong>Plan</strong>, <strong>Omnitrans</strong><br />
undertakes additional efforts directly related to emergency<br />
contingency planning. These efforts include actions to<br />
increase system passenger capacity, re-pricing services to<br />
meet short-term contingencies, and redesigning services to<br />
economize on fuel and equipment requirements.<br />
More detailed information can be obtained in <strong>Omnitrans</strong>’<br />
2002 Contingency Fleet <strong>Plan</strong> and in <strong>Omnitrans</strong>’ Emergency<br />
Preparedness <strong>Plan</strong>.<br />
ADA Compliance<br />
Originally submitted in 1992, <strong>Omnitrans</strong> Americans with<br />
Disabilities Act (ADA) <strong>Plan</strong> was updated annually through<br />
1998. In 1998, the Federal <strong>Transit</strong> Administration modified<br />
the annual ADA reporting requirements so that public fixedroute<br />
transit operators no longer were required to file<br />
updates to their <strong>Plan</strong>s, so long as they had attained and<br />
continue to provide paratransit services to all persons who<br />
are unable to use the fixed-route service because of<br />
limitations imposed by their disabilities, and if this paratransit<br />
service meets all of their required service criteria. As<br />
<strong>Omnitrans</strong> services did and currently continue to meet this<br />
standard, <strong>Omnitrans</strong> is no longer required to submit an<br />
annual update.<br />
However, this does not discount the other areas of ADA<br />
Compliance the <strong>Omnitrans</strong> works to meet every day. This<br />
includes:<br />
Bus Stop Announcements/Passenger Assistance<br />
Accessibility at Bus Stops<br />
Accessibility between Bus Stops and<br />
Facilities/Developments<br />
Fare requirements and Premium Service<br />
137
In addition to these elements, <strong>Omnitrans</strong> works closely with<br />
city staff, developers and social service organizations to<br />
encourage transit-friendly design and accessibility<br />
improvements when sites are relocated or built.<br />
Bus Stop Announcements/Passenger Assistance<br />
One of the main concerns of passengers is the feeling of<br />
security that is lost when riding a bus; people may lose track<br />
of where they are, or where they need to get off to reach<br />
their destination. This is no different for people with<br />
disabilities. It is a requirement under the ADA that all major<br />
destinations, major intersections and at transfer locations are<br />
announced on board the bus. To ensure that this<br />
requirement is met, <strong>Omnitrans</strong> is currently working with a<br />
contractor to install an automatic annunciator system. With<br />
this system, all major stop locations will be announced, and<br />
passengers can request a particular stop along a route be<br />
called out, no matter what the location.<br />
Accessibility at Bus Stops<br />
<strong>Omnitrans</strong> works closely with cities and currently uses two<br />
documents that assist with design, engineering and<br />
construction at new bus stops. Designing for <strong>Transit</strong>, by San<br />
Diego Metropolitan <strong>Transit</strong> Board, assists with incorporating<br />
elements into a development that encourages transit usage.<br />
Orange County <strong>Transit</strong> Authority’s Bus Facilities Handbook<br />
includes specifications, sizes, and ADA requirements when a<br />
new stop is constructed. Over the next year, <strong>Omnitrans</strong> will<br />
be developing its own design and construction manual to<br />
assist cities and developers specifically within the San<br />
Bernardino Valley when making street improvements or<br />
incorporating a bus stop into a new facility design.<br />
Accessibility between Bus Stops and Facilities/Developments<br />
Another critical element to ADA compliance is one that is<br />
often beyond the control of <strong>Omnitrans</strong>: the path of travel<br />
between a bus stop and a particular facility’s or<br />
developments’ entrance. As cities permit new construction,<br />
this is often considered and necessary steps taken to assure<br />
accessibility, but in some instances, critical elements may be<br />
overlooked. When <strong>Omnitrans</strong> becomes aware of bus stops<br />
that are not accessible due to path of travel issues, staff is<br />
responsible to contact the city or county, to make them<br />
Section III: Current<br />
Performance & Conditions<br />
138
aware of the problem as well. With this coordination, it is<br />
possible to slowly improve path of travel accessibility.<br />
Fare Requirements and Premium Service<br />
As a Federal <strong>Transit</strong> Administration Grant Recipient,<br />
<strong>Omnitrans</strong> must allow individuals 65 years of age and over,<br />
persons with disabilities, and Medicare cardholders to ride<br />
fixed-route services during the off-peak period for a fare that<br />
is not more than one-half the base fare charged other<br />
persons during the peak period. <strong>Omnitrans</strong> offers this halffare<br />
all day long, and it is eligible to individuals 60 years of<br />
age and over, persons with disabilities, and Medicare<br />
cardholders.<br />
This requirement is for fixed-route service only. It is not<br />
applicable to demand responsive service, such as Omnilink,<br />
which are open to the general public, and which have their<br />
own fare structure. Under its fare structure, seniors,<br />
students, and persons with disabilities ride for half of the<br />
Omnilink regular fare.<br />
Access Service, <strong>Omnitrans</strong> paratransit service, also has a<br />
different fare structure. The fare for a trip charged to an<br />
Access rider is not more than twice the fare that would be<br />
charged to an individual paying full fare (i.e., without regard<br />
to discounts) for a trip of similar length, at a similar time of<br />
day, on <strong>Omnitrans</strong>’ fixed-route system. This calculation<br />
includes transfer and premium charges applicable to a trip of<br />
similar length, at a similar time of day, on the fixed-route<br />
system. A personal care attendant can ride free of charge.<br />
If a paratransit trip exceeds the minimum requirements for<br />
complementary paratransit provided under the ADA,<br />
<strong>Omnitrans</strong> is permitted, and does, charge a premium fare for<br />
the trip.<br />
139
Section III: Current<br />
Performance & Conditions<br />
140<br />
Notes:
Section IV: Service Design Guidelines<br />
& Performance Standards<br />
A plan is a list of actions<br />
arranged in whatever<br />
sequence is thought<br />
likely to achieve an<br />
objective.<br />
- John Argenti, author<br />
and founder of the<br />
Strategic <strong>Plan</strong>ning<br />
Society
Service Design Guidelines<br />
What Is <strong>Transit</strong> For?<br />
Like any transit plan, this <strong>Short</strong> <strong>Range</strong> <strong>Transit</strong> <strong>Plan</strong> reflects the<br />
need to balance the competing goals of transit. The most<br />
difficult of these tradeoffs is between Productivity (maximum<br />
ridership per unit of cost) and Coverage (access for all parts<br />
of the community).<br />
A 100% Productivity-oriented system (that is, one designed<br />
solely for maximum ridership per hour of service) would<br />
abandon most service to large parts of the present service<br />
area. It would offer very intensive local service to the densest<br />
and most transit-dependent parts of the area, which are<br />
mostly in San Bernardino, Colton, Fontana and parts of<br />
Chino and Montclair.<br />
A 100% Coverage-oriented system, on the other hand,<br />
would spread service evenly to every part of the service area,<br />
including remote, low-density areas such as Devore or the<br />
affluent upper foothills that are unserved today. To do this, a<br />
“100% Coverage” system would cut frequencies on the<br />
busiest corridors such as Foothill, Highland, Holt, San<br />
Bernardino and Baseline, resulting in a dramatic drop in<br />
ridership and severe overcrowding.<br />
There is no technical answer to the question of how to<br />
balance these two goals. The balance is a pure value<br />
judgment. For this reason, the Board was briefed on this<br />
issue early in FY 2002, and asked to give preliminary<br />
direction about whether <strong>Omnitrans</strong> should shift the balance<br />
one way or the other.<br />
The Board’s direction is to shift this balance to about 65%<br />
Productivity, 35% Coverage. However, the board specified<br />
that this change should occur gradually as resources<br />
increase; therefore, it will not be necessary to cut existing<br />
Coverage-oriented services – though some effort can be<br />
made to optimize the efficiency of these services. The<br />
existing system devotes roughly 55% of its resources to<br />
Productivity and 45% to Coverage.<br />
141
Overview and Background<br />
Service Design Guidelines Background<br />
Service design guidelines, or performance measurement<br />
guidelines, provide an objective rationale for the allocation<br />
of transit resources. Service design guidelines provide the<br />
tools for making decisions on the provision of transit services,<br />
the design of routes and schedules, and the evaluation of<br />
services. Service design guidelines serve five major functions:<br />
Service Development<br />
The guidelines form a consistent basis for service planning,<br />
and, in particular, for establishing minimum levels of service.<br />
Judgment and flexibility remain, but the guidelines assist in<br />
the development of new services and the refinement of<br />
existing services.<br />
Evaluation<br />
Service design guidelines provide targets in the form of<br />
indicators and standards that enable the performance of the<br />
individual routes to be evaluated and monitored by<br />
management decision-makers.<br />
Budgeting<br />
The preparation of annual budgets should reflect the goal of<br />
providing service to the policy levels established in the<br />
service design guidelines. This should enable the Board of<br />
Directors to focus on the policy level decisions and the<br />
service impacts of budget adjustments.<br />
Public Accountability<br />
Political decision-makers, transit customers, voters and<br />
taxpayers should be able to readily identify the minimum<br />
levels of service and performance that are to be provided.<br />
The allocation of the resources of the transit system must be<br />
seen to be based on equitable and rational criteria that are<br />
explicit and available for public scrutiny.<br />
Title VI<br />
Title VI of the Civil Rights Act requires public transit agencies<br />
receiving federal funding to ensure that that service is<br />
provided without regard to race or the economic status of<br />
the residents. Application of service design guidelines<br />
Section IV<br />
Service Design Guidelines<br />
& Performance Standards<br />
142
provides a tool for design and evaluating service that does<br />
not discriminate on race or economic status.<br />
The service design guidelines are intended to be flexible in<br />
interpretation and application and to be continuously<br />
refined. As new types of services or data sources are<br />
introduced, revisions to the guidelines may become<br />
appropriate. Flexibility in application and interpretation must<br />
be maintained, as the environment in which these guidelines<br />
will be applied is not static and will continue to change as<br />
the region grows and transportation demand increases.<br />
The guidelines have been designed to enable <strong>Omnitrans</strong> to<br />
establish targets consistent with actual financial resources.<br />
As resources improve the targets could be enhanced, or if<br />
resources grow more limited the targets could be relaxed.<br />
The guidelines will be applied to identify transit services that<br />
should be improved or added, or may be falling below<br />
acceptable performance levels. If a service fails to meet the<br />
identified performance level further investigations and<br />
analysis will be undertaken to confirm whether the<br />
guidelines are being achieved, and a broad range of<br />
potential corrective actions may be considered. The action<br />
taken, if any, will need to be appropriate given the specific<br />
circumstances of the service in question.<br />
Goals and Objectives<br />
Introduction<br />
The overall approach has been to develop a hierarchy of<br />
goals, objectives, indicators and standards. Under this format<br />
the general goal statements for transit are found in the<br />
corporate mission statement or the broad strategic direction<br />
of the Board of Directors. The corporate mission statement is:<br />
To provide the San Bernardino Valley with comprehensive<br />
public mass transportation services which maximize<br />
customer use, comfort, safety and satisfaction, while<br />
efficiently using financial and other resources in an<br />
environmentally sensitive manner.<br />
The specific objectives to be achieved by the transit system<br />
have been developed from the general agency mission<br />
statement and the vision of allocating resources between<br />
productivity and coverage. Performance indicators are the<br />
143
specific, quantifiable criteria that would be used to measure<br />
the performance of the system in relation to an objective.<br />
Standards are the target level of performance, which would<br />
be used to evaluate the criteria identified in the indicator.<br />
Another element of service design guidelines are New<br />
Service Warrants. New Service Warrants provide a tool for<br />
planners to use that can assist in determining when new<br />
services, or service extensions, are most appropriate.<br />
Principles<br />
The principles define the purpose and direction for the<br />
service design guidelines. The principles are:<br />
Support County & Municipal Transportation and Land Use<br />
Goals. The service design guidelines should be supportive of<br />
strategic transportation and land use goals of SCAG,<br />
SANBAG, and local jurisdictions.<br />
Redlands Trolley<br />
Support National, State and Regional Air Quality and Energy<br />
Goals. The service design guidelines should be supportive of<br />
air quality and energy goals.<br />
Customer Focus. The service design guidelines should<br />
address aspects of transit service that are of the highest<br />
importance to current and potential customers.<br />
Equal Application in all Municipalities. Guidelines should be<br />
defined and measured in a way that does not unfairly bias<br />
the allocation of service in favor of particular municipalities.<br />
The same guidelines should be applied equally across the<br />
region.<br />
Equity to all Residents. The guidelines should promote the<br />
availability of a basic level of transit mobility to all residents of<br />
the <strong>Omnitrans</strong> service area, and in particular, those without<br />
access to other modes of transportation. This principle also<br />
includes the provision of appropriate municipal infrastructure<br />
to support this basic level of service in all communities (e.g.<br />
streets designated for use by transit vehicles, accessible bus<br />
stops and bus shelters, and appropriate use of transit priority<br />
measures). This principle also ensures compliance with<br />
Federal Title VI requirements.<br />
Section IV<br />
Service Design Guidelines<br />
& Performance Standards<br />
144
Clarity. Service design guidelines, and their supporting<br />
reasons, should be clear and easy to understand by<br />
customers and other stakeholders.<br />
Measurability. Each service design guideline should be<br />
measurable using reliable data that is currently available, or<br />
with data that is planned to be collected in the future.<br />
Quantify all service design guidelines. Guidelines should be<br />
quantifiable and objective. Guidelines should not be open to<br />
subjective interpretation.<br />
Ease of Implementation and Monitoring. The service design<br />
guidelines should be straightforward to implement and to<br />
monitor on a continuous basis by <strong>Omnitrans</strong>.<br />
Typical Route<br />
Network Types<br />
Basic Radial<br />
Hub & Spoke<br />
Provide guidelines that are practical and easy to implement.<br />
The guidelines should lend themselves to consistent and<br />
continuous application by <strong>Omnitrans</strong> to identify transit<br />
services needing further investigation for possible<br />
adjustments.<br />
Cost-Effectiveness. The service design guidelines should<br />
ensure that all transit services in the region are as costeffective<br />
as possible.<br />
Responsiveness to Changes in Urban Form. The service<br />
design guidelines should reflect the changing needs of<br />
communities for transit services as they reach various levels<br />
of urban development.<br />
Provide guidelines for the provision of transit coverage in<br />
new developments. The guidelines should include<br />
evaluation criteria for requests to introduce transit service in<br />
new development areas.<br />
The Service Design Guidelines developed in this report are<br />
intended to be applied to all transit services in the region<br />
except Access. The types include:<br />
Bus – Local services provided with standard accessible buses<br />
serving the region’s more dense residential or employment<br />
areas.<br />
Radial/Branch<br />
Basic Grid<br />
Grid/Hub Hybrid<br />
Trunk/Hub<br />
145
Omnilink – Minibuses on flexible routes where the capacity<br />
provided by standard buses is not required.<br />
Bus Rapid <strong>Transit</strong> – A limited stop service using upgraded<br />
facilities and a superior level of service.<br />
Express Service - Express services operated with suburban<br />
highway coaches on higher-speed roadways linking civic<br />
centers and main transportation nodes.<br />
Service Design Guidelines<br />
The proposed Service Design Guidelines are structured as a<br />
hierarchy of objectives and indicators. In this chapter each<br />
objective, indicator, and standard are discussed. The<br />
objectives are designed to be consistent with the Statement<br />
of Principles outlined earlier.<br />
Route Network Structure Objective<br />
The purpose of this objective is to provide direction for the<br />
overall design of the transit network. This objective also<br />
provides guidance in terms of providing network<br />
connectivity and ease of use. The objective is:<br />
To operate a network of transit services that is easy to<br />
understand and use, supports regional land use and<br />
transportation objectives, improves accessibility, enhances<br />
connectivity between activity centers, encourages increased<br />
use of transit, and meets the minimum mobility needs of the<br />
region.<br />
The indicators for this objective create guidelines that shape<br />
the network and connectivity of the system. The importance<br />
of the indicators is derived from the requirement to service a<br />
large geographic area with multiple municipalities and<br />
regional centers with dispersed employment and commercial<br />
areas.<br />
Ensuring that customers easily understand the system<br />
encourages ridership, reduces the cost of providing transit<br />
information and reduces delays from customers seeking<br />
information from front-line employees. Some of the service<br />
Section IV<br />
Service Design Guidelines<br />
& Performance Standards<br />
146
development issues that contribute to an ease of<br />
understanding include a clear distinction between grid and<br />
timed transfer operations, and the minimization of route<br />
deviations and route branching or scheduled short turns.<br />
The recommended indicators are:<br />
All transit services should be scheduled using the timedtransfer<br />
concept except when an area has sufficient<br />
productivity to warrant minimum daytime service<br />
frequencies of better than 15 minutes. A grid-route system<br />
with random transfers may be implemented in combination<br />
with timed transfers, when headways of 15 minutes or<br />
better are operated over a large area.<br />
Resources for the entire system (fixed route, Access,<br />
Omnilink) should be allocated on the basis of expending 35<br />
percent of the budget on services providing the minimum<br />
level of coverage and 65 percent on services that exceed the<br />
minimum levels of service guidelines (productivity or<br />
demand based).<br />
For a trip-specific deviation the net person-time impact of the<br />
diversion should not result in an adjusted deviation factor<br />
greater than 1. The adjusted deviation factor is defined as:<br />
The ratio of through passenger added time (in personminutes)<br />
divided by the amount of time (in person-minutes)<br />
saved by passengers boarding and alighting in the deviation<br />
section less the amount of added walk time for people in the<br />
section of the original route that is abandoned. This is<br />
represented by the formula:<br />
(Pt x Vtt)
This guideline for route deviations permits some deviations<br />
at the outer ends of routes where fewer customers are<br />
expected. However, the closer the route deviation is located<br />
to the point where the maximum number of customers is<br />
onboard, the less likely a deviation would meet the<br />
guideline.<br />
Productivity Objective<br />
Productivity objectives and indicators are probably the most<br />
sensitive of all transit service standards since they are most<br />
often used to reallocate or adjust service levels. The<br />
objective is:<br />
To ensure that the service designs are appropriate for the<br />
level of ridership on each route and they support the system<br />
wide fiscal requirements of the State of California and the<br />
objectives of the Board of Directors.<br />
The purpose of this objective is to ensure that each individual<br />
service is reasonably productive by providing an appropriate<br />
frequency, vehicle, and type of service, given the level of<br />
ridership. The objective as it is worded also notes that fiscal<br />
objectives should be considered at a system wide level.<br />
The productivity objective balances measuring the<br />
usefulness or contribution of a specific transit route to<br />
regional transportation objectives through the methods of<br />
seat utilization and boardings (passengers) per revenue<br />
hour.<br />
Passengers per Revenue Hour<br />
Passengers per revenue hour is an industry-wide standard<br />
used to determine whether a route is carrying enough<br />
passengers to justify itself; deficient performance triggers a<br />
study process which may lead to remedial actions including<br />
enhanced marketing, redesign, or elimination of service.<br />
For a system of predominantly local services such as<br />
<strong>Omnitrans</strong>, the passengers per hour measurement approach<br />
is broadly acceptable as a basis for comparison. Agencies<br />
that invest heavily in long-distance express services have<br />
much more difficulty measuring service performance.<br />
“Boardings” are problematic because passengers may use<br />
the service for very long distances or very short ones.<br />
Section IV<br />
Service Design Guidelines<br />
& Performance Standards<br />
148
Obviously a route designed to carry passengers long<br />
distances will have fewer boardings per hour, because its<br />
passengers take longer to serve.<br />
Most systems recognize that boardings per hour may vary<br />
dramatically depending on the type of route. An urban<br />
cross-town route, such as the service on 5th Street or<br />
Foothill, could have a very high number of boardings per<br />
hour, but never reach full capacity due to the frequent<br />
turnover of customers. On the other hand, a route such as<br />
Route 90, freeway express service, could be completely full<br />
but have a relatively low number of boardings per hour due<br />
to the length of the express portion of the route. In order to<br />
mitigate for this inequity, most systems establish categories<br />
of bus routes such as peak express, express, cross-town,<br />
mainline, local, or feeder. Specific boardings per hour targets<br />
are established for each route classification.<br />
Considered at the system level, the measure is governed<br />
largely by the mix of services provided, which is a reflection<br />
of local demographics, priorities, and values. However, if<br />
service is divided into some simple categories, meaningful<br />
targets can be established for boardings per revenue hour.<br />
Services whose purpose is for Productivity and those whose<br />
purpose is intended for Coverage are categorized. The<br />
philosophy behind service standards depends on the route’s<br />
purpose:<br />
Productivity-oriented services are intended to maximize<br />
ridership systemwide. For this reason, they are held to a<br />
high standard that reflects the performance of the most<br />
productive routes in the system and are subject to periodic<br />
review. The overriding goal of Productivity service is to<br />
maximize ridership.<br />
Coverage-oriented services are designed for purposes other<br />
than productivity. Low-density markets are served in the<br />
most cost-effective way possible. Coverage-oriented routes<br />
therefore also have standards for boardings/revenue hour,<br />
but these should vary to reflect the cost/hour of different<br />
types of service. For Coverage-oriented service, the bottom<br />
line is not really productivity, but the cost of serving each<br />
passenger, which must be kept to a minimum. This cost is a<br />
combination of productivity and cost/hour of service.<br />
149
Productivity standards are classified by type of service and<br />
purpose of the service. The standards, which should be<br />
reviewed periodically, are based on community<br />
transportation needs, peer review, historical performance<br />
data, and projected financial resources. The productivity<br />
standard is a useful indicator of the quality of service that is<br />
provided and the cost of providing these services.<br />
Performance standards are established separately for each<br />
mode of service for performance assessment under the<br />
criteria of productivity and coverage.<br />
The service categories are based on key factors that tend to<br />
dramatically affect productivity. The categories are defined<br />
as follows:<br />
Fixed Route is all-day fixed route service designed primarily<br />
to serve short trips of less than five miles or so, AND to serve<br />
as a feeder to Regional services (Metrolink, Regional Express)<br />
for longer trips. Local fixed routes can be designed for<br />
Productivity, as Routes 1, 2, 14 and 61 are, or they can be<br />
designed for Coverage, such as Routes 20, 30 and 31.<br />
Regional lines are all-day fixed route services designed<br />
primarily to serve trips over five miles and to connect<br />
regional destinations at high speed, such as <strong>Omnitrans</strong><br />
Route 90, linking San Bernardino, Riverside, and Montclair.<br />
This route is productivity-oriented in its ultimate goal, but is<br />
held to a 50% lower standard because the average<br />
passenger-trip length is more than twice as long. It is difficult<br />
to evaluate the value to the community of carrying fewer<br />
people longer distances, as opposed to carrying more people<br />
shorter distances, but this standard reflects a reasonable<br />
approximation that reflects the unusual nature of express<br />
service.<br />
School Markets can produce high productivity figures, so<br />
they must be understood separately. These lines run only at<br />
the times when a high school or junior high school would fill<br />
the bus, and the large loads from the school form almost all<br />
of the ridership. School markets, of course, play a large role<br />
in the productivity of many Local services, but their effect,<br />
averaged out across an all-day service, is less pronounced in<br />
the overall productivity figure.<br />
Section IV<br />
Service Design Guidelines<br />
& Performance Standards<br />
150
ACCESS is the paratransit service for the ADA-eligible<br />
disabled and is available throughout the <strong>Omnitrans</strong> service<br />
area, within ¾-mile band on either side of <strong>Omnitrans</strong> regular<br />
fixed route bus lines. Persons with an <strong>Omnitrans</strong> Disability ID<br />
card may ride Access Monday through Friday, 7 a.m. to 6<br />
p.m., on a space available basis. This service is never<br />
intended to be highly productive because it serves such a<br />
specialized market. Its existence is required by Federal law<br />
wherever and whenever fixed route services operate.<br />
Omnilink is a demand-responsive service open to the general<br />
public that provides efficient Coverage-oriented service in<br />
low-density areas where no fixed route service is proposed.<br />
Omnilink circulates within a defined area picking up and<br />
dropping off passengers throughout the area at requested<br />
stop locations. Every hour, the bus returns to a timedtransfer<br />
point, for direct, timed connections to the fixed route<br />
system. This demand-responsive service is offered in the<br />
cities of Yucaipa, Grand Terrace/South Colton, and Chino<br />
Hills. The Omnilink service is not intended to be highly<br />
productive, but more productive than ACCESS.<br />
Seat Utilization<br />
Seat utilization is a measurement of how much of the service<br />
being provided (seat miles) is being consumed (passenger<br />
miles). It is expressed as a percentage (passenger miles/seat<br />
miles).<br />
In the passenger airline industry the key measures of route<br />
performance are load factor, yield, cost, and profit. Load<br />
factor, or utilization, is based on the number of customer<br />
miles (demand) compared to the number of seat miles<br />
available (or capacity). Yield is the average customer fare for<br />
the flight divided by the distance flown. The load factor rate<br />
is used to evaluate the volume, while the yield is used to<br />
evaluate the revenue. The yield is compared to the actual<br />
seat-mile cost of operation to determine profitability. One of<br />
the advantages of the use of load factor is that it provides a<br />
performance evaluation that is independent of the aircraft<br />
(or vehicle) size or route type. A low load factor percentage<br />
would be an indication to change to a smaller aircraft or to<br />
less frequent service, while a high load factor might be used<br />
to justify a larger aircraft or more frequent service. Low<br />
151
yields would suggest a need to raise fares. In other words<br />
revenues and costs are looked at independently of<br />
passengers and utilization.<br />
Load factor, or utilization, for transit services is more complex<br />
to calculate due to the large number of stops and the<br />
multitude of vehicles on each route, but the advantages are<br />
the same. The concept of measuring utilization is to<br />
determine what “percentage” of the capacity being offered<br />
on each route is indeed being consumed. A low utilization<br />
would be an indication that service should be less frequent,<br />
or a smaller vehicle utilized. Low utilization on one section of<br />
a route would be an indication that some vehicles could be<br />
short-turned so that service would be less frequent on that<br />
section. A high utilization rate would indicate that more<br />
frequent service or larger vehicles might be appropriate.<br />
Distance-based utilization based on the distance that<br />
passengers travel, by itself, does not assess the efficiency of<br />
the schedule. Costs are incurred even if a bus is at a layover<br />
point; therefore an additional indicator of time-based<br />
utilization captures performance related to service hours and<br />
demonstrates the efficiency of a schedule.<br />
Time-based utilization shows that a bus route that<br />
incorporates very long layover times as a result of the need<br />
to make connections would be less productive than one that<br />
is more tightly scheduled. It would also show that buses<br />
operating in congested traffic conditions are not as<br />
productive as buses provided with priority measures by road<br />
authorities (municipalities).<br />
The recommended performance indicators are:<br />
<br />
Each service within each type of service should<br />
maintain a minimum average distance utilization as<br />
measured in passenger miles per seat-miles in specific<br />
time periods, as provided in Figure IV-1.<br />
Section IV<br />
Service Design Guidelines<br />
& Performance Standards<br />
152
Figure IV-1 Proposed Minimum Average Distance Based<br />
Utilization Standards for Bus Services<br />
Service Type<br />
Overall<br />
Customer<br />
mile/Seat<br />
mile<br />
Standard<br />
Weekday<br />
Customer<br />
mile/Seat<br />
mile<br />
Standard<br />
Saturday<br />
Customer<br />
mile/Seat<br />
mile<br />
Standard<br />
Sunday<br />
Customer<br />
mile/Seat<br />
mile<br />
Standard<br />
Express 22% 25% 15% 15%<br />
Bus 18% 20% 10% 10%<br />
Omnilink 18% 20% 10% 10%<br />
<br />
Each service within each type of service should<br />
maintain a minimum average time utilization as<br />
measured in passenger minutes per seat-minutes in<br />
specific time periods, as provided in Figure IV-2.<br />
Service<br />
Type<br />
Figure IV-2: Proposed Minimum Average Time Based<br />
Utilization Standards for Bus Services<br />
Overall Weekday Saturday<br />
Customer Customer Customer<br />
minutes/ minutes/ minutes/<br />
Seat Seat minutes Seat minutes<br />
minutes Standard Standard<br />
Standard<br />
Express 17% 20% 10% 10%<br />
Bus 13% 15% 5% 5%<br />
Omnilink 13% 15% 5% 5%<br />
Sunday<br />
Customer<br />
minutes/<br />
Seat minutes<br />
Standard<br />
Any service where the distance-based utilization is more than<br />
10 percent greater than the time-based utilization should be<br />
reviewed to determine if efficiencies can be achieved<br />
through service design or transit priority measures.<br />
The standards are pegged initially at approximately the 25th<br />
percentile for each type, in each time period. This means<br />
that about 25 percent of the services would be subject to<br />
review each year. An examination of the productivity of the<br />
Omnilink service as well as some of the lowest performing<br />
bus routes was used to develop the targets for Omnilink.<br />
Where large bus services were included, the productivity<br />
was prorated to reflect a 20-passenger bus rather than a<br />
standard 38-passenger vehicle.<br />
153
The standards for each type of service would ultimately be<br />
adjusted to ensure that the overall transit operation was able<br />
to meet its system-wide cost recovery objectives.<br />
The intent is that the standards would be applied as an<br />
average for all trips. The targets for specific time periods or<br />
on route segments would be examined where a route failed<br />
to meet the overall guideline.<br />
Seat utilization based on distance (passenger miles per seat<br />
miles), retrieved from Automatic Passenger Counter (APC)<br />
data for the first quarter of 2004 is summarized in the<br />
Existing Conditions. The routes with utilization of less than<br />
20 percent are in the bottom quartile and are candidates for<br />
review and adjustment.<br />
Service Coverage & Minimum<br />
Service Quality Objective<br />
The Service Coverage and Minimum-Service Quality<br />
Objective establishes the transit service areas within the<br />
municipalities of the service area in which transit service may<br />
be provided within a reasonable walking distance for<br />
customers. The purpose of the objective is to clearly indicate<br />
that at least a basic minimum level (coverage) of transit<br />
service may be provided within urban areas with significant<br />
residential or employment land uses. This is an important<br />
distinction for <strong>Omnitrans</strong> due to the large portions of the<br />
region that are rural or undeveloped. The service coverage<br />
objective should indicate that there is only a commitment to<br />
provide a basic level of service and all areas should not<br />
expect the same level of service beyond the coverage<br />
minimum. The proposed objective is:<br />
To provide a minimum basic level of transit accessibility to all<br />
urban residential and employment areas identified by<br />
SANBAG, and that the minimum service levels meet the basic<br />
mobility needs of the transportation disadvantaged and<br />
transit dependent.<br />
Several indicators are required to fully assess whether the<br />
objective of providing a minimum level of service and access<br />
is being met. The required indicators include:<br />
Walking distance to transit service<br />
Section IV<br />
Service Design Guidelines<br />
& Performance Standards<br />
154
Hours of service<br />
Minimum service frequencies<br />
It appears desirable to adopt service frequency indicators<br />
that can be applied across all routes and time periods<br />
throughout the region. While most areas now have halfhourly,<br />
or better, service there are some routes that operate<br />
only hourly or every 45 minutes. The areas with services<br />
operating every 15 minutes are receiving the higher levels of<br />
service as a result of higher ridership, not simply because<br />
they are in the more urbanized areas. If ridership on these<br />
routes were to fall below the productivity threshold service<br />
would likely be reduced to half hourly. Similarly, if ridership<br />
in other areas grows, it may become feasible to add more<br />
service to meet the demand and increase frequencies to<br />
every 15 minutes or better.<br />
An indicator should therefore be used to establish the<br />
minimum policy frequency beyond which frequencies are set<br />
based on market demand or productivity. Numerous transit<br />
systems have used complex tables incorporating route<br />
classifications and time-of-day to set minimum service<br />
frequencies. Many others, however, are able to operate with<br />
a single guideline.<br />
The recommended indicators for the Service Coverage<br />
Objective are:<br />
All areas having a minimum residential density of 3.5<br />
dwelling units per acre or a minimum employment<br />
density of 10 jobs per acre, as measured over an area<br />
of 25 acres, should be provided with a transit service<br />
that places 90 percent of residences and jobs within .5<br />
miles of a bus stop. Reduced walking distances may<br />
be encouraged in situations where steep grades or<br />
safety hazards create an unacceptable pedestrian<br />
access route. A request-stop service should be in<br />
effect for alighting customers on all busservices (in<br />
local stop areas) services after 8:00 p.m. and before<br />
5:00 a.m.<br />
<br />
Bus stops should be located to minimize walking<br />
distances, but stops should not be spaced closer than<br />
0.2 miles, unless required for pedestrian safety or as a<br />
result of geographic barriers.<br />
155
An area shall be considered served by transit if it is<br />
located within 0.5 miles of a fixed-route bus stop or<br />
within area served by Omnilink. The 0.5-mile distance<br />
should be measured using public roads, sidewalks<br />
and walkways.<br />
On weekdays, the minimum service frequency to<br />
provide coverage should be 60 minutes from the start<br />
of service in the morning to the end of service in the<br />
evening. Special peak-period-only tripper services and<br />
introductory pilot services may be excluded from this<br />
guideline.<br />
The span of service for transit should ensure that 90<br />
percent of trips identified in the following table could<br />
be completed at the times shown. Service should be<br />
provided to major activity centers to correspond to<br />
customary opening and closing times at each<br />
location.<br />
Figure IV-3: Span of Service Guidelines<br />
Earliest Arrival Time<br />
Service Weekdays Saturdays Sundays &<br />
Holidays<br />
From any point in East<br />
Valley TO Downtown<br />
06:00 07:00 07:00<br />
San Bernardino<br />
From any point in West<br />
Valley TO Ontario or<br />
Montclair<br />
06:00 07:00 07:00<br />
Latest Departure Time<br />
Service Weekdays Saturdays Sundays &<br />
Holidays<br />
From downtown San<br />
Bernardino TO any point<br />
in East Valley<br />
From Montclair or<br />
Ontario TO any point in<br />
West Valley<br />
21:00 21:00 19:00<br />
21:00 21:00 19:00<br />
The walking distance indicator and population and<br />
employment density information was evaluated using GIS<br />
software and data from the <strong>Omnitrans</strong> stop database, the<br />
U.S. Census, and employment data from SANBAG. Figures<br />
IV-4 and IV-5 show the walking-distance coverage for the<br />
Section IV<br />
Service Design Guidelines<br />
& Performance Standards<br />
156
East and West Valleys based on the schedule and routes in<br />
effect at the end of 2004. The red shaded areas show the<br />
areas where the population density is greater than 3.5<br />
households per acre. The purple shaded areas show the<br />
areas where the employment density is greater than 10 jobs<br />
per acre. The color of the blue shading is based on the<br />
Residential <strong>Transit</strong> Orientation Index, with the darkest colors<br />
representing the areas with the greatest likelihood of<br />
generating transit ridership. Areas that are not enclosed<br />
within the half-mile network buffer are also shown with the<br />
corresponding transit orientation and density index.<br />
Although it would be desirable to fully achieve the walking<br />
distance standard, there may be instances where the bus<br />
routing required to meet this standard would not meet the<br />
productivity targets. In such a case, service would not<br />
normally be provided.<br />
The span of service and frequency of service indicators can<br />
be measured using existing timetable information. Figures<br />
IV-6 through IV-17 show where the existing routes fail to<br />
meet the proposed span of service guidelines.<br />
<strong>Omnitrans</strong> currently has a policy that bus stops must be<br />
spaced at least 0.2 miles apart. An analysis was undertaken<br />
using data from the APC system to determine the number of<br />
stops on each route closer than 0.2 miles to an adjacent stop.<br />
The results of the analysis, shown in Figure IV-19, indicate<br />
that system-wide 13 percent of stops violate the current<br />
policy. On two routes, more than 30 percent of stops are<br />
spaced less than 0.2 miles apart. Any reduction in the<br />
number of stops must be done with care to ensure that the<br />
walking distance guideline is not violated. Reducing the<br />
number of stops should help improve or maintain running<br />
time on the routes with excessive stop locations.<br />
157
Figure IV-4
Figure IV-5
Figure IV-6
Figure IV-7
Figure IV-8
Figure IV-9
Figure IV-10
Figure IV-11
Figure IV-12
Figure IV-13
Figure IV-14
Figure IV-15
Figure IV-16
Figure IV-17
Route Description<br />
Figure IV-18: Stop Spacing Analysis, FY 2004<br />
Stops Less than<br />
1/5 Mile From<br />
Previous Stop<br />
Total<br />
Stops<br />
Percent<br />
of Total<br />
1 ARMC – San Bernardino – Del Rosa 20 97 21%<br />
2 Cal State – E St. – Loma Linda 30 118 25%<br />
3 Baseline – Highland (FL) Highland Ave – San Bernardino (SL) 7 74 9%<br />
4 Highland Ave – Highland (FL) Baseline – San Bernardino (SL) 3 74 4%<br />
5 San Bernardino – Del Rosa – Cal State 10 94 11%<br />
7 N. San Bernardino – Sierra – DT San Bernardino 26 96 27%<br />
8 San Bernardino – Mentone – Yucaipa 16 161 10%<br />
9 San Bernardino – Yucaipa 28 161 17%<br />
10 Fontana – Baseline – San Bernardino 18 108 17%<br />
11 San Bernardino – Muscoy – Cal State 1 73 1%<br />
14 Fontana – Foothill Blvd. – San Bernardino 29 89 33%<br />
15 Fontana– Rialto – San Bernardino – Highland – Redlands 22 176 13%<br />
19 Fontana – Colton – Redlands 28 173 16%<br />
20 Fontana Metrolink Via Hemlock – Kaiser Hosp. 11 56 20%<br />
22 N. Rialto – Riverside Ave. – ARMC 24 92 26%<br />
28 Southridge – Slover Ave – Kaiser Hosp. 4 50 8%<br />
29 Bloomington – Valley Blvd. – Kaiser Hosp. 6 42 14%<br />
30 N. Redlands Loop – Red Line 9 38 24%<br />
31 S. Redlands Loop – Blue Line 13 43 30%<br />
60 Ontario Convention Ctr – Chaffey College – Ontario Mills 4 98 4%<br />
61 Fontana – Ontario Mills – Pomona 19 174 11%<br />
62 Montclair – Ontario – Chino 3 73 4%<br />
63 Chino – Ontario – Upland 5 95 5%<br />
64 Montclair – N. Upland – Chaffey College 4 71 6%<br />
65<br />
65A Montclair – via Chino Ave – CIM<br />
4 89 4%<br />
65B Montclair – via Edison Ave – CIM<br />
66 Fontana – Foothill Blvd– Montclair 11 118 9%<br />
67 Ontario – Baseline – Fontana 4 114 4%<br />
68 Chino – Montclair – Chaffey College 14 142 10%<br />
70 Ontario – Creekside – Ontario Mills 6 85 7%<br />
71 Kaiser – Southridge – Rancho Cucamonga 9 141 6%<br />
75 Ontario – via Francis – Ontario Mills* 9 75 12%<br />
90 Montclair – Ontario – San Bernardino - Riverside 1 20 5%<br />
140 Fontana – Almeria – Chaffey College* 9 79 11%<br />
202 San Bernardino – T.E.A.M. House 6 16 38%<br />
Total 413 3205 13%<br />
Section IV<br />
Service Design Guidelines<br />
& Performance Standards<br />
172
Maximum Occupancy Objective<br />
The Maximum Occupancy Objective balances the fiscal need<br />
of <strong>Omnitrans</strong> to generate fare revenue with the need to<br />
provide a safe, comfortable and attractive customer<br />
environment on-board transit vehicles. The proposed<br />
occupancy objective is:<br />
To provide transit services with adequate capacity<br />
to provide a reasonable level of passenger comfort<br />
recognizing the vehicle types, trip lengths, speeds<br />
and markets being served.<br />
The purpose of the objective is to provide a means of<br />
ensuring that an appropriate level of service is provided for<br />
the level of ridership on each individual route. The objective<br />
should also ensure that overcrowding is not permitted to<br />
occur on a sustained or regular basis. Crowded conditions<br />
can quickly turn existing and potential customers away from<br />
public transportation. The guidelines for this indicator must<br />
be set at levels that provide comfortable traveling conditions<br />
appropriate for the brand of service and the market being<br />
served. The indicators and standards will be used to adjust<br />
service frequencies or vehicle size.<br />
Separate indicators are required for each type of bus service,<br />
reflecting their different operating speeds, trip lengths and<br />
markets served. Separate indicators and standards are<br />
required for peak periods, a shorter peak within the peak<br />
period, midday evening, night, and weekend periods.<br />
173
The recommended indicators are:<br />
90 percent of the time the number of standees at the<br />
maximum occupancy point should not exceed person<br />
density (in passengers per square feet) according to<br />
the following chart.<br />
Figure IV-19: Minimum Square Feet of Floor Space<br />
per Standing Passenger<br />
Type of Peak Period<br />
Service 30 Minute<br />
Off Peak<br />
60 Minute<br />
Avg.<br />
Average<br />
Bus 6 12<br />
Omnilink No standees No standees<br />
Express Bus No standees No standees<br />
<br />
Under normal operating conditions no customer<br />
should remain standing more than 15 minutes on one<br />
bus.<br />
Figure IV-20 shows the estimated number of seats and floor<br />
area available for each type of bus currently in the transit<br />
fleet. The data in Figure IV-21 also shows the maximum<br />
occupancy standard in passengers for each of the different<br />
types of buses in the fleet.<br />
The APCs cannot definitively determine the average standing<br />
time, however, on most routes they can identify potential<br />
standing time problems by using route profiles.<br />
Section IV<br />
Service Design Guidelines<br />
& Performance Standards<br />
174
Figure IV-20: Seats and Standing Areas by Bus Type<br />
Bus Type<br />
Areas for<br />
Seats Standing<br />
Seating<br />
with One<br />
Seating<br />
with Two<br />
in Sq. ft Wheelchair Wheelchairs<br />
40’ Low Floor<br />
Flyer*<br />
40’ High Floor<br />
RTS/Orion*<br />
40’ Suburban High<br />
Floor*<br />
30’ Low Floor Mid<br />
Size*<br />
*Estimate<br />
38 57.9 35 31<br />
40 55.9 36 32<br />
45 53.9 42 39<br />
25 37.9 22 18<br />
On some routes conformity with the standing time guideline<br />
could also be evaluated using a point observation system.<br />
This would be done by stationing observers prior to the<br />
maximum load point, and again 15 minutes downstream.<br />
An observation of people still standing downstream would<br />
be an indication of a standee time problem or at least a<br />
candidate for further, more detailed analysis. On services<br />
with guidelines that do not permit standees, it would be<br />
possible to evaluate the service using APC data. The key to<br />
the use of the standard is to identify potential problem<br />
routes and services. This will limit the requirement for more<br />
detailed examination of specific conditions on every route.<br />
The public will also easily understand the guideline.<br />
Figure IV-21: Maximum Passenger Occupancy by Bus Type,<br />
Time Period and Number of Wheelchairs<br />
Bus Type<br />
40’ Low<br />
Floor Flyer<br />
40’ High<br />
Floor<br />
RTS/Flexible<br />
40’<br />
Suburban<br />
High Floor<br />
30’ Low<br />
Floor<br />
Peak 30<br />
Minute<br />
Average<br />
Off Peak<br />
60<br />
Minute<br />
Average<br />
Peak 30<br />
Minute<br />
Average<br />
Off Peak<br />
60<br />
Minute<br />
Average<br />
Peak 30<br />
Minute<br />
Average<br />
Off Peak<br />
60<br />
Minute<br />
Average<br />
No Wheelchairs 1 Wheelchair 2 Wheelchairs<br />
48 43 45 40 41 36<br />
49 45 45 41 41 37<br />
45 45 42 42 39 39<br />
31 28 27 25 23 20<br />
175
Service Reliability Objective<br />
Service reliability is an important issue for <strong>Omnitrans</strong><br />
customers. Existing and potential customers expect bus<br />
services to reliably follow the published timetables. People<br />
depend on transit to allow them to meet their personal<br />
schedules and expect transfer connections to be performed<br />
as published.<br />
Schedule reliability standards are also important for transit<br />
management, as they provide a means of measuring and<br />
evaluating the provision of the service on the road. Failure<br />
to meet the guidelines serves as notice to management that<br />
corrective actions such as additional transit priority measures,<br />
revised schedules or work practices, or rerouting of services<br />
should be implemented.<br />
Reliability guidelines must balance the need to assure<br />
customers that timetables may be adhered to with the need<br />
to allow for operating flexibility due to traffic conditions and<br />
differences in transit vehicles (i.e. wheelchair lift or low floor<br />
buses) that could be assigned to the same route. During<br />
extreme weather conditions, power outages, road<br />
construction, or other abnormal traffic situations, it may be<br />
expected that delays and schedule disruptions occur.<br />
The objective must stress the importance of reliability, but<br />
also recognize that there are many factors outside the<br />
control of the transit operators and transit management,<br />
which may impact reliability:<br />
To provide Bus, Express Bus, and Omnilink services that<br />
reliably follow published schedules under normal operating<br />
conditions.<br />
The indicators for reliability used by the transit industry<br />
generally relate to schedule adherence, headway<br />
adherence, service consistency, transfer reliability, and<br />
missed trips.<br />
It is recommended that a single schedule adherence<br />
guideline be applied for bus services at all times of the day.<br />
Some arguments can be made for a stricter guideline during<br />
off peak periods to encourage ridership, compensate for the<br />
Section IV<br />
Service Design Guidelines<br />
& Performance Standards<br />
176
additional transfers that may be necessary and because of<br />
reduced roadway congestion. However, the impact of a<br />
stricter off peak standard would likely be imperceptible to<br />
customers.<br />
In any case, the transit system should be striving for 100<br />
percent schedule adherence at all times.<br />
The recommended indicators are:<br />
90 percent of bus trips on each route should depart<br />
each timepoint not more than five minutes later than<br />
the scheduled leave time, and should not depart early<br />
<br />
90 percent of bus trips should arrive at the terminus<br />
not more than five minutes late.<br />
Where the schedule adherence of a route as measured by<br />
the above indicators falls below the guideline, more detailed<br />
investigations of the route should be carried out to identify<br />
the sources of the problem. There is a broad range of<br />
potential actions that can be taken to improve service<br />
reliability and the most effective response may depend on<br />
the specific situation. In some cases, municipal actions such<br />
as provision of transit priority measures on municipal roads<br />
used by transit would significantly contribute to improved<br />
service reliability.<br />
Transportation Network Role Objective<br />
The Transportation Network Role objective was conceived to<br />
provide an overall strategic direction to the development of<br />
transit services.<br />
To ensure that public transit provides an attractive and<br />
competitive alternative to the private automobile.<br />
Operational speed for buses is important to customers who<br />
are almost always interested in faster travel times. It is also<br />
critical to the transit system since slower speeds translate<br />
directly into higher operating costs. An indicator that<br />
measures transit operating speeds would be able to track<br />
degradations in travel time. In response to such information,<br />
<strong>Omnitrans</strong> could seek, and make the case for transit priority<br />
measures and roadway geometric improvements or changes<br />
in parking regulations. If these responses are not possible,<br />
177
the planners and service designers may have to act by<br />
adding more buses, or changing the schedules or routes.<br />
A simple means of achieving this objective would be to<br />
monitor changes in travel speeds for each type of service for<br />
specific routes. This would allow <strong>Omnitrans</strong> to judge year-toyear<br />
performance, and would help identify areas where<br />
schedule or route changes, or new priority measures may be<br />
necessary. The indicator would be:<br />
The average actual running time on each route<br />
should be maintained or improved as<br />
measured on a yearly basis.<br />
This indicator does not require any comparative data from<br />
other modes (i.e. car travel time) and as a consequence is<br />
easy to implement. Actual speed can be determined from the<br />
APC service-monitoring program. The data collected from<br />
the evaluation process would be used to track individual<br />
route performance against similar routes. In addition, the<br />
data could also be used to track the year-to-year changes on<br />
individual routes.<br />
New Service Warrants<br />
Service warrants are required to provide direction on when<br />
new services should be initiated. <strong>Omnitrans</strong> serves a diverse<br />
region and some flexibility may be required in adapting the<br />
proposed warrants to every possible situation. The warrants<br />
should be viewed as guidelines, rather than strict rules.<br />
Fixed Route Bus<br />
Fixed-route bus services are operated using standard transit<br />
buses or trolleys of at least 30 feet in length. This service is<br />
usually associated with routes that make frequent stops, but<br />
can also include limited stop services on radial and crosstown<br />
routes.<br />
Warrants are required to determine when bus service should<br />
be introduced in new residential, industrial, commercial and<br />
recreational developments. Changes to existing bus routes<br />
would be based on the service evaluation criteria included as<br />
part of the Service Design Guidelines.<br />
There are two main approaches to new service warrants<br />
commonly in use in North America. The first requires a<br />
Section IV<br />
Service Design Guidelines<br />
& Performance Standards<br />
178
projection or forecast of ridership. The forecast is either used<br />
directly to determine the timing of a new service or through<br />
surrogates such as riders per hour or cost recovery that are<br />
derived from the ridership forecast. Ridership forecasting on<br />
a micro-level can be extremely difficult and unreliable.<br />
An alternative approach would be to use trip generation as<br />
an evaluation factor. Trip generations are projected using<br />
generally accepted standards and are available for all types<br />
of land use, including residential, commercial, recreational<br />
and industrial areas. There are trip generation tables that<br />
have been produced by both national and state authorities.<br />
The tables have generally been developed as a result of<br />
many years of data collection and verification. Trip<br />
generation data is usually expressed in car trips, however<br />
total person-trips can be developed by making some<br />
occupancy assumptions. Trip generations are a form of<br />
forecast based on a broad knowledge base derived from<br />
observed behavior.<br />
The recommended warrant for new local bus services are<br />
based, in part, on the trip generation methodology. This<br />
methodology has the advantage of using data that has<br />
already been prepared for and accepted by the municipal<br />
authorities, is available for all land uses, and incorporates<br />
elements of both population and forecasting approaches.<br />
In addition to the forecast trip generation volume for the<br />
development, it is recommended that several other factors<br />
related to the physical design of the development be<br />
considered as part of the service warrants. For local bus<br />
services to operate efficiently and safely in a neighborhood,<br />
the road system must meet minimum geometric design<br />
requirements for bus operations and provide a relatively<br />
direct routing for the service. Where the bus route is to<br />
terminate within the development, adequate bus terminus<br />
facilities (e.g. street space or a bus loop for vehicle layovers)<br />
must be available. Finally, adequate pedestrian facilities (e.g.<br />
sidewalks and direct pedestrian routes to bus stops) and<br />
amenities at bus stops (e.g. shelters and lighting) are<br />
required to ensure fast and safe access by customers to the<br />
bus service.<br />
179
New services to be provided to areas beyond 0.5 miles of an<br />
existing bus stop when all of the following conditions are<br />
met:<br />
Minimum density of 3.5 households per acres or 10<br />
jobs per acre as measured over a minimum area of 25<br />
acres.<br />
Road and pedestrian access system that provides for<br />
safe Access and efficient operation of transit service.<br />
Minimum of 1,000 total person trips generated for all<br />
vehicle modes per service hour as measured from end<br />
to end of proposed bus route.<br />
Trip generation to be based on standard trip<br />
generation methodology and procedures in common<br />
use in Southern California.<br />
Service maybe extended to additional time periods if<br />
the route is able to sustain ridership that is 75 percent<br />
of the minimum productivity standard during the first<br />
year of service.<br />
The service must meet the full productivity guideline within<br />
2-3 years of the start of service. If, after 2-3 years, the service<br />
is unable to meet the productivity standard, alternative<br />
approaches such as an Omnilink service maybe considered.<br />
If the service being provided is changed significantly, the<br />
probationary period may be extended.<br />
<strong>Omnitrans</strong> may also consider the impact on potential<br />
ridership of other factors such as parking management or<br />
travel demand management strategies that may be in effect.<br />
Omnilink<br />
Omnilink is the name applied to services operated with<br />
vehicles smaller than the conventional 30-foot long transit<br />
bus. This could include a range of options from mini-buses<br />
to shared-ride vans. These services would be implemented<br />
in areas where conventional buses are too expensive and<br />
inefficient to operate.<br />
New Omnilink service may be warranted in areas beyond 0.5<br />
miles of an existing bus stop when the following conditions<br />
are met:<br />
Minimum density of 3.5 households per acre or 10<br />
jobs per acre measured over a minimum area of 25<br />
acres.<br />
Section IV<br />
Service Design Guidelines<br />
& Performance Standards<br />
180
Road and pedestrian system that provides for safe<br />
access and efficient operation of Omnilink service.<br />
Projection of not less than 500 total person trips<br />
generated for all vehicle modes per service hour as<br />
measured from the transfer point to the end of the<br />
route for a typical fixed route operation.<br />
Trip generation to be based on data provided in traffic<br />
impact studies prepared by or for municipalities for<br />
subdivision or development approval.<br />
Service may be extended to additional time periods if<br />
the route is able to sustain ridership that is 75 percent<br />
of the minimum productivity standard during the first<br />
two years of service.<br />
Like the fixed-route services, the service must meet the full<br />
productivity guideline within 2-3 years of the start of service.<br />
If after this time frame the service appears unlikely to meet<br />
the productivity standard, alternative approaches should be<br />
considered. If the service type is changed, the probationary<br />
period may be extended.<br />
Express Bus<br />
Express Bus describes services operated on highways<br />
between municipal centers (e.g. Route 90 from Montclair-San<br />
Bernardino-Riverside). The services utilize suburban style<br />
coaches.<br />
Express Bus service may be warranted when all of the<br />
following conditions are met:<br />
Express Bus service should be considered if the travel<br />
time between municipal centers by local bus services<br />
is more than 30 minutes.<br />
<br />
Express Bus services should incorporate a minimum of<br />
15 minutes of non-stop or limited stop service.<br />
Similar to fixed-route and Omnilink services, New Express Bus<br />
services should meet the minimum productivity guidelines<br />
within 2-3 years of implementation.<br />
181
Section IV<br />
Service Design Guidelines<br />
& Performance Standards<br />
182<br />
Notes:
Section V: Service <strong>Plan</strong><br />
There came a time when<br />
the risk to remain tight in<br />
the bud was more painful<br />
than the risk it took to<br />
blossom.<br />
- Anais Nin, writer
Service <strong>Plan</strong><br />
Three scenarios were developed for how <strong>Omnitrans</strong> service<br />
could be improved over the next six-year period (FY<strong>2006</strong>-<br />
FY<strong>2011</strong>). Current financial forecasts show constraints in<br />
funding-revenue sources for <strong>Omnitrans</strong>. Thus, a financially<br />
constrained scenario is recommended for implementation.<br />
Existing Conditions Overview<br />
<strong>Omnitrans</strong> currently provides about 685,624 hours of fixed<br />
route service annually with a peak bus requirement of 146<br />
buses. The buses operate a total of about 9,320,235 miles<br />
annually. This operation includes seventeen buses that are<br />
operated by a contractor. The total fleet includes 174 active<br />
buses of which 28 are spares. This is a spare ratio of 17%.<br />
The East Valley garage operates approximately 52 percent of<br />
<strong>Omnitrans</strong> annual service hours and miles - a total of<br />
356,024 hours and 4,557,980 miles.<br />
The West Valley garage operates about 36 percent of<br />
<strong>Omnitrans</strong> annual service hours and miles – 245,215 hours<br />
and 3,285,345 miles.<br />
Contracted fixed-route services routes 7, 8, 9, 30 (Red Line),<br />
31 (Blue Line), & 90 make up about 12 percent of the annual<br />
service hours and miles – 84,385 vehicle-hours and<br />
1,476,908 vehicle-miles.<br />
Annual weekday service represents more than 81 percent of<br />
the total hours and miles. Saturday service is more than 11<br />
percent of annual operating hours and miles and Sundays<br />
are around 8 percent.<br />
Figures V-1 and V-2 show the existing FY 2005 service hours<br />
and miles across the system, broken down by route and by<br />
division.<br />
183
Section V: Service <strong>Plan</strong><br />
184<br />
Figure V-1: Existing FY 2005 Bus Service Hours by Route and Division<br />
Weekday Hours Saturday Hours Sunday Hours Annual<br />
Route Non- Daily # of Non- Daily # of Non- Daily # of Revenue Non<br />
Revenue Revenue Total Bus Rev Rev Total Bus Rev Rev Total Bus Hours Revenue<br />
1 113.25 3.13 116.38 7 81.90 3.22 85.12 7 35.68 1.53 37.21 3 35,133.18 1,046.57 36,179.75<br />
2 124.95 6.00 130.95 10 89.55 4.50 94.05 8 70.90 4.12 75.02 8 40,330.50 1,983.12 42,313.62<br />
3 92.03 2.20 94.23 6 65.92 3.52 69.44 6 63.57 2.47 66.04 6 30,281.81 869.57 31,151.38<br />
4 85.08 2.73 87.81 6 65.00 4.07 69.07 6 63.42 2.73 66.15 6 28,435.06 1,047.07 29,482.13<br />
5 64.97 1.98 66.95 4 45.88 2.12 48.00 4 23.40 1.13 24.53 2 20,249.66 674.47 20,924.13<br />
10 52.33 1.73 54.06 4 25.67 1.00 26.67 2 22.67 0.73 23.40 2 15,940.81 533.57 16,474.38<br />
11 66.67 1.43 68.10 4 44.67 2.10 46.77 4 22.83 0.97 23.80 2 20,598.69 523.41 21,122.10<br />
14 102.35 3.90 106.25 9 78.42 2.97 81.39 7 63.92 2.47 66.39 6 33,587.22 1,280.67 34,867.89<br />
15 122.62 3.53 126.15 8 92.93 4.47 97.40 8 88.53 2.95 91.48 8 40,797.49 1,284.69 42,082.18<br />
19 102.12 4.92 107.04 7 73.92 4.72 78.64 7 42.33 2.82 45.15 4 32,201.79 1,649.18 33,850.97<br />
20 28.83 1.53 30.36 2 22.83 1.53 24.36 2 21.83 1.53 23.36 2 9,692.97 549.27 10,242.24<br />
22 89.80 2.53 92.33 6 43.62 2.03 45.65 4 24.38 0.80 25.18 2 26,592.78 795.04 27,387.82<br />
28 11.92 0.93 12.85 1 NoService NoService NoService NoService NoService NoService NoService NoService 3,075.36 239.94 3,315.30<br />
29 11.83 0.77 12.60 1 10.83 0.77 11.60 1 NoService NoService NoService NoService 3,593.64 237.16 3,830.80<br />
140 1.53 1.35 2.88 0 NoService NoService NoService NoService NoService NoService NoService NoService 394.74 348.30 743.04<br />
202 0.55 0.92 1.47 1 NoService NoService NoService NoService NoService NoService NoService NoService 141.90 237.36 379.26<br />
CityLink 4.50 2.00 6.50 1 NoService NoService NoService NoService NoService NoService NoService NoService 1,161.00 516.00 1,677.00<br />
EV Service 1,075.33 41.58 1,116.91 77 741.14 37.02 778.16 66 543.46 24.25 567.71 51 342,208.60 13,815.39 356,023.99<br />
60 50.65 1.90 52.55 3 34.17 1.75 35.92 3 34.22 1.75 35.97 3 16,521.42 666.95 17,188.37<br />
61 199.28 10.03 209.31 14 93.00 6.13 99.13 8 91.00 5.90 96.90 8 60,705.24 3,195.14 63,900.38<br />
62 47.87 1.07 48.94 4 23.77 0.73 24.50 2 23.77 0.57 24.34 2 14,751.23 341.63 15,092.86<br />
63 55.47 2.08 57.55 4 23.73 1.07 24.80 2 24.70 1.10 25.80 2 16,757.46 646.24 17,403.70<br />
64 25.67 1.00 26.67 2 25.67 1.00 26.67 2 23.67 1.00 24.67 2 9,113.53 359.00 9,472.53<br />
65 69.10 2.00 71.10 4 25.60 1.25 26.85 2 23.60 1.00 24.60 2 20,311.40 629.50 20,940.90<br />
66 76.28 2.98 79.26 5 55.55 2.50 58.05 5 32.88 1.48 34.36 3 24,134.62 969.32 25,103.94<br />
67 41.70 2.00 43.70 3 35.75 2.00 37.75 3 35.75 2.00 37.75 3 12,546.10 616.00 13,162.10<br />
68 110.55 4.83 115.38 7 48.83 2.67 51.50 4 42.90 2.80 45.70 4 33,151.30 1,522.44 34,673.74<br />
70 26.92 1.08 28.00 3 11.83 1.00 12.83 2 11.83 1.00 12.83 2 8,140.19 379.90 8,520.09<br />
71 48.95 2.75 51.70 3 38.53 2.83 41.36 3 34.03 2.75 36.78 3 16,291.13 991.25 17,282.38<br />
75 8.59 1.00 9.59 0 NoService NoService NoService NoService NoService NoService NoService NoService 2,216.22 258.00 2,474.22<br />
WV Service 761.03 32.72 793.75 52 416.43 22.93 439.36 36 378.35 21.35 399.70 34 234,639.84 10,575.37 245,215.21<br />
EV/WV<br />
Service<br />
Total<br />
1,836.36 74.30 1,910.66 129 1,157.57 59.95 1,217.52 102 921.81 45.60 967.41 85 576,848.44 24,390.76 601,239.20<br />
7 40.35 3.42 43.77 3 22.00 2.33 24.33 2 20.42 1.92 22.34 2 12,551.72 1,096.78 13,648.50<br />
8 44.33 3.58 47.91 3 34.58 3.75 38.33 3 14.90 1.83 16.73 1 13,926.04 1,204.47 15,130.51<br />
9 46.00 3.18 49.18 3 37.22 3.53 40.75 3 16.23 1.00 17.23 2 14,556.73 1,047.94 15,604.67<br />
30 15.30 1.00 16.30 1 11.92 1.00 12.92 1 10.30 1.00 11.30 1 5,068.70 359.00 5,427.70<br />
31 12.92 1.00 13.92 1 11.30 1.00 12.30 1 9.53 1.00 10.53 1 4,384.39 359.00 4,743.39<br />
90 85.93 4.67 90.60 6 75.37 4.07 79.44 5 45.53 3.17 48.70 4 28,260.47 1,570.03 29,830.50<br />
Contract<br />
Service<br />
Total<br />
All Services<br />
Total<br />
244.83 16.85 261.68 17 192.39 15.68 208.07 15 116.91 9.92 126.83 11 78,748.05 5,637.22 84,385.27<br />
2,081.19 91.15 2,172.34 146 1,349.96 75.63 1,425.59 117 1,038.72 55.52 1,094.24 96 655,596.49 30,027.98 685,624.47<br />
Total
Figure V-2: Existing FY 2005 Bus Service Miles by Route and Division<br />
Weekday Saturday Sunday Annual<br />
Revenue<br />
Miles<br />
Non-<br />
Revenue<br />
Daily<br />
Total<br />
Revenue<br />
Miles<br />
Non-<br />
Revenue<br />
Daily Total<br />
Revenue<br />
Miles<br />
Non-<br />
Revenue<br />
Daily Total<br />
Revenue<br />
Miles<br />
Non-<br />
Revenue<br />
Total<br />
1 1,241.25 67.74 1,308.99 905.08 70.71 975.79 455.88 34.14 490.02 388,746.38 22,753.56 411,499.94<br />
2 1,479.94 137.74 1,617.68 1,212.31 110.91 1,323.22 944.41 100.63 1,045.04 490,604.93 46,214.55 536,819.48<br />
3 1,170.24 52.53 1,222.77 843.68 89.62 933.30 800.62 71.48 872.10 384,937.54 21,679.22 406,616.76<br />
4 1,077.24 70.32 1,147.56 825.26 113.14 938.40 806.42 67.27 873.69 360,318.34 27,230.33 387,548.67<br />
5 795.96 43.69 839.65 566.69 47.92 614.61 289.44 26.58 316.02 248,453.62 15,023.60 263,477.22<br />
10 690.18 32.82 723.00 338.78 19.16 357.94 299.28 13.65 312.93 210,268.72 10,121.71 220,390.43<br />
11 761.37 28.63 790.00 511.51 45.09 556.60 261.48 20.53 282.01 235,344.44 10,688.07 246,032.51<br />
14 1,117.63 68.75 1,186.38 856.29 55.80 912.09 809.30 46.17 855.47 372,437.34 22,882.17 395,319.51<br />
15 1,601.09 91.43 1,692.52 1,208.96 132.53 1,341.49 1,152.20 80.87 1,233.07 532,291.42 34,339.81 566,631.23<br />
19 1,250.18 147.25 1,397.43 909.78 135.03 1,044.81 465.52 53.45 518.97 391,776.96 47,467.95 439,244.91<br />
20 351.77 39.14 390.91 278.99 39.14 318.13 266.86 39.14 306.00 118,316.02 14,051.26 132,367.28<br />
22 1,354.26 54.44 1,408.70 720.72 47.34 768.06 360.03 23.28 383.31 403,796.61 17,599.80 421,396.41<br />
28 171.12 19.57 190.69 No Service No Service No Service No Service No Service No Service 44,148.96 5,049.06 49,198.02<br />
29 138.36 19.57 157.93 126.83 19.57 146.40 No Service No Service No Service 42,038.38 6,027.56 48,065.94<br />
140 30.11 62.04 92.15 No Service No Service No Service No Service No Service No Service 7,768.38 16,006.32 23,774.70<br />
202 3.02 10.34 13.36 No Service No Service No Service No Service No Service No Service 779.16 2,667.72 3,446.88<br />
CityLink 19.92 3.92 23.84 5,139.36 1,011.36 6,150.72<br />
EV Service 13,253.64 949.92 14,203.56 9,304.88 925.96 10,230.84 6,911.44 577.19 7,488.63 4,237,166.56 320,814.05 4,557,980.61<br />
60 583.44 62.83 646.27 395.34 47.79 443.13 395.34 47.79 443.13 190,456.86 21,036.93 211,493.79<br />
61 2,591.94 290.76 2,882.70 1,081.92 189.44 1,271.36 1,059.22 175.78 1,235.00 776,836.74 93,452.86 870,289.60<br />
62 598.29 18.69 616.98 286.56 12.30 298.86 286.56 12.30 298.86 183,301.38 6,064.32 189,365.70<br />
63 718.41 40.87 759.28 308.28 20.06 328.34 320.17 20.77 340.94 217,092.45 12,606.73 229,699.18<br />
64 372.97 30.08 403.05 372.97 30.08 403.05 344.28 30.08 374.36 132,433.04 10,798.72 143,231.76<br />
65 903.00 23.62 926.62 335.40 19.97 355.37 309.60 19.34 328.94 265,533.60 8,078.80 273,612.40<br />
66 1,076.06 97.41 1,173.47 786.14 79.44 865.58 393.68 58.15 451.83 337,008.16 32,069.43 369,077.59<br />
67 515.84 53.73 569.57 440.52 59.23 499.75 No Service No Service No Service 155,112.72 16,823.84 171,936.56<br />
68 1,221.74 132.93 1,354.67 500.10 67.05 567.15 440.33 75.96 516.29 362,670.75 41,522.40 404,193.15<br />
70 376.88 14.00 390.88 165.62 14.00 179.62 165.62 14.00 179.62 113,962.66 5,026.00 118,988.66<br />
75 120.26 14.00 134.26 No Service No Service No Service No Service No Service No Service 31,027.08 3,612.00 34,639.08<br />
71 709.11 88.10 797.21 558.35 110.01 668.36 493.49 89.26 582.75 236,035.87 32,782.56 268,818.43<br />
WV Service 9,787.94 867.02 10,654.96 5,231.20 649.37 5,880.57 4,208.29 543.43 4,751.72 3,001,471.31 283,874.59 3,285,345.90<br />
EV/WV Service<br />
Total<br />
23,041.58 1,816.94 24,858.52 14,536.08 1,575.33 16,111.41 11,119.73 1,120.62 12,240.35 7,238,637.87 604,688.64 7,843,326.51<br />
90 2,080.70 9.70 2,090.40 1,997.20 84.20 2,081.40 1131.00 62.40 1193.40 694,361.60 9,895.00 704,256.60<br />
7 467.84 36.70 504.54 275.60 28.60 304.20 252.50 22.30 274.80 147,360.22 12,035.90 159,396.12<br />
8 641.10 93.30 734.40 506.10 93.30 599.40 225.00 3.80 228.80 202,183.80 28,930.20 231,114.00<br />
9 878.80 69.30 948.10 546.90 107.90 654.80 240.50 26.90 267.40 266,340.90 24,646.30 290,987.20<br />
30 107.80 11.10 118.90 89.80 33.30 123.10 89.80 22.20 112.00 36,882.20 5,661.00 42,543.20<br />
31 124.00 11.10 135.10 113.70 33.30 147.00 103.40 22.20 125.60 42,950.40 5,661.00 48,611.40<br />
Contract Total 4,300.24 231.20 4,531.44 3,529.30 380.60 3,909.90 2,042.20 159.80 2,202.00 1,390,079.12 86,829.40 1,476,908.52<br />
Total Existing 27,341.82 2,048.14 29,389.96 18,065.38 1,955.93 20,021.31 13,161.93 1,280.42 14,442.35 8,628,716.99 691,518.04 9,320,235.03<br />
185
Financially Constrained Scenario<br />
Service <strong>Plan</strong><br />
The Financially Constrained scenario assumes little growth in<br />
funding revenue sources for <strong>Omnitrans</strong> over the next six<br />
years. The service plan for this scenario focuses on<br />
improving efficiencies and service effectiveness across the<br />
system, while maintaining and, in some cases, increasing<br />
coverage and service frequency.<br />
A complete route-by-route review was carried out based on<br />
four service standards:<br />
Productivity<br />
Span of service and coverage<br />
Walking distance<br />
Duplication of service<br />
Selected routes were modified to resolve customer and<br />
operational issues and to raise the potential for ridership<br />
increase. In January 2004, <strong>Omnitrans</strong> underwent a major<br />
system restructuring that included the addition of four new<br />
routes (28, 64, 75 and 140) and complete restructuring of<br />
routes (8, 11, 29, 30, 31, 60, 67, 71), all of which were low in<br />
productivity and seat utilization. The proposed changes for<br />
FY <strong>2006</strong> take into account the recently redesigned routes<br />
and the temporal need of these new/reformed routes to<br />
mature and perform up to standards; therefore, proposed<br />
changes for the upcoming financially constrained context<br />
are moderate.<br />
Most changes were concentrated on the less productive<br />
routes according to the performance analysis presented in<br />
Section III – Existing Conditions and Services. Routes that<br />
had low boardings, low seat utilization, or operational<br />
setbacks (e.g. Routes 8, 9, 20, & 28) were adjusted for<br />
improved performance while routes that had good<br />
performance were slightly changed or left untouched (e.g.<br />
Routes 1, 2, 3, 4, & 14).<br />
Figures V-3 and V-4 show the service plan with modified<br />
routes to be implemented in FY <strong>2006</strong>. Routes are colored<br />
according to their service frequency.<br />
Section V<br />
Service <strong>Plan</strong><br />
186
The East Valley conserves a core of north-south and eastwest<br />
routes with 15-minute service in more densely<br />
developed corridors, complemented by half-hourly services<br />
in consolidated urban areas and hourly services on lower<br />
density and peripheral areas. The West Valley features a<br />
core of 15 minute and half-hourly services in consolidated<br />
urban areas and complementary/feeder hourly services in<br />
lower density and newly developed areas.<br />
Figures V-5 through V-7 show service frequencies by route<br />
and by service day.<br />
187
Section V<br />
Service <strong>Plan</strong><br />
188<br />
This page intentionally left blank.
189<br />
Figure V-3<br />
189
Section V<br />
Service <strong>Plan</strong><br />
190<br />
Section V<br />
Service <strong>Plan</strong><br />
190<br />
Figure V-4
Figure V-5: Weekday FY <strong>2006</strong> Service Frequency by Route (in minutes)<br />
AM Peak Base PM Peak Evening Night Service<br />
Route Route Name to 8:29 8:30 - 2:29 2:30 - 17:59 18:00 - 21:59 22:00 to Hours<br />
1 ARMC - San Bernardino - Del Rosa 30 - 15 30 - 15 30 - 15 30 - 15 30 4:38 - 22:49<br />
2 Cal State - E Street - Loma Linda 85/30 15 15 30 30 - 60 4:25 - 22:40<br />
3 Baseline - Highland - San Bernardino 60 - 15 15 15 15 - 30 30 4:28 - 23:11<br />
4 Baseline - Highland - San Bernardino 60 - 15 15 15 15 - 30 30 4:33 - 22:40<br />
5 San Bernardino - Del Rosa - Cal State 30 30 30 30 30 5:28 - 22:40<br />
10 Fontana - Baseline - San Bernardino 60 - 30 30 30 30 No Service 5:35 - 20:25<br />
11 San Bernardino - Muscoy - Cal State 30 30 30 30 30 5:25 - 22:50<br />
14 Fontana - Foothill - San Bernardino 50 - 15 15 15 15 - 30 60 3:55 - 22:57<br />
14L San Bernardino - Fontana Limited Stop Service LS LS No Service No Service No Service 5:00 - 9:00<br />
15 Fontana - San Bndo/Highland - Redlands 30 30 30 30 30 5:08 - 22:39<br />
19 Redlands - Colton - Fontana 30 30 30 30 - 60 60 4:50 - 22:25<br />
20 Fontana Metrolink - Via Hemlock - Kaiser 30 30 30 30 No Service 5:02 - 20:27<br />
22 North Rialto - Riverside Ave - ARMC 30 - 15 15 15 15 - 30 No Service 4:48 - 22:14<br />
28 Southridge - Slover Ave - Kaiser 60 60 60 60 No Service 6:02 - 18:57<br />
29 Bloomington - Valley Blvd - Kaiser 60 60 60 60 No Service 6:45 - 18:35<br />
60 Ontario Conv Cntr - Chaffey College - Ont Mills 60 60 60 60 60 4:40 - 22:26<br />
61 Fontana - Ontario Mills - Pomona 30 - 15 15 15 15 15 - 30 4:20 - 23:21<br />
62 Montclair - Ontario - Chino 30 - 60 30 - 60 30 - 60 30 - 60 No Service 5:23 - 21:41<br />
63 Chino - Ontario - Upland 60 - 30 30 30 30 - 60 No Service 5:52 - 22:15<br />
64 Montclair - N Upland - Chaffey College 60 60 60 60 No Service 7:00 - 19:50<br />
65 Montclair - Chino Hills 30 30 30 30 30 4:50 - 22:44<br />
66 Fontana - Foothill - Montclair 15 15 15 15 No Service 4:31 - 22:38<br />
67 Ontario - Baseline - Fontana 60 60 60 60 No Service 5:30 - 20:25<br />
68 Chino - Montclair - Chaffey College 60 - 30 30 30 30 - 60 60 4:49 - 22:55<br />
70 Ontario - Creekside - Ontario Mills 60 60 60 60 No Service 6:34 - 18:47<br />
71 Kaiser - South Ridge - Rancho Cucamonga 60 60 60 60 60 5:06 - 22:27<br />
75<br />
140<br />
202<br />
CityLink<br />
Ontario - Via Francis - Ontario Mills 60 60 60 No Service No Service<br />
Fontana - Chaffey College Tripper Tripper Tripper No Service No Service<br />
San Bernardino - T.E.A.M. House<br />
No<br />
Service<br />
Tripper Tripper No Service No Service<br />
Santa Fe Depot - Downtown San Bernardino Feeder No Service Feeder Feeder No Service<br />
6:05 - 9:58<br />
15:05 - 18:57<br />
8:05 - 8:51<br />
15:23 - 16:09<br />
8:40 - 8:55 14:30<br />
- 14:48<br />
6:10,6:50,7:45<br />
16:00,17:00,18:10<br />
7 N. San Bernardino - Sierra Way - San Bndo 60 - 30 30 - 60 30 - 60 30 - 60 No Service 4:53 - 19:52<br />
8 San Bernardino - Mentone - Yucaipa 60 60 60 60 No Service 4:30 - 20:30<br />
9 San Bernardino - Redlands - Yucaipa 60 60 60 60 No Service 4:33 - 22:48<br />
30 Redlands Trolley (Red Line) 60 60 60 60 No Service 6:07 - 21:25<br />
31 Redlands Trolley (Blue Line) 60 60 60 60 No Service 7:00 - 19:55<br />
90 Inland Empire Connection 45 - 50 45 - 60 35 - 45 35 - 60 60 4:40 - 22:25<br />
*Highlights indicate improved frequency/service span.<br />
191
Section V<br />
Service <strong>Plan</strong><br />
192<br />
Figure V-6: Saturday FY <strong>2006</strong> Service Frequency by Route (in minutes)<br />
AM Peak Base PM Peak Evening Night Service<br />
Route Route Name to 8:29 8:30 - 2:29 2:30 - 17:59 18:00 - 21:59 22:00 to Hours<br />
1 ARMC - San Bernardino - Del Rosa 30 - 15 30 - 15 30 - 15 30 - 15 No Service 6:38 - 19:28<br />
2 Cal State - E Street - Loma Linda 15 15 15 15 No Service 6:35 - 19:15<br />
3 Baseline - Highland - San Bernardino 30 - 15 15 15 15 No Service 6:09 - 19:19<br />
4 Baseline - Highland - San Bernardino 30 - 15 15 15 15 No Service 6:33 - 19:27<br />
5 San Bernardino - Del Rosa - Cal State 30 30 30 30 No Service 6:28 - 19:10<br />
10 Fontana - Baseline - San Bernardino 60 60 60 60 No Service 6:35 - 19:25<br />
11 San Bernardino - Muscoy - Cal State 30 30 30 30 No Service 6:55 - 19:20<br />
14 Fontana - Foothill - San Bernardino 30 - 15 15 15 30 - 40 No Service 5:30 - 22:35<br />
15 Fonana - San Bndo/Highland - Redlands 30 30 30 30 No Service 6:38 - 19:55<br />
19 Redlands - Colton - Fontana 30 30 30 30 No Service 5:20 - 19:05<br />
20 Fontana Metrolink - Via Hemlock - Kaiser 30 30 30 30 No Service 6:32 - 18:27<br />
22 North Rialto - Riverside Ave - ARMC 20 20 20 20 No Service 7:40 - 19:14<br />
28 Southridge - Slover Ave - Kaiser No Service No Service No Service No Service No Service na<br />
29 Bloomington - Valley Blvd - Kaiser 60 60 60 60 No Service 7:45 - 18:35<br />
60 Ontario Conv Cntr - Chaffey College - Ont Mills 60 60 60 60 No Service 6:45 - 19:39<br />
61 Fontana - Ontario Mills - Pomona 15 15 15 15 No Service 5:40 - 22:48<br />
62 Montclair - Ontario - Chino 60 60 60 60 No Service 6:50 - 18:44<br />
63 Chino - Ontario - Upland 60 60 60 60 No Service 6:52 - 18:46<br />
64 Montclair - N Upland - Chaffey College 60 60 60 60 No Service 7:00 - 19:50<br />
65 Montclair - Chino Hills 60 60 60 60 No Service 6:20 - 19:15<br />
66 Fontana - Foothill - Montclair 40 - 30 30 30 30 No Service 5:43 – 22:23<br />
67 Ontario - Baseline - Fontana 60 60 60 60 No Service 6:35 - 19:30<br />
68 Chino - Montclair - Chaffey College 60 60 60 60 No Service 6:10 - 19:52<br />
70 Ontario - Creekside - Ontario Mills 60 60 60 60 No Service 6:45 - 18:37<br />
71 Kaiser - South Ridge - Rancho Cucamonga 60 60 60 60 No Service 6:35 - 20:28<br />
75 Ontario - Via Francis - Ontario Mills No Service No Service No Service No Service No Service na<br />
140 Fontana - Chaffey College No Service No Service No Service No Service No Service na<br />
202 San Bernardino - T.E.A.M. House No Service No Service No Service No Service No Service na<br />
7 N. San Bernardino - Sierra Way - San Bndo 60 60 60 60 No Service 6:50 - 18:50<br />
8 San Bernardino - Mentone - Yucaipa 60 60 60 60 No Service 5:40 - 19:20<br />
9 San Bernardino - Redlands - Yucaipa 60 60 60 60 No Service 5:33 - 22:28<br />
30 Redlands Trolley (Red Line) 60 60 60 60 No Service 7:30 - 19:25<br />
31 Redlands Trolley (Blue Line) 60 60 60 60 No Service 7:37 - 18:55<br />
90 Inland Empire Connection 50 - 45 45 45 45 - 60 60 5:30 - 22:40<br />
*Highlights indicate improved frequency/service span.
Figure V-7: Sunday FY <strong>2006</strong> Service Frequency by Route (in minutes)<br />
AM Peak Base PM Peak Evening Night Service<br />
Route Route Name to 8:29 8:30 - 2:29 2:30 - 17:59 18:00 - 21:59 22:00 to Hours<br />
1 ARMC - San Bernardino - Del Rosa 60 - 30 60 - 30 60 - 30 60 - 30 No Service 6:32 - 19:25<br />
2 Cal State - E Street - Loma Linda 60 60 - 15 15 30 No Service 6:56 - 19:03<br />
3 Baseline - Highland - San Bernardino 45 - 30 15 15 30 No Service 6:09 - 19:15<br />
4 Baseline - Highland - San Bernardino 30 - 15 15 15 30 No Service 6:33 - 19:12<br />
5 San Bernardino - Del Rosa - Cal State 60 60 60 60 No Service 6:38 - 19:20<br />
10 Fontana - Baseline - San Bernardino 60 60 60 60 No Service 7:35 - 19:25<br />
11 San Bernardino - Muscoy - Cal State 60 60 60 60 No Service 7:25 - 19:20<br />
14 Fontana - Foothill - San Bernardino 30 - 15 15 15 15 - 30 No Service 6:17 - 19:10<br />
15 Fonana - San Bndo/Highland - Redlands 30 30 30 30 No Service 7:00 - 19:30<br />
19 Redlands - Colton - Fontana 60 60 60 60 No Service 5:15 - 18:50<br />
20 Fontana Metrolink - Via Hemlock - Kaiser 30 30 30 No Service No Service 6:32 - 17:57<br />
22 North Rialto - Riverside Ave - ARMC 45 45 45 45 No Service 7:00 - 19:36<br />
28 Southridge - Slover Ave - Kaiser No Service No Service No Service No Service No Service na<br />
29 Bloomington - Valley Blvd - Kaiser No Service No Service No Service No Service No Service na<br />
60 Ontario Conv Cntr - Chaffey College - Ont Mills 60 60 60 60 No Service 6:45 - 19:40<br />
61 Fontana - Ontario Mills - Pomona 15 15 15 15 No Service 5:39 - 19:47<br />
62 Montclair - Ontario - Chino 60 60 60 60 No Service 6:50 - 18:44<br />
63 Chino - Ontario - Upland 60 60 60 60 No Service 6:52 - 19:44<br />
64 Montclair - N Upland - Chaffey College 60 60 60 60 No Service 7:00 - 19:50<br />
65 Montclair - Chino Hills 60 60 60 60 No Service 6:31 - 18:26<br />
66 Fontana - Foothill - Montclair 30 30 30 30 No Service 5:35 - 18:52<br />
67 Ontario - Baseline - Fontana No Service No Service No Service No Service No Service na<br />
68 Chino - Montclair - Chaffey College 60 60 60 60 No Service 7:06 - 18:52<br />
70 Ontario - Creekside - Ontario Mills 60 60 60 60 No Service 6:45 - 18:40<br />
71 Kaiser - South Ridge - Rancho Cucamonga 60 60 60 60 No Service 6:35 - 18:55<br />
75 Ontario - Via Francis - Ontario Mills No Service No Service No Service No Service No Service na<br />
140 Fontana - Chaffey College No Service No Service No Service No Service No Service na<br />
202 San Bernardino - T.E.A.M. House No Service No Service No Service No Service No Service na<br />
7 N. San Bernardino - Sierra Way - San Bndo 60 60 60 No Service No Service 7:30 - 17:55<br />
8 San Bernardino - Mentone - Yucaipa 120 120 120 120 No Service 7:05 - 19:05<br />
9 San Bernardino - Redlands - Yucaipa 120 120 120 120 No Service 7:10 - 18:30<br />
30 Redlands Trolley (Red Line) 60 60 60 60 No Service 8:07 - 18:25<br />
31 Redlands Trolley (Blue Line) 60 60 60 No Service No Service 8:00 - 17:32<br />
90 Inland Empire Connection 60 60 - 55 60 - 45 60 No Service 6:50 - 20:02<br />
*Highlights indicate improved frequency/service span.<br />
193
Route Changes: FY <strong>2006</strong> (Implementation September<br />
2005)<br />
The following changes are improvements and<br />
extensions in service beyond the Existing System.<br />
Route 1: Operate a peak time tripper between 7:00 a.m.<br />
to 8:00 a.m. and 11:45 a.m. to 3:00 p.m., southbound from<br />
downtown San Bernardino to Arrowhead Regional Medical<br />
Center, weekdays. All net changes are for the period of<br />
September 6, 2005 through June 30, <strong>2006</strong>.<br />
Net Change:<br />
Revenue Miles Revenue Hours Buses<br />
12,720 9112 1<br />
Route 2: Implement a schedule adherence bus from<br />
approximately between 2:00 p.m. to 6:00 p.m., both<br />
directions, on weekdays.<br />
Net Change:<br />
Revenue Miles Revenue Hours Buses<br />
11,872 848 1<br />
Route 3: Service span will be increased in the mornings<br />
to provide service from Downtown San Bernardino by<br />
approximately 7:00 a.m. on Saturdays and Sundays.<br />
Net Change:<br />
Revenue Miles Revenue Hours Buses<br />
3,854 408 0<br />
Route 4: Service span will be increased in the mornings<br />
to provide service from Downtown San Bernardino by<br />
approximately 7:00 a.m. on Saturdays and Sundays.<br />
Net Change:<br />
Revenue Miles Revenue Hours Buses<br />
779 56 0<br />
Section V<br />
Service <strong>Plan</strong><br />
194
Route 8: Service span will be increased in the mornings<br />
to provide service from Downtown San Bernardino by<br />
approximately 7:00 a.m. on Saturdays and Sundays.<br />
Net Change:<br />
Revenue Miles Revenue Hours Buses<br />
3526 254 0<br />
Route 9: Service span will be increased in the mornings<br />
to arrive at Downtown San Bernardino by approximately<br />
6:00 a.m. on Weekdays and by 7:00 a.m. on Saturdays.<br />
Service span will also increase for evening service, departing<br />
Downtown San Bernardino by 9:00 p.m. on Weekdays and<br />
Saturdays.<br />
Net Change:<br />
Revenue Miles Revenue Hours Buses<br />
11,024 771 0<br />
Route 14: Service span will be increased in the mornings<br />
to arrive at Downtown San Bernardino by approximately<br />
7:00 a.m. on Saturdays and Sundays and in the evenings to<br />
depart Downtown San Bernardino by 9:00 p.m. on<br />
Saturdays.<br />
Net Change:<br />
Revenue Miles Revenue Hours Buses<br />
13,356 954 0<br />
Route 19: Service span will be increased in the mornings<br />
to provide service from Fontana Metrolink by approximately<br />
7:00 a.m. on Saturdays and Sundays.<br />
Net Change:<br />
Revenue Miles Revenue Hours Buses<br />
5494 390 0<br />
195
Route 20: Service Span will be increased on weekdays in<br />
the morning northbound trip from Marygold & Sierra to<br />
enable connections with Fontana Metrolink by 5:30 a.m.<br />
Net Change:<br />
Revenue Miles Revenue Hours Buses<br />
4073 320 0<br />
Route 28: Service Span will be increased on weekdays in<br />
the morning trip in both directions, beginning anhour earlier<br />
(6:02 a.m. at Marygold & Sierra), westbound.<br />
Net Change:<br />
Revenue Miles Revenue Hours Buses<br />
2,989 212 0<br />
Route 61: Am service span will be increased in the<br />
morning to arrive at Ontario Transcenter by approximately<br />
7:00 a.m. on Saturdays and Sundays, and to depart Ontario<br />
Transcenter by 9:00 p.m. on Saturdays. Service frequency is<br />
improved from 30 to 15 minutes on Saturdays (from 7:00<br />
a.m. to 6:00 p.m.) and Sundays (from 7:00 a.m. to 6:00 p.m.).<br />
An additional trip is also implemented at the end of the day<br />
to offer late shift workers transportation from the Fontana<br />
Metrolink traveling westbound, weekdays.<br />
Net Change:<br />
Revenue Miles Revenue Hours Buses<br />
120,950 8,643 0<br />
Route 66: Am service span will be increased in the<br />
mornings to arrive at Montclair Transcenter by approximately<br />
7:00 a.m. on Saturdays and Sundays and in the evenings to<br />
depart Montclair Transcenter by 9:00 p.m. on Saturdays.<br />
Service frequency is improved from 30 to 15 minutes on<br />
weekdays (between 6:30 a.m. and 6:30 p.m.) and from 60 to<br />
30 minutes on Sundays (between 9:07 a.m. to 6:08 p.m.)<br />
Net Change:<br />
Revenue Miles Revenue Hours Buses<br />
206,276 14,840 7<br />
Section V<br />
Service <strong>Plan</strong><br />
196
New Routes:<br />
14LTD: Route 14LTD will operate via Foothill Boulevard with<br />
limited stops at 4 th Street <strong>Transit</strong> mall, Foothill & Riverside,<br />
Foothill & Cedar, and Fontana Metrolink from 5:00 a.m. to<br />
9:00 a.m., on weekdays, with a 120-minute frequency.<br />
Net Change:<br />
Revenue Miles Revenue Hours Buses<br />
7,992 852 1<br />
Resource Requirements<br />
The proposed trippers on Routes 1 and 2, the new route 14L,<br />
and the schedule enhancement to Route 66 are currently<br />
estimated to require 10 additional peak buses distributed as<br />
shown in Figure V-8. Including spares, the total fleet<br />
required in FY <strong>2006</strong> will be 186 buses.<br />
Figure V-8 Fleet Requirements,<br />
Financially Constrained Scenario<br />
Bus Type<br />
Peak Spares Total<br />
Requirement<br />
Standard 40’ Low Floor 139 23 162<br />
Redlands Trolley 2 1 3<br />
Mid Size Buses 9 3 12<br />
Route 90 6 1 7<br />
Contingency None 7 7<br />
Total 156 35 191<br />
A route-by-route comparison of the number of buses, hours<br />
and miles required for each route for the implementation<br />
year FY <strong>2006</strong> is shown in Figures V-9 and V-10. The resource<br />
budget identifies the requirements by division, including the<br />
services to be contracted. A full year of the new service will<br />
require 740,938 hours of service, about 55,313 more<br />
hours of service from existing conditions, which represents a<br />
7.5 percent increase. The new annual mileage will be<br />
10,433,397, an increase of about 1,113,162 miles, which is a<br />
12 percent increase.<br />
The East Valley garage will now operate 48 percent of the<br />
annual service hours and 44 percent of the miles - a total of<br />
362,005 hours and 4,634,648 miles. This represents less<br />
than a 2 percent increase in hours and miles.<br />
197
The West Valley garage will operate close to 40 percent of<br />
the annual service hours and 41 percent of the miles – a<br />
total of 293,279 hours and 4,304,084 miles, representing a<br />
19.6 percent increase in hours and 31 percent increase in<br />
miles.<br />
Contracted fixed-route services will share 12 of annual<br />
service hours and 15 percent of annual vehicle-miles.<br />
Figure V-9 shows the Financially Constrained Bus Service<br />
Hours and Peak Fleet by Route and Division.<br />
Figure V-10 shows the Financially Constrained Bus Service<br />
Miles by Route and Division.<br />
Section V<br />
Service <strong>Plan</strong><br />
198
Figure V-9: Financially Constrained FY <strong>2006</strong> Bus Service Hours and Peak Fleet by Route and Division<br />
Weekday Hours Saturday Hours Sunday Hours<br />
Annual<br />
Route Non- Daily # of Non- Daily # of Non- Daily # of Revenue Non<br />
Revenue Revenue Total Bus Rev Rev Total Bus Rev Rev Total Bus Hours Revenue<br />
Total<br />
1 117.50 3.13 120.63 8 81.90 3.22 85.12 7 35.68 1.53 37.21 3 36,229.68 1,046.57 37,276.25<br />
2 128.95 6.00 134.95 11 89.55 4.50 94.05 8 70.90 4.12 75.02 8 41,362.50 1,983.12 43,345.62<br />
3 92.03 2.20 94.23 6 69.32 3.52 72.84 6 68.90 2.47 71.37 6 30,723.64 869.57 31,593.21<br />
4 85.08 2.73 87.81 6 65.46 4.07 69.53 6 64.32 2.73 67.05 6 28,503.96 1,047.07 29,551.03<br />
5 64.97 1.98 66.95 4 45.88 2.12 48.00 4 23.40 1.13 24.53 2 20,249.66 674.47 20,924.13<br />
7 40.35 3.42 43.77 3 22.00 2.33 24.33 2 20.42 1.92 22.34 2 12,551.72 1,096.78 13,648.50<br />
8 44.33 3.58 47.91 3 37.78 3.75 41.53 3 17.90 1.83 19.73 1 14,239.04 1,204.47 15,443.51<br />
9 48.88 3.18 52.06 3 41.49 3.53 45.02 3 16.23 1.00 17.23 2 15,513.27 1,047.94 16,561.21<br />
10 52.33 1.73 54.06 4 25.67 1.00 26.67 2 22.67 0.73 23.40 2 15,940.81 533.57 16,474.38<br />
11 66.67 1.43 68.10 4 44.67 2.10 46.77 4 22.83 0.97 23.80 2 20,598.69 523.41 21,122.10<br />
14 102.35 3.90 106.25 9 95.84 2.97 98.81 7 67.84 2.47 70.31 6 34,658.14 1,280.67 35,938.81<br />
14L 4.00 0.42 4.42 1 NoService NoService NoService NoService NoService NoService NoService NoService 1,032.00 108.36 1,140.36<br />
15 122.62 3.53 126.15 8 92.93 4.47 97.40 8 88.53 2.95 91.48 8 40,797.49 1,284.69 42,082.18<br />
19 102.12 4.92 107.04 7 80.38 4.72 85.10 7 45.51 2.82 48.33 4 32,686.97 1,649.18 34,336.15<br />
20 30.33 1.53 31.86 2 22.83 1.53 24.36 2 21.83 1.53 23.36 2 10,079.97 549.27 10,629.24<br />
22 89.80 2.53 92.33 6 43.62 2.03 45.65 4 24.38 0.80 25.18 2 26,592.78 795.04 27,387.82<br />
28 12.92 0.93 13.85 1 NoService NoService NoService NoService NoService NoService NoService NoService 3,333.36 239.94 3,573.30<br />
29 11.83 0.77 12.60 1 10.83 0.77 11.60 1 NoService NoService NoService NoService 3,593.64 237.16 3,830.80<br />
30 15.30 1.00 16.30 1 11.92 1.00 12.92 1 10.30 1.00 11.30 1 5,068.70 359.00 5,427.70<br />
31 12.92 1.00 13.92 1 11.30 1.00 12.30 1 9.53 1.00 10.53 1 4,384.39 359.00 4,743.39<br />
140 1.53 1.35 2.88 0 NoService NoService NoService NoService NoService NoService NoService NoService 394.74 348.30 743.04<br />
202 0.55 0.92 1.47 1 NoService NoService NoService NoService NoService NoService NoService NoService 141.90 237.36 379.26<br />
CityLink 4.50 2.00 6.50 1 NoService NoService NoService NoService NoService NoService NoService NoService 1,161.00 516.00 1,677.00<br />
EV Service 1,251.86 54.18 1,306.04 91 893.37 48.63 942.00 76 631.17 31.00 662.17 58 399,838.05 17,990.94 417,828.99<br />
60 50.65 1.90 52.55 3 34.17 1.75 35.92 3 34.22 1.75 35.97 3 16,521.42 666.95 17,188.37<br />
61 200.69 10.03 210.72 14 201.00 12.26 213.26 14 186.67 11.80 198.47 14 71,348.19 3,802.54 75,150.73<br />
62 47.87 1.07 48.94 4 23.77 0.73 24.50 2 23.77 0.57 24.34 2 14,751.23 341.63 15,092.86<br />
63 55.47 2.08 57.55 4 23.73 1.07 24.80 2 24.70 1.10 25.80 2 16,757.46 646.24 17,403.70<br />
64 25.67 1.00 26.67 2 25.67 1.00 26.67 2 23.67 1.00 24.67 2 9,113.53 359.00 9,472.53<br />
65 69.10 2.00 71.10 4 25.60 1.25 26.85 2 23.60 1.00 24.60 2 20,311.40 629.50 20,940.90<br />
66 204.00 7.75 211.75 12 71.09 2.50 73.59 5 67.76 2.96 70.72 6 59,642.26 2,274.94 61,917.20<br />
67 41.70 2.00 43.70 3 35.75 2.00 37.75 3 NoService NoService NoService NoService 12,546.10 616.00 13,162.10<br />
68 110.55 4.83 115.38 7 48.83 2.67 51.50 4 42.90 2.80 45.70 4 33,151.30 1,522.44 34,673.74<br />
70 26.92 1.08 28.00 3 11.83 1.00 12.83 2 11.83 1.00 12.83 2 8,140.19 379.90 8,520.09<br />
71 48.95 2.75 51.70 3 38.53 2.83 41.36 3 34.03 2.75 36.78 3 16,291.13 991.25 17,282.38<br />
75 8.59 1.00 9.59 0 NoService NoService NoService NoService NoService NoService NoService NoService 2,216.22 258.00 2,474.22<br />
90 85.93 4.67 90.60 6 75.37 4.07 79.44 5 45.53 3.17 48.70 4 28,260.47 1,570.03 29,830.50<br />
WV Service 976.09 42.16 1,018.25 65 615.34 33.13 648.47 47 518.68 29.90 548.58 44 309,050.90 14,058.42 323,109.32<br />
EV/WV Service<br />
Total<br />
2,227.95 96.34 2,324.29 156 1,508.71 81.76 1,590.47 123 1,149.85 60.90 1,210.75 102 708,888.95 32,049.36 740,938.31<br />
199
Section V<br />
Service <strong>Plan</strong><br />
200<br />
Figure V-10: Financially Constrained FY <strong>2006</strong> Bus Service Miles by Route and Division<br />
Weekday Saturday Sunday<br />
Annual<br />
Route<br />
Revenue<br />
Miles<br />
Non-<br />
Revenue Daily Total Revenue<br />
Miles<br />
Non-<br />
Revenue<br />
Daily Total<br />
Revenue<br />
Miles<br />
Non-<br />
Revenue<br />
Daily Total Revenue Miles Non-Revenue<br />
Total<br />
1 1,300.75 67.74 1,368.49 905.08 70.71 975.79 455.88 34.14 490.02 404,097.38 22,753.56 426,850.94<br />
2 1,535.94 137.74 1,673.68 1,212.31 110.91 1,323.22 944.41 100.63 1,045.04 501,956.93 46,214.55 548,171.48<br />
3 1,170.24 52.53 1,222.77 891.28 89.62 980.90 848.22 71.48 919.70 389,745.14 21,679.22 411,424.36<br />
4 1,077.24 70.32 1,147.56 831.70 113.14 944.84 819.04 67.27 886.31 361,077.34 27,230.33 388,307.67<br />
5 795.96 43.69 839.65 566.69 47.92 614.61 289.44 26.58 316.02 248,453.62 15,023.60 263,477.22<br />
7 467.84 36.70 504.54 275.60 28.60 304.20 252.50 22.30 274.80 147,360.22 12,035.90 159,396.12<br />
8 641.10 93.30 734.40 550.90 93.30 644.20 267.00 3.80 270.80 205,626.80 28,930.20 234,557.00<br />
9 919.05 69.30 988.35 606.69 107.90 714.59 240.50 26.90 267.40 244,086.62 24,646.30 268,732.92<br />
10 690.18 32.82 723.00 338.78 19.16 357.94 299.28 13.65 312.93 210,268.72 10,121.71 220,390.43<br />
11 761.37 28.63 790.00 511.51 45.09 556.60 261.48 20.53 282.01 235,344.44 10,688.07 246,032.51<br />
14 1,117.63 68.75 1,186.38 1,100.17 55.80 1,155.97 864.20 46.17 910.37 384,218.00 22,882.17 407,100.17<br />
14L 37.22 4.50 41.72 No Service No Service No Service No Service No Service No Service 9,602.76 1,161.00 10,763.76<br />
15 1,601.09 91.43 1,692.52 1,208.96 132.53 1,341.49 1,152.20 80.87 1,233.07 532,291.42 34,339.81 566,631.23<br />
19 1,250.18 147.25 1,397.43 1,000.22 135.03 1,135.25 509.99 53.45 563.44 397,111.00 47,467.95 444,578.95<br />
20 370.90 39.14 410.04 278.99 39.14 318.13 266.86 39.14 306.00 123,251.56 14,051.26 137,302.82<br />
22 1,354.26 54.44 1,408.70 720.72 47.34 768.06 360.03 23.28 383.31 403,796.61 17,599.80 421,396.41<br />
28 185.12 19.57 204.69 No Service No Service No Service No Service No Service No Service 46,986.96 5,049.06 52,036.02<br />
29 138.36 19.57 157.93 126.83 19.57 146.40 No Service No Service No Service 42,038.38 6,027.56 48,065.94<br />
30 107.80 11.10 118.90 89.80 33.30 123.10 89.80 22.20 112.00 36,882.20 5,661.00 42,543.20<br />
31 124.00 11.10 135.10 113.70 33.30 147.00 103.40 22.20 125.60 42,950.40 5,661.00 48,611.40<br />
140 30.11 62.04 92.15 No Service No Service No Service No Service No Service No Service 7,768.38 16,006.32 23,774.70<br />
202 3.02 10.34 13.36 No Service No Service No Service No Service No Service No Service 779.16 2,667.72 3,446.88<br />
CityLink 19.92 3.92 23.84 No Service No Service No Service No Service No Service No Service 5,139.36 1,011.36 6,150.72<br />
EV Service 15,699.28 1,175.92 16,875.20 11,126.43 1,155.76 12,282.19 8,024.23 674.59 8,698.82 4,980,833.40 398,909.45 5,379,742.85<br />
60 583.44 62.83 646.27 395.34 47.79 443.13 395.34 47.79 443.13 190,456.86 21,036.93 211,493.79<br />
61 2,611.80 290.76 2,902.56 2,593.92 378.88 2,972.80 2,426.55 351.56 2,778.11 893,909.74 111,889.64 1,005,799.38<br />
62 598.29 18.69 616.98 286.56 12.30 298.86 286.56 12.30 298.86 183,301.38 6,064.32 189,365.70<br />
63 718.41 40.87 759.28 308.28 20.06 328.34 320.17 20.77 340.94 217,092.45 12,606.73 229,699.18<br />
64 372.97 30.08 403.05 372.97 30.08 403.05 344.28 30.08 374.36 132,433.04 10,798.72 143,231.76<br />
65 903.00 23.62 926.62 335.40 19.97 355.37 309.60 19.34 328.94 265,533.60 8,078.80 273,612.40<br />
66 1,753.00 155.00 1,908.00 1,003.70 79.44 1,083.14 1,355.20 59.20 1,414.40 727,596.00 46,981.20 774,577.20<br />
67 515.84 53.73 569.57 440.52 59.23 499.75 No Service No Service No Service 155,112.72 16,823.84 171,936.56<br />
68 1,221.74 132.93 1,354.67 500.10 67.05 567.15 440.33 75.96 516.29 362,670.75 41,522.40 404,193.15<br />
70 376.88 14.00 390.88 165.62 14.00 179.62 165.62 14.00 179.62 113,962.66 5,026.00 118,988.66<br />
75 120.26 14.00 134.26 No Service No Service No Service No Service No Service No Service 31,027.08 3,612.00 34,639.08<br />
71 709.11 88.10 797.21 558.35 110.01 668.36 493.49 89.26 582.75 236,035.87 32,782.56 268,818.43<br />
90 2,080.70 9.70 2,090.40 1,997.20 84.20 2,081.40 1131.00 62.40 1193.40 694,361.60 9,895.00 704,256.60<br />
WV Service 12,565.44 934.31 13,499.75 8,957.96 923.01 9,880.97 7,668.14 782.66 8,450.80 4,203,493.75 327,118.14 4,530,611.89<br />
EV/WV Service<br />
Total<br />
28,264.72 2,110.23 30,374.95 20,084.39 2,078.77 22,163.16 15,692.37 1,457.25 17,149.62 9,184,327.15 726,027.59 9,910,354.74
FY04-08 Fare Policy and Implementation <strong>Plan</strong><br />
In February 2003, <strong>Omnitrans</strong> Board of Directors approved a<br />
4-year fare policy which included a fare change that went<br />
into affect in September 2003, and proposed two additional<br />
fare increases in July 2005 and July 2007. Each of these<br />
subsequent fare changes would need to be reviewed and<br />
approved by the Board of Directors prior to their<br />
implementation.<br />
The initial fare increase that occurred in September 2003<br />
allowed <strong>Omnitrans</strong> to maintain a 20% farebox recovery with<br />
its fixed route system, and a 10% farebox recovery with its<br />
ADA paratransit system. With the increase in costs<br />
associated with operating the system, the fare increase was<br />
vital to maintaining these ratios, which are requirements in<br />
order to continue to get operating dollars from the Local<br />
Transportation Fund (LTF).<br />
All of the improvements that are shown in the previous<br />
pages are done to address passenger concerns and to meet<br />
more of their transportation needs in the coming year. In<br />
order to allow the system changes that were implemented in<br />
January 2004 and the changes for September 2005 to fully<br />
develop, it is proposed that the fare increase scheduled for<br />
July 2005 be delayed, possibly until July 2007.<br />
201
Figure V-11: Proposed Fare Structure Changes (Fixed Route)<br />
Fixed Route<br />
Effective<br />
September<br />
2003<br />
Effective July 2005<br />
(no change<br />
proposed)<br />
Effective<br />
July 2007<br />
(planned)<br />
Cash Fares<br />
Regular $ 1.15 $ 1.15 $ 1.30<br />
Senior & Disabled* $ 0.50 $ 0.50 $ 0.60<br />
Children 46" and under Free Free Free<br />
Day Passes<br />
Full Fare $ 2.75 $ 2.75 $ 3.25<br />
Senior & Disabled* $ 1.25 $ 1.25 $ 1.50<br />
7-Day Pass<br />
Full Fare $ 16.00 $ 16.00 $ 18.00<br />
Senior & Disabled* $ 8.00 $ 8.00 $ 9.00<br />
31-Day Pass<br />
Full Fare $ 41.00 $ 41.00 $ 46.50<br />
Senior & Disabled* $ 20.50 $ 20.50 $ 23.00<br />
Student Fare $ 29.50 $ 29.50 $ 33.50<br />
*Does not include Measure I subsidy for senior and disabled passengers of $0.05 per trip.<br />
Section V<br />
Service <strong>Plan</strong><br />
202
Access*<br />
Figure V-12: Proposed Fare Structure Changes (Access and Omnilink)<br />
Passenger<br />
Effective September<br />
2003<br />
Effective July 2005<br />
(no change proposed)<br />
Effective July<br />
2007 (planned)<br />
1 zone $ 2.05 $ 2.05 $ 2.35<br />
2 zones $ 2.05 $ 2.05 $ 2.35<br />
3 zones $ 2.05 $ 2.05 $ 2.35<br />
4 zones $ 2.80 $ 2.80 $ 3.20<br />
5 zones $ 3.55 $ 3.55 $ 4.05<br />
6 zones $ 4.30 $ 4.30 $ 4.90<br />
Companion<br />
1 zone $ 2.30 $ 2.30 $ 2.60<br />
2 zones $ 2.30 $ 2.30 $ 2.60<br />
3 zones $ 2.30 $ 2.30 $ 2.60<br />
4 zones $ 3.05 $ 3.05 $ 3.45<br />
5 zones $ 3.80 $ 3.80 $ 4.30<br />
6 zones $ 4.55 $ 4.55 $ 5.15<br />
Children 46" and under Free Free Free<br />
Subscription Passes<br />
1 zone $ 172.50 $ 172.50 $ 195.00<br />
2 zones $ 172.50 $ 172.50 $ 195.00<br />
3 zones $ 172.50 $ 172.50 $ 195.00<br />
4 zones $ 228.50 $ 228.50 $ 258.50<br />
5 zones $ 285.00 $ 285.00 $ 322.50<br />
6 zones $ 341.00 $ 341.00 $ 386.00<br />
Omnilink<br />
Passenger<br />
Effective September<br />
2003<br />
Effective July 2005<br />
(no change proposed)<br />
Effective July<br />
2007 (planned)<br />
Regular $ 2.50 $ 2.50 $ 2.75<br />
Senior & Disabled** $ 1.25 $ 1.25 $ 1.35<br />
Children 46" and under Free Free Free<br />
*Does not include Measure I subsidy of $0.25 per trip for Senior and Disabled passengers.<br />
**Does not include Measure I subsidy of $0.05 per trip for Senior and Disabled<br />
passengers.<br />
203
Nationwide, people are turning to their cars for<br />
transportation instead of the bus. Trends across the nation<br />
indicate a decline in ridership is occurring due to a number<br />
of factors, none of which are limited to the San Bernardino<br />
Valley, but revolve around economic and employment<br />
changes, to name just two of many factors that could be<br />
impacting ridership on public transit nationwide. With the<br />
improvements in service that are proposed in this SRTP,<br />
along with the delay in a fare increase until July 2007,<br />
<strong>Omnitrans</strong> hopes to reverse this trend in our service area,<br />
and provide additional opportunities for people to choose<br />
<strong>Omnitrans</strong> over their automobile in the San Bernardino<br />
Valley.<br />
Up to Design Guidelines Scenario<br />
Service <strong>Plan</strong><br />
From numerous consultations with stakeholders and<br />
through many service requests, riders have expressed their<br />
need for an improved weekday span of service, improved<br />
weekend span of service and service frequency, and<br />
improved service frequency on major east-west and northsouth<br />
routes throughout the week.<br />
<strong>Omnitrans</strong> existing service was analyzed to evaluate<br />
compliance with the Service Design Guidelines presented in<br />
the previous chapter. Findings indicate and reflect the vision<br />
of the general public – that there are major deficiencies in<br />
spatial and temporal coverage across the service area.<br />
The Up to Design Guidelines scenario assumes that if<br />
resources become available in the near future priority should<br />
be given to bring the Financially Constrained scenario up to<br />
standards. This means adding primarily weekday service<br />
hours before the AM Peak and after PM Peak. It also means<br />
adding service hours on weekends to improve temporal<br />
coverage.<br />
Figures V-15 through V-18 show service improvements on<br />
weekdays and weekends over the Financially Constrained<br />
Scenario, that would bring service up to standards.<br />
Section V<br />
Service <strong>Plan</strong><br />
204
Figure V-13<br />
205
Section V<br />
Service <strong>Plan</strong><br />
206<br />
Figure V-14: Up To Design Scenario FY <strong>2006</strong> East Valley Service Map
Route Changes<br />
The following changes are improvements and<br />
extensions in service above that of the Constrained<br />
Scenario.<br />
TIER 1<br />
Route 7: Service frequency is improved from 30/60 to<br />
15/30 minutes on weekdays and from 60 to 30 minutes on<br />
Saturday. Sunday 60-minute frequency will remain in effect.<br />
Route 10: Service frequency is improved from 30 to 15<br />
minutes on weekdays and from 60 to 30 minutes on<br />
Saturdays. Sunday 60-minute frequency will remain in effect.<br />
Route 19: Service frequency is improved from 30 to 15<br />
minutes on weekdays.<br />
Route 22: Route 22 will be re-routed north of Highland @<br />
Riverside. The existing trunk of Route 22 will remain<br />
unchanged from Arrowhead Medical Center to North Rialto.<br />
From Cactus @ Bonhert, WB Bonhert, NB Locust, WB Casa<br />
Grande, NB Terra Vista, NB Live Oak, NB Riverside, SB Sierra<br />
to Fontana Metrolink. Service frequency remains at 15<br />
minutes on weekdays, 20 minutes on Saturdays, and<br />
improved from 45 to 40 minutes on Sundays.<br />
Route 90: Service frequency is improved to 15 minutes<br />
from downtown San Bernardino to the Riverside Terminal<br />
and 30-minute frequency from downtown San Bernardino<br />
to Colton and Montclair, on weekdays. Service frequency<br />
will be 45 minutes on Saturday while Sunday frequency from<br />
downtown San Bernardino to Riverside Terminal is 45<br />
minutes and 60 minute service from downtown San<br />
Bernardino to Colton and Montclair.<br />
TIER 2<br />
Route 8: Service frequency is improved from 60 to 30<br />
minutes on weekdays and 120 to 60 minutes on Sunday.<br />
Saturday 60-minute frequency will remain in effect.<br />
Route 9: Service frequency is improved from 60 to 30<br />
minutes on weekdays and 120 to 60 minutes on Sunday.<br />
Saturday 60-minute frequency will remain in effect.<br />
207
Route 15: The Citrus Plaza loop will be eliminated<br />
because the new Route 17 will cover this area.<br />
Route 67: Service frequency will increase from hourly to<br />
half hourly on weekdays.<br />
TIER 3<br />
Route 28: Route 28 will be expanded to provide service<br />
further north above South Fontana TC to Summit via Sierra.<br />
Alignment will remain the same from Marlay @ Mulberry Ave<br />
to South Fontana TC. From Fontana TC, NB Sierra, WB<br />
Summit, SB Citrus, EB Carter, and SB Sierra to return to<br />
Fontana TC. Weekday hourly frequency will remain<br />
unchanged. Service is implemented on Saturdays (7:00<br />
a.m.–9:00 p.m.) and Sundays (7:00 a.m.–7:00 p.m.), at 60-<br />
minute frequencies.<br />
Route 29: Route 29 will continue to provide service to<br />
Kaiser Hospital and Bloomington High School/Junior High in<br />
addition to extended service to North Rialto. From Fontana<br />
TC, EB Valley, NB Locust, WB Baseline, NB Laurel, EB<br />
Highland, SB Riverside, EB Baseline, SB Pepper, WB Valley, SB<br />
Cedar, EB Slover, SB Spruce, WB Santa Ana, SB Cedar, WB<br />
11th St., NB Locust, WB Slover, NB Sierra to South Fontana<br />
TC. This route modification will cover the Pepper Corridor<br />
with many residential and shopping opportunities along<br />
Baseline and make service available on Valley Boulevard<br />
between Sierra Avenue and Pepper Avenue. Service<br />
frequency will remain hourly on Weekdays and Saturdays.<br />
Service will be added with hourly frequency on Sunday.<br />
Route 71: Route 71 will be re-routed in the western end<br />
to exclude the stop at Rancho Cucamonga Civic Center<br />
(Route 68 will still provide service to the Civic Center).<br />
Alignment on Route 71 will remain the same from Fontana<br />
TC to Ontario Mills. At Ontario Mills, it will continue NB<br />
Milliken, WB 4th, and SB Euclid to Ontario TC. Hourly service<br />
will be maintained on weekdays and weekends.<br />
Route 75: Route 75 will be re-routed in the western end<br />
to provide extended service to the Pomona Transcenter. At<br />
Mission @ Grove, alignment will continue westbound on<br />
Mission and North on Main to the Pomona Transcenter, on<br />
weekdays with 60 minute frequency.<br />
Section V<br />
Service <strong>Plan</strong><br />
208
New Routes<br />
TIER 2<br />
Route 18: Route 18 will align from downtown San<br />
Bernardino, EB 3rd NB Sterling, EB Lynwood, NB Victoria<br />
Street to travel to San Manuel Casino. This route is intended<br />
to provide coverage to the Casino as well as serve many<br />
residents on 3rd @ Del Rosa. This route will operate on 30<br />
minute frequency on weekdays and 60 minutes on<br />
weekends. Furthermore, the future San Manuel<br />
commercial/industrial property on 3 rd Street between<br />
Lankershim and Victoria will slightly bring Route 18 to travel<br />
eastbound on 3 rd , NB Lankershim, WB 6 th Street, continuing<br />
NB on Sterling to regular routing. This slight deviation in<br />
alignment will occur to provide coverage once this<br />
commercial land is fully developed, which is likely beyond<br />
September 2005.<br />
Route 57: Route 57 will start from Chaffey College, SB<br />
Haven, EB Mission, SB Milliken which becomes Hamner, WB<br />
Edison, NB Pipeline, and EB Chino into Chino TC. As an am<br />
Peak Service, this route will travel from Chino TC, WB Grand<br />
to I-60 to Diamond Bar Park and Ride, continuing on I-57 to<br />
Brea Mall. This peak service will connect Chino TC and<br />
passengers from Diamond Bar to the Brea Mall. Service<br />
frequency is planned for 30 minutes on weekdays and 60<br />
minutes on weekends.<br />
Yucaipa Circulator: This fixed route circulator will extend the<br />
<strong>Omnitrans</strong> service area eastward into currently unserved<br />
areas of Yucaipa. The north loop (N.Y.) will travel from<br />
Yucaipa Transcenter, EB Yucaipa, NB Bryant, WB Oak Glen,<br />
and SB 5th returning to Yucaipa Transcenter. The south loop<br />
(S.Y.) will travel from Yucaipa Transcenter, EB Yucaipa, SB<br />
Bryant, WB E Ave, SB California to Beaver Medical Clinic, EB<br />
Avenue H, NB 5th returning to Yucaipa Transcenter. This<br />
route will run every half hour on weekdays and weekends.<br />
TIER 3<br />
Route 17: Route 17 is a cross-town route proposed to<br />
travel from Redlands TC, NB Orange, WB San Bernardino, NB<br />
Arrowhead, WB 2nd Street to San Bernardino TC. This new<br />
alignment will cover San Bernardino Avenue between<br />
Tippecanoe and Mountain Avenue, where there have been<br />
numerous service requests. The Citrus Plaza on San<br />
209
Bernardino will also be served, replacing the Route 15 Citrus<br />
loop. Service frequency is planned for 60 minutes on<br />
weekdays and weekends.<br />
Route 21: Route 21 will align from downtown San<br />
Bernardino, WB Mill Street, SB Rancho Avenue, EB N Street,<br />
NB La Cadena, WB E Street, NB Rancho Avenue, EB Mill<br />
Street returning to downtown San Bernardino. This route<br />
will serve Rancho Avenue Corridor, South Colton, Civic<br />
Center, Colton High School and Colton Middle School.<br />
Residents of Colton have requested <strong>Omnitrans</strong> service.<br />
Service frequency is planned for every hour on weekdays<br />
and weekends.<br />
Resource Requirements<br />
With the least additions possible, the Up to Design<br />
Guidelines scenario requires approximately 176,540<br />
additional annual revenue service hours from the Financially<br />
Constrained Scenario revenue hours. Hours are used to<br />
increase the span of service during weekdays and weekends<br />
to meet the minimum service levels specified in the Service<br />
Design Guidelines. About 42 percent of the additional hours<br />
are on weekdays, and 58 percent are on weekends. Based<br />
on average travel speeds for each particular route, the<br />
resulting increase is about 2,045,026 annual miles.<br />
The Financially Constrained scenario will require each bus in<br />
the fleet to operate about 66,880 miles annually. The<br />
additional hours in the Up to Guidelines Scenario would add<br />
about 13,109 miles per bus per year if the peak fleet<br />
remained at 156. This would increase maintenance costs or<br />
require 53 additional buses for a total of 209 peak fleet to<br />
maintain the average mileage of 59,705 per bus.<br />
A complete detail of service changes and frequencies for this<br />
scenario is shown in Figures V-15 through V-17.<br />
Figure V-18 shows the Up to Design Bus Service Hours,<br />
Miles, and Peak Fleet by Route and Division.<br />
Section V<br />
Service <strong>Plan</strong><br />
210
Figure V-15<br />
Up To Design FY <strong>2006</strong> Weekday Frequency (in minutes)<br />
Route Route Name Before AM Peak AM Peak Midday PM Peak Early Evening Late Evening Service Hours Legend<br />
Until 5:59 6:00 - 8:59 9:00 - 14:59 15:00 - 17:59 18:00 - 19:59 Beyond 20:00 New Route<br />
1 ARMC - San Bernardino - Del Rosa 15/30' 15/30' 15/30' 15/30' 15/30' 15/30' 4:38 -22:27 Hourly<br />
2 Cal State - E Street - Loma Linda 15 15 15 15 15 15 4:25 - 22:40 Half Hourly<br />
3 Baseline - Highland - San Bernardino 15 15 15 15 15 15 4:24 - 23:11 20 Minutes<br />
4 Baseline - Highland - San Bernardino 15 15 15 15 15 15 4:33 - 22:58 15 Minutes<br />
5 San Bernardino - Del Rosa - Cal State 30 30 30 30 30 30 4:28 - 22:40<br />
7 N. San Bernardino - Sierra Way - San Bndo 15/30' 15/30' 15/30' 15/30' 15/30' 15/30' 4:53 - 21:52<br />
8 San Bernardino - Mentone - Yucaipa 30 30 30 30 30 30 4:30 - 22:30<br />
9 San Bernardino - Redlands - Yucaipa 30 30 30 30 30 30 4:33 - 22:28<br />
10 Fontana - Baseline - San Bernardino 15 15 15 15 15 15 4:35 - 21:55<br />
11 San Bernardino - Muscoy - Cal State 30 30 30 30 30 30 4:55 - 22:50<br />
14 Fontana - Foothill - San Bernardino 15 15 15 15 15 15 3:55 - 22:57<br />
14L Fontana - San Bernardino Limited Stop Service LS LS No Service No Service No Service No Service 5:00 - 9:00<br />
15 Fontana - San Bndo/Highland - Redlands 30 30 30 30 30 30 5:08 - 22:35<br />
17 Redlands - Via San Bernardino Ave - San Bernardino No Service 60 60 60 60 60 6:00 - 21:00<br />
18 San Bernardino - Via Sterling - San Manuel Casino No Service 30 30 30 30 30 6:00 - 21:00<br />
19 Redlands - Colton - Fontana 15 15 15 15 15 15 5:05 - 22:12<br />
20 Fontana Metrolink - Via Hemlock - Kaiser 30 30 30 30 30 30 5:35 - 21:57<br />
21 San Bernardino - Via Rancho Ave - Colton No Service 60 60 60 60 60 6:00 - 21:00<br />
22* ARMC - Riverside Ave - Fontana 15 15 15 15 15 15 4:48 - 22:14<br />
28* Southridge - Sierra Ave - North Fontana 60 60 60 60 60 60 5:02 - 21:57<br />
29* Kaiser - North Rialto - Bloomington 60 60 60 60 60 60 4:48 - 22:14<br />
30 Redlands Trolley (Red Line) No Service 60 60 60 60 60 6:37 - 21:55<br />
31 Redlands Trolley (Blue Line) No Service 60 60 60 60 60 5:07 - 21:25<br />
57 Chino Hills - Milliken - Chaffey College 30 30 30 30 30 30 5:45 - 22:35<br />
60 Ontario Conv Cntr - Chaffey College - Ont Mills 60 60 60 60 60 60 4:40 - 22:33<br />
61 Fontana - Ontario Mills - Pomona 15/30 15/30 15 15 15 15/30 4:20 - 23:21<br />
62 Montclair - Ontario - Chino 30 30 30 30 30 30 5:16 - 22:37<br />
63 Chino - Ontario - Upland 30/60 30/60 30 30 30 30 5:24 - 22:15<br />
64 Montclair - N Upland - Chaffey College 60 60 60 60 60 60 5:00 - 21:50<br />
65 Montclair - Chino Hills 30 30 30 30 30 30 4:50 - 22:44<br />
66 Fontana - Foothill - Montclair 15 15 15 15 15 15 4:31 - 23:38<br />
67 Ontario - Baseline - Fontana 30 30 30 30 30 30 4:00 - 22:52<br />
68 Chino - Montclair - Chaffey College 30/60 30/60 30 30 30/60 30/60 4:49 - 22:44<br />
70 Ontario - Creekside - Ontario Mills 60 60 60 60 60 60 5:33 - 23:06<br />
71* Kaiser - South Ridge - Ontario 60 60 60 60 60 60 4:35 - 22:27<br />
75* Ontario - Mission - Pomona 60 60 60 60 60 60 5:05 - 21:57<br />
90 Regional Express 15/30' 15/30' 15/30' 15/30' 15/30' 15/30' 4:40 - 22:25<br />
140 Fontana - Chaffey College No Service AM Peak Tripper No Service PM Peak Tripper No Service No Service 2 Trips a Day<br />
202 San Bernardino - T.E.A.M. House No Service AM Peak Tripper Midday Tripper No Service No Service No Service 2 Trips a Day<br />
CityLink Santa Fe Depot - Downtown San Bernardino Feeder Feeder No Service Feeder Feeder No Service 6 Trips a Day<br />
N.Y./S.Y. Yucaipa - Oakland - Beaver Medical Center No Service 30 30 30 30 30 6:00 - 21:00<br />
Colored Cells indicate new routes/service upgrades and * indicates alignment extensions beyond Financially Constrained Scenario.<br />
211
Section V<br />
Service <strong>Plan</strong><br />
212<br />
Figure V-16<br />
Up To Design FY <strong>2006</strong> Saturday Frequency (in minutes)<br />
Route Route Name Before AM Peak AM Peak Midday PM Peak Early Evening Late Evening Service Hours Legend<br />
Until 5:59 6:00 - 8:59 9:00 - 14:59 15:00 - 17:59 18:00 - 19:59 Beyond 20:00 New Route<br />
1 ARMC - San Bernardino - Del Rosa No Service 15/30' 15/30' 15/30' 15/30' 15/30' 6:07 - 21:28 Hourly<br />
2 Cal State - E Street - Loma Linda No Service 15 15 15 15 15 6:25 - 21:45 Half Hourly<br />
3 Baseline - Highland - San Bernardino No Service 15/30' 15 15 15 15 6:09 - 21:15 20 Minutes<br />
4 Baseline - Highland - San Bernardino No Service 15/30' 15 15 15 No Service 6:33 - 19:57 15 Minutes<br />
5 San Bernardino - Del Rosa - Cal State No Service 30 30 30 30 No Service 5:58 - 20:10<br />
7 N. San Bernardino - Sierra Way - San Bndo 30 30 30 30 30 30 5:50 - 21:50<br />
8 San Bernardino - Mentone - Yucaipa 60 60 60 60 60 60 5:40 - 23:20<br />
9 San Bernardino - Redlands - Yucaipa 60 60 60 60 60 60 5:33 - 22:28<br />
10 Fontana - Baseline - San Bernardino 30 30 30 30 30 30 5:35 -22:25<br />
11 San Bernardino - Muscoy - Cal State 30 30 30 30 30 30 5:25 - 22:20<br />
14 Fontana - Foothill - San Bernardino 15/30' 15 15 15 30 30 5:00 - 21:45<br />
15 Fontana - San Bndo/Highland - Redlands No Service 30 30 30 30 30 6:38 - 22:55<br />
17 Redlands - Via San Bernardino Ave - San Bernardino No Service 60 60 60 60 60 7:00 - 21:00<br />
18 San Bernardino - Via Sterling - San Manuel Casino No Service 60 60 60 60 60 7:00 - 21:00<br />
19 Redlands - Colton - Fontana No Service 30 30 30 30 30 5:20 - 22:55<br />
20 Fontana Metrolink - Via Hemlock - Kaiser No Service 30 30 30 30 30 6:35 - 21:57<br />
21 San Bernardino - Via Rancho Ave - Colton No Service 60 60 60 60 60 7:00 - 21:00<br />
22 ARMC - Riverside Ave - Fontana No Service 20 20 20 20 20 6:00 - 22:14<br />
28 Southridge - Sierra Ave - North Fontana No Service 60 60 60 60 60 7:00 - 21:00<br />
29 Kaiser - North Rialto - Bloomington No Service 60 60 60 60 60 6:45 - 22:35<br />
30 Redlands Trolley (Red Line) No Service 60 60 60 60 60 6:37 - 21:55<br />
31 Redlands Trolley (Blue Line) No Service 60 60 60 60 60 6:07 - 21:25<br />
57 Chino Hills - Milliken - Chaffey College No Service 60 60 60 60 60 6:45 - 22:35<br />
60 Ontario Conv Cntr - Chaffey College - Ont Mills 60 60 60 60 60 60 4:45 - 23:07<br />
61 Fontana - Ontario Mills - Pomona 15 15 15 15 15 15 5:40 - 22:46<br />
62 Montclair - Ontario - Chino No Service 60 60 60 60 60 6:50 - 21:44<br />
63 Chino - Ontario - Upland No Service 60 60 60 60 60 5:52 - 22:46<br />
64 Montclair - N Upland - Chaffey College No Service 60 60 60 60 60 6:00 - 21:50<br />
65 Montclair - Chino Hills No Service 60 60 60 60 60 6:20 - 22:15<br />
66 Fontana - Foothill - Montclair 30 30 30 30 30 30 5:15 - 22:53<br />
67 Ontario - Baseline - Fontana 60 60 60 60 60 60 5:05 - 23:00<br />
68 Chino - Montclair - Chaffey College 60 60 60 60 60 60 5:06 - 22:52<br />
70 Ontario - Creekside - Ontario Mills No Service 60 60 60 60 60 5:45 - 22:37<br />
71 Kaiser - South Ridge - Ontario 60 60 60 60 60 60 5:35 - 22:28<br />
75* Ontario - Mission - Pomona No Service No Service No Service No Service No Service No Service No Service<br />
90 Regional Express 45/50' 45 45 45 45 45/60' 5:15 - 23:40<br />
140 Fontana - Chaffey College No Service No Service No Service No Service No Service No Service No Service<br />
202 San Bernardino - T.E.A.M. House No Service No Service No Service No Service No Service No Service No Service<br />
N.Y./S.Y. Yucaipa - Oakland - Beaver Medical Center No Service 30 30 30 30 30 7:00 - 21:00<br />
Colored Cells indicate new routes/service upgrades and * indicates alignment extensions beyond Financially Constrained Scenario.
Figure V-17<br />
Up To Design FY <strong>2006</strong> Sunday Frequency (in minutes)<br />
Route Route Name Before AM Peak AM Peak Midday PM Peak Early Evening Late Evening Service Hours Legend<br />
Until 5:59 6:00 - 8:59 9:00 - 14:59 15:00 - 17:59 18:00 - 19:59 Beyond 20:00 New Route<br />
1 ARMC - San Bernardino - Del Rosa No Service 15/30' 15/30' 15/30' 15/30' No Service 6:32 - 19:55 Hourly<br />
2 Cal State - E Street - Loma Linda No Service 15 15 15 15 No Service 6:05 - 19:26 Half Hourly<br />
3 Baseline - Highland - San Bernardino No Service 15 15 15 15 No Service 6:09 - 19:34 20 Minutes<br />
4 Baseline - Highland - San Bernardino No Service 15 15 15 15 15 6:33 - 20:12 15 Minutes<br />
5 San Bernardino - Del Rosa - Cal State 30 30 30 30 30 30 5:38 - 20:20<br />
7 N. San Bernardino - Sierra Way - San Bndo No Service 60 60 60 60 No Service 6:30 - 19:50<br />
8 San Bernardino - Mentone - Yucaipa No Service 60 60 60 60 60 6:05 - 23:05<br />
9 San Bernardino - Redlands - Yucaipa 60 60 60 60 60 60 5:10 - 20:30<br />
10 Fontana - Baseline - San Bernardino 60 60 60 60 60 60 5:35 - 20:25<br />
11 San Bernardino - Muscoy - Cal State 60 60 60 60 60 60 5:25 - 20:20<br />
14 Fontana - Foothill - San Bernardino No Service 15 15 15 15 No Service 6:17 - 19:56<br />
15 Fontana - San Bndo/Highland - Redlands No Service 30 30 30 30 No Service 6:38 - 19:55<br />
17 Redlands - Via San Bernardino Ave - San Bernardino No Service 60 60 60 60 No Service 7:00 - 19:00<br />
18 San Bernardino - Via Sterling - San Manuel Casino No Service 60 60 60 60 No Service 7:00 - 19:00<br />
19 Redlands - Colton - Fontana No Service 60 60 60 60 60 5:15 - 20:50<br />
20 Fontana Metrolink - Via Hemlock - Kaiser No Service 30 30 30 30 No Service 6:35 - 19:57<br />
21 San Bernardino - Via Rancho Ave - Colton No Service 60 60 60 60 No Service 7:00 - 19:00<br />
22 ARMC - Riverside Ave - Fontana No Service 40 40 40 40 40 5:55 - 20:32<br />
28 Southridge - Sierra Ave - North Fontana No Service 60 60 60 60 No Service 7:00 - 19:00<br />
29 Kaiser - North Rialto - Bloomington No Service 60 60 60 60 No Service 7:00 - 19:00<br />
30 Redlands Trolley (Red Line) No Service 60 60 60 60 No Service 6:37 - 19:55<br />
31 Redlands Trolley (Blue Line) No Service 60 60 60 60 No Service 6:07 - 19:25<br />
57 Chino Hills - Milliken - Chaffey College No Service 60 60 60 60 No Service 7:00 - 19:00<br />
60 Ontario Conv Cntr - Chaffey College - Ont Mills 60 60 60 60 60 60 5:45 - 21:08<br />
61 Fontana - Ontario Mills - Pomona 15 15 15 15 15 15 5:39 - 20:46<br />
62 Montclair - Ontario - Chino No Service 60 60 60 60 60 6:52 - 20:44<br />
63 Chino - Ontario - Upland 60 60 60 60 60 60 5:52 - 20:44<br />
64 Montclair - N Upland - Chaffey College No Service 60 60 60 60 60 6:00 - 20:50<br />
65 Montclair - Chino Hills No Service 60 60 60 60 60 6:31 - 20:26<br />
66 Fontana - Foothill - Montclair 30 30 30 30 30 No Service 5:35 - 19:52<br />
67 Ontario - Baseline - Fontana No Service 60 60 60 60 No Service 7:00 - 19:00<br />
68 Chino - Montclair - Chaffey College 60 60 60 60 60 60 5:06 - 20:52<br />
70 Ontario - Creekside - Ontario Mills 60 60 60 60 60 60 5:45 - 20:40<br />
71 Kaiser - South Ridge - Ontario 60 60 60 60 60 60 5:35 - 20:27<br />
75* Ontario - Mission - Pomona No Service No Service No Service No Service No Service No Service No Service<br />
90 Regional Express 60 55/60' 45/60' 45/60' 60 No Service 5:50 - 20:02<br />
140 Fontana - Chaffey College No Service No Service No Service No Service No Service No Service No Service<br />
202 San Bernardino - T.E.A.M. House No Service No Service No Service No Service No Service No Service No Service<br />
N.Y./S.Y. Yucaipa - Oakland - Beaver Medical Center No Service 30 30 30 30 No Service 7:00 - 19:00<br />
Colored Cells indicate new routes/service upgrades and * indicates alignment extensions beyond Financially Constrained Scenario.<br />
213
Section V<br />
Service <strong>Plan</strong><br />
214<br />
Figure V-18 Financially Up To Design Scenario FY <strong>2006</strong> Hours and Miles<br />
Up to Design Scenario FY <strong>2006</strong> Weekday Saturday Sunday<br />
Annually<br />
Revenue Revenue Revenue Revenue Revenue Revenue Revenue Revenue<br />
Route Route Name Hours Miles #Veh Hours Miles #Veh Hours Miles #Veh Hours Miles<br />
1 ARMC - San Bernardino - Del Rosa 117.50 1,300.75 8 84.40 932.48 7 71.36 911.36 6 38,174.36 428,696.86<br />
2 Cal State - E Street - Loma Linda 128.95 1,535.94 11 92.22 1,243.93 8 71.90 956.25 8 41,547.00 507,237.77<br />
3 Baseline - Highland - San Bernardino 92.03 1,170.24 6 68.92 881.83 6 64.89 817.40 6 30,499.13 387,700.82<br />
4 Baseline - Highland - San Bernardino 85.08 1,077.24 6 66.00 837.92 6 65.42 831.74 6 28,587.06 362,242.66<br />
5 San Bernardino - Del Rosa - Cal State 65.97 807.96 4 47.30 584.08 4 48.80 603.62 4 21,874.06 268,442.30<br />
7 N. San Bdno - Sierra Way - San Bndo 82.70 958.87 6 48.00 601.31 4 23.42 287.28 2 24,931.02 292,105.24<br />
8 San Bernardino - Mentone - Yucaipa 90.66 1,311.12 6 39.58 563.41 3 29.80 450.00 2 26,889.08 389,389.46<br />
9 San Bernardino - Redlands - Yucaipa 94.00 1,795.81 6 40.22 604.21 3 36.46 540.27 4 28,122.46 521,083.25<br />
10 Fontana - Baseline - San Bernardino 106.66 1,406.74 8 55.34 730.32 4 25.67 338.85 2 31,594.45 416,736.27<br />
11 San Bernardino - Muscoy - Cal State 67.67 773.37 4 49.17 562.90 4 25.83 295.74 2 21,234.69 242,757.20<br />
14 Fontana - Foothill - San Bernardino 102.35 1,117.63 9 83.09 930.99 7 65.92 831.14 6 33,922.72 377,286.18<br />
14L San Berndardino -Fontana Limited Stop 4.00 37.22 1 No Service No Service No Service No Service No Service No Service 1,032.00 9,602.76<br />
15* Fontana - San Bndo/Highland - Redlands 122.62 1,601.09 8 95.93 1,248.15 8 88.53 1,152.20 8 40,947.49 534,250.92<br />
17 Redlands - Via San Bernardino Ave - San Bernardino 19.50 273.00 2 18.20 255.00 2 15.60 218.00 2 6,736.60 94,302.00<br />
18 San Bernardino - Via Sterling - San Manuel Casino 28.35 396.00 2 14.00 185.00 1 12.00 158.00 1 8,626.30 119,476.00<br />
19 Redlands - Colton - Fontana 204.24 2,500.36 14 77.92 909.78 7 45.33 502.25 4 58,901.75 716,196.63<br />
20 Fontana Metrolink - Via Hemlock - Kaiser 28.83 351.77 2 25.33 278.99 2 23.83 291.26 2 9,919.97 119,560.42<br />
21 San Bernardino - Via Rancho Ave - Colton 20.40 286.00 2 19.04 267.00 2 16.32 229.00 2 7,047.52 98,817.00<br />
22* ARMC - Riverside Ave - Fontana 177.87 2,490.00 11 131.14 1,837.00 8 58.58 410.00 4 55,435.04 755,180.00<br />
28* Southridge - Slover Ave - Kaiser 31.42 451.14 3 14.00 171.12 3 12.00 144.00 3 8,106.36 132,294.12<br />
29* Kaiser - North Rialto - Bloomington 56.59 792.00 4 54.02 756.00 4 41.16 576.00 4 14,600.22 271,512.00<br />
30 Red Trolley 15.30 214.20 1 14.92 110.94 1 11.80 100.30 1 5,295.20 65,925.90<br />
31 Blue Trolley 12.92 180.88 1 15.30 152.09 1 13.48 141.31 1 4,785.84 61,478.35<br />
140 Fontana - Chaffey College 1.53 21.42 0 No Service No Service No Service No Service No Service No Service 394.74 5,526.36<br />
202 San Bernardino - T.E.A.M. House 0.55 14.00 1 No Service No Service No Service No Service No Service No Service 141.90 1,560.90<br />
CityLink Santa Fe Depot - Dowtown San Bernardino 4.50 19.92 1 No Service No Service No Service No Service No Service No Service 1,161.00 12,771.00<br />
N.Y. Yucaipa - Oak Glen 16.00 143.36 1 14.00 125.44 1 12.00 107.52 1 4,128.00 36,986.88<br />
S.Y. Yucaipa - Beaver 16.00 215.68 1 14.00 188.72 1 12.00 161.76 1 4,128.00 55,645.44<br />
Sub-Total East Valley 1,794.19 23,243.71 129 1,182.04 14,958.61 97 892.10 11,055.25 82 558,763.96 7,284,764.69<br />
57 Chino Hills - Milliken - Chaffey College 104.35 1,461.00 7 56.16 785.00 4 37.44 523.00 4 31,639.74 442,861.00<br />
60 Ontario Conv Cntr - Chaffey College - Ont Mills 50.65 583.44 3 40.17 464.45 3 37.22 429.90 3 16,974.42 195,674.92<br />
61 Fontana - Ontario Mills - Pomona 199.28 2,591.94 14 190.00 2,215.87 16 93.00 1,085.23 8 65,657.24 927,294.45<br />
62 Montclair - Ontario - Chino 47.87 598.29 3 26.77 324.05 2 26.77 324.05 2 15,054.23 187,087.87<br />
63 Chino - Ontario - Upland 55.47 718.41 4 28.73 373.04 2 26.70 346.07 2 17,109.46 221,651.35<br />
64 Montclair - N Upland - Chaffey College 25.67 372.97 2 29.67 431.09 2 25.67 373.34 2 9,415.53 136,821.10<br />
65 Montclair - Chino Hills 69.10 903.00 4 29.60 387.67 2 26.60 348.80 2 20,664.40 270,146.30<br />
66 Fontana - Foothill - Montclair 155.00 2,170.00 12 71.09 995.26 5 70.76 857.90 6 59,642.26 834,991.64<br />
67 Ontario - Baseline - Fontana 98.28 1,375.92 6 40.75 502.37 3 40.75 502.37 3 27,393.74 380,105.86<br />
68 Chino - Montclair - Chaffey College 110.55 1,221.74 7 52.83 544.31 4 42.90 440.33 4 33,351.30 364,881.25<br />
70 Ontario - Creekside - Ontario Mills 29.92 418.88 3 16.83 235.62 2 14.83 207.62 2 9,317.19 130,440.66<br />
75* Ontario - Via Francis - Ontario Mills 39.52 553.28 3 No Service No Service No Service No Service No Service No Service 10,196.16 142,746.24<br />
71* Kaiser - South Ridge - Rancho Cucamonga 49.95 723.59 3 41.53 601.81 4 37.03 536.95 4 16,852.13 244,161.17<br />
90 Regional Express 150.75 3,618.00 9 75.37 1,997.20 5 46.53 1,163.00 4 45,035.03 1,092,617.00<br />
Sub-Total West Valley 1,186.36 17,310.46 80 699.50 9,857.74 54 526.20 7,138.56 46 378,302.83 5,571,480.81<br />
EV/WV Service Total 2,980.55 40,554.17 209 1,881.54 24,816.35 151 1,418.30 18,193.81 128 937,066.79 12,856,245.50
Financially Unconstrained Scenario –<br />
Fixed Route & Demand Response<br />
Services<br />
Service <strong>Plan</strong><br />
The Financially Unconstrained scenario assumes increased<br />
funding revenue sources and increased farebox revenues for<br />
the system. This scenario is designed as an incremental step<br />
over the Financially Constrained and the Up to Guidelines<br />
scenario. It expands service frequency on currently<br />
productive routes beyond service standards, expands the<br />
system coverage through the implementation of new eastwest<br />
and north-south services with high ridership potential,<br />
and provides coverage on transit-dependent areas that<br />
today receive little transit service.<br />
Figures V-21 through V-23 show the service plan for the<br />
Financially Unconstrained scenario.<br />
215
Section V<br />
Service <strong>Plan</strong><br />
216<br />
This page intentionally left blank.
Figure V-19<br />
217
Section V<br />
Service <strong>Plan</strong><br />
218<br />
Figure V-20
Route Changes<br />
The following changes are improvements and<br />
extensions in service above that of the Up-To-Design<br />
Scenario.<br />
TIER 1<br />
Route 2: Service frequency is improved on weekdays<br />
from 15 to 10 minutes throughout the day with 15-minute<br />
frequency in the evening to complement the future BRT<br />
service to be implemented on this route.<br />
Route 14: Service frequency is improved from 15 to 10<br />
minutes on weekdays.<br />
Route 15: Service frequency is improved from 30 to 15<br />
minutes on weekdays. The Citrus Plaza loop will be<br />
eliminated because the new Route 17 will cover this area.<br />
Route 18: This route will improve service frequency from<br />
30 minutes to 15-minute frequency on weekdays and<br />
weekends.<br />
Route 22: Route 22 will be split into two branches north<br />
of Highland and Riverside. Existing trunk of Route 22 will<br />
remain the same from Arrowhead Medical Center to North<br />
Rialto. At Cactus @ Bonhert, branch 22A will travel WB<br />
Bonhert, NB Locust, WB Casa Grande, NB Terra Vista, NB<br />
Live Oak, NB Riverside, and SB Sierra to Fontana Metrolink.<br />
A connection will be made with North Rialto and the<br />
Fontana Metrolink. From Cactus @ Bonhert, 22B will travel<br />
WB Bonhert, NB Locust, WB Casa Grande, SB Sierra, WB<br />
Summit, SB San Sevaine, WB Highland, SB Rochester, EB<br />
Baseline, SB Victoria Park, WB Foothill, SB Milliken to Rancho<br />
Cucamonga Metrolink. Route 22B will serve Summit<br />
residential and commercial sites. Both loops will be<br />
operating at 15 minute frequency on weekdays, 20 minutes<br />
on Saturdays, and 30 minutes on Sundays.<br />
Route 57: Service frequency is planned for 15 minutes on<br />
weekdays and half-hourly service on weekends.<br />
Route 66: Service frequency is improved to 10 minutes on<br />
weekdays and weekends.<br />
219
Route 90: Service frequency is improved to 15 minutes on<br />
weekdays. Saturday and Sunday service frequency will be<br />
15 minutes from downtown San Bernardino to Riverside and<br />
30 minutes from downtown San Bernardino to Colton and<br />
Montclair.<br />
Yucaipa Circulator: This route will run every 15 minutes on<br />
weekdays and half hourly on weekends.<br />
TIER 2<br />
Route 17: Service frequency is planned for 30 minutes on<br />
weekdays and weekends.<br />
Route 20A: This route will travel from Fontana Metrolink,<br />
WB Merrill, NB Cherry, EB Highland, and NB Beech to the<br />
Park and Ride in North Highland. Service frequency will be<br />
half-hourly on weekdays and weekends.<br />
Route 20B: This route will travel from South Fontana TC, SB<br />
Sierra, WB Randall, SB Citrus, WB Valley, NB Cherry, EB<br />
Highland, and NB Beech to the Park and Ride in North<br />
Highland. Service frequency will be half-hourly on weekdays<br />
and weekends.<br />
Route 67: Route 67 will undergo an alignment extension<br />
on the west side of the route. Specifically, the alignment will<br />
continue WB on Baseline and SB Monte Vista to the<br />
Montclair Transcenter. Current service to the Ontario<br />
Transcenter will be eliminated and replaced by the new<br />
Route 78. The re-alignment of Route 67 will provide service<br />
on Baseline between Monte Vista and Euclid. Service<br />
frequency is improved from 60 to 30 minutes on weekdays.<br />
Route 70: Service frequency is improved from 60 to 30<br />
minutes on weekdays and weekends.<br />
Route 75: Service frequency is improved from 60 to 30<br />
minutes on weekdays and will be provided all day (not<br />
exclusively am peak and pm peak). Service will be added on<br />
Saturday and Sunday at 30-minute frequencies.<br />
TIER 3<br />
Route 30 (Red Line): There will be an addition to the<br />
alignment in the western end of the route. From Lugonia &<br />
Section V<br />
Service <strong>Plan</strong><br />
220
Indiana Court, continue WB Lugonia, SB Alabama, returning<br />
to Redlands Mall. This route modification will provide service<br />
to Target, Kmart, and ESRI. This route will maintain 60-<br />
minute frequency on weekdays and weekends.<br />
Route 140: Will be canceled due to the duplication of<br />
services. The southern end (Fontana Metrolink) and<br />
southern end (Chaffey College) will be replaced by the new<br />
Route 27. Service currently served by route 140 on Baseline<br />
between Cherry and Haven remains covered by Route 67.<br />
New Routes<br />
TIER 2<br />
Route 27: Route 27 will align from Fontana Metrolink, WB<br />
Arrow, SB Milliken, WB into Rancho Cucamonga Metrolink,<br />
NB Milliken, WB Arrow, and NB Haven to Chaffey College.<br />
This route will run every half hour on weekdays and<br />
weekends.<br />
Route 74: Route 74 will travel from Rancho Cucamonga<br />
Metrolink, SB Milliken, NW Mission, SB Archibald, WB<br />
Riverside, SB Euclid, WB Edison, NB into Chino TC. This route<br />
will run every half hour on weekdays and hourly on<br />
weekends.<br />
Route 78: This route will travel beginning on Holt &<br />
Vineyard, WB Holt, NB Corona, EB “D”, SB Vineyard, EB<br />
Airport Drive, NB Archibald, WB 19TH, SB Euclid to Ontario<br />
Transcenter. This alignment will serve the “Colonies<br />
Crossroads” shopping center along with new residents and<br />
schools. Service frequency will be half-hourly on weekdays<br />
and weekends.<br />
Route 210: Route 210 will be an express freeway service.<br />
From Redlands TC, I-210 to the pick up point in Highland,<br />
WB on I-210 to Riverside Avenue in Rialto, WB I-210 to<br />
Cherry in Fontana Park and Ride, WB I-210 to Montclair TC.<br />
This route will operate every half hour on weekdays and<br />
weekends. This express service will provide connections to<br />
Metrolink’s Gold Line (to Pasadena and Los Angeles) at<br />
Montclair TC in 2014, when the Gold Line is expected to be<br />
completed.<br />
221
OMNILINK<br />
Upland Omnilink: Will cover residential developments<br />
along the foothills.<br />
Rancho Cucamonga Omnilink: Will cover North<br />
Rancho Cucamonga and North Fontana and also<br />
provide peak hour service to Corona Metrolink.<br />
Highland Omnilink: Will cover residential<br />
developments along the foothills.<br />
Devore/North San Bernardino/North Rialto Omnilink:<br />
Will cover Hallmark Park with Wal-Mart as well as<br />
many residents in that vicinity.<br />
South Loma Linda Omnilink: Will cover south<br />
Loma Linda.<br />
Chino Hills Omnilink: Will cover Chino Hills and also<br />
provide peak hour service to Brea Mall on weekdays<br />
and weekends and Corona and Industry Metrolinks<br />
on weekdays.<br />
Grand Terrace Omnilink: Will serve Grand Terrace<br />
and provide peak hour service to Riverside<br />
Transcenter.<br />
South Fontana/South Rialto Omnilink: Will serve the<br />
residential and industrial areas of South Fontana and<br />
South Rialto.<br />
Resource Requirements<br />
The Financially Unconstrained Scenario requires 682,509<br />
additional hours from the Constrained Scenario and 125<br />
more peak vehicles to maintain a fleet average of 72,982<br />
miles per year. This would add about 10,074,556 annual<br />
miles. About 43 percent of the additional hours are on<br />
weekdays, and 57 percent are on weekends.<br />
A complete detail of service changes and frequencies for this<br />
scenario is shown in Figures V-21 through V-23.<br />
Figure V-24 shows the Unconstrained Bus Service Hours,<br />
Miles and Peak Fleet by Route and Division.<br />
Section V<br />
Service <strong>Plan</strong><br />
222
Figure V-21: Financially Unconstrained Scenario – FY <strong>2006</strong> Weekday Service Frequencies by Route and Division<br />
Unconstrained FY <strong>2006</strong> Weekday Frequency (in minutes)<br />
Route Route Name Before AM Peak AM Peak Midday PM Peak Early Evening Late Evening Service Hours<br />
Until 5:59 6:00 - 8:59 9:00 - 14:59 15:00 - 17:59 18:00 - 19:59 Beyond 20:00<br />
1 ARMC - San Bernardino - Del Rosa 15/30' 15/30' 15/30' 15/30' 15/30' 15/30' 4:30 - Midnight Legend<br />
2 Cal State - E Street - Loma Linda 10 10 10 10 10 10 3:00 - Midnight New Route<br />
3 Baseline - Highland - San Bernardino 10 10 10 10 10 10 3:00 - Midnight Hourly<br />
4 Baseline - Highland - San Bernardino 10 10 10 10 10 10 3:00 - Midnight Half Hourly<br />
5 San Bernardino - Del Rosa - Cal State 30 30 30 30 30 30 4:30 - Midnight 20 Minutes<br />
7 N. San Bernardino - Sierra Way - San Bndo 15/30' 15/30' 15/30' 15/30' 15/30' 15/30' 4:30 - Midnight 15 Minutes<br />
8 San Bernardino - Mentone - Yucaipa 30 30 30 30 30 30 4:30 - Midnight 10 Minutes<br />
9 San Bernardino - Redlands - Yucaipa 30 30 30 30 30 30 3:00 - Midnight<br />
10 Fontana - Baseline - San Bernardino 15 15 15 15 15 15 4:30 - Midnight<br />
11 San Bernardino - Muscoy - Cal State 30 30 30 30 30 30 3:00 - Midnight<br />
14 Fontana - Foothill - San Bernardino 10 10 10 10 10 10 3:00 - Midnight<br />
14L Fontana - San Bernardino Limted Stop Service LS LS No Service No Service No Service No Service 5:00 - 9:00<br />
15 Fontana - San Bndo/Highland - Redlands 15 15 15 15 15 15 4:30 - Midnight<br />
17 Redlands - Via San Bernardino Ave - San Bernardino 30 30 30 30 30 30 4:30 - Midnight<br />
18 San Bernardino - Via Sterling - San Manuel Casino 15 15 15 15 15 15 3:00 - Midnight<br />
19 Redlands - Colton - Fontana 15 15 15 15 15 15 3:00 - Midnight<br />
20A* Fontana - Merrill - Highland 30 30 30 30 30 30 4:30 - Midnight<br />
20B* Fontana - Valley - Highland 30 30 30 30 30 30 4:30 - Midnight<br />
21 San Bernardino - Via Rancho Ave - Colton 60 60 60 60 60 60 4:30 - Midnight<br />
22A ARMC - Riverside Ave - Fontana 15 15 15 15 15 15 4:30 - Midnight<br />
22B* ARMC - Summit - Rancho Cucamonga 15 15 15 15 15 15 4:30 - Midnight<br />
27 Fontana - Rancho Cucamonga - Chaffey College 30 30 30 30 30 30 4:30 - Midnight<br />
28 Southridge - Sierra Ave - North Fontana 60 60 60 60 60 60 4:30 - Midnight<br />
29 Kaiser - North Rialto - Bloomington 60 60 60 60 60 60 4:30 - Midnight<br />
30* Redlands Trolley (Red Line) 60 60 60 60 60 60 4:30 - 22:00<br />
31 Redlands Trolley (Blue Line) 60 60 60 60 60 60 4:30 - 22:00<br />
57 Chino Hills - Milliken - Chaffey College 15 15 15 15 15 15 3:00 - Midnight<br />
60 Ontario Conv Cntr - Chaffey College - Ont Mills 60 60 60 60 60 60 4:30 - Midnight<br />
61 Fontana - Ontario Mills - Pomona 15 15 15 15 15 15 3:00 - Midnight<br />
62 Montclair - Ontario - Chino 30 30 30 30 30 30 3:00 - Midnight<br />
63 Chino - Ontario - Upland 30 30 30 30 30 30 4:30 - Midnight<br />
64 Montclair - N Upland - Chaffey College 60 60 60 60 60 60 4:30 - Midnight<br />
65 Montclair - Chino Hills 30 30 30 30 30 30 3:00 - Midnight<br />
66 Fontana - Foothill - Montclair 10 10 10 10 10 10 3:00 - Midnight<br />
67* Montclair - Ontario - Fontana 30 30 30 30 30 30 4:30 - Midnight<br />
68 Chino - Montclair - Chaffey College 30 30 30 30 30 30 4:30 - Midnight<br />
70 Ontario - Creekside - Ontario Mills 30 30 30 30 30 30 3:00 - Midnight<br />
71 Kaiser - South Ridge - Ontario 60 60 60 60 60 60 3:00 - Midnight<br />
74 Rancho Cucamonga - Riverside - Chino 30 30 30 30 30 30 3:00 - Midnight<br />
75 Ontario - Mission - Pomona 30 30 30 30 30 30 4:30 - Midnight<br />
78 Ontario - Archibald -North Rancho Cucamonga 30 30 30 30 30 30 4:30 - Midnight<br />
90 Regional Express 15 15 15 15 15 15 3:00 - Midnight<br />
202 San Bernardino - T.E.A.M. House No Service AM Peak Tripper Midday Tripper No Service No Service No Service 2 Trips a Day<br />
210 Regional Express 30 30 30 30 30 30 3:00 - Midnight<br />
CityLink Santa Fe Depot - Downtown San Bernardino Feeder Feeder No Service Feeder Feeder No Service 6 Trips a Day<br />
N.Y./S.Y. Yucaipa - Oakland - Beaver Medical Center 15 15 15 15 15 15 4:30 - Midnight<br />
Colored Cells indicate new routes/service upgrades and * indicates alignment extensions beyond Up To Design Scenario.<br />
223
Section V<br />
Service <strong>Plan</strong><br />
224<br />
Figure V-22: Financially Unconstrained Scenario FY <strong>2006</strong> Saturday Service Frequencies by Route and Division<br />
Unconstrained FY <strong>2006</strong> Saturday Frequency (in minutes)<br />
Route Route Name Before AM Peak AM Peak Midday PM Peak Early Evening Late Evening Service Hours<br />
Until 5:59 6:00 - 8:59 9:00 - 14:59 15:00 - 17:59 18:00 - 19:59 Beyond 20:00<br />
1 ARMC - San Bernardino - Del Rosa 15/30' 15/30' 15/30' 15/30' 15/30' 15/30' 5:30 - 22:00 Legend<br />
2 Cal State - E Street - Loma Linda 15 15 15 15 15 15 5:30 - Midnight New Route<br />
3 Baseline - Highland - San Bernardino 15/30' 15/30' 15 15 15 15 5:30 - Midnight Hourly<br />
4 Baseline - Highland - San Bernardino 15/30' 15/30' 15 15 15 15 5:30 - Midnight Half Hourly<br />
5 San Bernardino - Del Rosa - Cal State 30 30 30 30 30 30 5:30 - 22:00 20 Minutes<br />
7 N. San Bernardino - Sierra Way - San Bndo 30 30 30 30 30 30 5:30 - 22:00 15 Minutes<br />
8 San Bernardino - Mentone - Yucaipa 60 60 60 60 60 60 5:30 - 22:00 10 Minutes<br />
9 San Bernardino - Redlands - Yucaipa 60 60 60 60 60 60 5:30 - Midnight<br />
10 Fontana - Baseline - San Bernardino 30 30 30 30 30 30 5:30 - 22:00<br />
11 San Bernardino - Muscoy - Cal State 30 30 30 30 30 30 5:30 - Midnight<br />
14 Fontana - Foothill - San Bernardino 15 15 15 15 15 15 5:30 - Midnight<br />
15 Fontana - San Bndo/Highland - Redlands 30 30 30 30 30 30 5:30 - 22:00<br />
17 Redlands - Via San Bernardino Ave - San Bernardino 30 30 30 30 30 30 5:30 - 22:00<br />
18 San Bernardino - Via Sterling - San Manuel Casino 15 15 15 15 15 15 5:30 - Midnight<br />
19 Redlands - Colton - Fontana 30 30 30 30 30 30 5:20 - Midnight<br />
20A* Fontana - Merrill - Highland 30 30 30 30 30 30 5:30 - 22:00<br />
20B* Fontana - Valley - Highland 30 30 30 30 30 30 5:30 - 22:00<br />
21 San Bernardino - Via Rancho Ave - Colton 60 60 60 60 60 60 5:30 - 22:00<br />
22A ARMC - Riverside Ave - Fontana 20 20 20 20 20 20 5:30 - 22:00<br />
22B* ARMC - Summit - Rancho Cucamonga 20 20 20 20 20 20 5:30 - 22:00<br />
27 Fontana - Rancho Cucamonga - Chaffey College 30 30 30 30 30 30 5:30 - 22:00<br />
28 Southridge - Sierra Ave - North Fontana 60 60 60 60 60 60 5:30 - 22:00<br />
29 Kaiser - North Rialto - Bloomington 60 60 60 60 60 60 5:30 - 22:00<br />
30* Redlands Trolley (Red Line) 60 60 60 60 60 60 5:30 - 23:00<br />
31 Redlands Trolley (Blue Line) 60 60 60 60 60 60 5:30 - 23:00<br />
57 Chino Hills - Milliken - Chaffey College 30 30 30 30 30 30 5:30 - Midnight<br />
60 Ontario Conv Cntr - Chaffey College - Ont Mills 60 60 60 60 60 60 5:30 - 22:00<br />
61 Fontana - Ontario Mills - Pomona 15 15 15 15 15 15 5:30 - Midnight<br />
62 Montclair - Ontario - Chino 30 30 30 30 30 30 5:30 - Midnight<br />
63 Chino - Ontario - Upland 60 60 60 60 60 60 5:30 - 22:00<br />
64 Montclair - N Upland - Chaffey College 60 60 60 60 60 60 5:30 - 23:00<br />
65 Montclair - Chino Hills 60 60 60 60 60 60 5:30 - Midnight<br />
66 Fontana - Foothill - Montclair 10 10 10 10 10 10 5:30 - Midnight<br />
67* Montclair - Ontario - Fontana 60 60 60 60 60 60 5:30 - 22:00<br />
68 Chino - Montclair - Chaffey College 60 60 60 60 60 60 5:30 - 22:00<br />
70 Ontario - Creekside - Ontario Mills 30 30 30 30 30 30 5:30 - Midnight<br />
71 Kaiser - South Ridge - Ontario 60 60 60 60 60 60 5:30 - Midnight<br />
74 Rancho Cucamonga - Riverside - Chino 60 60 60 60 60 60 5:30 - Midnight<br />
75 Ontario - Mission - Pomona 30 30 30 30 30 30 5:30 - 22:00<br />
78 Ontario - Archibald -North Rancho Cucamonga 30 30 30 30 30 30 5:30 - Midnight<br />
90 Inland Empire Connection 15/30' 15/30' 15/30' 15/30' 15/30' 15/30' 5:30 - Midnight<br />
202 San Bernardino - T.E.A.M. House No Service No Service No Service No Service No Service No Service Tripper<br />
210 Regional Express 30 30 30 30 30 30 5:30 - Midnight<br />
N.Y./S.Y. Yucaipa - Oakland - Beaver Medical Center 30 30 30 30 30 30 5:30 - Midnight<br />
Colored Cells indicate new routes/service upgrades and * indicates alignment extensions beyond Up To Design Scenario.
Figure V-23: Financially Unconstrained Scenario FY <strong>2006</strong> Sunday Service Frequencies by Route and Division<br />
Unconstrained FY <strong>2006</strong> Sunday Frequency (in minutes)<br />
Route Route Name Before AM Peak AM Peak Midday PM Peak Early Evening Late Evening Service Hours<br />
Until 5:59 6:00 - 8:59 9:00 - 14:59 15:00 - 17:59 18:00 - 19:59 Beyond 20:00<br />
1 ARMC - San Bernardino - Del Rosa 15/30' 15/30' 15/30' 15/30' 15/30' 15/30' 5:30 - 22:00 Legend<br />
2 Cal State - E Street - Loma Linda 15 15 15 15 15 15 5:30 - Midnight New Route<br />
3 Baseline - Highland - San Bernardino 15/30' 15/30' 15 15 15 15 5:30 - Midnight Hourly<br />
4 Baseline - Highland - San Bernardino 15/30' 15/30' 15 15 15 15 5:30 - Midnight Half Hourly<br />
5 San Bernardino - Del Rosa - Cal State 30 30 30 30 30 30 5:30 - 22:00 20 Minutes<br />
7 N. San Bernardino - Sierra Way - San Bndo 60 60 60 60 60 60 5:30 - 22:00 15 Minutes<br />
8 San Bernardino - Mentone - Yucaipa 60 60 60 60 60 60 5:30 - 22:00 10 Minutes<br />
9 San Bernardino - Redlands - Yucaipa 60 60 60 60 60 60 5:30 - Midnight<br />
10 Fontana - Baseline - San Bernardino 60 60 60 60 60 60 5:30 - 22:00<br />
11 San Bernardino - Muscoy - Cal State 60 60 60 60 60 60 5:30 - Midnight<br />
14 Fontana - Foothill - San Bernardino 15 15 15 15 15 15 5:30 - Midnight<br />
15 Fontana - San Bndo/Highland - Redlands 30 30 30 30 30 30 5:30 - 22:00<br />
17 Redlands - Via San Bernardino Ave - San Bernardino 30 30 30 30 30 30 5:30 - 22:00<br />
18 San Bernardino - Via Sterling - San Manuel Casino 15 15 15 15 15 15 5:30 - Midnight<br />
19 Redlands - Colton - Fontana 30 30 30 30 30 30 5:15- Midnight<br />
20A* Fontana - Merrill - Highland 30 30 30 30 30 30 5:30 - 22:00<br />
20B* Fontana - Valley - Highland 30 30 30 30 30 30 5:30 - 22:00<br />
21 San Bernardino - Via Rancho Ave - Colton 60 60 60 60 60 60 5:30 - 22:00<br />
22A ARMC - Riverside Ave - Fontana 30 30 30 30 30 30 5:30 - 22:00<br />
22B* ARMC - Summit - Rancho Cucamonga 30 30 30 30 30 30 5:30 - 22:00<br />
27 Fontana - Rancho Cucamonga - Chaffey College 30 30 30 30 30 30 5:30 - 22:00<br />
28* Southridge - Sierra Ave - North Fontana 60 60 60 60 60 60 5:30 - 22:00<br />
29* Kaiser - North Rialto - Bloomington 60 60 60 60 60 60 5:30 - 22:00<br />
30* Redlands Trolley (Red Line) 60 60 60 60 60 60 5:30 - 23:00<br />
31 Redlands Trolley (Blue Line) 60 60 60 60 60 60 5:30 - 23:00<br />
57 Chino Hills - Milliken - Chaffey College 30 30 30 30 30 30 5:30 - Midnight<br />
60 Ontario Conv Cntr - Chaffey College - Ont Mills 60 60 60 60 60 60 5:30 - 22:00<br />
61 Fontana - Ontario Mills - Pomona 15 15 15 15 15 15 5:30 - Midnight<br />
62 Montclair - Ontario - Chino 30 30 30 30 30 30 5:30 - Midnight<br />
63 Chino - Ontario - Upland 60 60 60 60 60 60 5:30 - 22:00<br />
64 Montclair - N Upland - Chaffey College 60 60 60 60 60 60 5:30 - 23:00<br />
65 Montclair - Chino Hills 60 60 60 60 60 60 5:30 - Midnight<br />
66 Fontana - Foothill - Montclair 10 10 10 10 10 10 5:30 - Midnight<br />
67* Montclair - Ontario - Fontana 60 60 60 60 60 60 5:30 - 22:00<br />
68 Chino - Montclair - Chaffey College 60 60 60 60 60 60 5:30 - 22:00<br />
70 Ontario - Creekside - Ontario Mills 30 30 30 30 30 30 5:30 - Midnight<br />
71 Kaiser - South Ridge - Ontario 60 60 60 60 60 60 5:30 - Midnight<br />
74 Rancho Cucamonga - Riverside - Chino 60 60 60 60 60 60 5:30 - Midnight<br />
75 Ontario - Mission - Pomona 30 30 30 30 30 30 5:30 - 22:00<br />
78 Ontario - Archibald -North Rancho Cucamonga 30 30 30 30 30 30 5:30 - Midnight<br />
90 Inland Empire Connection 15/30' 15/30' 15/30' 15/30' 15/30' 15/30' 5:30 - Midnight<br />
202 San Bernardino - T.E.A.M. House No Service No Service No Service No Service No Service No Service Tripper<br />
210 Regional Express 30 30 30 30 30 30 5:30 - Midnight<br />
N.Y./S.Y. Yucaipa - Oakland - Beaver Medical Center 30 30 30 30 30 30 5:30 - Midnight<br />
Colored Cells indicate new routes/service upgrades and * indicates alignment extensions beyond Up To Design Scenario.<br />
225
Section V<br />
Service <strong>Plan</strong><br />
226<br />
Figure V-24: Financially Unconstrained Scenario FY <strong>2006</strong> Hours and Miles<br />
Unconstrained Scenario FY <strong>2006</strong> Weekday Saturday Sunday<br />
Annually<br />
Route Route Name<br />
Revenue Revenue Revenue Revenue Revenue Revenue Revenue Revenue<br />
Hours Miles # Veh Hours Miles # Veh Hours Miles # Veh Hours Miles<br />
1 ARMC - San Bernardino - Del Rosa 177.61 2,486.54 9 148.50 1,486.14 9 75.02 958.10 6 57,074.40 764,697.42<br />
2 Cal State - E Street - Loma Linda 169.01 2,001.61 11 95.38 1,281.34 8 76.73 1,013.43 8 52,286.81 632,167.31<br />
3 Baseline - Highland - San Bernardino 124.62 1,584.77 8 72.25 924.20 6 69.90 880.38 6 39,329.36 499,980.04<br />
4 Baseline - Highland - San Bernardino 116.65 1,476.92 8 71.10 902.49 6 69.52 883.95 6 37,196.22 471,251.31<br />
5 San Bernardino - Del Rosa - Cal State 67.17 822.91 4 50.10 618.40 4 51.02 631.01 4 22,436.88 275,412.29<br />
10 Fontana - Baseline - San Bernardino 108.96 1,437.13 8 55.00 717.00 4 26.33 347.59 2 32,204.51 424,356.63<br />
11 San Bernardino - Muscoy - Cal State 69.84 797.60 4 50.76 581.12 4 28.92 331.21 2 22,031.64 251,728.51<br />
14 Fontana - Foothill - San Bernardino 138.12 1,508.29 12 83.34 933.79 9 68.84 871.34 6 43,312.80 480,266.66<br />
14L San Berndardino -Fontana Limited Stop 4.00 37.22 1 No Service No Service No Service No Service No Service No Service 1,032.00 9,602.76<br />
15 Fontana - San Bndo/Highland - Redlands 247.24 3,228.63 16 96.14 1,250.89 8 91.74 1,193.96 8 73,273.66 956,423.00<br />
17 Redlands - Via San Bernardino Ave - San Bernardino 50.70 710.00 3 42.90 601.00 3 42.90 601.00 3 17,413.50 243,881.00<br />
18 San Bernardino - Via Sterling - San Manuel Casino 79.17 1,109.00 4 69.75 977.00 4 69.75 977.00 4 27,470.61 384,799.00<br />
19 Redlands - Colton - Fontana 207.65 2,541.86 14 80.51 990.44 7 97.84 1,074.78 8 62,589.04 760,135.66<br />
20A* Fontana - Merrill - Highland 35.49 496.00 2 30.03 420.00 2 30.03 420.00 2 12,189.45 170,388.00<br />
20B* Fontana - Valley - Highland 45.63 638.00 3 38.61 540.00 3 38.61 540.00 3 15,672.15 219,144.00<br />
21 San Bernardino - Via Rancho Ave - Colton 26.52 372.00 2 22.44 315.00 2 22.44 315.00 2 9,108.60 127,791.00<br />
22A ARMC - Riverside Ave - Fontana 210.21 2,942.00 11 133.32 1,867.00 8 88.94 1,245.00 6 65,436.12 915,881.00<br />
22B* ARMC - Summit - Rancho Cucamonga 134.16 1,879.00 7 113.52 1,590.00 7 113.52 1,590.00 7 46,078.80 645,372.00<br />
27 Fontana - Rancho Cucamonga - Chaffey College 72.15 1,010.00 4 61.05 855.00 4 61.05 855.00 4 24,780.75 346,935.00<br />
28 Southridge - Slover Ave - Kaiser 31.42 451.14 3 12.00 116.52 3 12.00 144.00 3 9,318.36 129,564.12<br />
29 Kaiser - North Rialto - Bloomington 66.89 936.00 4 56.60 792.00 4 56.60 792.00 4 22,974.22 321,480.00<br />
202 San Bernardino - T.E.A.M. House 0.55 3.02 1 No Service No Service No Service No Service No Service No Service 141.90 1,560.90<br />
CityLink Santa Fe Depot - Dowtown San Bernardino 4.50 19.92 1 No Service No Service No Service No Service No Service No Service 1,161.00 12,771.00<br />
Sub-Total East Valley 2,188.26 28,489.56 140 1,383.30 17,759.33 105 1,191.70 15,664.75 94 694,512.78 9,045,588.61<br />
57 Chino Hills - Milliken - Chaffey College 261.66 3,664.00 13 115.26 1,614.00 7 115.26 1,614.00 7 79,149.54 1,108,326.00<br />
60 Ontario Conv Cntr - Chaffey College - Ont Mills 52.05 599.57 3 37.77 436.81 3 37.82 436.92 3 17,246.22 198,812.48<br />
61 Fontana - Ontario Mills - Pomona 200.59 2,608.98 14 191.35 2,224.32 16 189.35 2,206.96 16 70,976.57 896,887.80<br />
62 Montclair - Ontario - Chino 52.26 653.17 3 54.14 757.96 4 54.14 757.96 4 18,951.22 245,071.82<br />
63 Chino - Ontario - Upland 58.14 752.99 4 28.36 368.24 2 29.33 380.17 2 17,913.95 232,072.09<br />
64 Montclair - N Upland - Chaffey College 32.07 465.96 2 29.34 426.30 2 27.34 397.64 2 11,135.40 161,812.32<br />
65 Montclair - Chino Hills 71.77 937.90 4 31.18 408.33 2 29.18 382.75 2 21,563.84 281,914.95<br />
66 Fontana - Foothill - Montclair 231.34 3,275.18 15 172.75 2,427.61 15 104.74 1,388.25 9 73,664.96 1,037,177.69<br />
67* Montclair - Ontario - Fontana 115.44 1,616.16 6 46.53 651.00 3 46.53 651.00 3 34,483.05 482,720.28<br />
68 Chino - Montclair - Chaffey College 111.89 1,236.55 7 51.63 531.04 4 45.70 469.11 4 33,779.82 369,506.51<br />
70 Ontario - Creekside - Ontario Mills 56.80 795.20 6 30.29 422.62 4 30.29 422.62 4 17,713.69 247,846.22<br />
71 Kaiser - South Ridge - Rancho Cucamonga 52.34 758.23 3 43.14 625.15 3 38.64 560.33 3 17,631.36 255,457.67<br />
74 Rancho Cucamonga - Riverside - Chino 106.26 1,488.00 5 46.81 656.00 3 46.81 656.00 3 32,142.89 450,160.00<br />
75 Ontario - Via Francis - Ontario Mills 97.50 1,365.00 5 82.50 1,155.00 5 82.50 1,155.00 5 97.50 352,170.00<br />
78 Ontario - Archibald -North Rancho Cucamonga 91.06 1,276.00 5 86.39 1,211.00 5 86.39 1,211.00 5 32,218.87 451,519.00<br />
Sub-Total West Valley 1,591.17 21,492.89 95 1,047.44 13,915.38 78 964.02 12,689.71 72 478,668.88 6,771,454.83<br />
EV/WV Service Total 3,779.43 49,982.45 235 2,430.74 31,674.71 183 2,155.72 28,354.46 166 1,173,181.66 15,817,043.44<br />
7 N. San Bdno - Sierra Way - San Bndo 87.70 1,016.84 6 52.00 651.42 4 24.92 307.72 2 26,497.52 310,609.44<br />
8 San Bernardino - Mentone - Yucaipa 92.16 1,332.72 6 38.42 558.10 3 33.64 506.48 2 27,413.92 397,577.24<br />
9 San Bernardino - Redlands - Yucaipa 95.50 1,824.25 6 41.80 634.38 3 37.04 548.87 4 28,618.04 530,367.87<br />
30* Red Trolley 19.30 270.20 2 16.42 121.52 2 14.80 128.05 2 6,555.20 82,318.15<br />
31 Blue Trolley 17.42 243.88 1 17.34 171.68 1 15.57 166.70 1 6,155.43 80,006.74<br />
90 Regional Express 339.45 8,146.80 16 175.50 4,212.00 9 175.50 4,212.00 9 105,303.60 2,527,286.40<br />
210 Regional Express 103.53 1,451.00 5 91.21 1,278.00 5 91.21 1,278.00 5 35,922.95 503,436.00<br />
N.Y Yucaipa - Oak Glen 19.50 349.44 2 18.50 165.76 1 18.50 165.76 1 6,899.50 106,897.28<br />
S.Y. Yucaipa - Beaver Medical Center 19.50 525.72 2 18.50 249.38 1 18.50 249.38 1 6,899.50 160,823.14<br />
Sub-Total Contract 794.06 15,160.85 46 469.69 8,042.24 29 429.68 7,562.96 27 250,265.66 4,699,322.26<br />
Total 4,573.49 65,143.30 281 2,900.43 39,716.95 212 2,585.40 35,917.42 193 1,423,447.32 20,516,365.70
Financially Unconstrained Scenario –<br />
Bus Rapid <strong>Transit</strong> Element<br />
Bus Rapid <strong>Transit</strong><br />
The concept of Bus Rapid <strong>Transit</strong> – or BRT as it is more<br />
commonly referred to – was born in the San Bernardino<br />
Valley out of a Study <strong>Omnitrans</strong> completed in early fiscal year<br />
2004. This Future <strong>Transit</strong> Investment Study was primarily<br />
conducted to determine what, if any, transit needs could be<br />
identified for the long-range (i.e., 2010 – 2030). As this SRTP<br />
covers the beginning years of that time period, it is important<br />
to address some of the considerations that came out of the<br />
study, and particularly the application of BRT in the San<br />
Bernardino Valley. It is also important to note that the<br />
implementation of BRT hinged on the success of passing the<br />
reauthorization of Measure I, which occurred in November<br />
2004.<br />
BRT improves the lives of residents in many ways, from<br />
guaranteeing access and mobility for everyone to fostering<br />
economic vitality and protecting the environment. Exclusive<br />
transitways, modern stations, high-tech vehicles and<br />
frequent service – BRT combines these features to provide<br />
the high level of service that people have come to expect<br />
from more expensive transit systems. BRT has advantages<br />
because it can be built and improved incrementally, and it is<br />
flexible enough to serve both densely populated cities and<br />
less concentrated suburbs. BRT is also convenient because<br />
systems can be designed so that vehicles – not passengers –<br />
transfer from local routes to high-speed lines. Although BRT<br />
is a relatively new form of transit, existing systems in the<br />
United States and around the world have integrated BRT<br />
with great success into their existing transit systems, by<br />
carefully integrating transportation planning, land<br />
use/zoning regulations and policies, and aggressive traffic<br />
enforcement. BRT encompasses what good public transit is<br />
characterized by: speed, comfort, reliability, and rider<br />
satisfaction.<br />
Rail transit along E Street in<br />
Downtown San Bernardino in<br />
the early 1900’s. A modern BRT<br />
along E Street will mimick this<br />
service in a cost-efficient way.<br />
Future <strong>Transit</strong> Demand<br />
Although we cannot predict the future exactly, we cannot<br />
ignore it either. Some aspects of the future seem fairly<br />
certain:<br />
227
The number of people and jobs in the Valley will increase<br />
over time. Between 2010 and 2030 population will increase<br />
from 1.3 million to 1.6 million (a 24% increase), and jobs will<br />
increase from 580,000 to 730,000 (a 26% increase). This<br />
comes on top of a population gain of 300,000 people<br />
between 2000 and 2010.<br />
More people mean more trips, more cars, more traffic and<br />
pollution.<br />
<strong>Transit</strong> can help mitigate the problems caused by these<br />
increases, if additional resources are found to allow transit<br />
services to keep up with the expected population and<br />
employment growth.<br />
<strong>Transit</strong> investments create jobs. Every $10 million invested in<br />
public transportation capital projects generates about 300<br />
jobs. Investments in transit operations yield about 600 jobs<br />
for every $10 million spent.<br />
<strong>Omnitrans</strong> has an historic opportunity to shape<br />
transportation funding and, by extension, the quality of life<br />
in the San Bernardino Valley for the foreseeable future.<br />
While the population will grow substantially in the San<br />
Bernardino Valley, the composition of the population will be<br />
different in 2030. On a countywide basis, 20% of the<br />
population will be above sixty years of age in 2030<br />
compared to a 12% share in 2000. The proportion of the<br />
population countywide between the ages of 15 and 29 will<br />
remain at about 23%. However, the absolute number of<br />
young people in the Valley will grow from about 230,000 to<br />
368,300 persons. All of these people will be looking towards<br />
options they have available for transportation, as growing<br />
congestion from automobiles is inevitable.<br />
BRT offers a high quality service compared to conventional<br />
bus services. As such, BRT is quickly becoming the<br />
transportation investment of choice for growing urbanized<br />
areas around the nation. Its proven technology, speed,<br />
comfort and carrying capacity have made it an attractive and<br />
viable transit service.<br />
Section V<br />
Service <strong>Plan</strong><br />
228
BRT is often referred to as “light rail on rubber wheels”, since<br />
almost all of the qualities and amenities of BRT mirror those<br />
of light rail. It is fast, at least 50% faster than regular bus<br />
services, because it operates in an exclusive or semi exclusive<br />
right-of-way, has priority at signalized intersections and<br />
greater distances between stops.<br />
Several components of BRT that allow for faster transit<br />
service include:<br />
Dedicated bus lanes: Full BRT implementation requires<br />
reserving one or more lanes for the exclusive or nearexclusive<br />
use of buses. These lanes could be located in the<br />
center of a street, on the outside lanes, or a combination of<br />
both. The lanes could be separated from automobile traffic<br />
by barriers, or simply signage and road markings. BRT can be<br />
implemented without a dedicated lane, although the<br />
performance will be reduced.<br />
Bus signal priority: The BRT buses would receive preferential<br />
treatment at signalized intersections so that bus speeds can<br />
be maintained and waiting time reduced, thereby reducing<br />
overall travel time. BRT does not, however, produce a<br />
noticeable detrimental effect on the automobile drivers with<br />
whom it shares the public right-of-way.<br />
Spacing of bus stations: For BRT to achieve higher average<br />
speeds, bus stops are placed further apart than on regular,<br />
local lines. Stations could be spaced between one-half to<br />
one-mile apart. Passengers destined for smaller, in-between<br />
bus stops can transfer to a local bus.<br />
BRT in Eugene, Oregon<br />
Traffic improvements: Improvements to the surrounding<br />
streetscape that support BRT would contribute to<br />
improvements in speed and reliability of all traffic. An<br />
advantage of BRT is that it simultaneously improves the<br />
operation of intersections and arterials for both bus and cars.<br />
BRT in Germany<br />
A further advantage of BRT is cost. BRT is less expensive than<br />
light rail to implement, making it an excellent transportation<br />
investment. In addition, inherent operational efficiencies are<br />
realized by the service from its faster speeds. Many of the<br />
229
Valley’s neighboring areas have already been studying BRT<br />
or implementing such systems, including Los Angeles,<br />
Phoenix, the San Francisco Bay Area and Sacramento. In fact,<br />
over 20 U.S. cities and territories are promoting BRT.<br />
As Valley traffic congestion worsens over the next several<br />
years, BRT is best utilized in corridors with high travel,<br />
population and employment densities. It is an ideal service<br />
for commuters. Candidate corridors would be those with<br />
existing, successful transit lines, serving major residential and<br />
employment centers and linking other transportation modes,<br />
especially airports and commuter rail facilities. Also, newly<br />
developing areas that are identified as having major<br />
residential and employment centers in the future are good<br />
candidates.<br />
BRT is best utilized in corridors where there is high density<br />
residential and employment centers, as well other attractors<br />
such as schools, shopping and medical facilities. Candidate<br />
corridors would be trunk lines that could link other transit<br />
service and transportation modes, and provide east-west and<br />
north-south connections between Valley communities.<br />
Based upon a review of <strong>Omnitrans</strong>’ ridership and<br />
productivity trends, findings made about future<br />
demographics in the Valley, and interviews conducted<br />
during the initiation of BRT, the following seven candidate<br />
BRT corridors were identified and their features are displayed<br />
in Figure V-25.<br />
Section V<br />
Service <strong>Plan</strong><br />
230
Corridor<br />
E Street<br />
Foothill<br />
East<br />
Foothill<br />
West<br />
Boulevard<br />
Boulevard<br />
Figure V-25<br />
Candidate BRT Corridors<br />
End Points<br />
Cal State to Loma Linda; evaluate<br />
extension to Redlands<br />
Downtown San Bernardino to<br />
Fontana Metrolink<br />
Fontana Metrolink to Montclair<br />
Transfer Center<br />
Length<br />
(miles)<br />
16.6<br />
15.1<br />
15.3<br />
Euclid Avenue Upland to Chino 13.7<br />
Holt Boulevard<br />
Pomona Transfer Center to Ontario<br />
17.2<br />
Mills<br />
San Bernardino<br />
Avenue<br />
Ontario Mills to Fontana Metrolink 8.3<br />
Grand/Edison<br />
HOV Interchange @ SR 60/91 to<br />
Chino Transcenter<br />
16.0<br />
Total 102.2<br />
The seven candidate corridors total 102 miles in length. The<br />
general location of these corridors is depicted on the service<br />
area map in Figure V-26.<br />
Initial analysis demonstrates that the E Street Corridor has<br />
the highest priority for early implementation of a major<br />
transit investment in premium service. The E Street Corridor<br />
currently has the highest number of existing transit trips<br />
among the seven corridors in the <strong>Omnitrans</strong> system and has<br />
the highest potential for additional new transit riders. This<br />
corridor has significant opportunities to influence<br />
redevelopment, has a high number of transit dependents,<br />
and has the potential to improve system-wide connectivity.<br />
Foothill Boulevard East, Holt Avenue/4th Street, and the<br />
Mountain/Euclid/Central Avenues Corridors rank second,<br />
third, and fourth in priority. This group of corridors is<br />
designated as having the highest priority for early<br />
implementation. Although the Mountain/Euclid/Central<br />
Avenues Corridor is ranked fourth, it could be moved up the<br />
list of development of the Ag Preserve accelerates and<br />
developers give high priority to reserving transportation<br />
right-of-way for future mass transit investments.<br />
231
The remaining three corridors exhibit characteristics that<br />
justify the implementation of premium transit services over a<br />
longer period. The Foothill West Corridor is the strongest of<br />
this group and could be elevated in priority as development<br />
occurs in the corridor in a more accelerated manner. The<br />
same observation applies to the Grand/Edison Avenues<br />
Corridor which serves the Ag Preserve area. It also is a<br />
strong corridor for linkages to Los Angeles County.<br />
<strong>Omnitrans</strong> is commissioning a Major Investment Study for<br />
BRT on the E Street Corridor during the 2004, 2005 and<br />
<strong>2006</strong> fiscal years. Among the work products that will be<br />
developed will be specific alternatives for the corridor(s).<br />
Section V<br />
Service <strong>Plan</strong><br />
232
233<br />
Figure V-26: Candidate BRT Corridors
Access Service Changes<br />
Observations and Findings<br />
Overall, the performance of Access service is good and<br />
productivity is good compared to peers. Improvement<br />
opportunities are therefore aimed at fine-tuning the existing<br />
service and preparing for the future, which may include a<br />
significant increase in demand for Access services,<br />
particularly as the population continues to age.<br />
Opportunities for consideration include the following:<br />
<br />
<br />
<br />
Improvement of subscription and nutrition program<br />
trips, particularly in the West Valley.<br />
Vehicle utilization by time of day and day of week<br />
indicates excess vehicle capacity weekdays mid-day<br />
and after 5:00 PM (core service ends at 6:00PM).<br />
Vehicle utilization is also low on weekends. Because<br />
of the “capacity constraints” provision of the ADA<br />
regulations, Access must ensure the availability of<br />
rides for ADA-certified passengers, but this obviously<br />
comes at a resource cost. Some reallocation of driver<br />
resources may be beneficial, as are ongoing efforts to<br />
improve optimization of passenger schedules.<br />
During the peak time period, ride times on some<br />
vehicles may exceed 2 hours, although this may be<br />
comparable to some similar fixed-route trips. While<br />
this is largely an operational issue, <strong>Omnitrans</strong> can also<br />
work with social service agencies to identify mutually<br />
appropriate goals.<br />
Service quality is generally good with on-time performance<br />
averaging 91 percent, depending on the day and time of<br />
service. This includes the on-time performance for<br />
passenger no-shows as well as trips completed.<br />
An FTA memo from 2003 clarifies that premium fares for<br />
subscriptions or “special” agency requests (which are beyond<br />
ADA baseline service) are allowable. <strong>Omnitrans</strong>’ September<br />
2003 fare study and the zonal adjustments allowed for a<br />
clearer fare structure for passengers, while at the same time<br />
moves toward a goal of improved farebox recovery. The<br />
Section V<br />
Service <strong>Plan</strong><br />
234
expanded “subscription pass” allows non-subscription trips to<br />
be taken with this fare medium, which is a clear benefit to<br />
these passengers and their social service agencies.<br />
Social service agencies are important partners in the<br />
development, delivery, and ongoing success of “specialized”<br />
transportation, but they often tend to have high<br />
expectations and demands. Because their focus is on other<br />
services, they do not generally see themselves as part of<br />
either challenges or opportunities for the transportation<br />
system. Not surprisingly, their concern is for their own<br />
clients, sometimes to the detriment of other (perhaps<br />
equally-or-more entitled) individuals. <strong>Omnitrans</strong> and<br />
Contract Services staff are aware of the inherent institutional<br />
issues and work conscientiously to deliver professional<br />
services in a quality manner.<br />
Operational Observations<br />
Overall, there appears to be a very good relationship<br />
among <strong>Omnitrans</strong> staff, the contractor, social service<br />
agencies, and most passengers.<br />
<br />
<br />
<br />
<br />
Reservations staff does not consistently log “refusals”<br />
by passengers of legally offered trip time negotiations.<br />
To do so would provide more protection in the event<br />
of complaints.<br />
The current contract has required additional street<br />
supervision and specified scheduling staff. Anecdotal<br />
information indicates improved customer satisfaction.<br />
Centralized dispatching for both East and West<br />
Valleys has “pros and cons”, but appears to be<br />
working satisfactorily.<br />
Radio problems are expected to lessen with new<br />
procurements. Subject to communications availability<br />
and performance, there appears to be good<br />
compliance with drivers’ calling in stops to Dispatch,<br />
which is important in knowing where the vehicles are<br />
at any given time.<br />
235
Access has multiple dedicated phone lines, which<br />
allow for a range of customer reservations and<br />
information availability, the ability for customers to call<br />
in cancellations, and for Dispatch to communicate<br />
with drivers in radio dead-zones.<br />
Other information service made available by Access,<br />
through the customer brochure and the telephone<br />
information message, are very helpful. However,<br />
each contains some statements that should be<br />
corrected to ensure better compliance with the ADA<br />
regulations.<br />
As part of this review, clarification of Operating<br />
Policies (e.g., wait time, no shows, and late<br />
cancellations) is an opportunity for improvement<br />
identified by both driver and social service agency<br />
focus groups.<br />
Public information materials (e.g., Access “guide”<br />
effective and the “five minute” Access phone<br />
message) should be updated for better ADA<br />
compliance.<br />
Transfer sites for Access, to reduce some of the<br />
lengthier (time and distance) trips will be evaluated<br />
for appropriate passenger amenities and the possible<br />
need for staff monitoring/assistance. Consideration of<br />
comparability to conditions experienced by fixedroute<br />
passengers is an important element.<br />
Consider options for controlling Access costs:<br />
In the Financially Constrained Scenario, there will be<br />
neither expansion nor reduction in Access service<br />
area for January <strong>2006</strong>. Proposed service changes will<br />
not alter the boundaries of routes; therefore, the<br />
Access boundary will remain unaffected. During the<br />
major system restructuring in January 2004, the<br />
Access area was reduced to account for the reduction<br />
in the few trips on fixed-route bus services that were<br />
previously made in Colton and Grand Terrace. The<br />
reduction in the Access service allowed eligible<br />
paratransit riders to find alternative means of travel,<br />
Section V<br />
Service <strong>Plan</strong><br />
236
while frequent users remained eligible for one<br />
additional year. In the Access service area, new<br />
customers may book trips that start or end inside the<br />
3/4-mile radius of <strong>Omnitrans</strong>’ fixed-route bus service.<br />
Customers who live, or desire trips, beyond the<br />
boundary will be continue to be certified until January<br />
2005, but Access trips must begin or end at the<br />
boundary.<br />
<br />
<br />
In the Up To Guidelines scenario, the span of service is<br />
increased on Saturdays and Sundays for those Access<br />
riders who are ADA certified to mirror fixed route<br />
changes. The proposed span of service for Saturdays<br />
is approximately from 6:15 a.m. to 8:30 p.m. for a<br />
14.25-hour span of service – an increase of 2.25 hours<br />
compared to the current 7 a.m. to 7 p.m. schedule.<br />
The proposed span of service for Sundays is<br />
approximately from 6:30 a.m. to 7:45 p.m. for a 13.25-<br />
hour span of service – an increase of 1.25 hours<br />
compared to the current 7 a.m. to 7 p.m. schedule.<br />
Approximately 3.5 hours of service is needed each<br />
weekend in the East and West Valleys. This change<br />
would take effect in January <strong>2006</strong> for a net increase<br />
of 364 revenue vehicle hours annually. Existing Non-<br />
Core services on weekdays are already consistent with<br />
the proposed span of operation for fixed route bus<br />
service. However, additional hours of service have<br />
been added to weekdays in FY08 to FY11 to<br />
accommodate projected ridership increases based on<br />
population growth in the area. Additional hours of<br />
service each weekday is assumed for FY08 with<br />
times the service in FY11.<br />
The Financially Unconstrained scenario projects<br />
ridership above that of the previous scenario, and<br />
therefore additional hours of service have been<br />
added. In this Unconstrained Scenario, 6 peak<br />
vehicles are forecast as necessary. Previous plans for<br />
expansion vehicles suggested that smaller vans may<br />
be appropriate as ADA trips tend to be longer and<br />
less conducive to large group shared-ride loads.<br />
237
Figure V-27 shows the projected hours and miles of<br />
service for Access under the three alternative service<br />
and funding scenario.<br />
Financial Year<br />
Figure V-27: Access Service –<br />
Hours by Scenario<br />
Access Service – Revenue Hours<br />
Financially<br />
Up To<br />
Constrained Guidelines<br />
Scenario<br />
Scenario<br />
Financially<br />
Unconstrained<br />
Scenario<br />
2005-<strong>2006</strong> 174,000 174,000 175,530<br />
<strong>2006</strong>-2007 174,000 174,870 175,530<br />
2007-2008 174,000 174,870 175,530<br />
2008-2009 174,000 174,870 175,530<br />
2009-2010 172,834 172,834 173,007<br />
2010-<strong>2011</strong> 176,290 176,290 176,467<br />
Future Opportunities and Recommendations<br />
Ridership growth, combined with increasing trip distances, in<br />
more recent years is considerable and may outpace available<br />
resources. Potential strategies include:<br />
<br />
<br />
Strengthen eligibility requirements and procedures,<br />
particularly regarding “converting” passengers to<br />
fixed route or service routes. Under the current<br />
lenient ADA eligibility program, it would be very<br />
difficult to enforce new behaviors. Similarly, a future<br />
option could allow free or reduced ridership on fixed<br />
route by ADA-eligible persons, but not until eligibility<br />
is tightened up more. Some form of in-person<br />
eligibility assessment, at least for one full round of<br />
customer re-certifications, is strongly recommended to<br />
provide a consistent baseline for future passengers<br />
and service.<br />
Monitor and evaluate Access service performance<br />
through Siemens communications system for a period<br />
of two years before implementing any Access routing<br />
or scheduling changes. Siemens is slated to begin<br />
during Fiscal year 2005 and become fully operational<br />
Section V<br />
Service <strong>Plan</strong><br />
238
y <strong>2006</strong>. During the SRTP update in Fiscal Year 2008,<br />
<strong>Omnitrans</strong> will seek suggestions for system<br />
improvement based upon performance data from the<br />
voice-data communications system. The upgrading of<br />
the dispatch and communications system is expected<br />
to improve efficiency of the <strong>Omnitrans</strong> Access system<br />
while keeping costs down.<br />
<br />
<br />
Develop passenger training to help seniors take<br />
advantage of the flexibility of fixed-route transit, with<br />
possible subsequent development of “service routes”<br />
targeted to senior centers. The “Bus Basics”<br />
informational meetings designed for acquainting<br />
seniors with <strong>Omnitrans</strong> transportation service has<br />
shown to be successful in previous years. Continuing<br />
senior promotion programs will occur to ensure that<br />
the growing population of active seniors are<br />
familiarized with alternatives to driving. Additional<br />
mobility training (sometimes called travel training) for<br />
other individuals or groups of passengers should<br />
continue to be considered.<br />
Access passengers have good paratransit service<br />
available, but this can sometimes lead to their own<br />
“complacency.” While persons certified as ADAeligible<br />
clearly have a civil right to the service, they<br />
also have obligations to not infringe on the civil rights<br />
of other, equally eligible, passengers and to refrain<br />
from “controllable” behavior that is not allowed for<br />
other passengers. <strong>Omnitrans</strong> should develop and<br />
enforce a “Passenger Responsibilities” policy. In<br />
particular, consider recently enacted state legislation<br />
(AB2184, Cohn, Chapter 650, Statutes of 2002), which<br />
creates new categories of infractions for misbehavior<br />
on all public transit vehicles. Access, paratransit<br />
passengers, and advocacy organizations should form<br />
a partnership for the ongoing health of the overall<br />
mobility system.<br />
The following is one example of a “Rights and<br />
Responsibilities” Policy:<br />
239
ADA Paratransit passengers have the following rights:<br />
Courtesy and respect from public transit<br />
personnel, including timely phone service and<br />
accurate information<br />
Service comparable to fixed route<br />
Information available in an accessible format<br />
Open public involvement process for changes<br />
in service or fares<br />
Reasonably well-maintained vehicles.<br />
ADA Paratransit passengers have the following<br />
responsibilities:<br />
Respect for other passengers and public transit<br />
personnel<br />
Obey vehicle and service rules (including but<br />
not limited to: no food, smoking or radios, curbto-curb<br />
service, comply with service rules for<br />
scheduled pickup time, keep service animal<br />
under control)<br />
Schedule and use paratransit service only<br />
when fixed route service cannot be used<br />
because of one’s disability<br />
Limit “no-shows” and late cancellations, since<br />
these affect the availability and timeliness of<br />
service to others<br />
Overall, the Access system has been extremely user-friendly<br />
and some expectations may be unrealistic for the future.<br />
“Phased” changes may be necessary to protect the interests<br />
of <strong>Omnitrans</strong> and the people of San Bernardino County.<br />
However, any substantive changes to the adopted and FTAapproved<br />
Paratransit <strong>Plan</strong> will require an appropriate public<br />
involvement process and, most likely, one or more public<br />
hearings.<br />
Section V<br />
Service <strong>Plan</strong><br />
240
System Safety/Security and<br />
Emergency Preparedness <strong>Plan</strong><br />
The public transportation industry faces many hazards and<br />
threats, all of which have the potential for disrupting local<br />
communities, causing casualties, and damaging and<br />
destroying public and private property. At a national level,<br />
the industry will be affected by several major events each<br />
year; ranging from floods, earthquakes, hurricanes, tornados,<br />
major accidents, hazardous materials spills, fires, violent<br />
crime, and, potentially, terrorism.<br />
System safety/security and emergency preparedness (SSSEP)<br />
offers a valuable tool to support the efforts of transportation<br />
managers to answer system safety/security questions. System<br />
security is defined as the application of operating, technical,<br />
and management techniques and principles to the safety<br />
and security aspects of a system throughout its life to reduce<br />
threats and vulnerabilities to the most practical level through<br />
the most effective use of available resources<br />
System safety/security provides a structured<br />
methodology for analyzing hazards and threats and<br />
weighing the consequences of the cost of their<br />
resolution against the capabilities of the system to<br />
fund improvements.<br />
This process builds on the transportation industry’s<br />
strong safety culture, applying analysis techniques<br />
and management processes traditionally used for<br />
safety hazards to security threats and vulnerabilities.<br />
System safety/security identifies safety, security and<br />
emergency preparedness measures that protect both<br />
the community and transportation employees, while<br />
keeping the system operational and effective, even<br />
under adverse conditions.<br />
This process allows the system, whatever its size, service, or<br />
operating environment, to implement the most effective<br />
system safety, security and emergency preparedness<br />
program possible within its available resources.<br />
Within the context of this approach, emergency<br />
preparedness is a central feature of the program, ensuring<br />
241
the capability to mitigate and manage those events that<br />
cannot be prevented. Emergency preparedness is defined as<br />
a uniform basis for operating policies and procedures for<br />
mobilizing public transportation system and other public<br />
safety resources to assure rapid, controlled, and predictable<br />
responses to various types of transportation and community<br />
emergencies<br />
System safety/security promotes an integrated approach to<br />
protection, identifying how all system activities come<br />
together as part of an interdependent system that deters,<br />
detects, assesses, and responds to threats and hazards. This<br />
process has the following components:<br />
physical resources to delay and deter the adversary<br />
and correct identified hazards;<br />
equipment installed to detect and assess alarms and<br />
support surveillance;<br />
personnel used for safety and security systems<br />
<br />
management, operations, and response;<br />
procedures essential for system operation and<br />
effectiveness; and<br />
training, exercising, and assessment to assure<br />
response capabilities and effective mutual aid and<br />
joint public safety agency operations.<br />
Overall, <strong>Omnitrans</strong> SSSEP mirrors the new system safety and<br />
security program guidelines set out by the Federal <strong>Transit</strong><br />
Administration (FTA) System Safety and Security Department.<br />
It also aligns <strong>Omnitrans</strong> SSSEP with the principals of the<br />
California Standardized Emergency Management System<br />
(SEMS).<br />
Benefits of System Safety/Security and Emergency<br />
Preparedness<br />
Because security has historically been managed as part of<br />
day-to-day transportation operations, the benefits of<br />
preparing a formal security plan are often not recognized.<br />
Yet, the planning process:<br />
<br />
<br />
provides a systematic vision for its safety, security and<br />
emergency preparedness activities;<br />
enhances the system’s ability to coordinate with local<br />
authorities and the California Standardized<br />
Emergency Management System (SEMS);<br />
Section V<br />
Service <strong>Plan</strong><br />
242
supports development of best practices and<br />
technology programs; and<br />
provides the basis for training and exercises.<br />
In an era of heightened public concern and expectation,<br />
formal system safety/security planning ensures that the<br />
public transportation system is doing all that it can to<br />
leverage limited resources for hazard prevention, physical<br />
protection and effective emergency response.<br />
By investing time and money in system safety/security and<br />
emergency preparedness efforts, transportation managers<br />
can reduce the likelihood of adverse effects on employees,<br />
passengers, and the environment, as well as help to avoid<br />
costly losses that would result from a major event. This<br />
program can also be a valuable tool for maintaining<br />
operational integrity.<br />
Some of the benefits of implementing a SSSEP include:<br />
safeguarding employees, passengers, first responders,<br />
the community, and the environment;<br />
reducing litigation risk, insurance costs, and system<br />
impairments;<br />
reducing the risk of vandalism, as well as sabotage<br />
and crimes against the system by employees and nonemployees;<br />
improving relationships with local authorities and<br />
surrounding communities;<br />
providing a mechanism for personnel control and<br />
accounting ;<br />
supporting effective crisis communications internally<br />
and with passengers; and<br />
improving emergency response and joint public safety<br />
coordination and communication<br />
With all this critical information in mind, it became clear that<br />
<strong>Omnitrans</strong> needed to have alternative plans in place that<br />
could be implemented on short notice, depending on the<br />
level of emergency that was occurring. This effort is a small<br />
part of the overall system safety/security and emergency<br />
preparedness that the Agency is currently undertaking to<br />
assure the safety of employees, passengers, the community,<br />
and the environment. All of <strong>Omnitrans</strong> departments work<br />
243
towards the safety and security of the system in general, and<br />
the key areas of Facility Safety and Security and Fleet Safety<br />
and Training work jointly to oversee that day-to-day training<br />
and all aspects of daily operations meet the goals of SSSEP.<br />
For more information on <strong>Omnitrans</strong> safety procedures as<br />
well as route changes in the event of an emergency or<br />
regionally significant event, please reference <strong>Omnitrans</strong>’<br />
Safety and Security Manuals and Emergency Preparedness<br />
<strong>Plan</strong>.<br />
Section V<br />
Service <strong>Plan</strong><br />
244
Section VI:<br />
Agency 5-Year Fiscal Picture<br />
<strong>Plan</strong>ning is a process of<br />
choosing among those many<br />
options. If we do not choose to<br />
plan, then we choose to have<br />
others plan for us.<br />
- Richard I. Winwood
Operating Costs & Service<br />
Levels<br />
Three separate financial scenarios were developed to<br />
correspond to the three operating plans documented earlier<br />
in this <strong>Plan</strong>, including:<br />
Financially Constrained <strong>Plan</strong><br />
Up To Standards <strong>Plan</strong><br />
Unconstrained <strong>Plan</strong>.<br />
Figure VI-1 summarizes revenue service hours for each of<br />
these scenarios.<br />
Operating costs, excluding cash reserves for INBR expenses,<br />
are shown below in Figure VI-2. Operating costs projections<br />
are based on the FY <strong>2006</strong> Proposed Budget and adjusted for<br />
projected increases of approximately four to 4.5 percent per<br />
year for inflation. Selected categories of expense have been<br />
increased by factors more than the inflation based on recent<br />
trends (e.g., Medical Insurance increased more than<br />
inflation). Fuel costs have been adjusted to reflect a change<br />
to alternative fuels by FY 2007.<br />
Operating costs are both variable and fixed. Variable costs<br />
include labor, services, materials and supplies, and fuel costs<br />
associated with operations and vehicle maintenance. These<br />
costs vary, depending on service levels – both hours and<br />
miles. Fixed costs are those closely associated with<br />
administration that generally do not change, regardless of<br />
service levels. Figure VI-3 shows operating costs per revenue<br />
service hour by year for each of the three scenarios. Costs<br />
per hour decline in each scenario as a result of fixed<br />
administrative costs being spread across a greater service<br />
base.<br />
245
Figure VI-1<br />
Revenue Service Hours (in thousands)<br />
Fiscal Year<br />
Financially<br />
Constrained<br />
Revenue Service Hours (in thousands)<br />
Up To Design<br />
Standard<br />
Unconstrained<br />
<strong>2006</strong> 900 1,149 1,661<br />
2007 900 1,149 1,661<br />
2008 900 1,149 1,661<br />
2009 900 1,149 1,661<br />
2010 906 1,155 1,667<br />
<strong>2011</strong> 909 1,159 1,670<br />
Figure VI-2<br />
Operating Costs ($ in millions)<br />
Fiscal Year<br />
Financially<br />
Constrained<br />
Operating Costs ($ in Millions)<br />
Up To Design<br />
Standard<br />
Unconstrained<br />
<strong>2006</strong> $ 69.6 $ 78.8 $ 111.9<br />
2007 $ 73.3 $ 84.5 $ 120.0<br />
2008 $ 76.0 $ 87.0 $ 124.3<br />
2009 $ 79.0 $ 90.7 $ 129.6<br />
2010 $ 84.1 $ 95.5 $ 136.2<br />
<strong>2011</strong> $ 88.3 $ 100.2 $ 142.8<br />
Section VI<br />
5-Year Fiscal Picture<br />
246
Figure VI-3<br />
Operating Costs Per Revenue Hour<br />
Fiscal Year<br />
Financially<br />
Constrained<br />
Operating Costs Per Revenue Hour<br />
Up To Design<br />
Standard<br />
Unconstrained<br />
<strong>2006</strong> $ 77.29 $ 68.63 $ 67.35<br />
2007 $ 81.48 $ 73.62 $ 72.19<br />
2008 $ 84.43 $ 75.72 $ 74.82<br />
2009 $ 87.72 $ 78.97 $ 78.04<br />
2010 $ 93.46 $ 82.66 $ 81.74<br />
<strong>2011</strong> $ 98.08 $ 86.45 $ 85.51<br />
247
Farebox Revenues &<br />
Passengers<br />
Projected farebox revenues for each of the three financial<br />
scenarios are based on an estimate of passengers and<br />
average fare per passenger assumptions. The fare increase<br />
assumed in the prior <strong>Plan</strong> for FY <strong>2006</strong>, is delayed until FY<br />
2008, or pending the results of the next Comprehensive<br />
Operational Analysis that is scheduled for FY <strong>2006</strong>. In FY<br />
2008, the base fare for fixed route bus service is assumed to<br />
increase from $1.15 to $1.30, resulting in an average fare per<br />
passenger of $0.75 compared to the current $0.70 per<br />
passenger. The base fare for Access service is assumed to<br />
increase from $2.05 to $2.35 with an increase in the average<br />
fare per passenger from $2.13 in FY 2005 to $2.18 in FY<br />
2008.<br />
Ridership is projected to increase due to an increase in the<br />
span of service (hours of operation), new routes, and<br />
increased service frequency. Service improvements are<br />
assumed to require 24-months to achieve maturity in terms<br />
of ridership potential. And just as service improvements<br />
begin to generate maximum ridership, the FY 2008 fare<br />
increase causes a decline in ridership, assumed to be<br />
consistent with recent fare increase experience (e.g., a<br />
decline in ridership of one to three percent for fixed route<br />
service, ten percent for OmniLink service and three percent<br />
for Access service). The decrease in Access service ridership<br />
is expected to be less than that experienced in the most<br />
recent fare increase as the proportional increase in<br />
subscription service fares will be significantly less than the<br />
previous fare increase. Figure VI-4 provides an estimate of<br />
ridership for each of the three scenarios. Productivity levels<br />
are shown in Figure VI-5. Forecast farebox revenues are<br />
shown in Figure VI-6.<br />
Section VI<br />
5-Year Fiscal Picture<br />
248
Figure VI-4<br />
Passengers (in thousands)<br />
Fiscal Year<br />
Financially<br />
Constrained<br />
Passengers (in thousands)<br />
Up To Design<br />
Standard<br />
Unconstrained<br />
<strong>2006</strong> 16,006 21,574 27,279<br />
2007 16,240 23,089 31,921<br />
2008 15,987 23,814 35,458<br />
2009 16,147 23,819 35,463<br />
2010 16,626 24,297 36,187<br />
<strong>2011</strong> 17,119 24,776 36,910<br />
Figure VI-5<br />
Passengers Per Hour<br />
Fiscal Year<br />
Financially<br />
Constrained<br />
Passengers Per Revenue Hour<br />
Up To Design<br />
Standard<br />
Unconstrained<br />
<strong>2006</strong> 17.8 18.8 16.4<br />
2007 18.0 20.1 19.2<br />
2008 17.8 20.7 21.3<br />
2009 17.9 20.7 21.3<br />
2010 18.5 21.0 21.7<br />
<strong>2011</strong> 19.0 21.4 22.1<br />
249
Figure VI-6<br />
Farebox Revenues ($ in millions)<br />
Fiscal Year<br />
Financially<br />
Constrained<br />
Farebox Revenues ($ in Millions)<br />
Up To Design<br />
Standard<br />
Unconstrained<br />
<strong>2006</strong> $ 11.8 $ 15.0 $<br />
18.8<br />
2007 $ 12.1 $ 16.0 $<br />
21.9<br />
2008 $ 12.7 $ 17.7 $<br />
26.0<br />
2009 $ 12.9 $ 17.7 $<br />
26.0<br />
2010 $ 13.2 $ 18.0 $<br />
26.5<br />
<strong>2011</strong> $ 13.6 $ 18.5 $<br />
27.1<br />
The operating ratio, for general public and specialized<br />
transportation services are shown separately in Figure VI-7a<br />
and VI-7b. The operating ratio is the sum of farebox<br />
revenues, Measure I fare subsidies and advertising revenue,<br />
divided by operating costs. State funding requires a<br />
minimum of 20 percent for general public service. As<br />
shown in Figure VI-7a, <strong>Omnitrans</strong> will have difficulty in<br />
meeting the required 20 percent in the Financially<br />
Constrained Scenario, due in part to operating costs<br />
increasing faster than ridership and farebox revenues. In FY<br />
<strong>2006</strong> through FY 2008, <strong>Omnitrans</strong> may need to exclude<br />
service increases from the farebox recovery calculation, as<br />
allowed by State TDA Regulations. This strategy is a<br />
contingency option should <strong>Omnitrans</strong> ridership and farebox<br />
revenues be less than projected.<br />
In FY <strong>2006</strong>, <strong>Omnitrans</strong> will continue its assessment of service<br />
productivity by line and time of day, making<br />
recommendations to the Board on strategies to improve the<br />
farebox recovery ratio through service changes. In addition,<br />
operating costs in areas such as Workers’ Compensation and<br />
Medical Insurance will be analyzed with new programs to<br />
reduce and/or contain cost growth in these areas.<br />
Section VI<br />
5-Year Fiscal Picture<br />
250
Figure VI-7a<br />
Operating Ratio – General Public Service<br />
Fiscal Year<br />
Financially<br />
Constrained<br />
Operating Ratio -- General Public Service<br />
Constrained Excl.<br />
New Service<br />
Up To Design<br />
Standard<br />
Unconstrained<br />
<strong>2006</strong> 19% 20% 21% 18%<br />
2007 19% 20% 22% 20%<br />
2008 19% 20% 23% 23%<br />
2009 19% 19% 22% 22%<br />
2010 18% 18% 22% 21%<br />
<strong>2011</strong> 18% 18% 21% 21%<br />
Figure VI-7b<br />
Operating Ratio – Specialized Service<br />
Fiscal Year<br />
Operating Ratio -- Specialized Service<br />
Financially<br />
Constrained<br />
Up To Design<br />
Standard<br />
Unconstrained<br />
<strong>2006</strong> 13% 13% 13%<br />
2007 11% 11% 12%<br />
2008 11% 11% 11%<br />
2009 10% 11% 11%<br />
2010 10% 10% 11%<br />
<strong>2011</strong> 10% 10% 10%<br />
251
Financially Constrained <strong>Plan</strong><br />
Current funding supports the Financially Constrained <strong>Plan</strong>.<br />
For this reason, operating costs and revenues, by service<br />
type have been included for this scenario, as shown in<br />
Figure VI-8a.<br />
Figure VI-8a<br />
Financially Constrained <strong>Plan</strong><br />
Financial Information Year 1 FY06 Year 2 FY07 Year 3 FY08 Year 4 FY09 Year 5 FY10 Year 6 FY11<br />
Operating Expense<br />
Directly Operated Fixed Route Bus $ 58,723,532 $ 61,502,410 $ 63,698,526 $ 66,168,736 $ 70,782,846 $ 74,357,266<br />
Contracted Fixed Route Bus $ 906,905 $ - $ - $ - $ - $<br />
-<br />
OmniLink Service $ 1,149,746 $ 1,402,786 $ 1,458,144 $ 1,516,140 $ 1,582,825 $ 1,652,518<br />
Access Service $ 8,785,994 $ 10,433,454 $ 10,841,681 $ 11,269,481 $ 11,759,642 $ 12,271,740<br />
Total Operating Expense $ 69,566,176 $ 73,338,649 $ 75,998,351 $ 78,954,357 $ 84,125,312 $ 88,281,524<br />
Operating Revenues<br />
Fixed Route Bus Fares $ 10,667,400 $ 10,985,618 $ 11,632,397 $ 11,748,721 $ 12,101,182 $ 12,464,218<br />
Demand Response Fares $ 1,117,110 $ 1,114,980 $ 1,110,113 $ 1,120,714 $ 1,143,128 $ 1,165,991<br />
Measure I Fare Subsidy $ 273,730 $ 256,096 $ 259,836 $ 255,793 $ 258,344 $ 266,009<br />
Measure I General Subsidy $ 5,066,597 $ 5,392,368 $ 5,714,545 $ 6,063,309 $ 6,425,370 $ 7,084,691<br />
Interest Revenue $ 405,809 $ 412,302 $ 418,898 $ 425,601 $ 434,113 $ 442,795<br />
Advertising Revenue $ 797,000 $ 828,880 $ 828,880 $ 828,880 $ 866,180 $ 866,180<br />
Total Operating Revenues $ 18,327,646 $ 18,990,244 $ 19,964,669 $ 20,443,018 $ 21,228,318 $ 22,289,883<br />
Fare Revenues By Service Type<br />
Directly Operated Fixed Route Bus $ 10,526,590 $ 10,985,618 $ 11,632,397 $ 11,748,721 $ 12,101,182 $ 12,464,218<br />
Contracted Fixed Route Bus $ 140,810 $ - $ - $ - $ - $<br />
-<br />
OmniLink Service $ 54,240 $ 54,240 $ 50,036 $ 50,036 $ 51,037 $ 52,058<br />
Access Service $ 1,062,870 $ 1,060,740 $ 1,060,077 $ 1,070,678 $ 1,092,091 $ 1,113,933<br />
The operating deficit before application of operating<br />
subsidies and capitalization of vehicle maintenance costs is<br />
approximately $51 million in FY <strong>2006</strong>. LTF funds are used to<br />
pay for this deficit, as shown below in Figure VI-8b. Current<br />
funding supports the Financially Constrained <strong>Plan</strong>.<br />
Section VI<br />
5-Year Fiscal Picture<br />
252
Figure VI-8<br />
LTF Requirements for the Financially Constrained <strong>Plan</strong><br />
Financial Information Year 1 FY06 Year 2 FY07 Year 3 FY08 Year 4 FY09 Year 5 FY10 Year 6 FY11<br />
Gross Operating Expenses $ 69,566,176 $ 73,338,649 $ 75,998,351 $ 78,954,357 $ 84,125,312 $ 88,281,524<br />
Operating Revenues $ 18,327,646 $ 18,990,244 $ 19,964,669 $ 20,443,018 $ 21,228,318 $ 22,289,883<br />
Net Operating Expense $ 51,238,530 $ 54,348,405 $ 56,033,682 $ 58,511,339 $ 62,896,995 $ 65,991,641<br />
Less Capitalizated Operations $ 9,031,310 $ 11,577,607 $ 12,176,154 $ 11,141,706 $ 11,686,039 $ 12,281,817<br />
LTF Operations Subsidy $ 42,207,220 $ 42,770,798 $ 43,857,528 $ 47,369,633 $ 51,210,956 $ 53,709,824<br />
Gross Capital Expenses $ 22,774,574 $ 16,698,542 $ 24,244,210 $ 26,937,709 $ 20,572,565 $ 22,140,844<br />
FTA 5307 $ 13,045,016 $ 13,045,016 $ 13,045,016 $ 13,045,016 $ 13,045,016 $ 13,045,016<br />
Reprogrammed FTA 5307 $ 2,837,352<br />
$ -<br />
CMAQ & JARC $ 894,086 $ - $ 9,317,200 $ 9,317,200 $ - $ -<br />
LTF Carryover for Capital $ 734,483<br />
$ -<br />
FTA 5310 $ 507,000 $ - $ - $ - $ - $ -<br />
STA $ 2,417,000 $ 2,217,000 $ 2,217,000 $ 2,217,000 $ 5,250,000 $ 5,250,000<br />
LTF Capital Subsidy $ 2,339,637 $ 1,044,254 $ 2,254,964 $ 2,254,964 $ - $ -<br />
Total LTF Subsidy Required $ 44,546,857 $ 43,815,052 $ 46,112,492 $ 49,624,597 $ 51,210,956 $ 53,709,824<br />
Current Year LTF Revenues $ 44,236,857 $ 42,011,052 $ 46,112,493 $ 49,624,597 $ 52,972,328 $ 54,722,817<br />
LTF Carryover/Capital Reserve $ 310,000 $ 1,804,000 $ - $ - $ - $ -<br />
Current Year LTF Balance $ - $ - $ - $ - $ 1,761,372 $ 1,012,993<br />
Cumulative LTF Balance $ - $ - $ - $ - $ 1,761,372 $ 2,774,365<br />
Figure VI-9 provides performance indicators of cost efficiency<br />
and effectiveness for the Financially Constrained <strong>Plan</strong> by type<br />
of service.<br />
Figure VI-9<br />
Performance Indicators by Service Type – Financially Constrained <strong>Plan</strong><br />
Financial Information<br />
Year 1 Year 2 Year 3 Year 4 Year 5 Year 6<br />
FY06 FY07 FY08 FY09 FY10 FY11<br />
Farebox Recovery Ratios -- System 18% 18% 18% 18% 17% 17%<br />
General Public Services 19% 19% 19% 19% 18% 18%<br />
Specialized Transportation Service 13% 11% 11% 10% 10% 10%<br />
Operating Costs Per Hour -- System $ 77.29 $ 81.48 $ 84.43 $ 87.72 $ 93.46 $ 98.08<br />
Directly Operated Fixed Route Bus $ 84.43 $ 86.76 $ 89.86 $ 93.34 $ 99.85 $ 104.89<br />
Contracted Fixed Route Bus $ 68.00 $ - $ - $ - $ - $ -<br />
OmniLink Service $ 47.51 $ 57.97 $ 60.25 $ 62.65 $ 65.41 $ 68.29<br />
Access Service $ 52.61 $ 62.48 $ 64.92 $ 67.48 $ 70.42 $ 73.48<br />
Passengers Per Hour - System 17.8 18.0 17.8 17.9 18.5 19.0<br />
Directly Operated Fixed Route Bus 21.9 22.1 21.8 22.0 22.7 23.4<br />
Contracted Fixed Route Bus 15.4 - - - - -<br />
OmniLink Service 2.0 2.0 1.8 1.8 1.8 1.9<br />
Access Service 3.0 3.0 2.9 2.9 3.0 3.1<br />
The fare ratios by service type shown above in Figure VI-9<br />
are for passenger fares only, and do not include Measure I<br />
fare subsidies for seniors and persons with disabilities and<br />
advertising revenue. When these are included, the<br />
253
systemwide farebox recovery ratio is about 19 percent for FY<br />
<strong>2006</strong> only and 17 to 18 percent thereafter. For this<br />
reason,service has been segmented into general public and<br />
specialized service for purposes of calculating the farebox<br />
recovery ratio for State compliance purposes.<br />
In FY <strong>2006</strong> to FY 2009, <strong>Omnitrans</strong> will need to decrease<br />
costs, increase ridership and/or exclude service expansions<br />
from the State-mandated farebox recovery calculation. In<br />
the three optional plan years (i.e., FY 2009 through FY <strong>2011</strong>)<br />
<strong>Omnitrans</strong> will need to have achieved cost reductions<br />
and/or increases in ridership and farebox revenues. This<br />
objective may be achieved with a reduction in Workers<br />
Compensation costs and minor service adjustments, focusing<br />
on those services that fail to achieve 75 percent or more of<br />
the minimum farebox recovery ratio. Ridership and fare<br />
revenue increases may be possible as a result of increasing<br />
population, employment and rising fuel costs.<br />
Revenue Sources<br />
The funding sources assumed in the Financially Constrained<br />
Scenario are those currently available to <strong>Omnitrans</strong>, as<br />
described below. This includes existing revenue sources at<br />
the federal, state and local level. The level of funding<br />
estimated to be available over the next six years is based on<br />
the fund estimates provided by the San Bernardino<br />
Associated Governments (SANBAG) for fiscal years <strong>2006</strong>-<br />
2008 and <strong>Omnitrans</strong> projections for 2009-<strong>2011</strong>.<br />
Federal Funds<br />
At the federal level, TEA-21 provided funding through the<br />
Federal <strong>Transit</strong> Administration (FTA) specifically to support<br />
transit operating and capital needs. TEA-21 also provided for<br />
the flexible use of funds made available through the Federal<br />
Highway Administration (CMAQ and STP). Reauthorization<br />
of TEA-21 has been delayed, and some changes in the<br />
program may occur once the new Bill is signed into action.<br />
The federal transit program, under the Federal <strong>Transit</strong><br />
Section VI<br />
5-Year Fiscal Picture<br />
254
Administration (FTA), provides for urban area and statewide<br />
formula grant programs plus several discretionary programs.<br />
FTA Section 5307 Formula Funds<br />
This is a formula program with funds apportioned to<br />
urbanized areas with populations over 200,000. Funds can<br />
only be used for capital projects including the purchase of<br />
vehicles and facility maintenance. Section 5307 Funds<br />
require a 20 percent local match.<br />
<strong>Omnitrans</strong> receives FTA Section 5307 funds from two<br />
urbanized areas (UZA): 1) Los Angeles/Long Beach UZA;<br />
and 2) Riverside/San Bernardino UZA. SCAG is the<br />
designated recipient. Using federal transit data, SCAG<br />
determines the amount of FTA 5307 formula funds<br />
apportioned to the areas based on a variety of variables. In<br />
the Riverside/San Bernardino UZA, funds are apportioned<br />
based on:<br />
Population<br />
Population Density<br />
Revenue Miles<br />
In the Los Angeles/Long Beach UZA, funds are apportioned<br />
based on the above variables as well as a bus incentive<br />
formula that considers overall passenger miles and operating<br />
costs.<br />
Federal Section 5307 funds apportioned to San Bernardino<br />
County are estimated at $17.5 million annually over the <strong>Plan</strong><br />
period. Approximately $13.1 million of these funds are<br />
available to <strong>Omnitrans</strong>. The remaining $4.4 million are Fixed<br />
Guideway Funds used for rail projects sponsored by the<br />
Southern California Regional Railway Authority (SCRRA)<br />
Metrolink service. Fixed Guideway funds are determined<br />
based on revenue miles and directional route miles.<br />
In past years, SCRRA required about $1.0 million in Section<br />
5307 Fixed Guideway funds apportioned to San Bernardino<br />
County for commuter rail capital purposes. The balance of<br />
funds, approximately $3.4 million annually, were made<br />
available to <strong>Omnitrans</strong>. Beginning in FY 2005, however,<br />
these funds are now fully utilized by SCRRA for Metrolink<br />
service.<br />
255
Due to the uncertainty created by not having an approved<br />
federal reauthorization bill, the FTA Section 5307 funds<br />
estimated to be available to <strong>Omnitrans</strong> during the <strong>Plan</strong><br />
period remain constant at $13.1 million annually. The<br />
amount available for capital purposes, however, will<br />
fluctuate over the next six years (Appendix D -- Capital<br />
Projects), due to the use of these funds for support of ongoing<br />
vehicle maintenance activities. While Section 5307<br />
funds are targeted for capital purposes, operating expenses<br />
associated with vehicle maintenance may be “capitalized”<br />
and paid for with Section 5307 funds, up to 80 percent of<br />
total vehicle maintenance costs.<br />
FTA Section 5309 Discretionary Funds<br />
A FTA Section 5309 grant provides 80 percent of the capital<br />
funds and requires a 20 percent local match. These funds<br />
are fully discretionary and can be somewhat difficult to<br />
acquire. Section 5309 discretionary funds are usually<br />
earmarked and appropriated by Congress. Obtaining a<br />
Congressional earmark depends on the “clout” of the local<br />
delegation and the ability of <strong>Omnitrans</strong> or other local<br />
officials to communicate the need for these funds.<br />
In the past, individual jurisdictions and agencies have sought<br />
and secured Section 5309 Discretionary Funds. While this<br />
approach maximizes the benefits to individual jurisdictions<br />
and agencies, such activities are outside established<br />
planning processes. Funds secured on an individual basis<br />
detract from the amount of funds potentially available to<br />
overall transit funding priorities in the County. The Capital<br />
<strong>Plan</strong> outlined in this <strong>Plan</strong> proposes that SANBAG identify the<br />
Chaffey College <strong>Transit</strong> Center as the highest priority for<br />
discretionary funding. This is followed closely by<br />
replacement paratransit vehicles and the Mid-Valley Facility.<br />
However the Mid-Valley project is dependent on the ability<br />
to add new services currently not in the constrained SRTP.<br />
Additional discretionary funds would not be programmed<br />
outside of the Countywide planning process. This approach<br />
will help to ensure that County-wide priorities have been<br />
agreed upon through the planning process and that other<br />
lower-priority projects do not directly compete for limited<br />
discretionary funds.<br />
In the past, securing Discretionary Funding in this ad hoc<br />
Section VI<br />
5-Year Fiscal Picture<br />
256
manner also has had a significant impact on <strong>Omnitrans</strong>’<br />
staffing requirements and potentially on FTA Triennial<br />
Review compliance findings. As an eligible grant recipient,<br />
<strong>Omnitrans</strong> is called upon to apply for, administer and accept<br />
Discretionary Grant funds on behalf of other jurisdictions.<br />
This requires the dedication of staff resources charged to the<br />
operating budget. Increasing staff to accommodate this<br />
additional work has a negative impact on <strong>Omnitrans</strong>’ ability<br />
to maintain cost per hour increases to no more than the<br />
increase in the Consumer Price Index (CPI). In addition, all<br />
procurements using Federal funds must adhere to specific<br />
federal procurement and other compliance requirements.<br />
Failure to meet these requirements can result in findings of<br />
non-compliance for <strong>Omnitrans</strong>.<br />
FTA Section 5309 funds are limited to capital purchases and<br />
fall into three categories: 1) bus or bus facilities; 2) new starts;<br />
and 3) rail modernization. <strong>Omnitrans</strong> is eligible for Section<br />
5309 funds in the bus or bus facilities category as well as the<br />
new starts category. These funds are distributed directly by<br />
FTA to support capital transit needs including vehicle<br />
acquisition, capital equipment and other intermodal transfer<br />
facility needs. In the past, <strong>Omnitrans</strong> has been successful in<br />
securing “earmarks” for Section 5309 funds (e.g., Chino and<br />
Yucaipa Transcenters in FY04).<br />
As noted earlier, <strong>Omnitrans</strong> is pursuing FTA Section 5309<br />
funds for its Chaffey College <strong>Transit</strong> Center, Mid-Valley<br />
Facility, and replacement Paratransit Vehicles. If other<br />
jurisdictions are pursuing Section 5309 funds, these should<br />
be identified and included in Countywide funding priorities<br />
approved by SANBAG as part of the <strong>Short</strong> <strong>Range</strong> <strong>Transit</strong> <strong>Plan</strong><br />
and TIP processes.<br />
Congestion Mitigation and Air Quality (CMAQ) Funds<br />
Certain funds made available through the Federal Highway<br />
Administration are considered flexible funds and can be used<br />
for transit capital projects. They are the Surface<br />
Transportation Program (STP) and the Congestion Mitigation<br />
and Air Quality Program (CMAQ). In reality, STP funds are<br />
generally used for streets and road projects and are not<br />
available for transit. The exception to this rule is discussed<br />
under new funding alternatives.<br />
257
The CMAQ program provides funds for projects that<br />
contribute to the attainment or maintenance of federal air<br />
quality standards. These funds are distributed by SANBAG to<br />
all eligible jurisdictions in the County. A wide variety of<br />
public agencies are eligible for CMAQ funds, however,<br />
<strong>Omnitrans</strong> has received a set-aside of funds in FY 2008 and<br />
FY 2009 for the purchase of vehicles. CMAQ funds are<br />
primarily used for capital projects. A portion of CMAQ<br />
funding may be used to support the operating expenses for<br />
new or expanded transit service but only for the first three<br />
years of operation.<br />
SANBAG has determined priorities for the $67.4 million in<br />
CMAQ funds estimated to be available between FY06 and<br />
FY09. <strong>Omnitrans</strong> has secured a commitment of<br />
approximately $18.6 million in CMAQ funds to cover<br />
approximately 88 percent of the cost of replacing 32 coaches<br />
and 100 paratransit vehicles in FY 2008 and FY 2009.<br />
Federal Funds – Other<br />
<strong>Omnitrans</strong> has begun branching out from the traditional<br />
transportation funding sources (e.g. FTA Section 5307, FTA<br />
Section 5309 and CMAQ) to other Federal Agencies that<br />
have or are beginning to provide funding to transportation<br />
agencies.<br />
Department of Homeland Security –<br />
Intercity Bus Security Grant<br />
Following September 11, 2001 the President gave a directive<br />
to create a comprehensive transportation security strategy.<br />
In doing so the Department of Homeland Security created<br />
the Intercity Bus Security Grant. The objective of this<br />
program is to improve the security for operators and<br />
passengers by providing bus security awareness and<br />
enhancements in over-the-road buses that are used in<br />
intercity fixed-route service as well as other services (e.g.,<br />
charters).<br />
Environmental Protection Agency (EPA) – Brownfield’s<br />
Program<br />
In response to the increasing number of Brownfield sites EPA<br />
created the Brownfield’s Program. A Brownfield site is<br />
defined as any site contaminated by a controlled substance,<br />
petroleum or a petroleum product excluded from the<br />
Section VI<br />
5-Year Fiscal Picture<br />
258
definition of ‘hazardous substance’ and/or mine-scarred<br />
land.<br />
More than 600,000 properties that were once used for<br />
industrial, manufacturing, or commercial uses were lying<br />
abandoned or underused due to the suspicion of hazardous<br />
substance contamination. Brownfield areas, particularly<br />
those in city centers, were contributing to blight and<br />
joblessness in surrounding communities. Unknown<br />
environmental liabilities were preventing communities,<br />
developers, and investors from restoring these properties to<br />
productive use and revitalizing impacted neighborhoods.<br />
The Brownfield’s Program allows funding to be used to<br />
assess land contamination and be used for land clean-up. In<br />
addition, the Brownfield’s Program provides a revolving loan<br />
fund to help expedite the clean up process.<br />
In FY 2005, EPA agreed to assess land contamination at<br />
Rialto and E Street for the San Bernardino Intermodal <strong>Transit</strong><br />
Center.<br />
State Funding<br />
There are two principal funding sources available from the<br />
State of California. Both are administered through the State<br />
Transportation Improvement Program (STIP). The first is the<br />
Public Transportation Account (PTA). The second is the STIP<br />
itself, which is oriented exclusively to capital improvements.<br />
State <strong>Transit</strong> Assistance Funds (STA)<br />
The only funds currently available to <strong>Omnitrans</strong> through the<br />
PTA are via the State <strong>Transit</strong> Assistance Fund (STA) program.<br />
STA funds are allocated to SANBAG and to each public<br />
operator. Funds allocated to SANBAG are made available to<br />
operators based on their service area population. STA funds<br />
can be used either for transit operations or capital projects.<br />
There are eligibility requirements that must be met in order<br />
for a transit operator to receive these funds. The operator<br />
must meet the applicable ratio of passenger fares to<br />
operating cost. In addition, operators seeking STA for<br />
operations must show that their most-recent audited<br />
operating cost per revenue vehicle hour does not exceed the<br />
259
prior year or average of the prior three years’ operating cost<br />
per revenue hour adjusted by the change in the Consumer<br />
Price Index for the same period.<br />
Due to the State budget crisis, SANBAG estimates that STA<br />
will remain flat through FY 2009, with an estimated<br />
apportionment to <strong>Omnitrans</strong> of $2.2 million annually.<br />
Beginning in FY 2010, STA funds are estimated to increase to<br />
$7.0 million annually with Proposition 42 funding. The <strong>Plan</strong><br />
proposes to use these funds to as local match to federally<br />
funded capital projects.<br />
An additional $3.0 million in prior year unallocated carryover<br />
funds are being held in reserve by SANBAG as a contingency<br />
in the event that actual STA funds available to the County fall<br />
below the forecast $3.0 million in any one year.<br />
In the most positive scenario – the provisions of Proposition<br />
42 and fuel taxes are enacted as originally envisioned --<br />
<strong>Omnitrans</strong> could receive an estimated annual increase of<br />
$8.3 million annually in STA funds as soon as next fiscal year.<br />
Given the current status of State finances, this does not seem<br />
likely at this point in time.<br />
Section VI<br />
5-Year Fiscal Picture<br />
260
Figure VI-10<br />
Local and Regional Funding<br />
By far, the primary source of funding for transit operations at<br />
the local level is the Local Transportation Fund (LTF). Within<br />
each county, ¼-cent of the sales tax collected is made<br />
available to support transit operating and capital projects.<br />
Local Transportation Funds<br />
In 1972, SB 325 created a fund for transportation purposes.<br />
These funds are derived from a ¼-cent sales tax and<br />
distributed by SANBAG. These funds are intended to be<br />
"transit first" funding, meaning that funds are expected to be<br />
spent on transit projects to the extent that such projects are<br />
meeting all "transit needs that are reasonable to meet."<br />
There is no universally accepted definition of reasonable to<br />
meet, and individual Regional Transportation <strong>Plan</strong>ning<br />
Agencies (RTPA’s) must make their own determination.<br />
These funds can be used for capital expenditures or<br />
261
operations or a combination thereof.<br />
LTF is apportioned to area cities and the County based on<br />
population and transit operators are eligible as long as<br />
required farebox ratios are maintained. Projections estimate<br />
5.77 percent growth annually between FY <strong>2006</strong> and FY<br />
2010. A recession is forecast in FY <strong>2011</strong> with a resulting<br />
impact on estimated LTF, forecast to grow at 3.4 percent<br />
compared to the prior year.<br />
In prior years, SANBAG drew $5.5 million annually in LTF to<br />
support the commuter rail program. The draw for commuter<br />
rail is expected to be $8.2 million in FY <strong>2006</strong> and continue in<br />
the $8-$9 million range for FY 2007 through FY <strong>2011</strong>. This<br />
increase in the use of LTF is for expansion in the number of<br />
Metrolink trains serving San Bernardino County.<br />
The current practice is to allocate the balance of LTF, after<br />
commuter rail needs are met, to <strong>Omnitrans</strong>. The level of LTF<br />
available to <strong>Omnitrans</strong> in FY <strong>2006</strong> is estimated to be $40.5<br />
million and $42.0 million in FY 2007, exclusive of allocated<br />
and unallocated prior year carryover funds. In FY 2008 and<br />
FY 2009, LTF funds are forecasted to increase to $46 and<br />
$49.6 million, respectively. In FY 2010 and FY <strong>2011</strong>, LTF<br />
funds are forecasted to increase to $53 and $55 million.<br />
Figure VI-11 shows the LTF funding cycle.<br />
Section VI<br />
5-Year Fiscal Picture<br />
262
Figure VI-11<br />
Prior year LTF funds totaling $4.8 million are available to<br />
<strong>Omnitrans</strong> to supplement current year revenues. This<br />
includes $3.75 million of unallocated LTF available to<br />
<strong>Omnitrans</strong>, pending SANBAG Board action.<br />
Measure I Local Sales Tax for <strong>Transit</strong><br />
The ½-cent sales tax available for transportation projects in<br />
San Bernardino County is administered by SANBAG and<br />
includes a provision of six percent of funds for the Elderly<br />
and Handicapped Program. There is a one percent set-aside<br />
for ADA Mediation services and other educational projects in<br />
the Valley. <strong>Omnitrans</strong> is allocated the remainder of these<br />
funds to use for fare subsidy and direct services subsidy. This<br />
sales tax is estimated to grow at the same rates as the LTF.<br />
263
In FY 2010 the current Measure I Local Sales Tax for <strong>Transit</strong><br />
will sunset. In November 2004, this Measure was approved<br />
for extension by voters and effective in 2010, Measure I will<br />
include two percent express bus/BRT, and eight percent to<br />
senior and disabled services, including two percent for the<br />
creation of a centralized transit services agency (CTSA) and<br />
continuation of the training and scholarships educational<br />
programs that currently exist.<br />
This <strong>Plan</strong> assumes that <strong>Omnitrans</strong> will continue to secure its<br />
existing share of Measure I Funds as a senior and disabled<br />
fare subsidy. These funds are estimated at $5.3 million in FY<br />
<strong>2006</strong> with growth of 5.77 percent annually through FY 2010<br />
and 3.4 percent in FY <strong>2011</strong>. It is estimated that these fare<br />
subsidy funds will reach $7.4 million annually by FY <strong>2011</strong>.<br />
An additional $0.6 million in funds for BRT service are<br />
estimated to be available in FY 2010 and to grow to $2.6<br />
million in FY <strong>2011</strong>, the first full year of the Measure I<br />
Reauthorization. These funds are assumed as local match<br />
for FTA Section 5309 capital funds for the BRT project. A<br />
future decision that <strong>Omnitrans</strong> will need to make is whether<br />
to implement the BRT Project on a Pay-As-You-Go Cash Basis<br />
or through some other financing mechanism.<br />
Also under the Measure I Reauthorization, some $3.1 million<br />
in funds will be available for CTSA and educational program<br />
purposes in FY <strong>2011</strong>. <strong>Omnitrans</strong> may seek to obtain a<br />
portion of these funds to support increased levels of service<br />
to seniors who would otherwise not be eligible for ADA<br />
service. Under the constrained, up-to-standards and<br />
unconstrained plans, <strong>Omnitrans</strong> would link service<br />
expansion to increased Measure I funding.<br />
Advertising and Auxiliary Revenues<br />
<strong>Omnitrans</strong> generates revenues from investment income and<br />
advertising allowed on its vehicles. On an annual basis,<br />
these two sources generate about $1.2 million in revenue<br />
that is used for operations. Because of low interest rates,<br />
and uncertain economy, these funds are projected to<br />
increase at a rate of 1.6 to two percent annually, far below<br />
the forecast rate of inflation for the <strong>Plan</strong> period. A new<br />
advertising contract will be awarded in the FY 2007 plan<br />
Section VI<br />
5-Year Fiscal Picture<br />
264
year. It is assumed that revenues from this contract will<br />
increase by four percent with the new contract.<br />
Potential New Revenue Sources<br />
Two funding sources are identified as potential opportunities<br />
that <strong>Omnitrans</strong> is currently working on. These include:<br />
Dedication of a Local Funding Source – Current Measure I<br />
funds, which sunset in 2009, were reauthorized by 80% of<br />
the voters in the County in November 2004. Additional<br />
funds have been made available to <strong>Omnitrans</strong> through the<br />
extension of Measure I for express bus/BRT and<br />
senior/disabled transit services.<br />
Surface Transportation Program (STP) Flexible Funds<br />
Exchanged for FTA Section 5310 Operating Funds For<br />
Access Service – STP funds are highly competitive, but they<br />
may be used for transit projects. For example, in Los Angeles<br />
County, STP Flex Funds are traded for FTA Section 5310<br />
operating funds and programmed to meet a portion of ADA<br />
service provider contract costs. Pursuing STP funds for<br />
Access contract service costs is an option that has yet to be<br />
explored.<br />
Revenue Summary<br />
Figure VI-12 provides a summary of existing revenue sources<br />
and assumptions for the Financially Constrained <strong>Plan</strong>. These<br />
revenue estimates have been reviewed by SANBAG staff as<br />
part of the SRTP development process.<br />
265
Figure VI-12<br />
Summary of Revenue Sources<br />
Revenue Category<br />
Current Year Year 1 <strong>Plan</strong> Year 2 <strong>Plan</strong> Year 3 <strong>Plan</strong> Year 4 <strong>Plan</strong> Year 5 <strong>Plan</strong> Year 6 <strong>Plan</strong><br />
Budget FY05 FY06<br />
FY07<br />
FY08<br />
FY09<br />
FY10<br />
FY11<br />
Local Measure I Sales Tax<br />
SB Valley Measure I E&H Funds $ 5,100,000<br />
$ 8,076,155 $ 10,467,600<br />
1% Set-Aside FY05 to FY10; 2% in FY11 (a) $ 51,000 $ 1,392,441 $ 3,116,900<br />
6% E&H Funds for <strong>Omnitrans</strong> $ 5,049,000 $ 5,340,327 $ 5,648,464 $ 5,974,381 $ 6,319,102 $ 6,683,715 $ 7,350,700<br />
2% BRT & Express Bus Reauthorization $ - $ - $ - $ - $ - $ 556,976 $ 2,616,900<br />
Percentage Increase 5.77% 5.77% 5.77% 5.77% 5.77% 3.40%<br />
State <strong>Transit</strong> Assistance Fund<br />
Unallocated Carryover (b) $ 3,000,000 $ - $ - $ - $ - $ - $ -<br />
Countywide Allocation $ 3,000,000 $ 3,000,000 $ 3,000,000 $ 3,000,000 $ 3,000,000 $ 7,000,000 $ 7,000,000<br />
SB Valley Allocation (<strong>Omnitrans</strong>) $ 2,217,000 $ 2,417,000 $ 2,217,000 $ 2,217,000 $ 2,217,000 $ 5,250,000 $ 5,250,000<br />
Mountain/Desert Allocation $ 783,000 $ 583,000 $ 783,000 $ 783,000 $ 783,000 $ 1,750,000 $ 1,750,000<br />
Percentage Increase 0% 0% 0% 0% Prop 42 TCRP/STAF<br />
Local Transportation Fund (LTF)<br />
SB Valley Apportionment $ 46,358,000 $ 49,032,857 $ 51,862,052 $ 54,854,493 $ 58,019,597 $ 61,367,328 $ 63,453,817<br />
SCRRA (per current Bd. Policy) $ 7,900,000 $ 8,546,000 $ 9,851,000 $ 8,742,000 $ 8,395,000 $ 8,395,000 $ 8,731,000<br />
SB Valley Allocation (<strong>Omnitrans</strong>) $ 38,458,000 $ 40,486,857 $ 42,011,052 $ 46,112,493 $ 49,624,597 $ 52,972,328 $ 54,722,817<br />
Unallocated Carryover (a) $ 9,000,000 $ 3,750,000 $ - $ - $ - $ - $ -<br />
Prior Year Carryover (<strong>Omnitrans</strong>) $ 2,848,483 $ - $ - $ - $ - $ - $ -<br />
Percentage Increase 5.77% 5.77% 5.77% 5.77% 5.77% 3.40%<br />
FTA Section 5307<br />
SB Fixed Guideway Funds $ 4,405,013 $ 4,405,013 $ 4,405,013 $ 4,405,013 $ 4,405,013 $ 4,405,013 $ 4,405,013<br />
SB Formula Funds (<strong>Omnitrans</strong>) $ 13,045,016 $ 13,045,016 $ 13,045,016 $ 13,045,016 $ 13,045,016 $ 13,045,016 $ 13,045,016<br />
Total SB Apportionment Section 5307 $ 17,450,029 $ 17,450,029 $ 17,450,029 $ 17,450,029 $ 17,450,029 $ 17,450,029 $ 17,450,029<br />
Percentage Increase 0% 0% 0% 0% 0% 0%<br />
FHWA CMAQ<br />
Total SB Apportionment $ 9,150,000 $ 9,350,000 $ 9,500,000 $ 9,700,000 $ 9,900,000 $ 9,900,000 $ 9,900,000<br />
<strong>Omnitrans</strong> Approved Projects $ - $ - $ - $ 9,317,200 $ 9,317,200 Projects Selection TBD<br />
Percentage Increase 2% 2% 2% 2% 0% 0%<br />
(a) 1% Set-Aside thru all but last quarter of FY 2010 and 2% in FY <strong>2011</strong> for CTSA + $500,000 for Training and Scholarships<br />
(b) Unallocated carryover of STA and LTF funds to be used to offset potential transit fund decreases resulting from State budget crisis and/or for one-time costs.<br />
Capital <strong>Plan</strong><br />
Constrained Scenario<br />
<strong>Omnitrans</strong> proposes a six-year capital plan that emphasizes<br />
replacement first and includes significant constraints<br />
compared to previous expansion plans. The following<br />
outlines a capital plan based on a Constrained Funding<br />
Scenario.<br />
Fixed-Route Vehicles<br />
The capital replacement plan for fixed-route vehicles assumes<br />
constrained funding. Because of constrained funding, fleet<br />
requirements are not projected to change over the next six<br />
years, aside from changes in FY06.<br />
Section VI<br />
5-Year Fiscal Picture<br />
266
Figure VI-13<br />
Fleet Requirements Financially Constrained Scenario<br />
Fleet<br />
FY05 Current<br />
FY06-11 <strong>Plan</strong>ned Net<br />
Requirements Peak Spares Total Peak Spares Total Change<br />
40’ Coaches 129 25 154 135 26 161 7<br />
Inland Empire 6 1 7 6 1 7 0<br />
Mid-Sized 9 3 12 9 3 12 0<br />
Coaches<br />
Redlands Trolley 2 1 3 2 1 3 0<br />
The spare ratio is 16 percent for directly-operated 40-foot<br />
fixed route vehicles, 25 percent for the Inland Empire<br />
Connection and mid-sized vehicles, and 33 percent for the<br />
Redlands Trolley.<br />
During the next six years, 100 fixed-route vehicles will<br />
require replacement, based on a 12-year useful life cycle.<br />
In FY 2008 and FY 2009 CMAQ will be allocated to<br />
<strong>Omnitrans</strong> for 32 vehicles for a total of $15 million ($12<br />
million CMAQ/$3 million local).<br />
Paratransit/Demand Response Vehicles<br />
The paratransit/demand response fleet is not anticipated to<br />
grow under the constrained financial scenario, except for the<br />
seven vehicles for which 5310 funds were received. Fleet<br />
requirements are shown below.<br />
Figure VI-14<br />
Paratransit/Demand Response Vehicle Requirements<br />
Fleet<br />
FY05 Current<br />
FY06-11 <strong>Plan</strong>ned Net<br />
Requirements Peak Spares Total Peak Spares Total Change<br />
Paratransit<br />
Vehicles<br />
88 13 101 88 13 101 0<br />
During the next six years, 185 vehicles will require<br />
replacement, due to their four-year life. The useful life<br />
assumption for paratransit vehicles is four years based on<br />
FTA definitions. CMAQ will be allocated to <strong>Omnitrans</strong> for<br />
replacement of 100 vehicles in FY 2008 and FY 2009 for a<br />
total of $8.3 million ($6.6 million CMAQ/$1.6 million local).<br />
267
Mid-Life Repairs<br />
<strong>Omnitrans</strong>’ fixed-route vehicles average more than 50,000<br />
annual miles. As a result, mid-life overhauls are required to<br />
ensure that vehicles are kept in top performing order. Funds<br />
are only budgeted in FY 2007 and FY 2010 for this program.<br />
This includes funds towards the 2001, 2002 and 2004 New<br />
Flyers.<br />
Capitalization of Preventive Maintenance Costs<br />
Federal Transportation Equity Act of the 21st Century (TEA-<br />
21) Section 5307 funding guidelines allow transit agencies to<br />
utilize a portion of these formula funds for preventive<br />
maintenance activities. In the past, <strong>Omnitrans</strong> has<br />
capitalized approximately 45 percent of the Maintenance<br />
Department’s operating budget. This practice is proposed to<br />
continue through the six-year plan period as a necessary<br />
strategy for balancing the operating budget in this<br />
Constrained Funding Scenario. The alternative is to use 100<br />
percent local funds to balance the operating budget, leaving<br />
an insufficient balance of local funds available for match of<br />
federal capital funds. The strategy of capitalizing preventive<br />
maintenance costs maximizes the use of federal funds in this<br />
scenario.<br />
Support Vehicles<br />
This on-going program replaces existing support vehicles<br />
when they reach the end of their useful life. <strong>Omnitrans</strong> will<br />
be leasing vehicles for five-year terms during the life of this<br />
SRTP, as it has been determined to be a more cost effective<br />
method of vehicle replacement and vehicle maintenance.<br />
The cost of the lease and maintenance is included in the<br />
overall lease price. However, only the lease cost is included<br />
as a capital expense; maintenance costs will be put in the<br />
Maintenance Department annual budget. All vehicles will be<br />
replaced on a useful-life basis. All vehicles are shown in<br />
Figure VI-15.<br />
Section VI<br />
5-Year Fiscal Picture<br />
268
Figure VI-15<br />
Support Vehicle Replacement Requirements<br />
Support Vehicle<br />
Types<br />
FY06 FY07 FY08 FY09 FY10 FY11 Total FY 06<br />
to FY11<br />
Relief Vehicles 6 15 0 6 0 6 33<br />
Maintenance<br />
Support Vehicles<br />
2 2 0 2 2 0 8<br />
Staff Vehicles 7 13 0 4 0 7 31<br />
Shop Equipment 0 1 2 0 1 0 4<br />
Total Support<br />
Vehicles<br />
15 31 2 12 3 13 76<br />
Facility Improvements<br />
Scheduled facility upkeep and improvement projects are<br />
estimated to cost $3.5 million over 6 years. This includes<br />
$305,000 in FY 2007 for alternative fueling facilities at the<br />
East and West Valley and $200,000 in FY08 for LCNG<br />
(Liquefied and Compressed Natural Gas) Station<br />
maintenance. In addition, a number of smaller interior and<br />
exterior facility maintenance projects are planned (e.g.,<br />
parking lot maintenance, painting of buildings, new carpet,<br />
roof maintenance). These projects are aimed at ensuring<br />
that facilities are safe and in good repair throughout their<br />
useful life.<br />
Service Equipment<br />
New equipment is needed on an on-going basis to replace<br />
and supplement outmoded materials now in use at both the<br />
East and West Valley facilities. Items include brake lathes, a<br />
fluid management system, methane sensors, automatic<br />
external defibrillators, HAZMAT storage containers, and spill<br />
and clean-up kits.<br />
Office Furniture & Computer Equipment<br />
This project includes $100,000 over the six-year plan for<br />
office furniture and equipment. On-going Management<br />
Information System (MIS) costs associated with system<br />
upgrades are estimated to cost $7 million over the six-year<br />
period.<br />
269
Revenue Equipment<br />
This project includes funding over the six-year plan for the<br />
replacement of video equipment on fixed route buses.<br />
<strong>Transit</strong> Enhancements & Passenger Amenities<br />
TEA-21 states that one percent of federal Section 5307<br />
apportionments must be spent on “transit enhancements.”<br />
Such enhancements include bus shelters, landscaping and<br />
other scenic beautification (e.g., tables, benches, trash<br />
receptacles, lights), public art, installation of equipment for<br />
transporting bicycles on transit vehicles, signage, and<br />
enhanced access for persons with disabilities to mass<br />
transportation. Over the next six years, <strong>Omnitrans</strong> proposes<br />
to spend $1 million on transit enhancements and related<br />
improvements in passenger amenities. Projects proposed are<br />
for other on-going improvements to stops and zones, transit<br />
centers, and key transfer locations.<br />
<strong>Transit</strong> Security<br />
TEA-21 also requires that one percent of federal Section<br />
5307 apportionments be spent on projects that improve<br />
transit security. These may include items such as increased<br />
lighting at bus stops, camera surveillance of an area within,<br />
or adjacent to, the transit system, provision of emergency<br />
communication links, security analysis studies, salaries and<br />
contracts for personnel involved exclusively in security, and<br />
any other project intended to increase the security and<br />
safety of the transit system. <strong>Omnitrans</strong> proposes $1 million<br />
in safety and security projects. Projects proposed include<br />
preparation of a Safety & Security Program <strong>Plan</strong> and bus yard<br />
and public/employee parking security gate control system,<br />
gates, and tire spikes. Funds are also proposed for disaster<br />
preparedness and LNG/CNG risk management plans, and<br />
on-going security and safety improvement projects.<br />
Up-to-Standards Scenario<br />
Up-to-Standards are a set of goals that the agency would like<br />
to reach. As money and resources become available these<br />
goals are achieved. Often the funding does not come all at<br />
once however this plan also lets other agencies know plans<br />
are in place when and if the money becomes available.<br />
Elements that are not included in this scenario due to the<br />
uncertainty of when this building will be completed, but will<br />
Section VI<br />
5-Year Fiscal Picture<br />
270
e needed none-the-less are additional relief vehicles,<br />
office/computer equipment, security expenses, and facility<br />
maintenance.<br />
Mid-Valley Facility<br />
<strong>Omnitrans</strong> has begun planning for a new mid-Valley facility<br />
to accommodate potential growth in the fleet, should<br />
operating funds become available. The current facilities can<br />
accommodate up to 200 coaches. Beyond this level, a new<br />
facility will be needed to store and maintain vehicles. To<br />
date, <strong>Omnitrans</strong> has spent $6.3 million on this project for<br />
land purchases and has secured an additional $2.2 million in<br />
architectural and engineering services to design the<br />
proposed new facility. The Mid Valley Facility is estimated to<br />
need $55.72 million if built in FY 2010.<br />
Expansion Vehicles<br />
To meet the needs shown in the Up-to-Standards scenario,<br />
an additional 50 peak coaches will be needed and 13 spares.<br />
An estimated $42 million is needed for these coaches.<br />
Unconstrained Scenario<br />
Unconstrained scenario goes one step beyond Up-to-<br />
Standards as it looks at the entire service area and tried to<br />
meet all the feasible transit needs of San Bernardino Valley.<br />
Expansion Vehicles<br />
In order to keep pace with the projected growth in<br />
population, <strong>Omnitrans</strong> will need to expand both its fixedroute<br />
bus and complementary ADA paratransit services, as<br />
outlined in the service and financial plans for the<br />
“Unconstrained Scenario.” <strong>Omnitrans</strong> will require an<br />
additional 38 peak transit coaches and eight spares for fixed<br />
route operations under the Unconstrained Scenario. In<br />
addition, six peak (and one spare) paratransit vehicles are<br />
also required. The total cost of these vehicles is estimated at<br />
$30 million for coaches and $0.6 million for paratransit vans.<br />
<strong>Omnitrans</strong> will be unable to cover the cost of vehicle<br />
expansions without the benefit of discretionary funds. In the<br />
Unconstrained Scenario, <strong>Omnitrans</strong> will be aggressively<br />
pursuing Congestion Mitigation and Air Quality (CMAQ)<br />
funds to pay for 88.53 percent of the cost of these vehicles,<br />
assuming operating dollars are available to implement the<br />
services decribed. There is no guarantee, however, that<br />
271
<strong>Omnitrans</strong> will receive these funds.<br />
E Street BRT Major Investment Study<br />
The North-South BRT service from Loma Linda to Cal State<br />
San Bernardino will closely follow the existing Route 2<br />
alignment. Implementation of this project includes three<br />
planning phases: Major Investment Study; Environmental<br />
Impact Report; and Preliminary Engineering. Funds for these<br />
activities are included in the proposed capital plan for<br />
$300,000 in FY <strong>2006</strong>. Preliminary cost of the project is<br />
estimated at $41,000,000.<br />
Capital <strong>Plan</strong> Summary & Funding Strategy<br />
The six-year capital improvement plan is presented in Figure<br />
VI-16. It lists each project category and shows the funding<br />
required over the six-year plan period to be $128 million.<br />
Expansion efforts will require that <strong>Omnitrans</strong> secure<br />
discretionary funding and use new financing mechanisms<br />
for local match. And, in order to expand its fleet, <strong>Omnitrans</strong><br />
will require increased facility space. The costs for expansion<br />
projects are not shown in Figure VI-16. These costs were<br />
discussed in the capital project section above and include:<br />
<br />
<br />
<br />
Mid-Valley Facility at approximately $55.7 million for<br />
construction<br />
E Street BRT at approximately $41 million for construction<br />
(note that costs are being refined in a separate study and<br />
are currently estimated)<br />
Expansion Vehicles at approximately $73 million.<br />
The capital needs shown in Figure VI-16 may be supported<br />
with the revenue estimated to be available over the next six<br />
years. Proposed funding includes Federal Section 5307<br />
funds estimated to be available to <strong>Omnitrans</strong> on a formula<br />
apportionment basis. These funds require a 20 percent local<br />
match. State <strong>Transit</strong> Assistance Funds (STAF) and a small<br />
amount of Local Transportation Funds (LTF) are proposed as<br />
the local match. Figure VI-17 shows revenue sources<br />
proposed for the capital program relative to the total capital<br />
Section VI<br />
5-Year Fiscal Picture<br />
272
program cost. Revenues are sufficient through the life of<br />
this plan under the Constrained Scenario.<br />
Approximately $129 million is estimated in capital revenues<br />
over the six-year period. This does not include potential new<br />
discretionary sources or the local match on these funds that<br />
may be secured in the future.<br />
While funds are sufficient for the Constrained Funding<br />
Scenario, additional sources (both operating and capital) will<br />
be required for future growth in <strong>Omnitrans</strong>’ services. The<br />
proposed strategy is for <strong>Omnitrans</strong> to seek Federal Section<br />
5309 funds (or other federal funding) for construction of a<br />
new facility with local match to be provided by financing<br />
mechanisms for a total of $55.7 million. CMAQ funds have<br />
been allocated for vehicle replacements in FY08 for a total of<br />
$7.5 million ($6 million CMAQ/$1.5 million local) and in FY09<br />
for a total of $7.5 million ($6 million CMAQ/$1.5 million<br />
local). The Constrained Funding Scenario assumes the local<br />
match of $3 million in FY 2008 and FY 2009 for vehicle<br />
replacement.<br />
Discretionary Grants Secured<br />
<strong>Omnitrans</strong> has been successful in garnering support of<br />
transit projects, including funding for five replacement<br />
paratransit vehicles in FY 2005 and seven expansion<br />
paratransit vehicles in FY <strong>2006</strong>. <strong>Omnitrans</strong> will request<br />
funding for the projects shown in Figure VI-18.<br />
273
Section VI<br />
5-Year Fiscal Picture<br />
274<br />
Figure VI-16<br />
Six-Year Capital <strong>Plan</strong> – Constrained <strong>Plan</strong><br />
Project <strong>2006</strong> 2007 2008 2009 2010 <strong>2011</strong> Total<br />
SERVICE EQUIPMENT $ 43,100 $ 352,688 $ 31,000 $ - $ - $ 7,000 $ 433,788<br />
STOPS & ZONES $ 34,466 $ 35,672 $ 36,921 $ 38,212 $ 39,550 $ 40,934 $ 225,755<br />
SERVICE VEHICLES $ 469,500 $ 894,000 $ 78,000 $ 369,750 $ 155,500 $ 436,250 $ 2,403,000<br />
REPL. HEAVY DUTY COACHES $ 8,247,801 $ - $ 6,548,487 $ 8,626,142 $ 5,376,252 $ 2,841,862 $ 23,392,743<br />
EXPAN. HEAVY DUTY COACHES $ - $ - $ - $ - $ - $ - $ -<br />
REPL. MEDIUM DUTY COACHES $ - $ - $ - $ - $ 1,416,018 $ - $ -<br />
SECURITY $ 163,075 $ 163,075 $ 163,075 $ 163,075 $ 163,075 $ 163,075 $ 978,450<br />
PREVENTIVE MAINTENANCE $ 7,885,149 $ 11,321,532 $ 11,916,079 $ 10,878,631 $ 11,418,964 $ 12,010,742 $ 65,431,097<br />
OFFICE EQUIPMENT $ 15,000 $ 15,525 $ 16,068 $ 16,631 $ 17,213 $ 17,815 $ 98,252<br />
CAPITALIZATION OF LEASES $ 89,000 $ 93,000 $ 97,000 $ 100,000 $ 104,000 $ 108,000 $ 591,000<br />
MIS $ 844,121 $ 436,200 $ 692,569 $ 864,600 $ 362,910 $ 3,732,861 $ 6,933,261<br />
SBX $ 300,000 $ 500,000 $ - $ - $ - $ - $ 800,000<br />
FACILITY IMPROVEMENTS $ 356,447 $ 465,000 $ 144,937 $ 1,560,593 $ 106,678 $ 6,500 $ 2,640,155<br />
TRANSIT ENHANCEMENTS $ 163,075 $ 163,075 $ 163,075 $ 163,075 $ 163,075 $ 163,075 $ 978,450<br />
ALT. FUELING FACILITIES $ - $ 305,000 $ 200,000 $ - $ - $ 370,730 $ 875,730<br />
REVENUE EQUIPMENT $ 521,355 $ - $ - $ - $ 499,173 $ - $ 1,020,528<br />
REPL. PARA VEHICLES $ 755,080 $ 1,953,775 $ 4,157,000 $ 4,157,000 $ - $ - $ 11,022,855<br />
EXPAN. PARA VEHICLES $ 577,822<br />
TRANSCENTER DEVELOPMENT $ 1,415,497 $ - $ - $ - $ - $ - $ 1,415,497<br />
MID VALLEY FACILITY $ - $ - $ - $ - $ - $ - $ -<br />
TOTAL CAPITAL $ 21,880,488 $ 16,698,542 $ 24,244,211 $ 26,937,709 $ 19,822,408 $ 19,898,844 $ 129,482,202<br />
Redlands Trolley & JARC $ 894,086 $ - $ - $ - $ - $ - $ 894,086<br />
GROSS CAPITAL $ 22,774,574 $ 16,698,542 $ 24,244,211 $ 26,937,709 $ 19,822,408 $ 19,898,844 $ 130,376,288
Figure VI-17<br />
Revenues for the Six-Year Capital <strong>Plan</strong><br />
Capital Revenues<br />
Year 1 FY06 Year 2 FY07 Year 3 FY08 Year 4 FY09 Year 5 FY10 Year 6 FY11 Six-Year Total<br />
STA $ 2,417,000 $ 2,217,000 $ 2,217,000 $ 2,217,000 $ 5,250,000 $ 5,250,000 $ 19,568,000<br />
LTF $ 2,339,637 $ 1,044,254 $ 2,254,964 $ 2,254,964 $ -<br />
-<br />
LTF Carryover $ 734,483 $ - $ - $ - $ -<br />
-<br />
$ $ 7,893,819<br />
$ $ 734,483<br />
FTA Section 5307 $ 13,045,016 $ 13,045,016 $ 13,045,016 $ 13,045,016 $ 13,045,016 $ 13,045,016 $ 78,270,096<br />
FTA Section 5307 (FY 02 CA-90-Y098) $ 2,837,352 $ - $ - $ - $ - $ - $ 2,837,352<br />
CMAQ $ - $ - $ 9,317,200 $ 9,317,200 $ - $ - $ 18,634,400<br />
JARC $ 423,836 $ - $ - $ - $ - $ - $ 423,836<br />
CMAQ/Redlands Trolley $ 470,250 $ - $ - $ - $ - $ - $ 470,250<br />
FTA Section 5310 $ 507,000 $ - $ - $ - $ - $ - $ 507,000<br />
Total Capital Revenues $ 22,774,574 $ 26,834,180 $ 26,834,180 $ 18,295,016 $ 129,339,236<br />
Annual Capital Program (<strong>Short</strong>fall)/Surplus $ - $ (392,272) $ 2,589,970 $ (103,529) $ (111,374) $ (1,603,828) $ 378,968<br />
Cumulative Capital Program (<strong>Short</strong>fall)/Surplus $ - $ (392,272) $ 2,197,698 $ 2,094,169 $ 1,982,796 $ 378,968 $ 378,968<br />
275
Section VI<br />
5-Year Fiscal Picture<br />
276<br />
Figure VI-18<br />
Discretionary Funding<br />
Approved Discretionary Grants<br />
& Other<br />
Discretionary Requests<br />
FY05 FY06 FY07 FY08 FY09 FY10 FY11<br />
Repl. Paratransit Vehicles $ 221,250 * $ 1,750,000 ** $ 1,800,000 **<br />
Expan. Paratransit Vehicles $ 364,000 * $1,750,000 **<br />
Repl. Heavy Duty Coaches<br />
Expan. Heavy Duty Coaches<br />
Mid Valley Facility $ 43,200,000 **<br />
BRT<br />
Chaffey <strong>Transit</strong> Center $1,200,000 **<br />
Yucaipa <strong>Transit</strong> Center<br />
* Funding has been awarded. ** Funding has or will be requested.
Figure VI-19<br />
Six-Year Capital <strong>Plan</strong> - Up-to-Standards<br />
Project <strong>2006</strong> 2007 2008 2009 2010 <strong>2011</strong> Total<br />
SERVICE EQUIPMENT $ 43,100 $ 352,688 $ 31,000 $ - $ - $ 7,000 $ 433,788<br />
STOPS & ZONES $ 34,466 $ 35,672 $ 36,921 $ 38,212 $ 39,550 $ 40,934 $ 225,755<br />
SERVICE VEHICLES $ 469,500 $ 906,250 $ 78,000 $ 369,750 $ 155,500 $ 436,250 $ 2,415,250<br />
REPL. HEAVY DUTY COACHES $ 8,247,802 $ - $ 9,692,323 $ 9,858,448 $ 13,532,679 $ 12,540,741 $ 45,624,191<br />
EXPAN. HEAVY DUTY COACHES $ 8,006,445 $ 8,286,670 $ 8,576,704 $ 8,194,051 $ 8,480,843 $ - $ 41,544,713<br />
REPL. MEDIUM DUTY COACHES $ - $ - $ - $ - $ 1,416,018 $ - $ -<br />
SECURITY $ 163,075 $ 163,075 $ 163,075 $ 163,075 $ 163,075 $ 163,075 $ 978,450<br />
PREVENTIVE MAINTENANCE $ 7,885,149 $ 11,321,532 $ 11,916,079 $ 10,878,631 $ 11,418,964 $ 12,010,742 $ 65,431,097<br />
OFFICE EQUIPMENT $ 15,000 $ 15,525 $ 16,068 $ 16,631 $ 17,213 $ 17,815 $ 98,252<br />
CAPITALIZATION OF LEASES $ 89,000 $ 93,000 $ 97,000 $ 100,000 $ 104,000 $ 108,000 $ 591,000<br />
MIS $ 844,121 $ 436,200 $ 692,569 $ 864,600 $ 362,910 $ 3,732,861 $ 6,933,261<br />
SBX $ 300,000 $ 500,000 $ - $ - $ - $ - $ 800,000<br />
FACILITY IMPROVEMENTS $ 356,447 $ 465,000 $ 144,937 $ 1,560,593 $ 106,678 $ 6,500 $ 2,640,155<br />
TRANSIT ENHANCEMENTS $ 163,075 $ 163,075 $ 163,075 $ 163,075 $ 163,075 $ 163,075 $ 978,450<br />
ALT. FUELING FACILITIES $ - $ 305,000 $ 200,000 $ - $ - $ 370,730 $ 875,730<br />
REVENUE EQUIPMENT $ 521,355 $ - $ - $ - $ 499,173 $ - $ 1,020,528<br />
REPL. PARA VEHICLES $ 755,080 $ 1,953,775 $ 4,157,000 $ 4,157,000 $ 2,166,175 $ 2,242,000 $ 15,431,030<br />
EXPAN. PARA VEHICLES $ 577,822 $ - $ - $ - $ - $ - $ 577,822<br />
TRANSCENTER DEVELOPMENT $ 1,415,497 $ - $ - $ - $ - $ - $ 1,415,497<br />
MID VALLEY FACILITY $ - $ 13,930,000 $ 13,930,000 $ 13,930,000 $ 13,930,000 $ - $ 55,720,000<br />
TOTAL $ 29,886,934 $ 38,927,462 $ 49,894,751 $ 50,294,066 $ 52,555,853 $ 31,839,723 $ 253,398,789<br />
277
Section VI<br />
5-Year Fiscal Picture<br />
278<br />
Figure VI-20<br />
Six-Year Capital <strong>Plan</strong> – Unconstrained<br />
Project <strong>2006</strong> 2007 2008 2009 2010 <strong>2011</strong> Total<br />
SERVICE EQUIPMENT $ 43,100 $ 352,688 $ 31,000 $ - $ - $ 7,000 $ 433,788<br />
STOPS & ZONES $ 34,466 $ 35,672 $ 36,921 $ 38,212 $ 39,550 $ 40,934 $ 225,755<br />
SERVICE VEHICLES $ 469,500 $ 906,250 $ 78,000 $ 369,750 $ 155,500 $ 436,250 $ 2,415,250<br />
REPL. HEAVY DUTY COACHES $ 8,247,802 $ - $ 9,692,323 $ 9,858,448 $ 13,532,679 $ 12,540,741 $ 45,624,191<br />
EXPAN. HEAVY DUTY COACHES $ 13,549,368 $ 14,023,596 $ 14,514,422 $ 15,022,427 $ 14,841,475 $ - $ 71,951,288<br />
REPL. MEDIUM DUTY COACHES $ - $ - $ - $ - $ 1,416,018 $ - $ -<br />
SECURITY $ 163,075 $ 163,075 $ 163,075 $ 163,075 $ 163,075 $ 163,075 $ 978,450<br />
PREVENTIVE MAINTENANCE $ 7,885,149 $ 11,321,532 $ 11,916,079 $ 10,878,631 $ 11,418,964 $ 12,010,742 $ 65,431,097<br />
OFFICE EQUIPMENT $ 15,000 $ 15,525 $ 16,068 $ 16,631 $ 17,213 $ 17,815 $ 98,252<br />
CAPITALIZATION OF LEASES $ 89,000 $ 93,000 $ 97,000 $ 100,000 $ 104,000 $ 108,000 $ 591,000<br />
MIS $ 844,121 $ 436,200 $ 692,569 $ 864,600 $ 362,910 $ 3,732,861 $ 6,933,261<br />
SBX $ 300,000 $ 500,000 $ 10,250,000 $ 10,250,000 $ 10,250,000 $ 10,250,000 $ 41,800,000<br />
FACILITY IMPROVEMENTS $ 356,447 $ 465,000 $ 144,937 $ 1,560,593 $ 106,678 $ 6,500 $ 2,640,155<br />
TRANSIT ENHANCEMENTS $ 163,075 $ 163,075 $ 163,075 $ 163,075 $ 163,075 $ 163,075 $ 978,450<br />
ALT. FUELING FACILITIES $ - $ 305,000 $ 200,000 $ - $ - $ 370,730 $ 875,730<br />
REVENUE EQUIPMENT $ 435,000 $ - $ - $ - $ - $ - $ 435,000<br />
REPL. PARA VEHICLES $ 755,080 $ 1,953,775 $ 4,044,300 $ 4,185,850 $ 2,166,175 $ 2,242,000 $ 15,347,180<br />
EXPAN. PARA VEHICLES $ 577,822 $ 598,048 $ - $ - $ - $ - $ 1,175,870<br />
YUCAIPA TRANSCENTER $ 1,415,497 $ - $ - $ - $ - $ - $ 1,415,497<br />
MID VALLEY FACILITY $ - $ 13,930,000 $ 13,930,000 $ 13,930,000 $ 13,930,000 $ - $ 55,720,000<br />
TOTAL $ 35,343,502 $ 45,262,436 $ 65,969,769 $ 67,401,292 $ 68,667,312 $ 42,089,723 $ 324,734,034
Notes:<br />
279
Appendix - A<br />
Glossary and Acronyms
Access<br />
APC<br />
Deadhead<br />
GIS<br />
Headway<br />
A demand responsive, curb-tocurb<br />
service operated by<br />
<strong>Omnitrans</strong> and available to ADAcertified<br />
individuals or persons<br />
with disabilities holding and<br />
<strong>Omnitrans</strong> D-Card.<br />
Automatic Passenger Counters.<br />
Automatic electronic equipment<br />
installed on a limited number of<br />
buses. The APCs count<br />
passengers boarding and<br />
alighting at each stop.<br />
Deadhead is the time or distance<br />
that a bus must travel when it is<br />
not in service. Deadhead can<br />
occur between the garage and<br />
the start or end of a route, or<br />
when a bus must travel between<br />
two routes.<br />
Geographic Information Systems<br />
is the generic name applied to a<br />
category of software that<br />
conducts spatial analysis and<br />
plots the results on maps. The<br />
leading provider<br />
of GIS software is ESRI, which has<br />
its headquarters in Redlands.<br />
Headway is the elapsed time<br />
between buses operating on the<br />
same route, in the same direction.<br />
Headways on most <strong>Omnitrans</strong><br />
routes are 15, 30, or 60 minutes.
Interline<br />
Layover or<br />
Recovery<br />
LIM<br />
Omnilink<br />
PASTACC<br />
The integration of more than one<br />
bus route into a single schedule.<br />
When two routes are interlined, a<br />
specific bus would complete a<br />
trip on the first route, and then<br />
proceed to the second route<br />
before returning to the first route.<br />
The integration is transparent to<br />
the riders.<br />
Time provided during the<br />
scheduled operation of a bus to<br />
provide time for the bus to regain<br />
the correct schedule (e.g. if a bus<br />
is operating late or early), or to<br />
provide a short break for the<br />
driver.<br />
The acronym refers to Low-<br />
Income and Minority populations<br />
that are guaranteed equal access<br />
to services funded by the Federal<br />
Government under Title VI.<br />
A demand responsive, curb-tocurb<br />
service available to the<br />
general public in three specific<br />
areas: Yucaipa, Grand Terrace<br />
and Chino Hills.<br />
The Public and Specialized<br />
Transportation Advisory and<br />
Coordination Council [PASTACC]<br />
is the SANBAG-sponsored<br />
advisory body established under<br />
the California Transportation<br />
Development Act §92238.<br />
PASTACC brings together public<br />
transit operators and social<br />
service transportation providers<br />
to discuss the mobility issues and<br />
challenges that confront seniors,<br />
persons with disabilities or<br />
persons of limited means.
PCA<br />
Platform Hours<br />
Pulsing<br />
Regional Express<br />
Revenue Hours<br />
Running Times<br />
Through<br />
Passengers<br />
A Personal Care Attendant is<br />
someone who travels with ADAcertified<br />
passengers to provide<br />
additional care.<br />
All of the time that a bus and<br />
coach operator as scheduled to<br />
be on duty. It includes revenue<br />
and non-revenue time as well as<br />
any layovers.<br />
Most routes operated by<br />
<strong>Omnitrans</strong> have timed<br />
connections at transcenters. A<br />
pulse occurs when buses on<br />
several routes all arrive and<br />
depart a specific transcenter at<br />
the same time.<br />
Regional Express, the name<br />
applied to Route 90. This route<br />
connects Montclair, San<br />
Bernardino and Riverside.<br />
Time that a bus and coach<br />
operator or bus driver are<br />
scheduled to be on duty and<br />
operating on a route. It includes<br />
layover time, but not deadhead.<br />
Running time is the actual travel<br />
time it takes for a bus to travel<br />
between two fixed points. It<br />
usually refers to the travel time<br />
between terminals or between<br />
timepoints.<br />
Passengers that stay on a bus<br />
as it passes through a terminal.
Through Routing<br />
Timepoints<br />
Tripper<br />
Transcenter<br />
Similar to interlining, but in this<br />
case, the two halves of the route<br />
share a common route number<br />
so that it appears as a single<br />
through route.<br />
A bus stop designated in the<br />
timetable by having a specific<br />
arrival and/or departure time.<br />
A bus that comes out of the<br />
garage to make a single trip to<br />
cover a peak load situation or to<br />
provide a mid-route deviation<br />
once or twice a day (such as a<br />
special school trip) is a tripper.<br />
A major transfer point where<br />
buses are timed to make<br />
connections.
Appendix - B<br />
Current Vehicle Listing and<br />
Description of Coaches
Series Summary<br />
Newflyer Series Coaches<br />
Manufacture Years: 2000 - 2004<br />
Dimensions - Length: 39.9 - 40.8<br />
Width: 10.3<br />
Seats: 37<br />
Wheelchair Tiedown Positions: 2<br />
Fuel Type: CNG<br />
Usage: Local Fixed Route Services<br />
Total Vehicles in Series: 120<br />
Detailed Listing<br />
Equipment # Year of Manufacture Manufacturer Model # License # Mileage as of 7/23/2004 Fuel Type Passenger Capacity Estimated Replacement Year<br />
0001 2000 New Flyer C40LF 382013 186,413.00 CNG 37 2012<br />
0002 2000 New Flyer C40LF 382012 114,850.00 CNG 37 2012<br />
0003 2000 New Flyer C40LF 382010 222,847.00 CNG 37 2012<br />
0004 2000 New Flyer C40LF 38<strong>2011</strong> 219,891.00 CNG 37 2012<br />
0005 2000 New Flyer C40LF 381997 215,374.00 CNG 37 2012<br />
0006 2000 New Flyer C40LF 382009 211,763.00 CNG 37 2012<br />
0007 2000 New Flyer C40LF 381986 221,295.00 CNG 37 2012<br />
0008 2000 New Flyer C40LF 382027 210,590.00 CNG 37 2012<br />
0009 2000 New Flyer C40LF 381996 221,774.00 CNG 37 2012<br />
0010 2000 New Flyer C40LF 381998 216,508.00 CNG 37 2012<br />
0011 2000 New Flyer C40LF 381988 221,830.00 CNG 37 2012<br />
0012 2000 New Flyer C40LF 382000 215,869.00 CNG 37 2012<br />
0013 2000 New Flyer C40LF 381985 217,569.00 CNG 37 2012<br />
0014 2000 New Flyer C40LF 381987 220,712.00 CNG 37 2012<br />
0015 2000 New Flyer C40LF 382026 201,681.00 CNG 37 2012<br />
0016 2000 New Flyer C40LF 381999 205,985.00 CNG 37 2012<br />
0017 2000 New Flyer C40LF 382002 218,806.00 CNG 37 2012<br />
0018 2000 New Flyer C40LF 382023 210,742.00 CNG 37 2012<br />
0019 2000 New Flyer C40LF 382001 212,260.00 CNG 37 2012<br />
0020 2000 New Flyer C40LF 381994 212,787.00 CNG 37 2012<br />
0021 2000 New Flyer C40LF 381989 213,270.00 CNG 37 2012<br />
0022 2000 New Flyer C40LF 382024 204,703.00 CNG 37 2012<br />
0023 2000 New Flyer C40LF 433809 211,130.00 CNG 37 2012<br />
0024 2000 New Flyer C40LF 382025 219,964.00 CNG 37 2012<br />
0025 2000 New Flyer C40LF 382022 225,134.00 CNG 37 2012<br />
0026 2000 New Flyer C40LF 382021 207,675.00 CNG 37 2012<br />
0027 2000 New Flyer C40LF 382020 222,895.00 CNG 37 2012<br />
0028 2000 New Flyer C40LF 382019 224,335.00 CNG 37 2012<br />
0029 2000 New Flyer C40LF 382028 226,452.00 CNG 37 2012<br />
0030 2000 New Flyer C40LF 382004 215,549.00 CNG 37 2012<br />
0031 2000 New Flyer C40LF 382029 227,178.00 CNG 37 2012<br />
0032 2000 New Flyer C40LF 382003 202,215.00 CNG 37 2012<br />
0033 2000 New Flyer C40LF 38<strong>2006</strong> 208,192.00 CNG 37 2012<br />
0034 2000 New Flyer C40LF 433808 208,286.00 CNG 37 2012<br />
0035 2000 New Flyer C40LF 381995 212,084.00 CNG 37 2012<br />
0036 2000 New Flyer C40LF 382008 205,573.00 CNG 37 2012<br />
0037 2000 New Flyer C40LF 382018 222,798.00 CNG 37 2012<br />
0038 2000 New Flyer C40LF 382007 226,969.00 CNG 37 2012<br />
0039 2000 New Flyer C40LF 381993 213,326.00 CNG 37 2012<br />
0040 2000 New Flyer C40LF 381992 223,650.00 CNG 37 2012<br />
0041 2000 New Flyer C40LF 382017 216,231.00 CNG 37 2012<br />
0042 2000 New Flyer C40LF 381991 225,838.00 CNG 37 2012<br />
0043 2000 New Flyer C40LF 382005 226,809.00 CNG 37 2012<br />
0044 2000 New Flyer C40LF 382016 211,837.00 CNG 37 2012<br />
0101 2001 New Flyer C40LF 1041920 184,439.00 CNG 37 2013<br />
0102 2001 New Flyer C40LF 1041917 177,600.00 CNG 37 2013
Series Summary<br />
Newflyer Series Coaches<br />
Manufacture Years: 2000 - 2004<br />
Dimensions - Length: 39.9 - 40.8<br />
Width: 10.3<br />
Seats: 37<br />
Wheelchair Tiedown Positions: 2<br />
Fuel Type: CNG<br />
Usage: Local Fixed Route Services<br />
Total Vehicles in Series: 120<br />
Detailed Listing<br />
Equipment # Year of Manufacture Manufacturer Model # License # Mileage as of 7/23/2004 Fuel Type Passenger Capacity Estimated Replacement Year<br />
0103 2001 New Flyer C40LF 1023548 171,861.00 CNG 37 2013<br />
0104 2001 New Flyer C40LF 1041921 178,625.00 CNG 37 2013<br />
0105 2001 New Flyer C40LF 1041916 181,088.00 CNG 37 2013<br />
0106 2001 New Flyer C40LF 1041918 181,801.00 CNG 37 2013<br />
0107 2001 New Flyer C40LF 1041919 181,805.00 CNG 37 2013<br />
0108 2001 New Flyer C40LF 1023545 182,735.00 CNG 37 2013<br />
0109 2001 New Flyer C40LF 1023544 180,821.00 CNG 37 2013<br />
0110 2001 New Flyer C40LF 1023543 177,974.00 CNG 37 2013<br />
0111 2001 New Flyer C40LF 1023542 185,496.00 CNG 37 2013<br />
0112 2001 New Flyer C40LF 1023540 184,258.00 CNG 37 2013<br />
0113 2001 New Flyer C40LF 1023541 180,780.00 CNG 37 2013<br />
0114 2001 New Flyer C40LF 1023539 176,446.00 CNG 37 2013<br />
0115 2001 New Flyer C40LF 1023546 179,453.00 CNG 37 2013<br />
0116 2001 New Flyer C40LF 1041928 167,945.00 CNG 37 2013<br />
0117 2001 New Flyer C40LF 1023547 178,869.00 CNG 37 2013<br />
0118 2001 New Flyer C40LF 1041932 178,432.00 CNG 37 2013<br />
0119 2001 New Flyer C40LF 1041930 176,645.00 CNG 37 2013<br />
0120 2001 New Flyer C40LF 1041929 176,253.00 CNG 37 2013<br />
0121 2001 New Flyer C40LF 1041931 183,093.00 CNG 37 2013<br />
0122 2001 New Flyer C40LF 1041927 176,726.00 CNG 37 2013<br />
0123 2001 New Flyer C40LF 1041926 183,054.00 CNG 37 2013<br />
0124 2001 New Flyer C40LF 1041925 175,766.00 CNG 37 2013<br />
0125 2001 New Flyer C40LF 1041924 177,216.00 CNG 37 2013<br />
0126 2001 New Flyer C40LF 1041923 140,972.00 CNG 37 2013<br />
0127 2001 New Flyer C40LF 1041922 174,290.00 CNG 37 2013<br />
0131 2001 New Flyer C40LF 1120293 141,166.00 CNG 37 2013<br />
0132 2001 New Flyer C40LF 1120291 146,479.00 CNG 37 2013<br />
0133 2001 New Flyer C40LF 1120290 152,231.00 CNG 37 2013<br />
0134 2001 New Flyer C40LF 1120289 142,763.00 CNG 37 2013<br />
0135 2001 New Flyer C40LF 1120288 149,381.00 CNG 37 2013<br />
0136 2001 New Flyer C40LF 1120287 141,986.00 CNG 37 2013<br />
0137 2001 New Flyer C40LF 1120286 148,667.00 CNG 37 2013<br />
0138 2001 New Flyer C40LF 1120285 153,949.00 CNG 37 2013<br />
0139 2001 New Flyer C40LF 1120292 144,329.00 CNG 37 2013<br />
0140 2001 New Flyer C40LF 1120284 147,079.00 CNG 37 2013<br />
0141 2001 New Flyer C40LF 1120283 150,220.00 CNG 37 2013<br />
0151 2003 New Flyer C40LF 1177111 33,634.00 CNG 37 2015<br />
0152 2003 New Flyer C40LF 1177110 31,641.00 CNG 37 2015<br />
0153 2003 New Flyer C40LF 1177081 34,219.00 CNG 37 2015<br />
0154 2003 New Flyer C40LF 1177080 35,142.00 CNG 37 2015<br />
0155 2003 New Flyer C40LF 1177093 31,302.00 CNG 37 2015<br />
0156 2003 New Flyer C40LF 1177102 31,777.00 CNG 37 2015<br />
0157 2003 New Flyer C40LF 1177103 34,278.00 CNG 37 2015<br />
0158 2003 New Flyer C40LF 1177107 32,974.00 CNG 37 2015<br />
0159 2003 New Flyer C40LF 1177096 31,419.00 CNG 37 2015<br />
0160 2003 New Flyer C40LF 1177106 34,074.00 CNG 37 2015
Series Summary<br />
Newflyer Series Coaches<br />
Manufacture Years: 2000 - 2004<br />
Dimensions - Length: 39.9 - 40.8<br />
Width: 10.3<br />
Seats: 37<br />
Wheelchair Tiedown Positions: 2<br />
Fuel Type: CNG<br />
Usage: Local Fixed Route Services<br />
Total Vehicles in Series: 120<br />
Detailed Listing<br />
Equipment # Year of Manufacture Manufacturer Model # License # Mileage as of 7/23/2004 Fuel Type Passenger Capacity Estimated Replacement Year<br />
0161 2003 New Flyer C40LF 1177105 33,909.00 CNG 37 2015<br />
0162 2003 New Flyer C40LF 1177104 32,656.00 CNG 37 2015<br />
0163 2003 New Flyer C40LF 1177112 30,404.00 CNG 37 2015<br />
0164 2003 New Flyer C40LF 1177097 30,470.00 CNG 37 2015<br />
0165 2003 New Flyer C40LF 1177113 31,120.00 CNG 37 2015<br />
0166 2003 New Flyer C40LF 1177098 32,845.00 CNG 37 2015<br />
0167 2003 New Flyer C40LF 1177099 34,159.00 CNG 37 2015<br />
0168 2003 New Flyer C40LF 1177100 30,026.00 CNG 37 2015<br />
0169 2003 New Flyer C40LF 1177101 30,317.00 CNG 37 2015<br />
0170 2003 New Flyer C40LF 1177108 25,958.00 CNG 37 2015<br />
0171 2003 New Flyer C40LF 1177109 32,525.00 CNG 37 2015<br />
0172 2003 New Flyer C40LF 1177094 33,441.00 CNG 37 2015<br />
0181 2004 New Flyer C40LF CNG 37 2016<br />
0182 2004 New Flyer C40LF CNG 37 2016<br />
0183 2004 New Flyer C40LF CNG 37 2016<br />
0184 2004 New Flyer C40LF CNG 37 2016<br />
0185 2004 New Flyer C40LF CNG 37 2016<br />
0186 2004 New Flyer C40LF CNG 37 2016<br />
0187 2004 New Flyer C40LF CNG 37 2016<br />
0188 2004 New Flyer C40LF CNG 37 2016<br />
0189 2004 New Flyer C40LF CNG 37 2016<br />
0190 2004 New Flyer C40LF CNG 37 2016<br />
0191 2004 New Flyer C40LF CNG 37 2016<br />
0192 2004 New Flyer C40LF CNG 37 2016<br />
0193 2004 New Flyer C40LF CNG 37 2016<br />
0194 2004 New Flyer C40LF CNG 37 2016<br />
0195 2004 New Flyer C40LF CNG 37 2016<br />
0196 2004 New Flyer C40LF CNG 37 2016
Series Summary<br />
Newflyer Hybrid Series Coaches<br />
Manufacture Years: 2000<br />
Dimensions - Length: 40.8<br />
Width: 10.3<br />
Seats: 37<br />
Wheelchair Tiedown Positions: 2<br />
Fuel Type: Gasoline/Electric<br />
Usage: Local Fixed Route Services - Downtown San Bernardino<br />
Total Vehicles in Series: 3<br />
Detailed Listing<br />
Equipment # Year of Manufacture Manufacturer Model # License # Mileage as of 7/23/2004 Fuel Type Passenger Capacity Estimated Replacement Year<br />
0045 2000 New Flyer C40LF 1140417 12,879.00 Gasoline/Electric 37 2012<br />
0046 2000 New Flyer C40LF 1113943 9,085.00 Gasoline/Electric 37 2012<br />
0047 2000 New Flyer C40LF 0.00 Gasoline/Electric 37 2012
Series Summary<br />
Orion Series Coaches<br />
Manufacture Years: 1996<br />
Dimensions - Length: 40.8<br />
Width: 10.0<br />
Seats: 37<br />
Wheelchair Tiedown Positions: 2<br />
Fuel Type: CNG<br />
Usage: Local Fixed Route Services<br />
Total Vehicles in Series: 24<br />
Detailed Listing<br />
Equipment # Year of Manufacture Manufacturer Model # License # Mileage as of 7/23/2004 Fuel Type Passenger Capacity Estimated Replacement Year<br />
700 1996 Orion 05.501 496883 324,915.00 CNG 37 2008<br />
701 1996 Orion 05.501 36530 270,394.00 CNG 37 2008<br />
702 1996 Orion 05.501 496887 303,482.00 CNG 37 2008<br />
703 1996 Orion 05.501 36531 328,472.00 CNG 37 2008<br />
704 1996 Orion 05.501 36536 298,991.00 CNG 37 2008<br />
705 1996 Orion 05.501 36529 287,074.00 CNG 37 2008<br />
706 1996 Orion 05.501 496886 288,762.00 CNG 37 2008<br />
707 1996 Orion 05.501 496888 322,432.00 CNG 37 2008<br />
708 1996 Orion 05.501 496890 330,151.00 CNG 37 2008<br />
709 1996 Orion 05.501 496889 312,952.00 CNG 37 2008<br />
710 1996 Orion 05.501 496884 330,264.00 CNG 37 2008<br />
711 1996 Orion 05.501 496885 332,121.00 CNG 37 2008<br />
712 1996 Orion 05.501 496882 272,514.00 CNG 37 2008<br />
713 1996 Orion 05.501 496881 307,311.00 CNG 37 2008<br />
714 1996 Orion 05.501 36535 311,807.00 CNG 37 2008<br />
715 1996 Orion 05.501 36540 303,288.00 CNG 37 2008<br />
716 1996 Orion 05.501 36532 297,622.00 CNG 37 2008<br />
717 1996 Orion 05.501 36537 305,940.00 CNG 37 2008<br />
718 1996 Orion 05.501 36534 291,471.00 CNG 37 2008<br />
719 1996 Orion 05.501 36528 253,345.00 CNG 37 2008<br />
720 1996 Orion 05.501 36538 295,512.00 CNG 37 2008<br />
721 1996 Orion 05.501 36533 257,570.00 CNG 37 2008<br />
722 1996 Orion 05.501 36539 283,163.00 CNG 37 2008<br />
723 1996 Orion 05.501 36503 290,921.00 CNG 37 2008
Series Summary<br />
TMC Series Coaches<br />
Manufacture Years: 1992-1993<br />
Dimensions - Length: 40.0 - 40.3<br />
Width: 10.0<br />
Seats: 37<br />
Wheelchair Tiedown Positions: 2<br />
Fuel Type: Diesel<br />
Usage: Local Fixed Route Services<br />
Total Vehicles in Series: 23<br />
Detailed Listing<br />
Equipment # Year of Manufacture Manufacturer Model # License # Mileage as of 7/23/2004 Fuel Type Passenger Capacity Estimated Replacement Year<br />
1643 1992 TMC T80206 293361 624,257.00 Diesel 37 2004<br />
1647 1992 TMC T80206 293362 614,775.00 Diesel 37 2004<br />
1664 1992 TMC T80206 293372 566,336.00 Diesel 37 2004<br />
1670 1992 TMC T80206 293397 579,271.00 Diesel 37 2004<br />
1673 1992 TMC T80206 293399 578,557.00 Diesel 37 2004<br />
1675 1992 TMC T80206 293401 561,234.00 Diesel 37 2004<br />
1681 1992 TMC T80206 293377 562,964.00 Diesel 37 2004<br />
1682 1992 TMC T80206 293378 577,544.00 Diesel 37 2004<br />
1683 1992 TMC T80206 293381 573,025.00 Diesel 37 2004<br />
2684 1993 TMC T80206 380357 499,265.00 Diesel 37 2005<br />
2685 1993 TMC T80206 380358 496,137.00 Diesel 37 2005<br />
2686 1993 TMC T80206 380359 510,533.00 Diesel 37 2005<br />
2687 1993 TMC T80206 380360 474,814.00 Diesel 37 2005<br />
2688 1993 TMC T80206 380361 484,149.00 Diesel 37 2005<br />
2689 1993 TMC T80206 380362 510,407.00 Diesel 37 2005<br />
2690 1993 TMC T80206 380363 520,857.00 Diesel 37 2005<br />
2691 1993 TMC T80206 1057385 441,999.00 Diesel 37 2005<br />
2692 1993 TMC T80206 380365 518,530.00 Diesel 37 2005<br />
2693 1993 TMC T80206 380366 510,203.00 Diesel 37 2005<br />
2694 1993 TMC T80206 380367 476,256.00 Diesel 37 2005<br />
2695 1993 TMC T80206 380368 457,378.00 Diesel 37 2005<br />
2696 1993 TMC T80206 380369 421,722.00 Diesel 37 2005<br />
2697 1993 TMC T80206 380370 444,422.00 Diesel 37 2005<br />
2698 1993 TMC T80206 380371 453,782.00 Diesel 37 2005
Series Summary<br />
Specialty Series Coaches<br />
Manufacture Years: 2003<br />
Dimensions - Length:<br />
Width:<br />
Seats:<br />
Wheelchair Tiedown Positions: 2<br />
Fuel Type: CNG<br />
Usage: Redlands Trolley<br />
Total Vehicles in Series: 3<br />
Detailed Listing<br />
Equipment # Year of Manufacture Manufacturer Model # License # Mileage as of 7/23/2004 Fuel Type Passenger Capacity Estimated Replacement Year<br />
1101 2003 Speciality Trolley 1163019 13,361.00 CNG 37 2015<br />
1102 2003 Speciality Trolley 1163018 19,034.00 CNG 37 2015<br />
1103 2003 Speciality Trolley 1163017 14,624.00 CNG 37 2015
Series Summary<br />
Neoplan Series Coaches<br />
Manufacture Years: 1997<br />
Dimensions - Length: 40.6<br />
Width: 10.0<br />
Seats: 37<br />
Wheelchair Tiedown Positions: 2<br />
Fuel Type: CNG<br />
Usage: Regional Express<br />
Total Vehicles in Series: 7<br />
Detailed Listing<br />
Equipment # Year of Manufacture Manufacturer Model # License # Mileage as of 7/23/2004 Fuel Type Passenger Capacity Estimated Replacement Year<br />
9701 1997 Neoplan AN440 E989608 495,614.00 Diesel 37 2009<br />
9702 1997 Neoplan AN440 E989612 551,673.00 Diesel 37 2009<br />
9703 1997 Neoplan AN440 E989613 511,477.00 Diesel 37 2009<br />
9704 1997 Neoplan AN440 E989609 374,614.00 Diesel 37 2009<br />
9705 1997 Neoplan AN440 E989611 381,569.00 Diesel 37 2009<br />
9706 1997 Neoplan AN440 E989610 378,798.00 Diesel 37 2009<br />
9707 1997 Neoplan AN440 E989607 507,896.00 Diesel 37 2009
Series Summary<br />
Thomas Series Coaches<br />
Manufacture Years: 2003<br />
Dimensions - Length:<br />
Width:<br />
Seats:<br />
Wheelchair Tiedown Positions: 2<br />
Fuel Type: CNG<br />
Usage: Local Fixed Route<br />
Total Vehicles in Series: 12<br />
Detailed Listing<br />
Equipment # Year of Manufacture Manufacturer Model # License # Mileage as of 7/23/2004 Fuel Type Passenger Capacity Estimated Replacement Year<br />
501 2003 Thomas SLF232G 1171478 46,309.00 CNG 2015<br />
502 2003 Thomas SLF232G 1171479 56,032.00 CNG 2015<br />
503 2003 Thomas SLF232G 1171443 54,903.00 CNG 2015<br />
504 2003 Thomas SLF232G 1171444 50,542.00 CNG 2015<br />
505 2003 Thomas SLF232G 1171445 26,842.00 CNG 2015<br />
506 2003 Thomas SLF232G 1171446 46,532.00 CNG 2015<br />
507 2003 Thomas SLF232G 1171447 52,541.00 CNG 2015<br />
508 2003 Thomas SLF232G 1171448 48,821.00 CNG 2015<br />
509 2003 Thomas SLF232G 171480 54,155.00 CNG 2015<br />
510 2003 Thomas SLF232G 1171481 45,306.00 CNG 2015<br />
511 2003 Thomas SLF232G 1171482 51,396.00 CNG 2015<br />
512 2003 Thomas SLF232G 1171483 42,560.00 CNG 2015
Series Summary<br />
Ford Goshen Series Coaches<br />
Manufacture Years: 2000<br />
Dimensions - Length:<br />
Width:<br />
Seats:<br />
Wheelchair Tiedown Positions: 3<br />
Fuel Type: Gasoline<br />
Usage: Demand Response<br />
Total Vehicles in Series: 90<br />
Detailed Listing<br />
Equipment # Year of Manufacture Manufacturer Model # License # Mileage as of 7/23/2004 Fuel Type Passenger Capacity Estimated Replacement Year<br />
A0811 2000 Ford GOSHEN GCII Van E1055413 177,109.00 Gasoline 2012<br />
A0815 2000 Ford GOSHEN GCII Van E1055412 164,020.00 Gasoline 2012<br />
A0816 2000 Ford GOSHEN GCII Van E1055414 138,661.00 Gasoline 2012<br />
A0821 2000 Ford GOSHEN GCII Van E1055411 165,917.00 Gasoline 2012<br />
A0823 2000 Ford GOSHEN GCII Van E1055156 164,022.00 Gasoline 2012<br />
A0824 2000 Ford GOSHEN GCII Van E1055153 161,375.00 Gasoline 2012<br />
A0826 2000 Ford GOSHEN GCII Van E1055451 145,755.00 Gasoline 2012<br />
A0827 2000 Ford GOSHEN GCII Van E1055491 164,584.00 Gasoline 2012<br />
A0828 2000 Ford GOSHEN GCII Van E1055456 162,445.00 Gasoline 2012<br />
A0829 2000 Ford GOSHEN GCII Van E1055163 161,621.00 Gasoline 2012<br />
A0830 2000 Ford GOSHEN GCII Van E1055162 170,151.00 Gasoline 2012<br />
A0831 2000 Ford GOSHEN GCII Van E1055493 136,455.00 Gasoline 2012<br />
A0832 2000 Ford GOSHEN GCII Minibus E1055490 135,570.00 Gasoline 2012<br />
A0833 2000 Ford GOSHEN GCII Minibus E1055160 150,574.00 Gasoline 2012<br />
A0834 2000 Ford GOSHEN GCII Minibus E1055496 167,315.00 Gasoline 2012<br />
A0835 2000 Ford GOSHEN GCII Minibus E1055498 144,524.00 Gasoline 2012<br />
A0836 2000 Ford GOSHEN GCII Minibus E1055460 126,839.00 Gasoline 2012<br />
A0837 2000 Ford GOSHEN GCII Minibus E1055494 136,319.00 Gasoline 2012<br />
A0838 2000 Ford GOSHEN GCII Minibus E1055489 153,289.00 Gasoline 2012<br />
A0839 2000 Ford GOSHEN GCII Minibus E1055452 153,268.00 Gasoline 2012<br />
A0840 2000 Ford GOSHEN GCII Minibus E1055495 160,464.00 Gasoline 2012<br />
A0841 2000 Ford GOSHEN GCII Minibus E1055492 147,226.00 Gasoline 2012<br />
A0842 2000 Ford GOSHEN GCII Minibus E1055154 164,788.00 Gasoline 2012<br />
A0843 2000 Ford GOSHEN GCII Minibus E1055197 163,790.00 Gasoline 2012<br />
A0844 2000 Ford GOSHEN GCII Minibus E1055205 150,719.00 Gasoline 2012<br />
A0845 2000 Ford GOSHEN GCII Minibus E1055150 152,473.00 Gasoline 2012<br />
A0846 2000 Ford GOSHEN GCII Minibus E1055166 149,912.00 Gasoline 2012<br />
A0847 2000 Ford GOSHEN GCII Minibus E1055172 175,102.00 Gasoline 2012<br />
A0848 2000 Ford GOSHEN GCII Minibus E1055168 140,011.00 Gasoline 2012<br />
A0849 2000 Ford GOSHEN GCII Minibus E1055169 124,019.00 Gasoline 2012<br />
A0850 2000 Ford GOSHEN GCII Minibus E1055167 140,953.00 Gasoline 2012<br />
A0851 2000 Ford GOSHEN GCII Minibus E1055206 146,747.00 Gasoline 2012<br />
A0852 2000 Ford GOSHEN GCII Minibus E1055204 154,250.00 Gasoline 2012<br />
A0853 2000 Ford GOSHEN GCII Minibus E1055260 128,724.00 Gasoline 2012<br />
A0854 2000 Ford GOSHEN GCII Van E1055363 156,422.00 Gasoline 2012<br />
A0855 2000 Ford GOSHEN GCII Van E1055364 115,502.00 Gasoline 2012<br />
A0856 2000 Ford GOSHEN GCII Van E1055283 118,916.00 Gasoline 2012<br />
A0857 2000 Ford GOSHEN GCII Van E1055365 169,751.00 Gasoline 2012<br />
A0858 2000 Ford GOSHEN GCII Van E1055467 131,328.00 Gasoline 2012<br />
A0917 2000 Ford GOSHEN GCII Van E1055441 144,183.00 Gasoline 2012<br />
A0918 2000 Ford GOSHEN GCII Van E1055437 133,321.00 Gasoline 2012<br />
A0919 2000 Ford GOSHEN GCII Van E1055410 136,972.00 Gasoline 2012<br />
A0920 2000 Ford GOSHEN GCII Van E1055408 126,501.00 Gasoline 2012<br />
A0921 2000 Ford GOSHEN GCII Van E1055431 113,636.00 Gasoline 2012<br />
A0922 2000 Ford GOSHEN GCII Van E1055409 139,800.00 Gasoline 2012<br />
A0923 2000 Ford GOSHEN GCII Van E1055428 124,627.00 Gasoline 2012
Series Summary<br />
Ford Goshen Series Coaches<br />
Manufacture Years: 2000<br />
Dimensions - Length:<br />
Width:<br />
Seats:<br />
Wheelchair Tiedown Positions: 3<br />
Fuel Type: Gasoline<br />
Usage: Demand Response<br />
Total Vehicles in Series: 90<br />
Detailed Listing<br />
Equipment # Year of Manufacture Manufacturer Model # License # Mileage as of 7/23/2004 Fuel Type Passenger Capacity Estimated Replacement Year<br />
A0924 2000 Ford GOSHEN GCII Van E1055427 128,023.00 Gasoline 2012<br />
A0925 2000 Ford GOSHEN GCII Minibus E1055164 124,123.00 Gasoline 2012<br />
A0926 2000 Ford GOSHEN GCII Minibus E1055207 121,833.00 Gasoline 2012<br />
A0927 2000 Ford GOSHEN GCII Minibus E1055170 115,151.00 Gasoline 2012<br />
A0928 2000 Ford GOSHEN GCII Minibus E1055165 127,970.00 Gasoline 2012<br />
A0929 2000 Ford GOSHEN GCII Minibus E1055157 127,269.00 Gasoline 2012<br />
A0930 2000 Ford GOSHEN GCII Minibus E1055254 129,253.00 Gasoline 2012<br />
A0931 2000 Ford GOSHEN GCII Minibus E1055155 128,652.00 Gasoline 2012<br />
A0932 2000 Ford GOSHEN GCII Minibus E0155171 121,044.00 Gasoline 2012<br />
A0933 2000 Ford GOSHEN GCII Minibus E1055497 137,132.00 Gasoline 2012<br />
A0934 2000 Ford GOSHEN GCII Minibus E1055161 117,746.00 Gasoline 2012<br />
A0935 2000 Ford GOSHEN GCII Minibus 1055173 113,016.00 Gasoline 2012<br />
A0936 2000 Ford GOSHEN GCII Minibus E1055487 123,801.00 Gasoline 2012<br />
A0937 2000 Ford GOSHEN GCII Minibus E1055251 115,963.00 Gasoline 2012<br />
A0938 2000 Ford GOSHEN GCII Minibus E1055199 133,843.00 Gasoline 2012<br />
A0939 2000 Ford GOSHEN GCII Minibus E1055250 120,037.00 Gasoline 2012<br />
A0940 2000 Ford GOSHEN GCII Minibus E1055198 126,555.00 Gasoline 2012<br />
A0941 2000 Ford GOSHEN GCII Minibus E1055259 126,738.00 Gasoline 2012<br />
A0942 2000 Ford GOSHEN GCII Van E1055368 138,448.00 Gasoline 2012<br />
A0943 2000 Ford GOSHEN GCII Van E1055366 121,372.00 Gasoline 2012<br />
A0944 2000 Ford GOSHEN GCII Van E1055367 125,211.00 Gasoline 2012<br />
A0945 2000 Ford GOSHEN GCII Van E1055287 139,631.00 Gasoline 2012<br />
A0946 2000 Ford GOSHEN GCII Van E1055281 150,336.00 Gasoline 2012<br />
A0947 2000 Ford GOSHEN GCII Van E1055286 124,126.00 Gasoline 2012<br />
A0948 2000 Ford GOSHEN GCII Van E1055282 130,721.00 Gasoline 2012<br />
A0949 2000 Ford GOSHEN GCII Van E1055285 122,091.00 Gasoline 2012<br />
A0950 2000 Ford GOSHEN GCII Van E1055284 120,021.00 Gasoline 2012<br />
A0951 2000 Ford GOSHEN GCII Van E1055220 122,240.00 Gasoline 2012<br />
A0952 2000 Ford GOSHEN GCII Van E1055312 123,615.00 Gasoline 2012<br />
A0953 2000 Ford GOSHEN GCII Van E1055313 114,350.00 Gasoline 2012<br />
A0954 2000 Ford GOSHEN GCII Van E1055311 119,416.00 Gasoline 2012<br />
A0955 2000 Ford GOSHEN GCII Van E1055310 148,836.00 Gasoline 2012<br />
A0956 2000 Ford GOSHEN GCII Van E1055314 128,751.00 Gasoline 2012<br />
A0957 2000 Ford GOSHEN GCII Van E1068106 112,369.00 Gasoline 2012<br />
A0958 2000 Ford GOSHEN GCII Van E1068104 129,530.00 Gasoline 2012<br />
A0959 2000 Ford GOSHEN GCII Van E1068105 142,829.00 Gasoline 2012<br />
A0960 2000 Ford GOSHEN GCII Van E1055322 128,986.00 Gasoline 2012<br />
A0629 2000 Ford GOSHEN GCII Van E1055453 122,703.00 Gasoline 2012<br />
A0630 2000 Ford GOSHEN GCII Van E1055479 132,155.00 Gasoline 2012<br />
A0631 2000 Ford GOSHEN GCII Van E1055455 110,106.00 Gasoline 2012<br />
A0632 2000 Ford GOSHEN GCII Van E1055465 145,582.00 Gasoline 2012<br />
A0634 2000 Ford GOSHEN GCII Van E1055201 127,619.00 Gasoline 2012<br />
A0635 2000 Ford GOSHEN GCII Van E1055454 118,869.00 Gasoline 2012<br />
A0636 2000 Ford GOSHEN GCII Van E1055457 120,415.00 Gasoline 2012
Series Summary<br />
El Dorado Series Coaches<br />
Manufacture Years: 2004<br />
Dimensions - Length:<br />
Width:<br />
Seats:<br />
Wheelchair Tiedown Positions: 3<br />
Fuel Type: Gasoline<br />
Usage: Demand Response<br />
Total Vehicles in Series: 10<br />
Detailed Listing<br />
Equipment # Year of Manufacture Manufacturer Model # License # Mileage as of 7/23/2004 Fuel Type Passenger Capacity Estimated Replacement Year<br />
AO859 2004 Eldorado Areotech E1150946 1,438.00 Gasoline 2008<br />
AO860 2004 Eldorado Areotech E1174168 1,439.00 Gasoline 2008<br />
AO861 2004 Eldorado Areotech E1174169 1,444.00 Gasoline 2008<br />
AO862 2004 Eldorado Areotech E1174170 1,460.00 Gasoline 2008<br />
AO863 2004 Eldorado Areotech E1174171 1,446.00 Gasoline 2008<br />
AO864 2004 Eldorado Areotech E1150948 1,438.00 Gasoline 2008<br />
AO865 2004 Eldorado Areotech E1174172 1,438.00 Gasoline 2008<br />
AO637 2004 Eldorado Areotech E1150945 1,445.00 Gasoline 2008<br />
AO638 2004 Eldorado Areotech E1150947 1,614.00 Gasoline 2008<br />
AO639 2004 Eldorado Areotech E1150949 1,589.00 Gasoline 2008
Series Summary<br />
GM Series Coaches<br />
Manufacture Years: 1958<br />
Dimensions - Length:<br />
Width:<br />
Seats:<br />
Wheelchair Tiedown Positions:<br />
Fuel Type: Diesel<br />
Usage: Service Promotion<br />
Total Vehicles in Series: 1<br />
Detailed Listing<br />
Equipment # Year of Manufacture Manufacturer Model # License # Mileage as of 7/23/2004 Fuel Type Passenger Capacity Estimated Replacement Year<br />
5876 1958 GM TDH4801 E1023483 N/A Diesel N/A
Appendix - C<br />
Transcenters and Facilities Descriptions
Fourth Street <strong>Transit</strong> Mall<br />
San Bernardino, California<br />
Location<br />
Description<br />
On Fourth Street and “E” Street in Downtown San Bernardino.<br />
The <strong>Transit</strong> Mall spreads over a four-block area and includes “E” Street as part of<br />
the transit mall. There are several regional connections which include MARTA<br />
and VVTA.<br />
Facility Amenities<br />
Amenity Yes/No Details<br />
Number of Bus Bays Yes There are a total of 14 bus bays.<br />
Public Restrooms<br />
Telephones<br />
Lighting<br />
Shelters<br />
Benches<br />
Bicycle Racks<br />
No<br />
Yes<br />
Yes<br />
Yes<br />
Yes<br />
No<br />
Information Kiosks Yes Wall panels in shelters with bus route info and maps.<br />
Public Art Features<br />
Landscaping<br />
Parking Available<br />
ADA Compliance<br />
Available Driver Amenities<br />
No<br />
No<br />
No<br />
Yes<br />
No<br />
Ridership Information<br />
Monday - Friday Pax Daily Saturday Pax Daily Sunday Pax Daily<br />
4,615 2,196 1,596<br />
Public <strong>Transit</strong> Service<br />
<strong>Omnitrans</strong> Neighboring <strong>Transit</strong> Agencies Metrolink Commuter Train Service<br />
Rts. 1, 2, 3, 4, 5, 7, 8, 9, 10, 11,<br />
14, 15, 90, 201, 202<br />
VVTA Commuter<br />
MARTA Off the Mountain Service<br />
No<br />
Site Information<br />
Historic Site Information Current surrounding land use <strong>Plan</strong>ned surrounding land use<br />
None Commercial - Retail and Offi ce Commercial - Retail and Offi ce
Redlands Mall<br />
Redlands, California<br />
Location<br />
Description<br />
Redlands Boulevard and Orange Ave.<br />
The Transfer Center is located next to the Redlands Mall in Downtown Redlands.<br />
<strong>Omnitrans</strong> fi xed-route, Redlands Trolley, and Riverside <strong>Transit</strong> Agency currently<br />
stop at the Redlands Mall.<br />
Facility Amenities<br />
Amenity Yes/No Details<br />
Number of Bus Bays Yes There are a total of 5 bus bays at this on-street facility.<br />
Public Restrooms<br />
Telephones<br />
Lighting<br />
Shelters<br />
Benches<br />
Bicycle Racks<br />
Information Kiosks<br />
Public Art Features<br />
Landscaping<br />
Parking Available<br />
ADA Compliance<br />
Available Driver Amenities<br />
No<br />
No<br />
Yes<br />
Yes<br />
Yes<br />
No<br />
Yes<br />
No<br />
No<br />
No<br />
Yes<br />
No<br />
Ridership Information<br />
Monday - Friday Pax Daily Saturday Pax Daily Sunday Pax Daily<br />
758 355 185<br />
Public <strong>Transit</strong> Service<br />
<strong>Omnitrans</strong> Neighboring <strong>Transit</strong> Agencies Metrolink Commuter Train Service<br />
Rts. 8, 9, 15, 19, Redlands<br />
Trolley Red and Blue Lines<br />
RTA Route 36<br />
No<br />
Site Information<br />
Historic Site Information Current surrounding land use <strong>Plan</strong>ned surrounding land use<br />
None Commercial Mixed-use residential/<br />
commercial
Fontana Metrolink Station<br />
Fontana, California<br />
Location 16777 Orange Way, Fontana, CA 92335<br />
Description<br />
This off-street facility allows transfers for <strong>Omnitrans</strong> fi xed-route service as well as<br />
Metrolink commuter rail service. This facility is one of the busiest transfer locations<br />
second only to the Fourth Street <strong>Transit</strong> Mall in San Bernardino.<br />
Facility Amenities<br />
Amenity Yes/No Details<br />
Number of Bus Bays Yes There are a total of 9 bus bays.<br />
Public Restrooms<br />
Telephones<br />
Lighting<br />
Shelters<br />
Benches<br />
Bicycle Racks<br />
Information Kiosks<br />
Public Art Features<br />
Landscaping<br />
Parking Available<br />
ADA Compliance<br />
Available Driver Amenities<br />
Yes<br />
Yes<br />
Yes<br />
Yes<br />
Yes<br />
Yes<br />
Yes<br />
No<br />
Yes<br />
Yes<br />
Yes<br />
Yes<br />
Ridership Information<br />
Monday - Friday Pax Daily Saturday Pax Daily Sunday Pax Daily<br />
3,098 1,357 843<br />
Public <strong>Transit</strong> Service<br />
<strong>Omnitrans</strong> Neighboring <strong>Transit</strong> Agencies Metrolink Commuter Train Service<br />
Rts. 10, 14, 15, 19, 20, 61, 66, No<br />
San Bernardino Line<br />
67, 71, 140<br />
Site Information<br />
Historic Site Information Current surrounding land use <strong>Plan</strong>ned surrounding land use<br />
None<br />
Residential (single and multifamilyt),<br />
commercial<br />
Residential (Senior Housing),<br />
commercial
South Fontana Transcenter<br />
Fontana, California<br />
Location<br />
Description<br />
Sierra Avenue and Marygold Avenue<br />
This on-street facility is adjacent to Kaiser Hospital as well as several shopping<br />
centers on Sierra Avenue. There are also a number of residential units around this<br />
transcenter.<br />
Facility Amenities<br />
Amenity Yes/No Details<br />
Number of Bus Bays Yes There are a total of 4 bus bays.<br />
Public Restrooms<br />
Telephones<br />
Lighting<br />
Shelters<br />
Benches<br />
Bicycle Racks<br />
Information Kiosks<br />
Public Art Features<br />
Landscaping<br />
Parking Available<br />
ADA Compliance<br />
Available Driver Amenities<br />
No<br />
No<br />
Yes<br />
Yes<br />
Yes<br />
No<br />
Yes<br />
No<br />
No<br />
No<br />
Yes<br />
No<br />
Ridership Information<br />
Monday - Friday Pax Daily Saturday Pax Daily Sunday Pax Daily<br />
753 513 321<br />
Public <strong>Transit</strong> Service<br />
<strong>Omnitrans</strong> Neighboring <strong>Transit</strong> Agencies Metrolink Commuter Train Service<br />
Rts. 19, 20, 28, 29, 61, 71, 90 No No<br />
Site Information<br />
Historic Site Information Current surrounding land use <strong>Plan</strong>ned surrounding land use<br />
None Hospital, residnetial, commercial Hospital, residnetial, commercial
Ontario Transcenter<br />
Ontario, California<br />
Location<br />
Description<br />
Sultana Avenue and D Street<br />
This on-street facility is located near the Ontario Civic Center, La Verne Law<br />
School, and residential areas all near Downtown Ontario.<br />
Facility Amenities<br />
Amenity Yes/No Details<br />
Number of Bus Bays Yes There are a total of 6 bus bays.<br />
Public Restrooms<br />
Telephones<br />
Lighting<br />
Shelters<br />
Benches<br />
Bicycle Racks<br />
Information Kiosks<br />
Public Art Features<br />
Landscaping<br />
Parking Available<br />
ADA Compliance<br />
Available Driver Amenities<br />
No<br />
No<br />
Yes<br />
Yes<br />
Yes<br />
No<br />
No<br />
No<br />
No<br />
No<br />
Yes<br />
No<br />
Ridership Information<br />
Monday - Friday Pax Daily Saturday Pax Daily Sunday Pax Daily<br />
1,321 560 450<br />
Public <strong>Transit</strong> Service<br />
<strong>Omnitrans</strong> Neighboring <strong>Transit</strong> Agencies Metrolink Commuter Train Service<br />
Rts. 61, 62, 63, 67, 70, 75 No No<br />
Site Information<br />
Historic Site Information Current surrounding land use <strong>Plan</strong>ned surrounding land use<br />
None Residential, commercial. High-density mixed use (residential<br />
and commercial).
Montclair Transcenter<br />
Montclair, California<br />
Location 5091 Richton Road, Montclair, CA 91763<br />
Description<br />
This off-street facility provides transfer connections with several Foothill <strong>Transit</strong><br />
routes as well as Metrolink commuter rail. The proposed Gold Line extentsion will<br />
terminate at this location.<br />
Facility Amenities<br />
Amenity Yes/No Details<br />
Number of Bus Bays Yes There are a total of 14 bus bays.<br />
Public Restrooms<br />
Telephones<br />
Lighting<br />
Shelters<br />
Benches<br />
Bicycle Racks<br />
Information Kiosks<br />
Public Art Features<br />
Landscaping<br />
Parking Available<br />
ADA Compliance<br />
Available Driver Amenities<br />
Yes<br />
Yes<br />
Yes<br />
Yes<br />
Yes<br />
Yes<br />
Yes<br />
No<br />
Yes<br />
Yes<br />
Yes<br />
Yes<br />
Ridership Information<br />
Monday - Friday Pax Daily Saturday Pax Daily Sunday Pax Daily<br />
1,259 627 351<br />
Public <strong>Transit</strong> Service<br />
<strong>Omnitrans</strong> Neighboring <strong>Transit</strong> Agencies Metrolink Commuter Train Service<br />
Rts. 62, 65, 66, 68 Foothill <strong>Transit</strong> 187, 190, 292,<br />
294, 480, 492, 690, 699<br />
RTA 204<br />
San Bernardino Line<br />
Site Information<br />
Historic Site Information Current surrounding land use <strong>Plan</strong>ned surrounding land use<br />
None Industrial High-density mixed use (residential<br />
and commercial).
Montclair Plaza<br />
Montclair, California<br />
Location<br />
Description<br />
Monte Vista Avenue at Moreno Street<br />
This on-street facility is located adjacent to the Montclair Plaza, a key destination<br />
located on the west end of the service area.<br />
Facility Amenities<br />
Amenity Yes/No Details<br />
Number of Bus Bays Yes There are a total of 4 bus bays.<br />
Public Restrooms<br />
Telephones<br />
Lighting<br />
Shelters<br />
Benches<br />
Bicycle Racks<br />
Information Kiosks<br />
Public Art Features<br />
Landscaping<br />
No<br />
No<br />
Yes<br />
No<br />
Yes<br />
No<br />
Yes<br />
No<br />
No<br />
Parking Available Yes Parking is available in mall parking lot.<br />
ADA Compliance<br />
Available Driver Amenities<br />
Yes<br />
Yes<br />
Ridership Information<br />
Monday - Friday Pax Daily Saturday Pax Daily Sunday Pax Daily<br />
175 108 62<br />
Public <strong>Transit</strong> Service<br />
<strong>Omnitrans</strong> Neighboring <strong>Transit</strong> Agencies Metrolink Commuter Train Service<br />
Rts. 62, 64, 65, 68 Foothill <strong>Transit</strong> 292, 294, 480,<br />
492<br />
None<br />
Site Information<br />
Historic Site Information Current surrounding land use <strong>Plan</strong>ned surrounding land use<br />
None Commercial, retail High-density mixed use (residential<br />
and commercial).
Inland Center Mall<br />
San Bernardino, California<br />
Location<br />
Description<br />
Inland Center Drive<br />
Only one local route stops at this location. The stop is located in the mall parking<br />
lot by Macy’s Department Store.<br />
Facility Amenities<br />
Amenity Yes/No Details<br />
Number of Bus Bays Yes There is only 1 bus bay.<br />
Public Restrooms<br />
Telephones<br />
Lighting<br />
Shelters<br />
Benches<br />
Bicycle Racks<br />
Information Kiosks<br />
Public Art Features<br />
Landscaping<br />
No<br />
No<br />
Yes<br />
No<br />
Yes<br />
No<br />
Yes<br />
No<br />
No<br />
Parking Available Yes Parking is available in mall parking lot.<br />
ADA Compliance<br />
Available Driver Amenities<br />
Yes<br />
No<br />
Ridership Information<br />
Monday - Friday Pax Daily Saturday Pax Daily Sunday Pax Daily<br />
289 302 244<br />
Public <strong>Transit</strong> Service<br />
<strong>Omnitrans</strong> Neighboring <strong>Transit</strong> Agencies Metrolink Commuter Train Service<br />
Rt. 2 None None<br />
Site Information<br />
Historic Site Information Current surrounding land use <strong>Plan</strong>ned surrounding land use<br />
None Commercial Commercial
Ontario Mills<br />
Ontario, California<br />
Location<br />
Description<br />
Ontario Mills (Mills Circle)<br />
Several <strong>Omnitrans</strong> routes as well as commuter lines from VVTA and RTA stop at<br />
this major destination in Ontario.<br />
Facility Amenities<br />
Amenity Yes/No Details<br />
Number of Bus Bays Yes There are 4 bus bays.<br />
Public Restrooms<br />
Telephones<br />
Lighting<br />
Shelters<br />
Benches<br />
Bicycle Racks<br />
Information Kiosks<br />
Public Art Features<br />
Landscaping<br />
No<br />
No<br />
Yes<br />
No<br />
No<br />
No<br />
Yes<br />
No<br />
No<br />
Parking Available Yes Parking is available in mall parking lot.<br />
ADA Compliance<br />
Available Driver Amenities<br />
No<br />
No<br />
Ridership Information<br />
Monday - Friday Pax Daily Saturday Pax Daily Sunday Pax Daily<br />
1,212 714 427<br />
Public <strong>Transit</strong> Service<br />
<strong>Omnitrans</strong> Neighboring <strong>Transit</strong> Agencies Metrolink Commuter Train Service<br />
Rts. 60, 61, 70, 71,75, 90 RTA, 204<br />
VVTA, Commuter Line<br />
None<br />
Site Information<br />
Historic Site Information Current surrounding land use <strong>Plan</strong>ned surrounding land use<br />
None Commercial Commercial
Pomona Transcenter<br />
Pomona, California<br />
Location<br />
Description<br />
101 West First Street<br />
The Pomona Transcenter is located in Downtown Pomona. This off-street facility<br />
provides connections with L.A. County agencies as well as Metrolink Commuter<br />
Rail line. Parking and amenities are available for passengers at this location.<br />
Facility Amenities<br />
Amenity Yes/No Details<br />
Number of Bus Bays Yes There are 10 bus bays.<br />
Public Restrooms<br />
Telephones<br />
Lighting<br />
Shelters<br />
Benches<br />
Bicycle Racks<br />
Information Kiosks<br />
Public Art Features<br />
Landscaping<br />
Parking Available<br />
ADA Compliance<br />
Yes<br />
Yes<br />
Yes<br />
Yes<br />
Yes<br />
Yes<br />
Yes<br />
No<br />
Yes<br />
Yes<br />
Yes<br />
Available Driver Amenities Yes Restrooms<br />
Ridership Information<br />
Monday - Friday Pax Daily Saturday Pax Daily Sunday Pax Daily<br />
484 252 164<br />
Public <strong>Transit</strong> Service<br />
<strong>Omnitrans</strong> Neighboring <strong>Transit</strong> Agencies Metrolink Commuter Train Service<br />
Rt. 61 Foothill 191, 193, 195, 291, 292,<br />
294, 480, 482, 852, 855<br />
MTA 484<br />
Riverside Line<br />
Site Information<br />
Historic Site Information Current surrounding land use <strong>Plan</strong>ned surrounding land use<br />
None Commercial Commercial
Ontario Airport<br />
Ontario, California<br />
Location<br />
Description<br />
Airport Drive<br />
<strong>Omnitrans</strong> only has one route that stops at the Airport. Passengers can use the<br />
Airport Shuttle to enter the Airport.<br />
Facility Amenities<br />
Amenity Yes/No Details<br />
Number of Bus Bays Yes There is only 1 bus bay.<br />
Public Restrooms<br />
Telephones<br />
Lighting<br />
Shelters<br />
Benches<br />
Bicycle Racks<br />
Information Kiosks<br />
Public Art Features<br />
Landscaping<br />
Parking Available<br />
ADA Compliance<br />
Available Driver Amenities<br />
No<br />
No<br />
No<br />
No<br />
Yes<br />
No<br />
Yes<br />
No<br />
No<br />
No<br />
Yes<br />
No<br />
Ridership Information<br />
Monday - Friday Pax Daily Saturday Pax Daily Sunday Pax Daily<br />
12 7 7<br />
Public <strong>Transit</strong> Service<br />
<strong>Omnitrans</strong> Neighboring <strong>Transit</strong> Agencies Metrolink Commuter Train Service<br />
Rt. 61 No No<br />
Site Information<br />
Historic Site Information Current surrounding land use <strong>Plan</strong>ned surrounding land use<br />
None Airport Airport
Arrowhead Medical Center<br />
Colton, California<br />
Location 400 North Pepper Avenue, Colton, California 92324<br />
Description<br />
The Arrowhead Regional Medical Center (ARMC) represents one of the major<br />
destinations in the service area. Several <strong>Omnitrans</strong> routes stop at this location<br />
providing much needed service to this hospital.<br />
Facility Amenities<br />
Amenity Yes/No Details<br />
Number of Bus Bays Yes There are 4 bus bays.<br />
Public Restrooms<br />
Telephones<br />
Lighting<br />
Shelters<br />
Benches<br />
Bicycle Racks<br />
Information Kiosks<br />
Public Art Features<br />
Landscaping<br />
Parking Available<br />
ADA Compliance<br />
Available Driver Amenities<br />
No<br />
No<br />
Yes<br />
Yes<br />
Yes<br />
No<br />
Yes<br />
No<br />
No<br />
Yes<br />
Yes<br />
No<br />
Ridership Information<br />
Monday - Friday Pax Daily Saturday Pax Daily Sunday Pax Daily<br />
1,596 545 273<br />
Public <strong>Transit</strong> Service<br />
<strong>Omnitrans</strong> Neighboring <strong>Transit</strong> Agencies Metrolink Commuter Train Service<br />
Rts. 1, 19, 22, 90 No No<br />
Site Information<br />
Historic Site Information Current surrounding land use <strong>Plan</strong>ned surrounding land use<br />
None Hospital, residential, commercial Hospital, residential, commercial
Chino <strong>Transit</strong> Center<br />
Chino, California<br />
Location<br />
Description<br />
Sixth Street between Chino Avenue and “D” Street.<br />
This on-street facility is located in Downtown Chino and replaces the Chino Civic<br />
Center transfer point. Service to this facility began on January 31, 2005.<br />
Facility Amenities<br />
Amenity Yes/No Details<br />
Number of Bus Bays Yes There are a total of 7 bus bays.<br />
Public Restrooms<br />
Telephones<br />
Lighting<br />
Shelters<br />
Benches<br />
Bicycle Racks<br />
Information Kiosks<br />
Public Art Features<br />
Landscaping<br />
Parking Available<br />
ADA Compliance<br />
Available Driver Amenities<br />
No<br />
No<br />
Yes<br />
Yes<br />
Yes<br />
No<br />
Yes<br />
Yes<br />
Yes<br />
Yes<br />
Yes<br />
Yes<br />
Ridership Information<br />
Monday - Friday Pax Daily Saturday Pax Daily Sunday Pax Daily<br />
Not Available Not Available Not Available<br />
Public <strong>Transit</strong> Service<br />
<strong>Omnitrans</strong> Neighboring <strong>Transit</strong> Agencies Metrolink Commuter Train Service<br />
Rts. 62, 63, 65A, 65B, 68 Foothill <strong>Transit</strong>, 497 No<br />
Site Information<br />
Historic Site Information Current surrounding land use <strong>Plan</strong>ned surrounding land use<br />
None<br />
Residential, Commercial, Industrical<br />
Commercial, Retail
East Valley Facility<br />
Location 1700 West Fifth Street, San Bernardino, CA 92411.<br />
Description<br />
Houses the Agency’s Administrative, Maintenance, and Operations Departments.<br />
Equipped to handle short and long term needs of the Agency. Eqipped to handle<br />
major engine, paint, and body repair. Formal Board room capable of accomadating<br />
20 board members and seat an additional 50 persons.<br />
Total Lot<br />
Facility Size<br />
12.7 acres<br />
Facility Amenities<br />
Amenity Existing Details<br />
Administration<br />
Operations/<br />
Maintenance Facilities<br />
Fuel, Fare, and<br />
Vacuum Facility<br />
Bus Wash Facility<br />
Parking<br />
23,769 sq. feet<br />
119,364 sq. feet<br />
3,077 sq. feet<br />
6,154 sq. feet<br />
250,320 sq. feet<br />
Bus Bays<br />
50,000 Pound 9<br />
Hoists<br />
Service Pits 3<br />
Bus/Truck Lift 0<br />
Automobile Lift 2<br />
Bus Wash 1<br />
Facility Amenities<br />
Employee Parking 289 employee<br />
spaces<br />
Guest Parking Yes<br />
Guard House<br />
Yes<br />
Camera System Yes<br />
Emergency<br />
Yes<br />
Power/Lighting<br />
Wellness Facilities Yes<br />
Childcare facilities No<br />
Steam<br />
1<br />
Cleaning Area<br />
Diesel Fueling 3 tanks 20,000 gallons per tank<br />
Gasoline Fueling 1 tank 10,000 gallons per tank<br />
L/CNG Fueling 2 tanks 30,000 gallons tanks<br />
Major Bus<br />
Yes<br />
Cleaning<br />
Vehicle Detailing Yes<br />
Training Room Yes<br />
Parts Room Yes<br />
Garage Area<br />
Maintenance<br />
Offi ces<br />
Preventive<br />
Maintenance<br />
Body Work<br />
Storage<br />
Yes<br />
Yes<br />
Yes<br />
Yes<br />
Yes<br />
Bus Parking Yes 129 Spaces
West Valley Facility<br />
Location 4748 Arrow Highway, Montclair, CA 91763.<br />
Description<br />
Located within 1/2 mile of the Montclair Transcenter. West Valley maintenance,<br />
street supervision, and dispatch are conducted on site. ADA accessible. Monthly<br />
bus pass sales outlet.<br />
Total Lot<br />
Facility Size<br />
5.5 acres<br />
Facility Amenities<br />
Amenity Existing Details<br />
Maintenance Facility<br />
Operations Facility<br />
Bus Wash Facility<br />
Parking<br />
20,475 sq. feet<br />
7,835 sq. feet<br />
3,123 sq. feet<br />
75,000 sq. feet<br />
Bus Bays<br />
50,000 Pound 6<br />
Hoists<br />
Service Pits 2<br />
Bus/Truck Lift 0<br />
Automobile Lift 1<br />
Facility Amenities<br />
Employee Parking 69 employee<br />
spaces<br />
Guest Parking Yes<br />
Guard House<br />
Yes<br />
Camera System Yes<br />
Emergency<br />
Yes<br />
Power/Lighting<br />
Wellness Facilities Yes<br />
Childcare facilities No<br />
Bus Wash 1<br />
Steam<br />
1<br />
Cleaning Area<br />
Diesel Fueling 2 tanks 25,000 gallons per tank<br />
Gasoline Fueling 1 tank 10,000 gallons per tank<br />
L/CNG Fueling 1 20,000 gallon storage<br />
Major Bus<br />
Yes<br />
Cleaning<br />
Vehicle Detailing Yes<br />
Training Room Yes<br />
Parts Room<br />
Garage Area<br />
Maintenance<br />
Offi ces<br />
Preventive<br />
Maintenance<br />
Body Work<br />
Storage<br />
Yes<br />
Yes<br />
Yes<br />
Yes<br />
No<br />
Yes<br />
Bus Parking Yes 68 spaces
Mid-Valley Facility<br />
Location<br />
Description<br />
Etiwanda Avenue and Arrow Route.<br />
Located in the center of <strong>Omnitrans</strong>’ service area. Will be ADA accessible. Monthly<br />
bus pass sales outlet.<br />
Total Lot<br />
Facility Size<br />
28.8 acres<br />
Facility Amenities<br />
Amenity Existing Details<br />
Maintenance Facility<br />
~50,000 sq. feet<br />
Bus Bays 12<br />
Operations/<br />
Administrative Facility<br />
Fuel, Fare, and<br />
Vacuum Facility<br />
Bus Wash Facility<br />
Parking<br />
~20,000 sq. feet<br />
~13,000 sq. feet<br />
~5,400 sq. feet<br />
~40,000 sq. feet<br />
Facility Amenities<br />
Employee Parking Yes<br />
Guest Parking Yes<br />
Guard House<br />
Yes<br />
Camera System Yes<br />
Emergency<br />
Yes<br />
Power/Lighting<br />
Wellness Facilities Yes<br />
Childcare facilities TBD<br />
50,000 Pound 9<br />
Hoists<br />
Service Pits 4<br />
Bus/Truck Lift Yes<br />
Automobile Lift 1<br />
Bus Wash<br />
Yes<br />
Steam<br />
Yes<br />
Cleaning Area<br />
Diesel Fueling Yes<br />
Gasoline Fueling Yes<br />
L/CNG Fueling Yes<br />
Major Bus<br />
Yes<br />
Cleaning<br />
Vehicle Detailing Yes<br />
Training Room Yes<br />
Parts Room Yes<br />
Garage Area<br />
Maintenance<br />
Offi ces<br />
Preventive<br />
Maintenance<br />
Body Work<br />
Storage<br />
Bus Parking<br />
Yes<br />
Yes<br />
Yes<br />
No<br />
Yes<br />
Yes
I Street Facility<br />
Location 234 South “I” Street, San Bernardino, CA 92410<br />
Description<br />
Maintenance and parking facilities large enough to handle expansion over the next<br />
20 years. On-site fueling facility. Easy freeway access.<br />
Total Lot<br />
Facility Size<br />
4.7 acres<br />
Facility Amenities<br />
Amenity Existing Details<br />
Offi ce Building<br />
4,520 sq. feet<br />
Bus Bays 10<br />
Maintenance Building<br />
Bus Wash Facility -<br />
Parking -<br />
11,339 sq. feet<br />
Facility Amenities<br />
Employee Parking Yes<br />
Guest Parking No<br />
Guard House<br />
No<br />
Camera System Yes<br />
Emergency<br />
No<br />
Power/Lighting<br />
Wellness Facilities No<br />
Childcare facilities No<br />
50,000 Pound -<br />
Hoists<br />
Service Pits -<br />
Bus/Truck Lift 4<br />
Automobile Lift -<br />
Bus Wash Yes General cleaning<br />
Steam<br />
Yes General cleaning<br />
Cleaning Area<br />
Diesel Fueling -<br />
Gasoline Fueling 2 tanks 4,000 gallon tanks<br />
L/CNG Fueling -<br />
Major Bus<br />
Yes<br />
Cleaning<br />
Vehicle Detailing Yes<br />
Training Room<br />
Parts Room<br />
Garage Area<br />
Maintenance<br />
Offi ces<br />
Preventive<br />
Maintenance<br />
Body Work<br />
Storage<br />
Yes<br />
Yes<br />
Yes<br />
Yes<br />
Yes<br />
No<br />
Yes<br />
Bus Parking Yes 70 spaces for Access
West Valley Paratransit Facility<br />
Location 9421 Feron Boulevard, Rancho Cucamonga, CA 91730<br />
Description<br />
Located in an industrial park. General maintenance of paratransit fl eet for West<br />
Valley.<br />
Total Lot<br />
Facility Size<br />
1.3 acres<br />
Facility Amenities<br />
Amenity Existing Details<br />
Offi ce and Vehicle 4,312 sq. feet<br />
Maintenance Facility<br />
Fuel, Fare, and -<br />
Vacuum Facility<br />
Bus Wash Facility -<br />
Parking -<br />
Facility Amenities<br />
Employee Parking Yes<br />
Guest Parking Yes<br />
Guard House<br />
No<br />
Camera System No<br />
Emergency<br />
No<br />
Power/Lighting<br />
Wellness Facilities No<br />
Childcare facilities No<br />
Bus Bays<br />
No<br />
50,000 Pound No<br />
Hoists<br />
Service Pits No<br />
Bus/Truck Lift 1<br />
Automobile Lift No<br />
Bus Wash Yes General cleaning<br />
Steam<br />
Yes General cleaning<br />
Cleaning Area<br />
Diesel Fueling No<br />
Gasoline Fueling No Fueling done off-site<br />
L/CNG Fueling No<br />
Major Bus<br />
Yes<br />
Cleaning<br />
Vehicle Detailing Yes<br />
Training Room<br />
Parts Room<br />
Garage Area<br />
Maintenance<br />
Offi ces<br />
Preventive<br />
Maintenance<br />
Body Work<br />
Storage<br />
Yes<br />
Yes<br />
Yes<br />
Yes<br />
Yes<br />
No<br />
Yes<br />
Bus Parking Yes 60 spaces for Access
Appendix - D<br />
Capital Project Sheets
<strong>Omnitrans</strong> Service Equipment Capital Improvement <strong>Plan</strong> <strong>2006</strong>-<strong>2011</strong><br />
SRTP #:<br />
Omni Budget #:<br />
Project ID:<br />
FTA Scope:<br />
Program Code:<br />
Status:<br />
1<br />
200088<br />
TR6Q<br />
11.42.06<br />
no change<br />
new project<br />
scope change<br />
funding change<br />
Project Description:<br />
Bus System - Service Equipment: Purchase maintenance equipment for east and west valley facilities.<br />
Project Justification:<br />
Equipment will be used to replace/supplement outmoded equipment now in use. The goal is to improve operational efficiency.<br />
x Significant Changes Since Last SRTP:<br />
Local $ > 20%<br />
POTENTIAL FUNDING SOURCES SUMMARY (IN $000's)<br />
Fiscal Year Federal<br />
State/Local<br />
Program/ Budget<br />
5307 5309 5310 CMAQ JA/RC STAF LTF AB2766 Carl<br />
Moyer LTF Art. 3 STIP TOTAL<br />
Budget <strong>2006</strong><br />
$ 34<br />
$ 9<br />
$ 43<br />
Forecast 2007<br />
$ 282<br />
$ 71<br />
$ 353<br />
Forecast 2008<br />
$ 25<br />
$ 6<br />
$ 31<br />
Forecast 2009<br />
$ -<br />
Forecast 2010<br />
$ -<br />
Forecast <strong>2011</strong><br />
$ 6<br />
$ 1<br />
$ 7<br />
TOTAL $ 347 $ - $ - $ - $ - $ 87 $ - $ - $ - $ - $ - $ 434<br />
1 of 18
<strong>Omnitrans</strong> <strong>Transit</strong> Enhancements Capital Improvement <strong>Plan</strong> <strong>2006</strong>-<strong>2011</strong><br />
SRTP #:<br />
Omni Budget #:<br />
Project ID:<br />
Program Code:<br />
FTA Scope:<br />
Status:<br />
2<br />
981111<br />
TR2C<br />
11.92.09<br />
no change<br />
new project<br />
scope change<br />
funding change<br />
Local $ > 20%<br />
Project Description:<br />
<strong>Transit</strong> - Enhancements: 1% <strong>Transit</strong> Enhancement.<br />
Project Justification:<br />
This funding will be used to enhance pedestrian improvements in conjunction with city projects to increase accessibility to bus stops.<br />
Significant Changes Since Last SRTP:<br />
POTENTIAL FUNDING SOURCES SUMMARY (IN $000's)<br />
Fiscal Year Federal<br />
State/Local<br />
Program/ Budget<br />
5307 5309 5310 CMAQ JA/RC STAF LTF AB2766 Carl<br />
Moyer LTF Art. 3 STIP TOTAL<br />
Budget <strong>2006</strong><br />
$ 130<br />
$ 33<br />
$ 163<br />
Forecast 2007<br />
$ 130<br />
$ 33<br />
$ 163<br />
Forecast 2008<br />
$ 130<br />
$ 33<br />
$ 163<br />
Forecast 2009<br />
$ 130<br />
$ 33<br />
$ 163<br />
Forecast 2010<br />
$ 130<br />
$ 33<br />
$ 163<br />
Forecast <strong>2011</strong><br />
$ 130<br />
$ 33<br />
$ 163<br />
TOTAL $ 783 $ - $ - $ - $ - $ - $ 196 $ - $ - $ - $ - $ 978<br />
2 of 18
<strong>Omnitrans</strong> Security Capital Improvement <strong>Plan</strong> <strong>2006</strong>-<strong>2011</strong><br />
SRTP #:<br />
Omni Budget #:<br />
Project ID:<br />
Program Code:<br />
FTA Scope:<br />
Status:<br />
3<br />
981114<br />
TR2S<br />
11.42.09<br />
no change<br />
new project<br />
scope change<br />
funding change<br />
Local $ > 20%<br />
Project Description:<br />
<strong>Transit</strong> - Security: Capitalization of security costs.<br />
Project Justification:<br />
These expenditures are to abate operating costs by shifting the expenses to capital financing. According to FTA guidelines, at least 1% of Section<br />
5307 funds must be used for security purposes.<br />
Significant Changes Since Last SRTP:<br />
POTENTIAL FUNDING SOURCES SUMMARY (IN $000's)<br />
Fiscal Year Federal<br />
State/Local<br />
Program/ Budget<br />
5307 5309 5310 CMAQ JA/RC STAF LTF AB2766 Carl<br />
Moyer LTF Art. 3 STIP TOTAL<br />
Budget <strong>2006</strong><br />
$ 130<br />
$ 33<br />
$ 163<br />
Forecast 2007<br />
$ 130<br />
$ 33<br />
$ 163<br />
Forecast 2008<br />
$ 130<br />
$ 33<br />
$ 163<br />
Forecast 2009<br />
$ 130<br />
$ 33<br />
$ 163<br />
Forecast 2010<br />
$ 130<br />
$ 33<br />
$ 163<br />
Forecast <strong>2011</strong><br />
$ 130<br />
$ 33<br />
$ 163<br />
TOTAL $ 783 $ - $ - $ - $ - $ - $ 196 $ - $ - $ - $ - $ 978<br />
3 of 18
<strong>Omnitrans</strong> Preventive Maintenance Capital Improvement <strong>Plan</strong> <strong>2006</strong>-<strong>2011</strong><br />
SRTP #:<br />
Omni Budget #:<br />
Project ID:<br />
Program Code:<br />
FTA Scope:<br />
Status:<br />
4<br />
981122<br />
TR6<br />
11.7A.00<br />
no change<br />
new project<br />
scope change<br />
funding change<br />
Local $ > 20%<br />
Project Description:<br />
Bus System - General: Capitalization of preventive maintenance<br />
Project Justification:<br />
Due to changes in TEA-21, preventive maintenance of vehicles, spare parts, etc are eligible expenses.<br />
Significant Changes Since Last SRTP:<br />
POTENTIAL FUNDING SOURCES SUMMARY (IN $000's)<br />
Fiscal Year Federal<br />
State/Local<br />
Program/ Budget<br />
5307 5309 5310 CMAQ JA/RC STAF LTF AB2766 Carl<br />
Moyer LTF Art. 3 STIP TOTAL<br />
Budget <strong>2006</strong><br />
$ 5,582<br />
$ 2,303<br />
$ 7,885<br />
Forecast 2007<br />
$ 9,057<br />
$ 2,264<br />
$ 11,322<br />
Forecast 2008<br />
$ 9,533<br />
$ 2,383<br />
$ 11,916<br />
Forecast 2009<br />
$ 8,703<br />
$ 2,176<br />
$ 10,879<br />
Forecast 2010<br />
$ 9,135<br />
$ 2,284<br />
$ 11,419<br />
Forecast <strong>2011</strong><br />
$ 9,609<br />
$ 2,402<br />
$ 12,011<br />
TOTAL $ 51,619 $ - $ - $ - $ - $ - $ 13,812 $ - $ - $ - $ - $ 65,431<br />
4 of 18
<strong>Omnitrans</strong> Management Information Systems Capital Improvement <strong>Plan</strong> <strong>2006</strong>-<strong>2011</strong><br />
SRTP #:<br />
Omni Budget #:<br />
Project ID:<br />
Program Code:<br />
FTA Scope:<br />
Status:<br />
5<br />
SBD31055<br />
TR2A1<br />
11.42.20<br />
no change<br />
new project<br />
scope change<br />
funding change<br />
Local $ > 20%<br />
Project Description:<br />
Project Justification:<br />
<strong>Transit</strong> - Administration Equipment: Purchase Management Information Systems (MIS) for East and West Valley facilities and provide training for<br />
new/upgraded equipment.<br />
MIS equipment will be used to replace/supplement outmoded equipment now in use and incorporate new technologies. The goal is to improve<br />
operational efficiency.<br />
Significant Changes Since Last SRTP:<br />
POTENTIAL FUNDING SOURCES SUMMARY (IN $000's)<br />
Fiscal Year Federal<br />
State/Local<br />
Program/ Budget<br />
5307 5309 5310 CMAQ JA/RC STAF LTF AB2766 Carl<br />
Moyer LTF Art. 3 STIP TOTAL<br />
Budget <strong>2006</strong><br />
$ 515<br />
$ 329<br />
$ 844<br />
Forecast 2007<br />
$ 349<br />
$ 87<br />
$ 436<br />
Forecast 2008<br />
$ 554<br />
$ 139<br />
$ 693<br />
Forecast 2009<br />
$ 692<br />
$ 173<br />
$ 865<br />
Forecast 2010<br />
$ 290<br />
$ 73<br />
$ 363<br />
Forecast <strong>2011</strong><br />
$ 2,986<br />
$ 747<br />
$ 3,733<br />
TOTAL $ 5,387 $ - $ - $ - $ - $ 1,547 $ - $ - $ - $ - $ - $ 6,933<br />
5 of 18
<strong>Omnitrans</strong> Office Equipment and Furniture Capital Improvement <strong>Plan</strong> <strong>2006</strong>-<strong>2011</strong><br />
SRTP #:<br />
Omni Budget #:<br />
Project ID:<br />
Program Code:<br />
FTA Scope:<br />
Status:<br />
6<br />
SBD31073<br />
TR2A1<br />
11.42.20<br />
no change<br />
new project<br />
scope change<br />
funding change<br />
Local $ > 20%<br />
Project Description:<br />
<strong>Transit</strong> - Administration Equipment: Purchase office equipment for East and West Valley facilities.<br />
Project Justification:<br />
Equipment will be used to replace worn out furnishings, expand and update administrative/support capabilities. The goal is to improve operational<br />
efficiency.<br />
Significant Changes Since Last SRTP:<br />
POTENTIAL FUNDING SOURCES SUMMARY (IN $000's)<br />
Fiscal Year Federal<br />
State/Local<br />
Program/ Budget<br />
5307 5309 5310 CMAQ JA/RC STAF LTF AB2766 Carl<br />
Moyer LTF Art. 3 STIP TOTAL<br />
Budget <strong>2006</strong><br />
$ 12<br />
$ 3<br />
$ 15<br />
Forecast 2007<br />
$ 12<br />
$ 3<br />
$ 16<br />
Forecast 2008<br />
$ 13<br />
$ 3<br />
$ 16<br />
Forecast 2009<br />
$ 13<br />
$ 3<br />
$ 17<br />
Forecast 2010<br />
$ 14<br />
$ 3<br />
$ 17<br />
Forecast <strong>2011</strong><br />
$ 14<br />
$ 4<br />
$ 18<br />
TOTAL $ 79 $ - $ - $ - $ - $ 20 $ - $ - $ - $ - $ - $ 98<br />
6 of 18
<strong>Omnitrans</strong> Stops and Zones Capital Improvement <strong>Plan</strong> <strong>2006</strong>-<strong>2011</strong><br />
SRTP #:<br />
Omni Budget #:<br />
Project ID:<br />
Program Code:<br />
FTA Scope:<br />
Status:<br />
7<br />
SBD31075<br />
TR6H1<br />
11.32.20<br />
no change<br />
new project<br />
scope change<br />
funding change<br />
Local $ > 20%<br />
Project Description:<br />
Project Justification:<br />
Bus System - Passenger Facilities ( Benches, Shelters, etc.): Purchase stops and zones equipment to replace, improve, or enhance stops in fixedroute<br />
operation.<br />
Equipment will be used to replace/supplement current amenities at fixed-route bus stops. Equipment is needed to accommodate continuation and<br />
expansion of fixed-route service.<br />
Significant Changes Since Last SRTP:<br />
POTENTIAL FUNDING SOURCES SUMMARY (IN $000's)<br />
Fiscal Year Federal<br />
State/Local<br />
Program/ Budget<br />
5307 5309 5310 CMAQ JA/RC STAF LTF AB2766 Carl<br />
Moyer LTF Art. 3 STIP TOTAL<br />
Budget <strong>2006</strong><br />
$ 28<br />
$ 7<br />
$ 34<br />
Forecast 2007<br />
$ 29<br />
$ 7<br />
$ 36<br />
Forecast 2008<br />
$ 30<br />
$ 7<br />
$ 37<br />
Forecast 2009<br />
$ 31<br />
$ 8<br />
$ 38<br />
Forecast 2010<br />
$ 32<br />
$ 8<br />
$ 40<br />
Forecast <strong>2011</strong><br />
$ 33<br />
$ 8<br />
$ 41<br />
TOTAL $ 181 $ - $ - $ - $ - $ 45 $ - $ - $ - $ - $ - $ 226<br />
7 of 18
<strong>Omnitrans</strong> Service & Support Vehicles Capital Improvement <strong>Plan</strong> <strong>2006</strong>-<strong>2011</strong><br />
SRTP #:<br />
Omni Budget #:<br />
Project ID:<br />
Program Code:<br />
FTA Scope:<br />
Status:<br />
8<br />
SBD31084<br />
TR6Q1<br />
11.42.11<br />
no change<br />
new project<br />
scope change<br />
funding change<br />
Local $ > 20%<br />
Project Description:<br />
Project Justification:<br />
Bus System - Service Vehicles: Purchase service vehicles. FY06: Replace - 220, 223, 312, 313, 314, 315, 316, 317, 382L, 383L, 394L, 395L, 396L,<br />
397L, one new Dir. of Ops (L); FY07: Replace - 218, 219, 300, 301, 302, 303, 304, 305, 306, 307, 308, 358L, 359L, 360L, 361L, 362L, 363L, 364L,<br />
365L, 366L, 367L, 368L, 369L, 370L, 385, 386L, 387L, 388L, 389L, 390L, 2448; FY08: Replace - 257, 262; FY09: Replace - 266, 322, 323, 325,<br />
350L, 352L, 353L, 355L, 356L, 357L, 384, 0210-P; FY10: Replace - 221,222,255; FY11: Replace (2nd replacement cycle for the following) - 312,<br />
313, 314, 315, 316, 317, 382L, 383L, 394L, 395L, 396L, 397L, Dir. of Ops from FY06 (L).<br />
Replacement vehicles are needed to replace vehicles that have reached the end of their useful life. Expansion vehicles are needed to<br />
accommodate growth in staff and associated travel requirements.<br />
Significant Changes Since Last SRTP:<br />
Fiscal Year<br />
POTENTIAL FUNDING SOURCES SUMMARY (IN $000's)<br />
Federal<br />
State/Local<br />
Program/ Budget<br />
5307 5309 5310 CMAQ JA/RC STAF LTF AB2766 Carl<br />
Moyer LTF Art. 3 STIP TOTAL<br />
Budget <strong>2006</strong><br />
$ 376<br />
$ 94<br />
$ 470<br />
Forecast 2007<br />
$ 715<br />
$ 179<br />
$ 894<br />
Forecast 2008<br />
$ 62<br />
$ 16<br />
$ 78<br />
Forecast 2009<br />
$ 296<br />
$ 74<br />
$ 370<br />
Forecast 2010<br />
$ 124<br />
$ 31<br />
$ 156<br />
Forecast <strong>2011</strong><br />
$ 349<br />
$ 87<br />
$ 436<br />
TOTAL $ 1,922 $ - $ - $ - $ - $ 481 $ - $ - $ - $ - $ - $ 2,403<br />
8 of 18
<strong>Omnitrans</strong> Replacement Paratransit Vehicle Capital Improvement <strong>Plan</strong> <strong>2006</strong>-<strong>2011</strong><br />
SRTP #:<br />
Omni Budget #:<br />
Project ID:<br />
Program Code:<br />
FTA Scope:<br />
Status:<br />
9<br />
20040211<br />
TR5V6<br />
11.12.04<br />
no change<br />
new project<br />
scope change<br />
funding change<br />
Local $ > 20%<br />
Project Description:<br />
Paratransit - Vehicles (Repl.: Gas/Diesel): Purchase replacement paratransit vans: FY06 - 10; FY07 - 25; FY08 - 50; FY09 - 50. Vans will be lift<br />
equipped and run on conventional fuel source, unless a CARB approved engine is found that meets <strong>Omnitrans</strong> service requirements.<br />
Project Justification:<br />
Vehicles being replaced will have reached standard replacement life of 4 years/100,000 miles<br />
Significant Changes Since Last SRTP:<br />
Discretionary funds should be requested, as per the SRTP <strong>2006</strong>-<strong>2011</strong>, towards the purchase of replacement paratransit vehicles. Funds are shown<br />
for request in FY08 and FY09, assuming they will be budgeted in FY10 and FY11, and they will require a local match.<br />
POTENTIAL FUNDING SOURCES SUMMARY (IN $000's)<br />
Fiscal Year Federal<br />
State/Local<br />
Program/ Budget<br />
5307 5309 5310 CMAQ JA/RC STAF LTF AB2766 Carl<br />
Moyer LTF Art. 3 STIP TOTAL<br />
Budget <strong>2006</strong><br />
$ 604<br />
$ 151<br />
$ 755<br />
Forecast 2007<br />
$ 1,563<br />
$ 391<br />
$ 1,954<br />
Forecast 2008<br />
$ 3,325<br />
$ 832<br />
$ 4,157<br />
Forecast 2009<br />
$ 3,325<br />
$ 832<br />
$ 4,157<br />
Forecast 2010<br />
$ -<br />
Forecast <strong>2011</strong><br />
$ -<br />
TOTAL $ 2,167 $ - $ - $ 6,650 $ - $ 2,206 $ - $ - $ - $ - $ - $ 11,023<br />
9 of 18
<strong>Omnitrans</strong> Capitalization of Leases Capital Improvement <strong>Plan</strong> <strong>2006</strong>-<strong>2011</strong><br />
SRTP #:<br />
Omni Budget #:<br />
Project ID:<br />
Program Code:<br />
FTA Scope:<br />
Status:<br />
10<br />
SBD43012<br />
TR6Q<br />
11.46.03<br />
no change<br />
new project<br />
scope change<br />
funding change<br />
Local $ > 20%<br />
Project Description:<br />
Capitalization of Operating facility lease for West Valley Access and Omnilink service/ Voice/data communications base station and antenna tower<br />
sites.<br />
Project Justification:<br />
<strong>Omnitrans</strong> does not own appropriate property and facilities for these purposes and therefore these expenditures can be shifted to capital financing<br />
Significant Changes Since Last SRTP:<br />
POTENTIAL FUNDING SOURCES SUMMARY (IN $000's)<br />
Fiscal Year Federal<br />
State/Local<br />
Program/ Budget<br />
5307 5309 5310 CMAQ JA/RC STAF LTF AB2766 Carl<br />
Moyer LTF Art. 3 STIP TOTAL<br />
Budget <strong>2006</strong><br />
$ 71<br />
$ 18<br />
$ 89<br />
Forecast 2007<br />
$ 74<br />
$ 19<br />
$ 93<br />
Forecast 2008<br />
$ 78<br />
$ 19<br />
$ 97<br />
Forecast 2009<br />
$ 80<br />
$ 20<br />
$ 100<br />
Forecast 2010<br />
$ 83<br />
$ 21<br />
$ 104<br />
Forecast <strong>2011</strong><br />
$ 86<br />
$ 22<br />
$ 108<br />
TOTAL $ 473 $ - $ - $ - $ - $ - $ 118 $ - $ - $ - $ - $ 591<br />
10 of 18
<strong>Omnitrans</strong> Replacement Heavy Duty Coaches Capital Improvement <strong>Plan</strong> <strong>2006</strong>-<strong>2011</strong><br />
SRTP #:<br />
Omni Budget #:<br />
Project ID:<br />
Program Code:<br />
FTA Scope:<br />
Status:<br />
11<br />
SBD90105<br />
TR6A7<br />
11.12.01<br />
no change<br />
new project<br />
scope change<br />
funding change<br />
Local $ > 20%<br />
Project Description:<br />
Project Justification:<br />
Bus System - Buses (Repl.: Alt. Fuel): Purchase replacement coaches: 06- 7 Over the Road Coaches, 8 40-foot, and additional local funds<br />
needed toward the purchase of 8 coaches scheduled for arrival in Spring <strong>2006</strong>; 08 - 11 40-foot; 09 - 14 40-foot; 2010 - 10 40-foot; 11 - 10 40-foot.<br />
Vehicles will be equipped with wheelchair lift or low-floor, two tie-downs, kneeling feature, air conditioning, and auxillary equipment to include<br />
headsigns, fareboxes, radios, etc. Engines will run on alternative fuel source.<br />
Replacement coaches are needed to replace coaches that will have reached the standard replacement life. Alternative fuel will help in attaining<br />
regional air quality goals.<br />
Significant Changes Since Last SRTP:<br />
In FY06 Over the Road Coaches programmed at $506,670 each (assumes receipt in 2008); 40-foot programmed at $555,735 each (hybrid price;<br />
assumes receipt in FY06)<br />
POTENTIAL FUNDING SOURCES SUMMARY (IN $000's)<br />
Fiscal Year Federal<br />
State/Local<br />
Program/ Budget<br />
5307 5309 5310 CMAQ JA/RC STAF LTF AB2766 Carl<br />
Moyer LTF Art. 3 STIP TOTAL<br />
Budget <strong>2006</strong><br />
$ 6,394<br />
$ 1,499 $ 355<br />
$ 8,248<br />
Forecast 2007<br />
$ -<br />
Forecast 2008<br />
$ 5,795<br />
$ 753<br />
$ 6,548<br />
Forecast 2009<br />
$ 1,307<br />
$ 6,189<br />
$ 1,131<br />
$ 8,626<br />
Forecast 2010<br />
$ 3,168<br />
$ 792<br />
$ 3,960<br />
Forecast <strong>2011</strong><br />
$ 2,733<br />
$ 109<br />
$ 2,842<br />
TOTAL $ 13,602 $ -<br />
$ 11,984 $ - $ 4,284 $ 355 $ - $ - $ - $ - $ 30,225<br />
11 of 18
<strong>Omnitrans</strong> Yucaipa Transcenter Capital Improvement <strong>Plan</strong> <strong>2006</strong>-<strong>2011</strong><br />
SRTP #:<br />
Omni Budget #:<br />
Project ID:<br />
Program Code:<br />
FTA Scope:<br />
Status:<br />
12<br />
20020805<br />
TR6H<br />
11.33.01<br />
no change<br />
new project<br />
scope change<br />
funding change<br />
Local $ > 20%<br />
Project Description:<br />
Bus System - Passenger Facilities: Construction of the Yucaipa Transcenter. Funds programmed in FY 2004<br />
Project Justification:<br />
The City of Yucaipa currently does not have a location that is formally set up for transfer between buses/modes. Because of the geographic barriers<br />
of the City of Yucaipa, it is often separated from the rest of <strong>Omnitrans</strong> service area. However, it is a heavily traveled area - with people coming<br />
through the City from the more eastern desert region, and having to continue on to other areas in the <strong>Omnitrans</strong> service area. The transcenter will<br />
provide a location, central to the City, that will be used for safe transfers between modes and buses.<br />
Significant Changes Since Last SRTP:<br />
POTENTIAL FUNDING SOURCES SUMMARY (IN $000's)<br />
Fiscal Year Federal<br />
State/Local<br />
Program/ Budget<br />
5307 5309 5310 CMAQ JA/RC STAF LTF AB2766 Carl<br />
Moyer LTF Art. 3 STIP TOTAL<br />
Budget <strong>2006</strong><br />
$ 1,132<br />
$ 283<br />
$ 1,415<br />
Forecast 2007<br />
$ -<br />
Forecast 2008<br />
$ -<br />
Forecast 2009<br />
$ -<br />
Forecast 2010<br />
$ -<br />
Forecast <strong>2011</strong><br />
$ -<br />
TOTAL $ 1,132 $ - $ - $ - $ - $ 283 $ - $ - $ - $ - $ - $ 1,415<br />
12 of 18
<strong>Omnitrans</strong> Expansion Paratransit Vehicles Capital Improvement <strong>Plan</strong> <strong>2006</strong>-<strong>2011</strong><br />
SRTP #:<br />
Omni Budget #:<br />
Project ID:<br />
Program Code:<br />
FTA Scope:<br />
Status:<br />
13<br />
20040213<br />
TR5V2<br />
11.13.15<br />
no change<br />
new project<br />
scope change<br />
funding change<br />
Local $ > 20%<br />
Project Description:<br />
Paratransit - Vehicles (Exp.: Gas/Diesel): Purchase paratransit vans for expansion. FY06 - 7. Vehicles will be lift equipped and run on conventional<br />
fuel source, unless a CARB approved engine is found that meets <strong>Omnitrans</strong> service requirements.<br />
Project Justification:<br />
Expansion vehicles are needed to maintain service levels and address service requests.<br />
Significant Changes Since Last SRTP:<br />
POTENTIAL FUNDING SOURCES SUMMARY (IN $000's)<br />
Fiscal Year Federal<br />
State/Local<br />
Program/ Budget<br />
5307 5309 5310 CMAQ JA/RC STAF LTF AB2766 Carl<br />
Moyer LTF Art. 3 STIP TOTAL<br />
Budget 2004<br />
$ 438<br />
$ 140<br />
$ 578<br />
Forecast 2005<br />
$ -<br />
Forecast <strong>2006</strong><br />
$ -<br />
Forecast 2007<br />
$ -<br />
Forecast 2008<br />
$ -<br />
Forecast 2009<br />
$ -<br />
TOTAL $ - $ - $ 438 $ - $ - $ 140 $ - $ - $ - $ - $ - $ 578<br />
13 of 18
<strong>Omnitrans</strong> SBX Capital Improvement <strong>Plan</strong> <strong>2006</strong>-<strong>2011</strong><br />
SRTP #:<br />
Omni Budget #:<br />
Project ID:<br />
Program Code:<br />
FTA Scope:<br />
Status:<br />
14<br />
20020804<br />
11.21.01<br />
no change<br />
new project<br />
scope change<br />
funding change<br />
Local $ > 20%<br />
Project Description:<br />
SBX Program for San Bernardino Valley-wide Rapid <strong>Transit</strong> Program.<br />
Project Justification:<br />
In 2004, <strong>Omnitrans</strong> begain a major investment study (MIS) to implement a Bus Rapid <strong>Transit</strong> (BRT) System along E Street from San Bernardino to<br />
Loma Linda, as well as other system corridor alternatives analysis within <strong>Omnitrans</strong> service area. This is planned for conclusion in FY06.<br />
Engineering will be done in FY07. BRT is being implemented throughout the nation to improve the viability of transit in the community (vs. the<br />
automobile). In addition, the cost of implementing a BRT is signifcantly less than if a light rail system is implemented, making BRT a very attractive,<br />
option. The system will be called SBX in the San Bernardino valley. Funding to begin construction will be sought as soon as possible from a variety<br />
of sources, including FTA New Starts.<br />
Significant Changes Since Last SRTP:<br />
POTENTIAL FUNDING SOURCES SUMMARY (IN $000's)<br />
Fiscal Year Federal<br />
State/Local<br />
Program/ Budget<br />
5307 5309 5310 CMAQ JA/RC STAF LTF AB2766 Carl<br />
Moyer LTF Art. 3 STIP TOTAL<br />
Budget <strong>2006</strong><br />
$ 240<br />
$ 10 $ 50<br />
$ 300<br />
Forecast 2007<br />
$ 400<br />
$ 100<br />
$ 500<br />
Forecast 2008<br />
$ -<br />
Forecast 2009<br />
$ -<br />
Forecast 2010<br />
$ -<br />
Forecast <strong>2011</strong><br />
$ -<br />
TOTAL $ 640 $ - $ - $ - $ - $ 110 $ 50 $ - $ - $ - $ - $ 800<br />
14 of 18
<strong>Omnitrans</strong> Facility Improvements Capital Improvement <strong>Plan</strong> <strong>2006</strong>-<strong>2011</strong><br />
SRTP #:<br />
Omni Budget #:<br />
Project ID:<br />
Program Code:<br />
FTA Scope:<br />
Status:<br />
15<br />
20020806<br />
11.44.03<br />
no change<br />
new project<br />
scope change<br />
funding change<br />
Local $ > 20%<br />
Project Description:<br />
<strong>Transit</strong> - Facilities: Improvement/upkeep of existing facilities.<br />
Project Justification:<br />
Facility improvements and upkeep are necessary to make sure that they are kept in working order and do not fall into disrepair.<br />
Significant Changes Since Last SRTP:<br />
POTENTIAL FUNDING SOURCES SUMMARY (IN $000's)<br />
Fiscal Year Federal<br />
State/Local<br />
Program/ Budget<br />
5307 5309 5310 CMAQ JA/RC STAF LTF AB2766 Carl<br />
Moyer LTF Art. 3 STIP TOTAL<br />
Budget <strong>2006</strong><br />
$ 285<br />
$ 71<br />
$ 356<br />
Forecast 2007<br />
$ 372<br />
$ 93<br />
$ 465<br />
Forecast 2008<br />
$ 116<br />
$ 29<br />
$ 145<br />
Forecast 2009<br />
$ 1,248<br />
$ 312<br />
$ 1,561<br />
Forecast 2010<br />
$ 85<br />
$ 21<br />
$ 107<br />
Forecast <strong>2011</strong><br />
$ 5<br />
$ 1<br />
$ 7<br />
TOTAL $ 2,112 $ - $ - $ - $ - $ 528 $ - $ - $ - $ - $ - $ 2,640<br />
15 of 18
<strong>Omnitrans</strong> Revenue Equipment Capital Improvement <strong>Plan</strong> <strong>2006</strong>-<strong>2011</strong><br />
SRTP #:<br />
Omni Budget #:<br />
Project ID:<br />
Program Code:<br />
FTA Scope:<br />
Status:<br />
16<br />
20040805<br />
X<br />
no change<br />
new project<br />
scope change<br />
funding change<br />
Local $ > 20%<br />
Project Description:<br />
Improvement, upkeep, or replacement of equipment used in revenue service.<br />
Project Justification:<br />
In FY06, the current digital on-board video survelance system will be replaced. The current system is 5 years old and replacement parts for the<br />
existing system are no longer available. Also in FY06, <strong>Omnitrans</strong> received a 5310 grant for the purchase of 3 base stations, 12 mobile radios, and a<br />
mobile data terminal. The current system is in the process of being replaced and this grant funding will assist with the replacement of units on<br />
paratransit vehicles.<br />
Significant Changes Since Last SRTP:<br />
POTENTIAL FUNDING SOURCES SUMMARY (IN $000's)<br />
Fiscal Year Federal<br />
State/Local<br />
Program/ Budget<br />
5307 5309 5310 CMAQ JA/RC STAF LTF AB2766 Carl<br />
Moyer LTF Art. 3 STIP TOTAL<br />
Current <strong>2006</strong><br />
$ 348<br />
$ 69<br />
$ 104<br />
$ 521<br />
Budget 2007<br />
$ -<br />
Forecast 2008<br />
$ -<br />
Forecast 2009<br />
$ -<br />
Forecast 2010<br />
$ 399<br />
$ 100<br />
$ 499<br />
Forecast <strong>2011</strong><br />
$ -<br />
TOTAL $ 399 $ - $ - $ - $ - $ 100 $ - $ - $ - $ - $ - $ 499<br />
16 of 18
<strong>Omnitrans</strong> Replacement Less-Than-30 Coach Capital Improvement <strong>Plan</strong> <strong>2006</strong>-<strong>2011</strong><br />
SRTP #:<br />
Omni Budget #:<br />
Project ID:<br />
Program Code:<br />
FTA Scope:<br />
Status:<br />
17<br />
SBD31088<br />
TR6A3<br />
11.03.04<br />
no change<br />
new project<br />
scope change<br />
funding change<br />
Local $ > 20%<br />
Project Description:<br />
Bus System - Buses (Repl.: Alt. Fuel): Purchase coaches for replacement of trolleys: FY10-3. Coaches will be alternatively fueled and equipped<br />
with wheelchair lift or low-floor, two tie-downs, kneeling feature, air conditioning, and auxillary equipment to include, but not limited to, headsigns,<br />
fareboxes, radios, etc.<br />
Project Justification:<br />
Vehicles being replaced will have reached standard replacement life of 7 years/250,000 miles<br />
Significant Changes Since Last SRTP:<br />
Programmed at mid-size vehicle pricing<br />
POTENTIAL FUNDING SOURCES SUMMARY (IN $000's)<br />
Fiscal Year Federal<br />
State/Local<br />
Program/ Budget<br />
5307 5309 5310 CMAQ JA/RC STAF LTF AB2766 Carl<br />
Moyer LTF Art. 3 STIP TOTAL<br />
Budget <strong>2006</strong><br />
$ -<br />
Forecast 2007<br />
$ -<br />
Forecast 2008<br />
$ -<br />
Forecast 2009<br />
$ -<br />
Forecast 2010<br />
$ 1,133<br />
$ 283<br />
$ 1,416<br />
Forecast <strong>2011</strong><br />
$ -<br />
TOTAL $ 1,133 $ - $ - $ - $ - $ 283 $ - $ - $ - $ - $ - $ 1,416<br />
17 of 18
<strong>Omnitrans</strong> Alt Fueling Facilities Capital Improvement <strong>Plan</strong> <strong>2006</strong>-<strong>2011</strong><br />
SRTP #:<br />
Omni Budget #:<br />
Project ID:<br />
Program Code:<br />
FTA Scope:<br />
Status:<br />
18<br />
TR6M1<br />
11.43.06<br />
no change<br />
new project<br />
scope change<br />
funding change<br />
Local $ > 20%<br />
Project Description:<br />
<strong>Transit</strong> - Fueling Facilities: Rehabilitation and maintenance of alternative fueling facilities.<br />
Project Justification:<br />
Various maintenance equipment will be replaced, repaired and/or refurbished to enhance fueling capabilities and to replace parts that have<br />
become worn or no longer able to meet up-to-date air quality standards. Refurbishment will occur every 4 years.<br />
Significant Changes Since Last SRTP:<br />
POTENTIAL FUNDING SOURCES SUMMARY (IN $000's)<br />
Fiscal Year Federal<br />
State/Local<br />
Program/ Budget<br />
5307 5309 5310 CMAQ JA/RC STAF LTF AB2766 Carl<br />
Moyer LTF Art. 3 STIP TOTAL<br />
Budget <strong>2006</strong><br />
$ -<br />
Forecast 2007<br />
$ 244<br />
$ 61<br />
$ 305<br />
Forecast 2008<br />
$ 160<br />
$ 40<br />
$ 200<br />
Forecast 2009<br />
$ -<br />
Forecast 2010<br />
$ -<br />
Forecast <strong>2011</strong><br />
$ 297<br />
$ 74<br />
$ 371<br />
TOTAL $ 701 $ - $ - $ - $ - $ 175 $ - $ - $ - $ - $ - $ 876<br />
Notes:<br />
Estimated cost to provide updates to the CNG station is $305,000 (combined east and west valleys). This cost is from an estimate of $250,000 in FY02 dollars plus an annual increase of 5%<br />
in out years for inflation. Regular updates to the CNG stations should be added every 4 years.<br />
18 of 18
Appendix - E<br />
Up-to-Design/Unconstrained<br />
Maps and Schedules
Up To Design Scenario FY <strong>2006</strong><br />
New Route 17<br />
(Redlands –Via San Bernardino Avenue – San Bernardino)<br />
Description: From Redlands Transcenter, NB Orange, WB San Bernardino, NB<br />
Arrowhead, WB 2nd St. to San Bernardino Transcenter. Route 17 will operate at 60<br />
minutes on Weekdays, Saturday, and Sunday.<br />
Annual Service Statistics<br />
Route Day of Week Service Span Hours Miles Buses<br />
Annual Cost<br />
(FY 06 Dollars)<br />
17 Weekday 6:00 a.m. – 9:00 p.m. 5,031 70,434 2 $433,471<br />
Saturday 7:00 a.m. – 9:00 p.m. 910 12,750 2 $78,406<br />
Sunday 7:00 a.m. – 7:00 p.m. 796 11,118 2 $68,549<br />
Total 6,736.60 94,302.00 2 Peak $580,425<br />
Rationale: Implementing service on San Bernardino Avenue between Tippecanoe Avenue<br />
and Mountain View Avenue will address many service requests from residents living south<br />
of the San Bernardino Airport. This alignment will also offer coverage to the Citrus Plaza<br />
in Redlands in place of Route 15 and provide transportation service for the redevelopment<br />
of downtown Redlands, Redlands Mall, and city-wide revitalization.<br />
Additional Trip Generators: San Bernardino Municipal Court, City Hall, City Clerk,<br />
Post Office.<br />
<strong>2006</strong>-<strong>2011</strong> SRTP<br />
Appendix E<br />
E-1
Up To Design Scenario FY <strong>2006</strong><br />
New Route 18<br />
(San Bernardino –Via Sterling – San Manuel Casino)<br />
Description: From downtown San Bernardino, EB 3rd Street, NB Sterling, EB Lynwood,<br />
NB Victoria Street to San Manuel Casino. Route 18 will operate at 30 minutes on<br />
Weekdays and 60 minutes on Weekends.<br />
Annual Service Statistics<br />
Route Day of Week Service Span Hours Miles Buses<br />
Annual Cost<br />
(FY 06 Dollars)<br />
18 Weekday 6:00 a.m. – 9:00 p.m. 7,314 102,168 2 $630,200<br />
Saturday 7:00 a.m. – 9:00 p.m. 700 9,250 1 $60,312<br />
Sunday 7:00 a.m. -7:00 p.m. 612 8,058 1 $52,730<br />
Total 8,626.30 119,476.00 2 Peak $743,242<br />
Rationale: This route will supply service to the currently transit absent North/South strip<br />
of Sterling Avenue between 3 rd Street and Highland Avenue. Introducing Route 18 will<br />
reduce travel time and the need of transferring for residents of Tippecanoe Avenue, south<br />
of 3 rd Street, traveling along Sterling in the mornings for employment in Highland. In<br />
addition to coverage in Highland, the booming San Manuel Casino will receive service for<br />
its many patrons and employees to connect to downtown San Bernardino. The future San<br />
Manuel commercial/industrial property on 3 rd Street between Lankershim and Victoria<br />
Avenues may bring the alignment to travel EB 3 rd Street, NB Lankershim, WB 6 th Street,<br />
and continuing NB on Sterling to regular routing. This extended coverage will likely occur<br />
indefinitely after September 2005 to provide coverage to the developed commercial land.<br />
Additional Trip Generators: Warm Springs Elementary School, ASA Learning Center,<br />
Del Vallejo Middle School, and San Bernardino City Hall.<br />
<strong>2006</strong>-<strong>2011</strong> SRTP<br />
Appendix E<br />
E-2
Up To Design Scenario FY <strong>2006</strong><br />
New Route 21<br />
(San Bernardino –Via Rancho Avenue – Colton)<br />
Description: From downtown San Bernardino, WB Mill St., SB Rancho Ave., EB N St.,<br />
NB La Cadena, WB E St., NB Rancho, EB Mill, returning to San Bernardino Transcenter.<br />
Route 21 will operate at 60 minutes on Weekdays, Saturdays and Sundays.<br />
Annual Service Statistics<br />
Route Day of Week Service Span Hours Miles Buses<br />
Annual Cost<br />
(FY 06 Dollars)<br />
21 Weekday 6:00 a.m. – 9:00 p.m. 5,263 73,788 2 $453,477<br />
Saturday 7:00 a.m. – 9:00 p.m. 952 13,350 2 $82,024<br />
Sunday 7:00 a.m. – 7:00 p.m. 832 11,679 2 $71,713<br />
Total 7,047.52 98,817.00 2 Peak $607,214<br />
Rationale: This alignment will address numerous service requests from residents of the<br />
South Colton area by traveling via the Rancho Avenue Corridor to meet with Colton Civic<br />
Center, Colton High School, Colton Middle School, and the 12000 sq. ft. multi- tenant<br />
warehouse on Pennsylvania & D Street.<br />
Additional Trip Generators: Stater Brothers, Colton apartment homes, Frazee<br />
Community Center, Fleming Park, and Colton History Museum.<br />
<strong>2006</strong>-<strong>2011</strong> SRTP<br />
Appendix E<br />
E-3
Up To Design Scenario FY <strong>2006</strong><br />
Modified Route 22<br />
(ARMC – Riverside Avenue – Fontana)<br />
Description: The trunk of Route 22 will remain unchanged up to Cactus & Bonhert. At<br />
Cactus & Bonhert, continue WB Bonhert, NB Locust, WB Casa Grande, NB Terra Vista,<br />
NB Live Oak, NB Riverside, and SB Sierra to Fontana Metrolink. Route 22 will operate at<br />
15 minutes on Weekdays, 20 minutes on Saturdays, and 40 minutes on Sundays.<br />
Annual Service Statistics<br />
Route Day of Week Service Span Hours Miles Buses<br />
Annual Cost<br />
(FY 06 Dollars)<br />
22 Weekday 4:48 a.m. – 10:14 p.m. 45,890 642,420 11 $3,953,922<br />
Saturday 6:00 a.m. – 10:14 p.m. 6,557 91,850 8 $564,951<br />
Sunday 5:55 a.m. – 8:32 p.m. 2,988 20,910 4 $257,410<br />
Total 55,435.04 755,180.00 11 Peak $4,776,283<br />
Rationale: This southward continuation of the alignment will connect North Rialto with<br />
the Fontana Metrolink.<br />
Additional Trip Generators: Fontana City Hall, Sunrise apartment homes, Sunrise<br />
Senior Citizen Villa, Oldtimers Foundation Senior Center, Wal-Mart, and Stater Brothers.<br />
<strong>2006</strong>-<strong>2011</strong> SRTP<br />
Appendix E<br />
E-4
Up To Design Scenario FY <strong>2006</strong><br />
Modified Route 28<br />
(South Ridge – Slover Avenue – Kaiser)<br />
Description: Route 28 remains the same from Southridge to Fontana Transcenter. At<br />
Fontana Transcenter, continue NB Sierra, WB Summit, SB Citrus, EB Carter, and SB<br />
Sierra to Fontana Metrolink. Weekday hourly frequency will remain at 60 minutes.<br />
Service will be implemented on Saturdays and Sundays, both at 60 minute frequencies.<br />
Annual Service Statistics<br />
Route Day of Week Service Span Hours Miles Buses<br />
Annual Cost<br />
(FY 06 Dollars)<br />
28 Weekday 5:02 a.m. – 9:57 p.m. 8,106 116,394 3 $698,444<br />
Saturday 7:00 a.m. – 9:00 p.m. 700 8,556 3 $60,312<br />
Sunday 7:00 a.m. – 7:00 p.m. 612 7,344 3 $52,730<br />
Total 9,418.36 132,294.12 3 Peak $811,486<br />
Rationale: The northward expansion of this route will provide service to Summit<br />
residents, Sierra Lakes new housing, shopping opportunities in North Fontana, and<br />
ultimately connecting with South Fontana.<br />
Additional Trip Generators: North Fontana Community Center, Stater Brothers, Sonrise<br />
Senior Citizen Village, Sonrise Apartments, Fontana Nutrition Site, and Ujima Counseling<br />
Clinic.<br />
<strong>2006</strong>-<strong>2011</strong> SRTP<br />
Appendix E<br />
E-5
Up To Design Scenario FY <strong>2006</strong><br />
Modified Route 29<br />
(Kaiser – North Rialto – Bloomington)<br />
Description: From South Fontana TC, EB Valley, NB Locust, WB Baseline, NB Laurel,<br />
EB Highland, SB Riverside, EB Baseline, SB Pepper, WB Valley, (Bloomington loop: SB<br />
Cedar, EB Slover, SB Spruce, WB Santa Ana, SB Cedar, WB 11th St., NB Locust), WB<br />
Slover, NB Sierra to South Fontana Transcenter. Route 29 will remain operating at 60<br />
minute frequency on Weekdays and Saturdays in addition to implementation of 60 minute<br />
service on Sundays.<br />
Annual Service Statistics<br />
Route Day of Week Service Span Hours Miles Buses<br />
Annual Cost<br />
(FY 06 Dollars)<br />
29 Weekday 4:48 a.m. – 10:14 p.m. 14,600 204,336 4 $1,257,955<br />
Saturday 6:45 a.m. – 10:35 p.m. 2,701 37,800 4 $232,718<br />
Sunday 7:00 a.m. – 7:00 p.m. 2,099 29,376 4 $180,864<br />
Total 19,400.38 271,512.00 4 Peak $1,671,537<br />
Rationale: The northward extension of the alignment will cover the dense Pepper<br />
Corridor with many residential and shopping locations along Baseline and respond to<br />
service requests for Valley Boulevard between Sierra and Pepper where there are many<br />
homes and a proposed Hotel development (NW Pepper and Valley).<br />
Additional Trip Generators: Children Acute Care Center, San Bernardino County<br />
Mental Health Department, Wal-Mart, Arrowhead Regional Medical Center, K-Mart,<br />
Mobile homes, Maple Hill Apartments, and Easton Square Apartments.<br />
<strong>2006</strong>-<strong>2011</strong> SRTP<br />
Appendix E<br />
E-6
Up To Design Scenario FY <strong>2006</strong><br />
New Route 57<br />
(Chino Hills – Milliken – Chaffey College)<br />
Definition: From Chaffey College, travel SB Haven, EB Mission, SB Milliken/Hamner,<br />
WB Edison, NB Pipeline, EB Chino, and SB Ramona, into the Chino Transcenter. Route<br />
57 will operate at 30 minute frequency on Weekdays and 60 minute frequency on<br />
Weekends.<br />
Annual Service Statistics<br />
Route Day of Week Service Span Hours Miles Buses<br />
Annual Cost<br />
(FY 06 Dollars)<br />
57 Weekday 5:45 a.m. – 10:35 p.m. 26,922 376,938 7 $2,319,625<br />
Saturday 6:45 a.m. – 10:35 p.m. 2,808 39,250 4 $241,937<br />
Sunday 7:00 a.m. – 7:00 p.m. 1,909 26,673 4 $164,517<br />
Total 31,639.74 442,861.00 7 Peak $2,726,080<br />
Rationale: This route will connect the Agricultural Preserve area (South Ontario/East<br />
Chino), the Chaffey College Alta Loma (North Rancho Cucamonga) and Chino Campuses<br />
as well as many retail centers (Grand Ave and Peyton) to the Chino Transcenter. The<br />
east/west alignment on Edison will extend the <strong>Omnitrans</strong> service area further southward<br />
into the developing residential area of the Agricultural Preserve.<br />
Additional Trip Generators: Chino Hills Library, Chino Hills City Hall, Crossroads<br />
Adult Day Health Care, Jericho Outreach Men’s Facility, YMCA-Chino Valley, Canyon<br />
Ridge Hospital, Central Park, Ontario Airport Hilton, and Target.<br />
<strong>2006</strong>-<strong>2011</strong> SRTP<br />
Appendix E<br />
E-7
Up To Design Scenario FY <strong>2006</strong><br />
Modified Route 71<br />
(Kaiser – South Ridge –Ontario)<br />
Description: The alignment will remain the same from Fontana Transcenter to Ontario<br />
Mills. At Ontario Mills, continue NB Milliken, WB 4th, and SB Euclid to the Ontario<br />
Transcenter. Service will remain operating at 60 minutes during Weekdays and Weekends.<br />
Annual Service Statistics<br />
Route Day of Week Service Span Hours Miles Buses<br />
Annual Cost<br />
(FY 06 Dollars)<br />
71 Weekday 4:35 a.m. – 10:27 p.m. 12,887 186,686 3 $1,110,353<br />
Saturday 5:35 a.m. – 10:28 p.m. 2,077 30,091 3 $178,911<br />
Sunday 5:35 a.m. – 8:27 p.m. 1,889 27,384 3 $162,716<br />
Total 16,852.13 244,161.17 3 Peak $1,451,980<br />
Rationale: The westward extension of this route will create cross town linkage<br />
throughout downtown Fontana, south Fontana, and downtown Ontario.<br />
Additional Trip Generators: Kmart, Coram Healthcare, Lamplighter Ontario Mobile<br />
Park, Sycamore Park Apartments, Grove Apartments, and Public Housing.<br />
<strong>2006</strong>-<strong>2011</strong> SRTP<br />
Appendix E<br />
E-8
Up To Design Scenario FY <strong>2006</strong><br />
Modified Route 75<br />
(Ontario –Via Francis – Ontario Mills)<br />
Description: Alignment from Ontario Mills to Mission & Grove will remain unchanged.<br />
At Mission & Grove, continue NB Grove, WB Mission, NB Main, and WB to Pomona<br />
Transcenter. Service will remain at 60 minutes on Weekdays only.<br />
Annual Service Statistics<br />
Route Day of Week Service Span Hours Miles Buses<br />
Annual Cost<br />
(FY 06 Dollars)<br />
75 Weekday 5:05 a.m. – 9:57 p.m. 10,196 142,746 3 $878,501<br />
Total 10,196.16 142,746.24 3 Peak $878,501<br />
Rationale: The westward alignment extension will permit connections with Foothill<br />
<strong>Transit</strong> at the Pomona Transcenter as well as various government centers on Main Street<br />
such as the Police Station, Courthouse, and City Hall.<br />
Additional Trip Generators: SCE, Hacienda Mobile Home Park, Grove Manor Mobile<br />
Home Park, and Odyssey Mobile Estates.<br />
<strong>2006</strong>-<strong>2011</strong> SRTP<br />
Appendix E<br />
E-9
Up To Design Scenario FY <strong>2006</strong><br />
New Route: Yucaipa Circulator North and South Loops<br />
Description: The North Loop will travel from Yucaipa Transcenter (Yucaipa @ 5th St.),<br />
EB Yucaipa NB Bryant, WB Oak Glen, SB 5th to Yucaipa TC. The South Loop will travel<br />
from Yucaipa Transcenter, EB Yucaipa, SB Bryant, WB E Ave., SB California Street., to<br />
Beaver Medical Clinic, EB Avenue H, NB 5th Street. The Yucaipa Circulator will operate<br />
at 30 minute frequency on Weekdays, Saturdays, and Sundays.<br />
Annual Service Statistics<br />
Route Day of Week Service Span Hours Miles Buses<br />
Annual Cost<br />
(FY 06 Dollars)<br />
Yucaipa Weekday 6:00 a.m. – 9:00 p.m. 8,256 92,632 2 $559,344<br />
Circulator Saturday 7:00 a.m. – 9:00 p.m. 1,400 15,708 2 $94,850<br />
Sunday 7:00 a.m. – 7:00 p.m. 1,224 13,733 2 $82,926<br />
Total 10,880.00 122,073.60 2 Peak $737,120<br />
Rationale: The Yucaipa Circulator will offer transportation service to an area of<br />
significantly increasing senior population density along with many shopping centers. The<br />
North loop will serve Stater Brothers, Regional Park, Mobile Homes along 5 th Street,<br />
Oakland, and E Street, and Yucaipa Junior High School. The South loop will serve Beaver<br />
Medical Center, located on California & Avenue H, South of Wildwood Canyon. Both<br />
loops will overlap service on Yucaipa Blvd. and offer timed connections with Routes 8 & 9<br />
at the Yucaipa Transcenter, estimated to be constructed by December <strong>2006</strong>.<br />
Additional Trip Generators: Yucaipa Police, Post Office, City Hall, Library, Chamber of<br />
Commerce, Bank of America, Prime Care Medical, Bryant Professional Building, Vons,<br />
Mousley Museum of Natural History, and Mobile Estates.<br />
<strong>2006</strong>-<strong>2011</strong> SRTP<br />
Appendix E<br />
E-10
Unconstrained Scenario FY <strong>2006</strong><br />
Modified Route 20A (Fontana – Merrill – Highland) & 20B (Fontana – Valley –<br />
Highland)<br />
Description: 20A: From Fontana Metrolink, WB Merrill, NB Cherry, EB Highland,<br />
NB Beech to Park and Ride. 20B: From South Fontana TC, NB Sierra, WB Randall, SB<br />
Citrus, WB Valley, NB Cherry, EB Highland, NB Beech to Park and Ride. Route 20A<br />
schedule will alternate with 20B along Cherry. Route 20 will operate at 30 minute<br />
frequency on Weekdays and Weekends.<br />
Annual Service Statistics<br />
Route Day of Week Service Span Hours Miles Buses<br />
Annual Cost<br />
(FY 06 Dollars)<br />
20A & 20B Weekday 4:30 a.m. – Midnight 20,929 292,572 5 $1,803,239<br />
Saturday 5:30 a.m. – 10:00 p.m. 3,432 48,000 5 $295,701<br />
Sunday 5:30 a.m. – 10:00 p.m. 3,501 48,960 5 $301,615<br />
Total 27,861.60 389,532.00 5 Peak $2,400,555<br />
Rationale: 20A: This proposed alignment will provide north/south service along<br />
Cherry, north of Arrow to Highland to shopping centers on Baseline & Cherry and new<br />
housing in north Fontana. 20B: This proposed alignment will provide east/west service<br />
on Valley and compliment downtown Fontana revitalization on Sierra.<br />
Additional Trip Generators: Cherry Estates Mobile Home Park, Mobile Hacienda<br />
Park, Inland Empire Utilities Agency, and Public Housing.<br />
<strong>2006</strong>-<strong>2011</strong> SRTP<br />
Appendix E<br />
E-11
Unconstrained Scenario FY <strong>2006</strong><br />
Modified Route 22B (ARMC – Summit – Rancho Cucamonga)<br />
Description: The trunk of Route 22 will remain the same: At Cactus @ Bonhert, 22,<br />
continue WB Bonhert, NB Locust, WB Casa Grande, SB Sierra, WB Summit, SB Beech,<br />
WB Highland, SB Cherry, WB Baseline, NB Rochester, EB Victoria Park, SB Victoria<br />
Park, WB Church, SB Milliken to Rancho Cucamonga Metrolink. Route 22 B will<br />
operate at 15 minutes on Weekdays, 20 minutes on Saturdays and 30 minutes on<br />
Sundays.<br />
Annual Service Statistics<br />
Route Day of Week Service Span Hours Miles Buses<br />
Annual Cost<br />
(FY 06 Dollars)<br />
22B Weekday 4:30 a.m. – Midnight 34,613 484,782 7 $2,982,280<br />
Saturday 5:30 a.m. – 10:00 p.m. 5,676 79,500 7 $489,044<br />
Sunday 5:30 am. – 10:00 p.m. 5,790 81,090 7 $498,825<br />
Total 46,078.80 645,372.00 7 Peak $3,970,149<br />
Rationale: The southwestern extension of service will support Summit development<br />
of many residential and commercial sites such as new residential areas in Rialto and<br />
Fontana and Victoria Gardens (NW Foothill Blvd. @ I-15).<br />
Additional Trip Generators: Public Housing, San Antonio Medical Center, Mission<br />
Foods, Rancho Cucamonga Metrolink Station, Amtrak Station, Chaffey College.<br />
<strong>2006</strong>-<strong>2011</strong> SRTP<br />
Appendix E<br />
E-12
Unconstrained Scenario FY <strong>2006</strong><br />
New Route 27 (Fontana – Rancho Cucamonga – Chaffey College)<br />
Description: From Fontana Metrolink, travel WB Arrow, SB Milliken, WB into<br />
Rancho Cucamonga Metrolink, NB Milliken, WB Arrow, NB Haven, continuing to<br />
Chaffey College. Route 27 will operate at 30 minutes on Weekdays, Saturdays, and<br />
Sundays.<br />
Annual Service Statistics<br />
Route Day of Week Service Span Hours Miles Buses<br />
Annual Cost<br />
(FY 06 Dollars)<br />
27 Weekday 4:30 a.m. – Midnight 18,615 260,580 4 $1,603,843<br />
Saturday 5:30 a.m. – 10:00 p.m. 3,053 42,750 4 $263,003<br />
Sunday 5:30 a.m. – 10:00 p.m. 3,114 43,605 4 $268,263<br />
Total 24,780.75 346,935.00 4 Peak $2,135,109<br />
Rationale: This route will connect to the Chaffey College Transcenter and is a south<br />
eastern continuation of route 68 from Chaffey College into the Rancho Cucamonga<br />
Metrolink.<br />
Additional Trip Generators: Rancho Cucamonga City Hall, Superior Court, Oldtimers<br />
Foundation Senior Center, Vocational Improvement Program, YMCA, Senior Assistance<br />
Office, Career Institiute, Chaffey College, Adults Sports Park, Rancho Cucamonga<br />
Metrolink, Mission Foods, Target, and Mervyns.<br />
<strong>2006</strong>-<strong>2011</strong> SRTP<br />
Appendix E<br />
E-13
Unconstrained Scenario FY <strong>2006</strong><br />
Modified Route 30 (Redlands Trolley Red Line)<br />
Description: The University Loop will remain unchanged, while additional westbound<br />
stops are added on the Plaza loop. At Lugonia @ Indiana Court, continue WB Lugonia,<br />
SB Alabama, EB Redlands, returning to Redlands Mall. Service will remain at 60 minute<br />
frequency on Weekdays and Weekends.<br />
Annual Service Statistics<br />
Route Day of Week Service Span Hours Miles Buses<br />
Annual Cost<br />
(FY 06 Dollars)<br />
30 Weekday 4:30 a.m. – 10:00 p.m. 4,979 69,712 1 $429,025<br />
Saturday 5:30 a.m. – 11:00 p.m. 821 6,076 1 $70,737<br />
Sunday 5:30 a.m. – 11:00 p.m. 755 6,531 1 $65,034<br />
Total 6,555.20 82,318.15 1 Peak $564,796<br />
Rationale: The westward stretch of the Red Line will add 2.3 additional miles to the<br />
current route and provide service to Target (east of Alabama & north of Lugonia), Kmart<br />
(Corner of Alabama & Redlands), and ESRI (on Redlands Blvd., west of the mall).<br />
Additional Trip Generators: Texonia Park, Boy Scouts, Tri City Center, Redlands Post<br />
Office, and Redlands Heritage Hall.<br />
Unconstrained Scenario FY <strong>2006</strong><br />
<strong>2006</strong>-<strong>2011</strong> SRTP<br />
Appendix E<br />
E-14
Modified Route 67 (Montclair - Ontario – Fontana)<br />
Description: Route 67 will undergo an alignment extension on the west side of the<br />
route. Specifically, the alignment will continue WB on Baseline and SB Monte Vista to<br />
the Montclair Transcenter. Service frequency is improved from 60 to 30 minutes on<br />
weekdays and will remain at 60 minutes on weekends.<br />
Annual Service Statistics<br />
Route Day of Week Service Span Hours Miles Buses<br />
Annual Cost<br />
(FY 06 Dollars)<br />
67 Weekday 4:30 am. – Midnight 29,783 416,962 6 $2,566,148<br />
Saturday 5:30 a.m. – 10:00 p.m. 2,327 32,571 3 $200,451<br />
Sunday 5:30 a.m. – 10:00 p.m. 2,373 33,222 3 $204,460<br />
Total 34,483 482,679 6 Peak $2,971,060<br />
Rationale: Current service to the Ontario Transcenter will be eliminated and replaced by<br />
the new Route 78. The re-alignment of Route 67 will provide service on Baseline<br />
between Monte Vista and Euclid.<br />
Additional Trip Generators: Montclair Transcenter, Montclair Plaza.<br />
<strong>2006</strong>-<strong>2011</strong> SRTP<br />
Appendix E<br />
E-15
Unconstrained Scenario FY <strong>2006</strong><br />
New Route 74 (Rancho Cucamonga – Riverside – Chino)<br />
Description: From Rancho Cucamonga Metrolink, travel SB Milliken, NW Mission,<br />
SB Archibald, WB Riverside, SB Euclid, WB Edison, and NB into Chino Transcenter.<br />
Route 74 will operate at 30 minutes on Weekdays and 60 minutes on Weekends.<br />
Annual Service Statistics<br />
Route Day of Week Service Span Hours Miles Buses<br />
Annual Cost<br />
(FY 06 Dollars)<br />
74 Weekday 3:00 a.m. – Midnight 27,415 383,904 5 $2,362,083<br />
Saturday 5:30 a.m. – Midnight 2,341 32,800 3 $201,657<br />
Sunday 5:30 a.m. - Midnight 2,387 33,456 3 $205,691<br />
Total 32,143 450,160 5 Peak $2,769,431<br />
Rationale: This route will connect Rancho Cucamonga and residents along Riverside<br />
Avenue to the College Park (on Edison between Euclid and Central).<br />
Additional Trip Generators: Chino Library, City Hall, Superior Court, YMCA, Senior<br />
Center, Nutrition Site, Canyon Ridge Hospital, Chino Health Center, Community<br />
Services, and Rancho Cucamonga Metrolink Station.<br />
<strong>2006</strong>-<strong>2011</strong> SRTP<br />
Appendix E<br />
E-16
Unconstrained Scenario FY <strong>2006</strong><br />
New Route 78 (Ontario – Archibald – North Rancho Cucamonga)<br />
Description: This route will travel beginning on Holt & Vineyard, WB Holt, NB<br />
Corona, EB “D”, SB Vineyard, EB Airport Drive, NB Archibald, WB 19TH, SB Euclid<br />
to Ontario Transcenter. This alignment will serve the “Colonies Crossroads” shopping<br />
center along with new residents and schools. Service frequency will be half-hourly on<br />
weekdays and weekends.<br />
Annual Service Statistics<br />
Route Day of Week Service Span Hours Miles Buses<br />
Annual Cost<br />
(FY 06 Dollars)<br />
78 Weekday 4:30 a.m. - Midnight 14,389 201,240 3 $1,239,727<br />
Saturday 5:30 a.m. – Midnight 2,646 37,000 3 $227,936<br />
Sunday 5:30 a.m. – Midnight 2,698 37,740 3 $232,495<br />
Total 19,732.57 275,980.00 3 Peak $1,700,158<br />
Rationale: This route will cover the North/South Archibald corridor between the<br />
Ontario Airport and 19 th Street providing service to Stater Brothers on Archibald @ 19th<br />
St., Senior Housing on Amethyst, and the Post Office on Amethyst.<br />
Additional Trip Generators: Rancho Cucamonga Public Library, Senior Center,<br />
Community Center, Nutrition Site, Stater Brothers, Training Technologies College,<br />
Ontario International Airport, Guasti Regional Park, and Frito-Lay warehouse, Colony<br />
Shopping Center, Ontario Transcenter.<br />
<strong>2006</strong>-<strong>2011</strong> SRTP<br />
Appendix E<br />
E-17
Unconstrained Scenario FY <strong>2006</strong><br />
New Route 210 (Regional Express)<br />
Description: From Redlands Transcenter, take I-210 to the pick up point in Highland,<br />
WB to Riverside Ave. in Rialto, WB to Park and Ride on Cherry in Fontana, and WB to<br />
Montclair Transcenter. Route 210 will operate at 30 minute frequency on Weekdays and<br />
Weekends.<br />
Annual Service Statistics<br />
Route Day of Week Service Span Hours Miles Buses<br />
Annual Cost<br />
(FY 06 Dollars)<br />
210 Weekday 3:00 a.m. – Midnight 26,711 374,358 5 $1,809,653<br />
Saturday 5:30 a.m. – Midnight 4,561 63,900 5 $308,974<br />
Sunday 5:30 a.m. - Midnight 4,652 65,178 5 $315,153<br />
Total 35,922.95 503,436.00 5 Peak $2,433,780<br />
Rationale: This express route will connect with the Gold Line (to Pasadena and Los<br />
Angeles) Metrolink at Montclair Transcenter and offer service to residential development<br />
areas along the Foothills and the Park and Ride lot on Beech Avenue (direct HOV<br />
access).<br />
Additional Trip Generators: San Bernardino Mulberry Childcare Centers, Redlands<br />
DAAS Adult Services, North Fontana Community Center, Rialto Center for Brief<br />
Therapy, Montclair Sam’s Club, Fontana Lifecraft Group Home, San Bernardino Mobile<br />
Home Park, Fontana Jessie Turner Senior Center, Alta Loma Genesis Manor.<br />
<strong>2006</strong>-<strong>2011</strong> SRTP<br />
Appendix E<br />
E-18
Appendix - F<br />
Performance Indicators
Performance Indicators<br />
What Is <strong>Transit</strong> For?<br />
Like any transit plan, this <strong>Short</strong> <strong>Range</strong> <strong>Transit</strong> <strong>Plan</strong> reflects the<br />
need to balance the competing goals of transit. The most<br />
difficult of these tradeoffs is between Productivity (maximum<br />
ridership per unit of cost) and Coverage (access for all parts<br />
of the community).<br />
A 100% Productivity-oriented system (that is, one designed<br />
solely for maximum ridership per hour of service) would<br />
abandon most service to large parts of the present service<br />
area. It would offer very intensive local service to the densest<br />
and most transit-dependent parts of the area, which are<br />
mostly in San Bernardino, Colton, Fontana and parts of<br />
Chino and Montclair.<br />
A 100% Coverage-oriented system, on the other hand,<br />
would spread service evenly to every part of the service area,<br />
including remote, low-density areas such as Devore or the<br />
affluent upper foothills that are unserved today. To do this, a<br />
“100% Coverage” system would cut frequencies on the<br />
busiest corridors such as Foothill, Highland, Holt, San<br />
Bernardino and Baseline, resulting in a dramatic drop in<br />
ridership and severe overcrowding.<br />
There is no technical answer to the question of how to<br />
balance these two goals. The balance is a pure value<br />
judgment. For this reason, the Board was briefed on this<br />
issue early in FY 2002, and asked to give preliminary<br />
direction about whether <strong>Omnitrans</strong> should shift the balance<br />
one way or the other.<br />
The Board’s direction is to shift this balance to about 65%<br />
Productivity, 35% Coverage. However, the board specified<br />
that this change should occur gradually as resources<br />
increase; therefore, it will not be necessary to cut existing<br />
Coverage-oriented services – though some effort can be<br />
made to optimize the efficiency of these services. The<br />
existing system devotes roughly 55% of its resources to<br />
Productivity and 45% to Coverage.<br />
F-1
Performance Indicators<br />
There are a variety of performance indicators that can be<br />
used to evaluate and implement new services and changes<br />
to existing services. Choosing a variety of indicators to<br />
monitor service can help determine if the service is providing<br />
some sort of useful purpose, or if it is failing in multiple areas,<br />
and why.<br />
In order to demonstrate to the public the effectiveness of the<br />
services <strong>Omnitrans</strong> provides, it is important to only establish<br />
a few key and illustrative indicators to paint a clear picture.<br />
However, this does not limit the number of indicators that<br />
the Agency can establish behind the scenes to further<br />
analyze the system and its resources.<br />
For this reason, four key indicators have been established to<br />
report on a regular basis:<br />
Net Ridership Changes, Month-to-Month<br />
Passengers per Hour<br />
Fare Recovery<br />
On-Time Performance<br />
These indicators are common throughout the transit industry<br />
and are easy to explain and interpret for general public use.<br />
There are many other indicators that can be established to<br />
monitor service internally, and that provide more insight into<br />
why a route/service is performing a certain way. These will<br />
be dealt with later in this chapter.<br />
Overview and Background<br />
Performance indicators are an important test in evaluating<br />
the efficiency and effectiveness of service. They provide a<br />
level of accountability in the services that are provided, and if<br />
an indicator is noticeably different than the norm, or has<br />
changed significantly, it is a sign that service/administration<br />
needs to be evaluated and adjusted. This could mean<br />
adding additional service to meet new transit needs, or<br />
eliminating/adjusting service to utilize resources in a more<br />
efficient manner, and to meet the productivity/coverage<br />
goal of the Agency. It can also mean that administrative<br />
Appendix F<br />
Performance Indicators<br />
F-2
esources need to be evaluated to determine if they are<br />
being provided in the best way possible.<br />
Service design guidelines, or performance measurement<br />
guidelines, provide an objective rationale for the allocation<br />
of transit resources. Service design guidelines provide the<br />
tools for making decisions on the provision of transit services,<br />
the design of routes and schedules, and the evaluation of<br />
services. Service design guidelines serve five major functions:<br />
Service Development<br />
The guidelines form a consistent basis for service planning,<br />
and, in particular, for establishing minimum levels of service.<br />
Judgment and flexibility remain, but the guidelines assist in<br />
the development of new services and the refinement of<br />
existing services.<br />
Evaluation<br />
Service design guidelines provide targets in the form of<br />
indicators and standards that enable the performance of the<br />
individual routes to be evaluated and monitored by<br />
management decision-makers.<br />
Budgeting<br />
The preparation of annual budgets should reflect the goal of<br />
providing service to the policy levels established in the<br />
service design guidelines. This should enable the Board of<br />
Directors to focus on the policy level decisions and the<br />
service impacts of budget adjustments.<br />
Public Accountability<br />
Political decision-makers, transit customers, voters and<br />
taxpayers should be able to readily identify the minimum<br />
levels of service and performance that are to be provided.<br />
The allocation of the resources of the transit system must be<br />
seen to be based on equitable and rational criteria that are<br />
explicit and available for public scrutiny.<br />
Title VI<br />
Title VI of the Civil Rights Act requires public transit agencies<br />
receiving federal funding to ensure that that service is<br />
provided without regard to race or the economic status of<br />
the residents. Application of service design guidelines<br />
provides a tool for design and evaluating service that does<br />
not discriminate on race or economic status.<br />
F-3
The service design guidelines are intended to be flexible in<br />
interpretation and application and to be continuously<br />
refined. As new types of services or data sources are<br />
introduced, revisions to the guidelines may become<br />
appropriate. Flexibility in application and interpretation must<br />
be maintained, as the environment in which these guidelines<br />
will be applied is not static and will continue to change as<br />
the region grows and transportation demand increases.<br />
The guidelines have been designed to enable <strong>Omnitrans</strong> to<br />
establish targets consistent with actual financial resources.<br />
As resources improve the targets could be enhanced, or if<br />
resources grow more limited the targets could be relaxed.<br />
The guidelines will be applied to identify transit services that<br />
should be improved or added, or may be falling below<br />
acceptable performance levels. If a service fails to meet the<br />
identified performance level further investigations and<br />
analysis will be undertaken to confirm whether the<br />
guidelines are being achieved, and a broad range of<br />
potential corrective actions may be considered. The action<br />
taken, if any, will need to be appropriate given the specific<br />
circumstances of the service in question.<br />
Redlands Trolley<br />
The Service Design Guidelines developed in this report are<br />
intended to be applied to all transit services in the region<br />
except Access. The types include:<br />
Bus – Local services provided with standard accessible buses<br />
serving the region’s more dense residential or employment<br />
areas.<br />
Omnilink – Minibuses on flexible routes where the capacity<br />
provided by standard buses is not required.<br />
Bus Rapid <strong>Transit</strong> – A limited stop service using upgraded<br />
facilities and a superior level of service.<br />
Express Service - Express services operated with suburban<br />
highway coaches on higher-speed roadways linking civic<br />
centers and main transportation nodes.<br />
Appendix F<br />
Performance Indicators<br />
F-4
Key Reporting Indicators<br />
There are four reporting indicators that will be used to<br />
demonstrate the efficiency of the services. The reporting<br />
indicators provide an overall picture of the Agency and the<br />
services that are provided.<br />
Net Ridership Increase, Month-to-Month<br />
Net ridership is a standard measure to determine how the service<br />
is performing on the street. It is also an indicator of how the<br />
economy is doing. Typically, if ridership numbers are flat or are<br />
declining, it is an indication that the overall economy in the region<br />
is doing good; people have the opportunity to purchase cars and<br />
give up riding transit.<br />
Ridership changes are measured based on the increase/decrease<br />
over the same month in the previous year. An increase of 2%<br />
each year is desirable.<br />
Passengers per Revenue Hour (Boardings per Hour)<br />
Passengers per revenue hour is an industry-wide standard<br />
used to determine whether a route is carrying enough<br />
passengers to justify itself; deficient performance triggers a<br />
study process which may lead to remedial actions including<br />
enhanced marketing, redesign, or elimination of service. For<br />
a system of predominantly local services such as <strong>Omnitrans</strong>,<br />
the passengers per hour measurement approach is broadly<br />
acceptable as a basis for comparison. Agencies that invest<br />
heavily in long-distance express services have much more<br />
difficulty measuring service performance. “Boardings” are<br />
problematic because passengers may use the service for very<br />
long distances or very short ones. Obviously a route<br />
designed to carry passengers long distances will have fewer<br />
boardings per hour, because its passengers take longer to<br />
serve.<br />
Most systems recognize that boardings per hour may vary<br />
dramatically depending on the type of route. An urban<br />
cross-town route, such as the service on 5th Street or<br />
Foothill, could have a very high number of boardings per<br />
hour, but never reach full capacity due to the frequent<br />
turnover of customers. On the other hand, a route such as<br />
Route 90, freeway express service, could be completely full<br />
but have a relatively low number of boardings per hour due<br />
to the length of the express portion of the route. In order to<br />
mitigate for this inequity, most systems establish categories<br />
F-5
of bus routes such as peak express, express, cross-town,<br />
mainline, local, or feeder. Specific boardings per hour targets<br />
are established for each route classification.<br />
Considered at the system level, the measure is governed<br />
largely by the mix of services provided, which is a reflection<br />
of local demographics, priorities, and values. However, if<br />
service is divided into some simple categories, meaningful<br />
targets can be established for boardings per revenue hour.<br />
The minimum number of boardings per hour should be 20<br />
passengers per revenue hour for all fixed routes.<br />
Phased Implementation<br />
A phase-in period of 24 months should be allowed to for a<br />
service to reach the recommended service design<br />
performance targets. Within 12 months a service should<br />
reach at least 50% of the recommended targets for<br />
productivity (net ridership or boardings per hour). If a route<br />
does not meet either of these two targets it should be given<br />
the same consideration as any service that fails to meet the<br />
service evaluation criteria. By 18 months it should reach 75%<br />
of the standards, and by 24 months 100% of the targets<br />
should be attained.<br />
Fare Recovery<br />
Financial performance measures that involve revenue are<br />
difficult to evaluate at the route level due to the challenge of<br />
allocating revenue per passenger. Transfers and passes<br />
make it difficult to accurately attribute revenue to a specific<br />
passenger.<br />
Costs can be measured more accurately, and cost per<br />
passenger provides a more complete picture of the cost of<br />
operating a particular service than simply boarding<br />
passengers per hour. However the two indicators provide<br />
similar information.<br />
On a system wide basis cost recovery can be measured as<br />
the percentage of costs covered by fares paid. California<br />
requires that systems meet a system wide target of 20% cost<br />
recovery for fixed routes and 10% for paratransit services.<br />
Fare policy is complex issue. One indicator that can be used<br />
to determine the appropriateness of the fare policy is the<br />
Appendix F<br />
Performance Indicators<br />
F-6
elationship between average revenue per passenger and<br />
the adult cash fare. Excessive discounting of fares and<br />
reduce revenue without stimulating new ridership. This<br />
indicator can be calculated easily and comparable figures<br />
should be available from peer systems or nationally for<br />
similarly sized properties.<br />
On-Time Performance<br />
Service reliability is an important issue for <strong>Omnitrans</strong><br />
customers. Existing and potential customers expect bus<br />
services to reliably follow the published timetables. People<br />
depend on transit to allow them to meet their personal<br />
schedules and expect transfer connections to be performed<br />
as published.<br />
Schedule reliability standards are also important for transit<br />
management, as they provide a means of measuring and<br />
evaluating the provision of the service on the road. Failure<br />
to meet the guidelines serves as notice to management that<br />
corrective actions such as additional transit priority measures,<br />
revised schedules or work practices, or rerouting of services<br />
should be implemented.<br />
Reliability guidelines must balance the need to assure<br />
customers that timetables may be adhered to with the need<br />
to allow for operating flexibility due to traffic conditions and<br />
differences in transit vehicles (i.e. wheelchair lift or low floor<br />
buses) that could be assigned to the same route. During<br />
extreme weather conditions, power outages, road<br />
construction, or other abnormal traffic situations, it may be<br />
expected that delays and schedule disruptions occur.<br />
The objective must stress the importance of reliability, but<br />
also recognize that there are many factors outside the<br />
control of the transit operators and transit management,<br />
which may impact reliability:<br />
To provide Bus, Express Bus, and Omnilink services that<br />
reliably follow published schedules under normal operating<br />
conditions.<br />
The indicators for reliability used by the transit industry<br />
generally relate to schedule adherence, headway<br />
adherence, service consistency, transfer reliability, and<br />
missed trips.<br />
F-7
It is recommended that a single schedule adherence<br />
guideline be applied for bus services at all times of the day.<br />
Some arguments can be made for a stricter guideline during<br />
off peak periods to encourage ridership, compensate for the<br />
additional transfers that may be necessary and because of<br />
reduced roadway congestion. However, the impact of a<br />
stricter off peak standard would likely be imperceptible to<br />
customers.<br />
In any case, the transit system should be striving for 100<br />
percent schedule adherence at all times.<br />
The recommended indicators are:<br />
90 percent of bus trips on each route should depart<br />
each timepoint not more than five minutes later than<br />
the scheduled leave time, and should not depart early<br />
<br />
90 percent of bus trips should arrive at the terminus<br />
not more than five minutes late.<br />
Where the schedule adherence of a route as measured by<br />
the above indicators falls below the guideline, more detailed<br />
investigations of the route should be carried out to identify<br />
the sources of the problem. There is a broad range of<br />
potential actions that can be taken to improve service<br />
reliability and the most effective response may depend on<br />
the specific situation. In some cases, municipal actions such<br />
as provision of transit priority measures on municipal roads<br />
used by transit would significantly contribute to improved<br />
service reliability.<br />
Internal Performance<br />
Measures<br />
While the Agency will be reporting the four key indicators to<br />
the Board of Directors on a regular basis, there are a number<br />
of other indicators that will be used behind the scenes to<br />
monitor service. Below are the general objectives and the<br />
specific performance measures that will be used.<br />
Appendix F<br />
Performance Indicators<br />
F-8
Operational Objective<br />
Service Productivity<br />
Service productivity can be measured using two tools:<br />
passengers per hour, which is described in detail in the Key<br />
Reporting Indicators, and seat utilization.<br />
Seat Utilization<br />
Seat utilization is a measurement of how much of the service<br />
being provided (seat miles) is being consumed (passenger<br />
miles). It is expressed as a percentage (passenger miles/seat<br />
miles).<br />
In the passenger airline industry the key measures of route<br />
performance are load factor, yield, cost, and profit. Load<br />
factor, or utilization, is based on the number of customer<br />
miles (demand) compared to the number of seat miles<br />
available (or capacity). Yield is the average customer fare for<br />
the flight divided by the distance flown. The load factor rate<br />
is used to evaluate the volume, while the yield is used to<br />
evaluate the revenue. The yield is compared to the actual<br />
seat-mile cost of operation to determine profitability. One of<br />
the advantages of the use of load factor is that it provides a<br />
performance evaluation that is independent of the aircraft<br />
(or vehicle) size or route type. A low load factor percentage<br />
would be an indication to change to a smaller aircraft or to<br />
less frequent service, while a high load factor might be used<br />
to justify a larger aircraft or more frequent service. Low<br />
yields would suggest a need to raise fares. In other words<br />
revenues and costs are looked at independently of<br />
passengers and utilization.<br />
Load factor, or utilization, for transit services is more complex<br />
to calculate due to the large number of stops and the<br />
multitude of vehicles on each route, but the advantages are<br />
the same. The concept of measuring utilization is to<br />
determine what “percentage” of the capacity being offered<br />
on each route is indeed being consumed. A low utilization<br />
would be an indication that service should be less frequent,<br />
or a smaller vehicle utilized. Low utilization on one section of<br />
a route would be an indication that some vehicles could be<br />
short-turned so that service would be less frequent on that<br />
section. A high utilization rate would indicate that more<br />
frequent service or larger vehicles might be appropriate.<br />
F-9
Distance-based utilization based on the distance that<br />
passengers travel, by itself, does not assess the efficiency of<br />
the schedule. Costs are incurred even if a bus is at a layover<br />
point; therefore an additional indicator of time-based<br />
utilization captures performance related to service hours and<br />
demonstrates the efficiency of a schedule.<br />
Figure F-1 Proposed Minimum Average Distance Based<br />
Utilization Standards for Bus Services<br />
Service Type<br />
Overall<br />
Customer<br />
mile/Seat<br />
mile<br />
Standard<br />
Weekday<br />
Customer<br />
mile/Seat<br />
mile<br />
Standard<br />
Saturday<br />
Customer<br />
mile/Seat<br />
mile<br />
Standard<br />
Sunday<br />
Customer<br />
mile/Seat<br />
mile<br />
Standard<br />
Express 22% 25% 15% 15%<br />
Bus 18% 20% 10% 10%<br />
The standards are pegged initially at approximately the 25th<br />
percentile for each type, in each time period. This means<br />
that about 25 percent of the services would be subject to<br />
review each year. An examination of the productivity of the<br />
Omnilink service as well as some of the lowest performing<br />
bus routes was used to develop the targets for Omnilink.<br />
Where large bus services were included, the productivity<br />
was prorated to reflect a 20-passenger bus rather than a<br />
standard 38-passenger vehicle.<br />
The standards for each type of service would ultimately be<br />
adjusted to ensure that the overall transit operation was able<br />
to meet its system-wide cost recovery objectives.<br />
The intent is that the standards would be applied as an<br />
average for all trips. The targets for specific time periods or<br />
on route segments would be examined where a route failed<br />
to meet the overall guideline.<br />
Seat utilization based on distance (passenger miles per seat<br />
miles), retrieved from Automatic Passenger Counter (APC)<br />
data for the first quarter of 2004 is summarized in the<br />
Existing Conditions. The routes with utilization of less than<br />
20 percent are in the bottom quartile and are candidates for<br />
review and adjustment.<br />
Appendix F<br />
Performance Indicators<br />
F-10
Maximum Occupancy Objective<br />
The Maximum Occupancy Objective balances the fiscal need<br />
of <strong>Omnitrans</strong> to generate fare revenue with the need to<br />
provide a safe, comfortable and attractive customer<br />
environment on-board transit vehicles. The proposed<br />
occupancy objective is:<br />
To provide transit services with adequate capacity<br />
to provide a reasonable level of passenger comfort<br />
recognizing the vehicle types, trip lengths, speeds<br />
and markets being served.<br />
The purpose of the objective is to provide a means of<br />
ensuring that an appropriate level of service is provided for<br />
the level of ridership on each individual route. The objective<br />
should also ensure that overcrowding is not permitted to<br />
occur on a sustained or regular basis. Crowded conditions<br />
can quickly turn existing and potential customers away from<br />
public transportation. The guidelines for this indicator must<br />
be set at levels that provide comfortable traveling conditions<br />
appropriate for the brand of service and the market being<br />
served. The indicators and standards will be used to adjust<br />
service frequencies or vehicle size.<br />
Separate indicators are required for each type of bus service,<br />
reflecting their different operating speeds, trip lengths and<br />
markets served. Separate indicators and standards are<br />
required for peak periods, a shorter peak within the peak<br />
period, midday evening, night, and weekend periods.<br />
The recommended indicators are:<br />
90 percent of the time the number of standees at the<br />
maximum occupancy point should not exceed person<br />
density (in passengers per square feet) according to<br />
the following chart.<br />
Figure F-2: Minimum Square Feet of Floor Space<br />
per Standing Passenger<br />
Type of Peak Period<br />
Service 30 Minute<br />
Off Peak<br />
60 Minute<br />
Avg.<br />
Average<br />
Bus 6 12<br />
Omnilink No standees No standees<br />
Express Bus No standees No standees<br />
F-11
Under normal operating conditions no customer<br />
should remain standing more than 15 minutes on one<br />
bus.<br />
Figure F--3 shows the estimated number of seats and floor<br />
area available for each type of bus currently in the transit<br />
fleet. The data in Figure F-4 also shows the maximum<br />
occupancy standard in passengers for each of the different<br />
types of buses in the fleet.<br />
The APCs cannot definitively determine the average standing<br />
time, however, on most routes they can identify potential<br />
standing time problems by using route profiles.<br />
Bus Type<br />
Figure F–3: Seats and Standing Areas by Bus Type<br />
40’ Low Floor<br />
Flyer*<br />
40’ High Floor<br />
RTS/Orion*<br />
40’ Suburban High<br />
Floor*<br />
30’ Low Floor Mid<br />
Size*<br />
*Estimate<br />
Seats<br />
Areas for<br />
Standing<br />
in Sq. ft<br />
Seating<br />
with One<br />
Wheelchair<br />
Seating<br />
with Two<br />
Wheelchairs<br />
38 57.9 35 31<br />
40 55.9 36 32<br />
45 53.9 42 39<br />
25 37.9 22 18<br />
On some routes conformity with the standing time guideline<br />
could also be evaluated using a point observation system.<br />
This would be done by stationing observers prior to the<br />
maximum load point, and again 15 minutes downstream.<br />
An observation of people still standing downstream would<br />
be an indication of a standee time problem or at least a<br />
candidate for further, more detailed analysis. On services<br />
with guidelines that do not permit standees, it would be<br />
possible to evaluate the service using APC data. The key to<br />
the use of the standard is to identify potential problem<br />
routes and services. This will limit the requirement for more<br />
detailed examination of specific conditions on every route.<br />
The public will also easily understand the guideline.<br />
Appendix F<br />
Performance Indicators<br />
F-12
Figure F-4: Maximum Passenger Occupancy by Bus Type,<br />
Time Period and Number of Wheelchairs<br />
Bus Type<br />
40’ Low<br />
Floor Flyer<br />
40’ High<br />
Floor<br />
RTS/Flexible<br />
40’<br />
Suburban<br />
High Floor<br />
30’ Low<br />
Floor<br />
Peak 30<br />
Minute<br />
Average<br />
Off Peak<br />
60<br />
Minute<br />
Average<br />
Peak 30<br />
Minute<br />
Average<br />
Off Peak<br />
60<br />
Minute<br />
Average<br />
Peak 30<br />
Minute<br />
Average<br />
Off Peak<br />
60<br />
Minute<br />
Average<br />
No Wheelchairs 1 Wheelchair 2 Wheelchairs<br />
48 43 45 40 41 36<br />
49 45 45 41 41 37<br />
45 45 42 42 39 39<br />
31 28 27 25 23 20<br />
Fare & Financial Objective<br />
Costs:<br />
Fares:<br />
Cost per passenger by route and system.<br />
Target to be determined.<br />
Target system wide (ACCESS): 10%<br />
Percentage that average fare represents<br />
of adult cash fare. Target: to be<br />
determined.<br />
Scheduling Objectives<br />
Layover Time:<br />
Makeup Time:<br />
Standby Time:<br />
Layover as a percentage of total revenue<br />
hours. Target: to be determined.<br />
Makeup time paid as a percentage of<br />
total paid revenue hours. Target<br />
to be determined.<br />
Standby time that is scheduled needs to<br />
be compared to total scheduled<br />
operator hours and actual<br />
operator hours. In this way, a<br />
comparison can be done to see if<br />
the standby time is being<br />
scheduled efficiently and is not in<br />
excess of the overtime that<br />
occurs.<br />
F-13
Service Reliability Objective<br />
Total Trips Completed<br />
Target percentage of scheduled<br />
trips completed not to be less<br />
than 99%, including not more<br />
than:<br />
0.5% trips missed for mechanical<br />
reasons<br />
0.5% trips missed due to a<br />
shortage of operators.<br />
0.01% trips missed due to<br />
weather.<br />
0.01% trips missed due to<br />
accidents<br />
0.01% trips missed due to other<br />
factors.<br />
Competitiveness Objective<br />
Service Speed<br />
The average actual running time on<br />
each route should be maintained or<br />
improved as measured on a yearly basis.<br />
ACCESS<br />
Service<br />
Average number of boardings per hour.<br />
Target: 3.<br />
No Shows Number of no shows per 1,000<br />
completed trips.<br />
Denials<br />
Number of denials per 1,000 completed<br />
Cost Recovery<br />
trips.<br />
Percentage of costs recovered from<br />
farebox: Target 10%.<br />
Coverage Percentage of hours of ACCESS<br />
operated outside ¾ of a mile of an<br />
operating <strong>Omnitrans</strong> fixed route service.<br />
<strong>Plan</strong>ning Objectives<br />
Service Coverage & Minimum Service Quality<br />
All areas having a minimum residential density of 3.5<br />
dwelling units per acre or a minimum employment<br />
density of 10 jobs per acre, as measured over an area<br />
Appendix F<br />
Performance Indicators<br />
F-14
of 25 acres, should be provided with a transit service<br />
that places 90 percent of residences and jobs within .5<br />
miles of a bus stop. Reduced walking distances may<br />
be encouraged in situations where steep grades or<br />
safety hazards create an unacceptable pedestrian<br />
access route. A request-stop service should be in<br />
effect for alighting customers on all bus services (in<br />
local stop areas) services after 8:00 p.m. and before<br />
5:00 a.m.<br />
<br />
<br />
<br />
Bus stops should be located to minimize walking<br />
distances, but stops should not be spaced closer than<br />
0.2 miles, unless required for pedestrian safety or as a<br />
result of geographic barriers.<br />
An area shall be considered served by transit if it is<br />
located within 0.5 miles of a fixed-route bus stop or<br />
within area served by Omnilink. The 0.5-mile distance<br />
should be measured using public roads, sidewalks<br />
and walkways.<br />
On weekdays, the minimum service frequency to<br />
provide coverage should be 60 minutes from the start<br />
of service in the morning to the end of service in the<br />
evening. Special peak-period-only tripper services and<br />
introductory pilot services may be excluded from this<br />
guideline.<br />
The span of service for transit should ensure that 90<br />
percent of trips identified in the following table could<br />
be completed at the times shown. Service should be<br />
provided to major activity centers to correspond to<br />
customary opening and closing times at each<br />
location.<br />
F-15
Figure F-5<br />
Span of Service Guidelines<br />
Earliest Arrival Time<br />
Service Weekdays Saturdays Sundays &<br />
Holidays<br />
From any point in East<br />
Valley TO Downtown<br />
06:00 07:00 07:00<br />
San Bernardino<br />
From any point in West<br />
Valley TO Ontario or<br />
Montclair<br />
06:00 07:00 07:00<br />
Latest Departure Time<br />
Service Weekdays Saturdays Sundays &<br />
Holidays<br />
From downtown San<br />
Bernardino TO any point<br />
in East Valley<br />
From Montclair or<br />
Ontario TO any point in<br />
West Valley<br />
21:00 21:00 19:00<br />
21:00 21:00 19:00<br />
Customer Service Objectives<br />
Public Information<br />
Time to Answer<br />
Lost Calls<br />
Average time on hold for all calls.<br />
Target to be determined<br />
Number of lost calls as percentage of<br />
completed calls. Target to be<br />
determined<br />
Maintenance Objectives<br />
Productivity<br />
Spare Ratio: Number of spares as a<br />
percentage of total fleet. Target<br />
to be determined.<br />
Road Calls Average number of miles<br />
between road call. Target to be<br />
determined.<br />
Number of Mechanics Average number of mechanics<br />
per 1,000 revenue miles. Target<br />
to be determined.<br />
Appendix F<br />
Performance Indicators<br />
F-16
Maintenance Cost<br />
Average maintenance cost per<br />
revenue mile. Target to be<br />
determined.<br />
Miles per Gallon Average number of miles<br />
operated per gallon of fuel used.<br />
Manning vs. Equipment<br />
Total manning available verses<br />
the equipment that is provided to<br />
do the job.<br />
Administrative/Management<br />
Objectives<br />
Efficiency<br />
Staffing Number of administrative and<br />
management staff per 1,000 revenue<br />
miles. Target to be determined.<br />
Number of administrative staff and<br />
management as percentage of<br />
operating staff. Target to be<br />
determined.<br />
Getting There<br />
Figure F-6 illustrates a flow diagram that illustrates the<br />
overall process to finalize the management information<br />
system, evaluate performance, develop an action plan.<br />
Figure F-7 illustrates the detailed process that might be<br />
involved to assess the productivity of fixed route services.<br />
F-17
Figure F-6<br />
Administration<br />
Management<br />
Services Operations Access<br />
Fare &<br />
Financial<br />
Maintenance<br />
Establish Performance<br />
Indicators for Key Functions<br />
Establish Targets for<br />
Each Indicator based<br />
on Peers, National Norms<br />
or <strong>Omnitrans</strong> Practice<br />
Evaluate Current<br />
Services/Functions<br />
Using Indicators &<br />
Targets<br />
Develop Action <strong>Plan</strong>s<br />
to Bring Functions into<br />
Line with Targets.<br />
Implement Changes to<br />
Services & Functions<br />
Administration<br />
Management<br />
Services Operations Access<br />
Fare &<br />
Financial<br />
Maintenance<br />
Appendix F<br />
Performance Indicators<br />
F-18
Figure F-7<br />
Segregate routes operating for<br />
12, 18, or 24 months & longer<br />
12 Month routes<br />
Routes operating<br />
24 months or longer<br />
Evaluate Utilization and Productivity by Route for Entire Day<br />
Identify Routes that fail<br />
to reach 50% of guidelines<br />
over entire day<br />
Identify Routes that fail<br />
to reach 70% of guidelines<br />
over entire day<br />
Identify Routes that fail<br />
to reach 100% of guidelines<br />
over entire day<br />
Pass Fail Pass Fail Fail Pass<br />
Identify time period<br />
that fails to meet guidelines<br />
Examine ridership and<br />
route operation to<br />
determine if actions can<br />
be taken to increase ridership<br />
Yes<br />
None Possible<br />
Develop plan to make service<br />
changes to improve ridership<br />
Develop plan to reduce or<br />
eliminate service<br />
Monitor impact of service<br />
changes on ridership<br />
F-19
New Service Warrants<br />
Service warrants are required to provide direction on when<br />
new services should be initiated. <strong>Omnitrans</strong> serves a diverse<br />
region and some flexibility may be required in adapting the<br />
proposed warrants to every possible situation. The warrants<br />
should be viewed as guidelines, rather than strict rules.<br />
Fixed Route Bus<br />
Fixed-route bus services are operated using standard transit<br />
buses or trolleys of at least 30 feet in length. This service is<br />
usually associated with routes that make frequent stops, but<br />
can also include limited stop services on radial and crosstown<br />
routes.<br />
Warrants are required to determine when bus service should<br />
be introduced in new residential, industrial, commercial and<br />
recreational developments. Changes to existing bus routes<br />
would be based on the service evaluation criteria included as<br />
part of the Service Design Guidelines.<br />
There are two main approaches to new service warrants<br />
commonly in use in North America. The first requires a<br />
projection or forecast of ridership. The forecast is either used<br />
directly to determine the timing of a new service or through<br />
surrogates such as riders per hour or cost recovery that are<br />
derived from the ridership forecast. Ridership forecasting on<br />
a micro-level can be extremely difficult and unreliable.<br />
An alternative approach would be to use trip generation as<br />
an evaluation factor. Trip generations are projected using<br />
generally accepted standards and are available for all types<br />
of land use, including residential, commercial, recreational<br />
and industrial areas. There are trip generation tables that<br />
have been produced by both national and state authorities.<br />
The tables have generally been developed as a result of<br />
many years of data collection and verification. Trip<br />
generation data is usually expressed in car trips, however<br />
total person-trips can be developed by making some<br />
occupancy assumptions. Trip generations are a form of<br />
forecast based on a broad knowledge base derived from<br />
observed behavior.<br />
The recommended warrant for new local bus services are<br />
based, in part, on the trip generation methodology. This<br />
Appendix F<br />
Performance Indicators<br />
F-20
methodology has the advantage of using data that has<br />
already been prepared for and accepted by the municipal<br />
authorities, is available for all land uses, and incorporates<br />
elements of both population and forecasting approaches.<br />
In addition to the forecast trip generation volume for the<br />
development, it is recommended that several other factors<br />
related to the physical design of the development be<br />
considered as part of the service warrants. For local bus<br />
services to operate efficiently and safely in a neighborhood,<br />
the road system must meet minimum geometric design<br />
requirements for bus operations and provide a relatively<br />
direct routing for the service. Where the bus route is to<br />
terminate within the development, adequate bus terminus<br />
facilities (e.g. street space or a bus loop for vehicle layovers)<br />
must be available. Finally, adequate pedestrian facilities (e.g.<br />
sidewalks and direct pedestrian routes to bus stops) and<br />
amenities at bus stops (e.g. shelters and lighting) are<br />
required to ensure fast and safe access by customers to the<br />
bus service.<br />
New services to be provided to areas beyond 0.5 miles of an<br />
existing bus stop when all of the following conditions are<br />
met:<br />
Minimum density of 3.5 households per acres or 10<br />
jobs per acre as measured over a minimum area of 25<br />
acres.<br />
Road and pedestrian access system that provides for<br />
safe Access and efficient operation of transit service.<br />
Minimum of 1,000 total person trips generated for all<br />
vehicle modes per service hour as measured from end<br />
to end of proposed bus route.<br />
Trip generation to be based on standard trip<br />
generation methodology and procedures in common<br />
use in Southern California.<br />
Service maybe extended to additional time periods if<br />
the route is able to sustain ridership that is 75 percent<br />
of the minimum productivity standard during the first<br />
year of service.<br />
The service must meet the full productivity guideline within<br />
2-3 years of the start of service. If, after 2-3 years, the service<br />
is unable to meet the productivity standard, alternative<br />
approaches such as an Omnilink service maybe considered.<br />
F-21
If the service being provided is changed significantly, the<br />
probationary period may be extended.<br />
<strong>Omnitrans</strong> may also consider the impact on potential<br />
ridership of other factors such as parking management or<br />
travel demand management strategies that may be in effect.<br />
Express Bus<br />
Express Bus describes services operated on highways<br />
between municipal centers (e.g. Route 90 from Montclair-San<br />
Bernardino-Riverside). The services utilize suburban style<br />
coaches.<br />
Express Bus service may be warranted when all of the<br />
following conditions are met:<br />
Express Bus service should be considered if the travel<br />
time between municipal centers by local bus services<br />
is more than 30 minutes.<br />
<br />
Express Bus services should incorporate a minimum of<br />
15 minutes of non-stop or limited stop service.<br />
Similar to fixed-route and Omnilink services, New Express Bus<br />
services should meet the minimum productivity guidelines<br />
within 2-3 years of implementation.<br />
Omnilink<br />
Omnilink is the name applied to services operated with<br />
vehicles smaller than the conventional 30-foot long transit<br />
bus. This could include a range of options from mini-buses<br />
to shared-ride vans. These services would be implemented<br />
in areas where conventional buses are too expensive and<br />
inefficient to operate. Omnilink service should transport at<br />
least 3 boarding passengers per hour.<br />
New Omnilink service may be warranted in areas beyond 0.5<br />
miles of an existing bus stop when the following conditions<br />
are met:<br />
Minimum density of 3.5 households per acre or 10<br />
jobs per acre measured over a minimum area of 25<br />
acres.<br />
<br />
Road and pedestrian system that provides for safe<br />
access and efficient operation of Omnilink service.<br />
Appendix F<br />
Performance Indicators<br />
F-22
Projection be based on data provided in traffic impact<br />
studies prepared by or for municipalities for<br />
subdivision or development approval.<br />
Service may be extended to additional time periods if<br />
the route is able to sustain ridership of at least 3<br />
passengers per hour.<br />
Like the fixed-route services, the service must meet the full<br />
productivity guideline within 2-3 years of the start of service.<br />
If after this time frame the service appears unlikely to meet<br />
the productivity standard, alternative approaches should be<br />
considered. If the service type is changed, the probationary<br />
period may be extended.<br />
F-23