Disorder-Enhanced Imaging with Spatially Controlled Light
Disorder-Enhanced Imaging with Spatially Controlled Light
Disorder-Enhanced Imaging with Spatially Controlled Light

You also want an ePaper? Increase the reach of your titles
YUMPU automatically turns print PDFs into web optimized ePapers that Google loves.
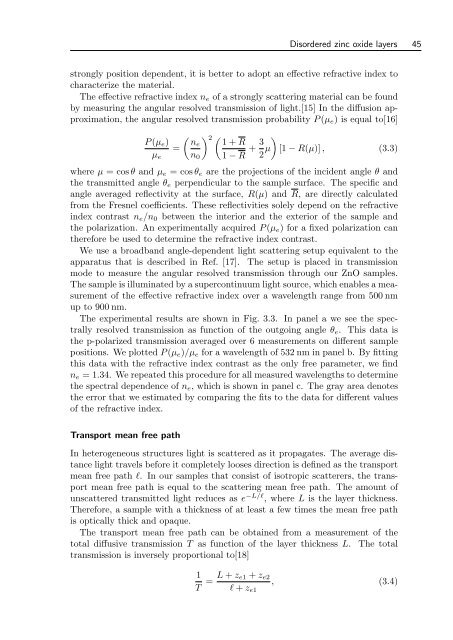
<strong>Disorder</strong>ed zinc oxide layers 45<br />
strongly position dependent, it is better to adopt an effective refractive index to<br />
characterize the material.<br />
The effective refractive index n e of a strongly scattering material can be found<br />
by measuring the angular resolved transmission of light.[15] In the diffusion approximation,<br />
the angular resolved transmission probability P (µ e ) is equal to[16]<br />
( ) 2 (<br />
P (µ e ) ne 1 + R<br />
=<br />
µ e n 0 1 − R + 3 )<br />
2 µ [1 − R(µ)] , (3.3)<br />
where µ = cos θ and µ e = cos θ e are the projections of the incident angle θ and<br />
the transmitted angle θ e perpendicular to the sample surface. The specific and<br />
angle averaged reflectivity at the surface, R(µ) and R, are directly calculated<br />
from the Fresnel coefficients. These reflectivities solely depend on the refractive<br />
index contrast n e /n 0 between the interior and the exterior of the sample and<br />
the polarization. An experimentally acquired P (µ e ) for a fixed polarization can<br />
therefore be used to determine the refractive index contrast.<br />
We use a broadband angle-dependent light scattering setup equivalent to the<br />
apparatus that is described in Ref. [17]. The setup is placed in transmission<br />
mode to measure the angular resolved transmission through our ZnO samples.<br />
The sample is illuminated by a supercontinuum light source, which enables a measurement<br />
of the effective refractive index over a wavelength range from 500 nm<br />
up to 900 nm.<br />
The experimental results are shown in Fig. 3.3. In panel a we see the spectrally<br />
resolved transmission as function of the outgoing angle θ e . This data is<br />
the p-polarized transmission averaged over 6 measurements on different sample<br />
positions. We plotted P (µ e )/µ e for a wavelength of 532 nm in panel b. By fitting<br />
this data <strong>with</strong> the refractive index contrast as the only free parameter, we find<br />
n e = 1.34. We repeated this procedure for all measured wavelengths to determine<br />
the spectral dependence of n e , which is shown in panel c. The gray area denotes<br />
the error that we estimated by comparing the fits to the data for different values<br />
of the refractive index.<br />
Transport mean free path<br />
In heterogeneous structures light is scattered as it propagates. The average distance<br />
light travels before it completely looses direction is defined as the transport<br />
mean free path l. In our samples that consist of isotropic scatterers, the transport<br />
mean free path is equal to the scattering mean free path. The amount of<br />
unscattered transmitted light reduces as e −L/l , where L is the layer thickness.<br />
Therefore, a sample <strong>with</strong> a thickness of at least a few times the mean free path<br />
is optically thick and opaque.<br />
The transport mean free path can be obtained from a measurement of the<br />
total diffusive transmission T as function of the layer thickness L. The total<br />
transmission is inversely proportional to[18]<br />
1<br />
T = L + z e1 + z e2<br />
l + z e1<br />
, (3.4)