Investor update - Masan Group
Investor update - Masan Group
Investor update - Masan Group

Create successful ePaper yourself
Turn your PDF publications into a flip-book with our unique Google optimized e-Paper software.
2Q10<br />
<strong>Investor</strong> <strong>update</strong>
Leading businesses<br />
Vietnam’s premier private sector group<br />
<strong>Masan</strong> <strong>Group</strong> is Vietnam’s pioneering private sector<br />
group. We build market-leading businesses in verticals<br />
that we aim to dominate over the long term.<br />
Our entrepreneurial spirit and commitment to enduring<br />
shareholder value has enabled us to develop sector<br />
champions in financial services and consumer staples.<br />
With a vision to create Vietnam’s largest private<br />
resource company, and signifying our entry into<br />
the mining and infrastructure sectors, we recently<br />
announced the acquisition of Nuiphao Mining Joint<br />
Venture Company Ltd., a world-class tungsten mine.<br />
Our immediate objectives<br />
•<br />
•<br />
•<br />
•<br />
Achieve USD5 billion market capitalization within<br />
five years<br />
Achieve market leadership position in every sector<br />
the group operates in<br />
Grow each business to at least USD500 million in<br />
valuation<br />
Become the No. 1 choice for talent, partnerships<br />
and capital allocation in Vietnam<br />
<strong>Masan</strong><br />
ownership<br />
structure<br />
What sets <strong>Masan</strong> apart?<br />
Clear strategy<br />
• Focused on cash flow-generating businesses<br />
where a local company can be competitive for an<br />
extended period of time<br />
• Focused on the services, resource and<br />
infrastructure sector and any verticals that stand<br />
to benefit from the emergence of middle class<br />
consumers in Vietnam<br />
• Will not consider pure asset trades, capital<br />
intensive businesses and minority stakes<br />
Talent and governance<br />
• Each business operates independently<br />
• Each of these enterprises has its own board of<br />
directors and shareholders<br />
• No family involvement in management of<br />
subsidiaries<br />
• Best-in-class management teams bring a unique<br />
combination of local knowledge and international<br />
experience<br />
Aiming for leadership<br />
• <strong>Masan</strong> <strong>Group</strong> is the third largest listed private<br />
sector group with a market capitalization of USD1.3<br />
billion<br />
• <strong>Masan</strong> Food is one of the largest diversified FMCG<br />
companies in Vietnam<br />
• Euromoney awarded Techcombank as the “Best<br />
Bank in Vietnam” for 2010<br />
• With the acquisition of Nuiphao Mining Joint<br />
Venture Company Ltd., <strong>Masan</strong> Resources is now<br />
one of Vietnam’s largest private sector resources<br />
companies<br />
<strong>Masan</strong> Food<br />
72.8%<br />
Techcombank<br />
20%<br />
<strong>Masan</strong><br />
Resources<br />
80%<br />
Capital allocation and shareholder returns<br />
• Raised over USD180 million from world-class<br />
institutions such as TPG, International Finance<br />
Corporation, Bank Invest and House Foods<br />
•<br />
Stringent capital allocation<br />
•<br />
Returns of at least 2x-5x<br />
Please see the disclaimer on the last page of this report.<br />
2
2Q10 summary<br />
<strong>Masan</strong> <strong>Group</strong> delivered record 2Q pro-forma* financial results<br />
Management Commentary<br />
Net sales growth of 41.5%<br />
• Net sales of VND1,217 billion in 2Q10 vs. VND860<br />
billion in 2Q09<br />
Financial Performance<br />
<strong>Masan</strong> Food<br />
VND billions<br />
Net operating profit increased significantly<br />
•<br />
Net operating profit was VND332 billion, a 67.3%<br />
increase in comparison with 2Q09<br />
Net operating margins up 409 bps<br />
•<br />
•<br />
Delivered net operating margin of 27.3% in 2Q10<br />
vs. 23.1% in 2Q09<br />
Margin expansion driven by cost savings<br />
programme, increase in premium SKUs and<br />
pricing power<br />
Net profit after tax growth of 54.8%<br />
• Generated a net profit after tax of VND303 billion<br />
in 2Q10 vs. VND196 billion in 2Q09<br />
Net margin up 214 bps<br />
• Net margin improved to 24.9% in 2Q10 from 22.8%<br />
in 2Q09<br />
860<br />
2Q09<br />
Net sales<br />
Techcombank<br />
VND billions<br />
32,925<br />
2Q09<br />
139<br />
55,515<br />
1,217<br />
298<br />
2Q10<br />
Net profit after tax<br />
64,437<br />
43,235<br />
2Q10<br />
Strong cash position with VND1,741 billion<br />
cash and cash equivalents<br />
•<br />
A testament to the <strong>Group</strong>’s stringent allocation<br />
practices and capital raising initiatives<br />
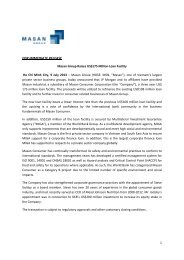
May 4, 2010<br />
<strong>Masan</strong> announced a definitive agreement to acquire<br />
control of Nuiphao Mining Joint Venture Company<br />
Ltd. (Nuiphaovica) from Tiberon Minerals Pte. Ltd.,<br />
a company owned by funds managed by Dragon<br />
Capital, a Vietnam-based asset manager.<br />
May 11, 2010<br />
<strong>Masan</strong> <strong>Group</strong> signed an agreement with International<br />
Finance Corporation (IFC), to support <strong>Masan</strong>’s growth<br />
initiatives and pursuit of new business opportunities.<br />
IFC will invest approximately USD40 million.<br />
Loans to customers<br />
Deposits from customers<br />
<strong>Masan</strong> <strong>Group</strong> (Pro-forma*)<br />
VND billions<br />
860<br />
2Q09<br />
Net sales<br />
196<br />
1,217<br />
2Q10<br />
303<br />
Net profit after tax<br />
Note: The pro-forma financials are adjusted for the following:<br />
The impact of restructuring and incorporating Techcombank’s profits as if <strong>Masan</strong> <strong>Group</strong> had acquired its interest in Techcombank on<br />
January 1, 2008;<br />
Adding back the impact of the amortization expense generated by restructuring our 19.99% stake in Techcombank (under Vietnamese Accounting<br />
Standards, goodwill is amortized); and<br />
Adding back the impact of the interest expense in connection to the zero coupon convertible bonds issued in November 2009, which are not<br />
accrued for conversion price, is approximately 50% of listed market price<br />
Please see the disclaimer on the last page of this report.<br />
3
Management outlook<br />
<strong>Group</strong> Guidance<br />
<strong>Group</strong> targets to deliver net profit after tax of VND1,140 billion<br />
• <strong>Group</strong> expects <strong>Masan</strong> Food to deliver net profit after tax of VND1,000 billion, an increase of 50% YoY<br />
•<br />
<strong>Group</strong> expects Techcombank to generate profit after ta of VND2,100 billion, an increase of 17% YoY<br />
Growth will be driven by<br />
• Continued market share gains in our core markets<br />
•<br />
•<br />
New product launches that will accelerate growth in 2H10<br />
Entrance into attractive and high growth segments<br />
Management reiterates that it will strive to outperform the record results delivered in 1H10 in the<br />
second half of 2010.<br />
We continue to evaluate new business opportunities of scale<br />
Analyst Estimates<br />
Concensus estimates for<br />
FY2010 & FY2011*<br />
VND billions except per share data<br />
6,565<br />
8,481<br />
<strong>Masan</strong> consolidated earnings forecast*<br />
2010E KIM ENG HSC Viet Capital Average<br />
Sale<br />
Net Income<br />
EPS<br />
6,859<br />
922<br />
1,898<br />
6,114<br />
1,127<br />
2,308<br />
6,639<br />
929<br />
2,445<br />
6,537<br />
993<br />
2,217<br />
3,070<br />
2,217<br />
1,492<br />
1,217<br />
Sales Net income EPS<br />
2011E<br />
Sale<br />
Net Income<br />
EPS<br />
8,646<br />
1,280<br />
2,636<br />
7,808<br />
1,476<br />
2,843<br />
8,988<br />
1,721<br />
3,731<br />
8,481<br />
1,492<br />
3,070<br />
FY2010E<br />
FY2011E<br />
Techcombank YTD profit before tax vs.<br />
management projection<br />
2,800<br />
<strong>Masan</strong> Food YTD net income vs.<br />
management projection<br />
1,000<br />
993<br />
400<br />
Profit before tax<br />
Management<br />
projection 2010<br />
YTD net income<br />
Management<br />
projection 2010<br />
Source: Research Reports<br />
*Note: The average forecast date is the mean of three brokers’ estimates<br />
Please see the disclaimer on the last page of this report.<br />
4
Our businesses<br />
<strong>Masan</strong> Food<br />
<strong>Masan</strong> Food is one of Vietnam’s largest local diversified<br />
FMCG companies. Its well-regarded portfolio of<br />
popular brands includes Chin-Su, Nam Ngu, Tam Thai<br />
Tu, Rong Viet, Tien Vua and Omachi.<br />
Leveraging its brand equity and unparalleled<br />
distribution network, <strong>Masan</strong> Food has rapidly<br />
established leading market share positions in the soya<br />
sauce (78%), fish sauce (74%), chili sauce (27%) and<br />
instant noodles categories (14%). (Source: AC Nielsen)<br />
Techcombank<br />
Established in September 1993, Techcombank has<br />
since developed into one of Vietnam’s leading joint<br />
stock commercial banks. The institution has built a<br />
strong reputation as a prudent and well-managed bank<br />
that delivers quality customer services.<br />
HSBC, one of the world’s leading financial institutions,<br />
is a strategic partner and 20% shareholder<br />
in Techcombank. HSBC actively works with<br />
Techcombank’s experienced management team<br />
to develop strategic initiatives and provide strong<br />
corporate governance, management and operational<br />
support.<br />
What sets us apart<br />
What sets us apart<br />
•<br />
•<br />
•<br />
Led by a seasoned professional Vietnamese<br />
management team from renowned MNC’s such as<br />
Kimberley-Clarke, Nestle, Procter & Gamble and<br />
Unilever<br />
Focused on high margin, branded FMCG products<br />
Nationwide distribution footprint that reaches over<br />
200,000 points of sale<br />
•<br />
•<br />
•<br />
Professional management team from established<br />
financial institutions such as Citibank, HSBC and<br />
Standard Chartered<br />
Industry leading ROA<br />
First among joint stock commercial banks in<br />
terms of core net profit and second in terms of net<br />
interest margin<br />
•<br />
•<br />
Deep understanding of local consumer taste<br />
Track record of successful product launches and<br />
market innovations<br />
•<br />
Has the third largest distribution network among<br />
joint stock commercial banks with over 7,000 ATMs<br />
and 188 branches and TSO nationwide.<br />
•<br />
Diverse product portfolio that caters to all<br />
consumer segments<br />
•<br />
Does not compete on price<br />
Key Financial Metrics in 2Q10<br />
Key Financial Metrics in 2Q10<br />
2Q10 Revenue: financial performance<br />
VND billions<br />
44.1%<br />
719<br />
47.2%<br />
Financial performance: excluding<br />
treasury income<br />
VND billions<br />
811<br />
26<br />
29.8%<br />
8<br />
Chili<br />
sauce<br />
167<br />
74<br />
Revenues<br />
Gross margin<br />
Soy<br />
sauce<br />
300 23.5%<br />
70<br />
Instant<br />
noodle<br />
Gross profit<br />
339<br />
Fish<br />
sauce<br />
582<br />
445<br />
528<br />
251 282<br />
2Q 2009 2Q 2010<br />
Net interest income Net profit after tax<br />
Net operating profit before provisions<br />
Please see the disclaimer on the last page of this report.<br />
5
<strong>Masan</strong> Food<br />
2Q10 Financial & Business Highlights<br />
Continued strong growth<br />
• Net revenue grew 41.5% to VND1,217 billion<br />
•<br />
•<br />
EBITDA rose significantly to VND334 billion, a<br />
116.8% increase<br />
Net profit after tax also increased remarkably by<br />
114.6% to VND298 billion<br />
Impressive margin expansion<br />
• 2Q10 marks the fourth consecutive quarter of<br />
gross margin expansion<br />
• <strong>Masan</strong> Food delivered record gross margin of<br />
43.6%, an improvement of 955 basis points YoY<br />
• Net margin expands to 24.5%, an increase of 832<br />
basis points YoY<br />
Our stellar results are attributable to<br />
• Successful new product launches, cost savings<br />
initiatives and improved pricing power<br />
• Market share gain in the premium instant noodle<br />
market segment<br />
Key Financial Metrics<br />
VND millions<br />
Income statement 2Q09 2Q10 Growth%<br />
Net Sales<br />
Gross Profit<br />
EBITDA<br />
Net Profit After Tax<br />
Balance Sheet<br />
Current Asset<br />
Long term Assets<br />
859,745<br />
292,417<br />
154,066<br />
138,859<br />
1,302,636<br />
671,823<br />
1,216,840<br />
530,110<br />
333,982<br />
297,968<br />
1,835,710<br />
785,874<br />
41.5%<br />
81.3%<br />
116.8%<br />
114.6%<br />
40.9%<br />
17.0%<br />
Outlook<br />
Growth drivers<br />
• The launch of Oh Ngon, an innovative mid-tier<br />
instant noodle product<br />
• Penetrating the premium cooking oil segment via a<br />
rice-based cooking oil<br />
• Volume and retail market growth in existing<br />
categories<br />
• Continued shift from unbranded to branded<br />
products<br />
Total Assets<br />
Current Liabilities<br />
Long term Liabilities<br />
Total Liabilitiies<br />
Total Shareholders’<br />
Equity<br />
Total Liabilitiies<br />
& Liabilities<br />
Minority interest<br />
1,974,459<br />
906,397<br />
143,880<br />
1,050,277<br />
923,166<br />
1,973,443<br />
1,016<br />
2,621,585<br />
933,982<br />
162,738<br />
1,096,720<br />
1,523,555<br />
2,620,275<br />
1,309<br />
32.8%<br />
3.0%<br />
13.1%<br />
4.4%<br />
65.0%<br />
32.8%<br />
28.9%<br />
We continue to evaluate opportunities to enter<br />
new high growth and margin sectors through<br />
organic and inorganic means.<br />
<strong>Masan</strong> <strong>Group</strong> management expects <strong>Masan</strong><br />
Food to deliver 2010E net profit after tax of<br />
VND1,000 billion.<br />
Please see the disclaimer on the last page of this report.<br />
6
Techcombank<br />
2Q10 Financial & Business Highlights<br />
Core operating earnings growth in the face of<br />
challenging macroeconomic conditions<br />
• Operating profit before provisions growth of 18.5%<br />
in comparison to 2Q09<br />
• Net income increased by 12.3% versus 2Q09<br />
Strong Asset Growth<br />
• Total assets reached VND108,991 billion<br />
in 2Q10, a 46% increase<br />
Increased corporate loan portfolio backed by<br />
deposit growth<br />
• Loans to corporate customers increased by 31.3%<br />
•<br />
Total deposits growth of 16.1%<br />
Continue to operate with a high degree of risk<br />
management and stringent lending practices<br />
• Deposit-to-loan ratio was 1.5x at quarter end 2Q10<br />
•<br />
Increase in provisioning in 2Q10 a result of two<br />
agri-commodity loans, but now full provided for<br />
Key Financial Metrics<br />
VND millions<br />
Income statement 2Q09 2Q10 Growth%<br />
Net interest income<br />
Non interest income<br />
Total operating<br />
income<br />
Operating expenses<br />
Allowance and<br />
provision expenses<br />
Total operating<br />
expenses<br />
Profit before tax<br />
Net profit<br />
605,438<br />
455,687<br />
1,061,126<br />
(294,877)<br />
(55,701)<br />
(350,578)<br />
710,547<br />
534,563<br />
810,531<br />
211,660<br />
1,022,191<br />
(386,989)<br />
(151,993)<br />
(538,982)<br />
483,208<br />
362,098<br />
33.9%<br />
-53.6%<br />
-3.7%<br />
31.2%<br />
172.9%<br />
53.7%<br />
-32.0%<br />
-32.3%<br />
Outlook<br />
Outlook remains positive as net interest income<br />
and total assets increased by 33.9% and 46.0%,<br />
respectively.<br />
<strong>Masan</strong> <strong>Group</strong> management expects<br />
Techcombank to deliver 2010E net profit after<br />
tax of VND 2,100 billion.<br />
Balance sheet<br />
Total assets<br />
Loans to customers<br />
74,737,178<br />
32,929,561<br />
108,991,426<br />
43,234,555<br />
45.8%<br />
31.3%<br />
Total liabilitites<br />
Deposits from<br />
customers<br />
Total equity<br />
67,957,547<br />
55,515,052<br />
6,779,631<br />
100,939,489<br />
64,437,393<br />
8,051,937<br />
48.5%<br />
16.1%<br />
18.8%<br />
Please see the disclaimer on the last page of this report.<br />
7
Financial supplement<br />
<strong>Masan</strong> <strong>Group</strong> share price performance<br />
Overview<br />
Industry<br />
Diversified<br />
Ticker<br />
HCM:MSN<br />
Stock exchange<br />
HOSE<br />
Market cap (in VND bn) 24,755<br />
Market cap (in USD bn) 1.303<br />
Market price 51,000<br />
Shares outstanding (in mn) 485<br />
Ho Chi Minh index price 507<br />
52 week high 55,000<br />
52 week low 32,500<br />
Avg trading volume 2Q10 94,085<br />
Note: Price data as of 30 June, 2010 (in VND)<br />
Share price performance (rebased prices)<br />
60,000 500,000<br />
45,000 375,000<br />
30,000 250,000<br />
15,000 125,000<br />
4/1/10<br />
4/6/10<br />
4/6/10<br />
4/14/10<br />
4/19/10<br />
4/22/10<br />
4/27/10<br />
4/29/10<br />
5/5/10<br />
5/10/10<br />
5/13/10<br />
5/18/10<br />
5/21/10<br />
5/26/10<br />
5/31/10<br />
6/3/10<br />
6/8/10<br />
6/11/10<br />
6/16/10<br />
6/21/10<br />
6/24/10<br />
6/29/10<br />
Volume <strong>Masan</strong> <strong>Group</strong> Ho Chi Minh index<br />
Source: Reuters<br />
Volume<br />
Selected <strong>Group</strong> Pro-Forma* Financials<br />
Income statement 2Q09 2Q10<br />
Gross sales<br />
Less sales deduction<br />
Net sales<br />
Cost of goods sold<br />
Gross profit<br />
Sg&a<br />
Financial income / (expense)<br />
Net operating profit<br />
Other profit / (expense)<br />
Share of associate’s results<br />
Profit before tax<br />
Tax<br />
Profit after tax<br />
Minority interests<br />
Equity holders of the company<br />
Earnings per share<br />
832,796<br />
3,051<br />
859,745<br />
567,327<br />
292,417<br />
142,941<br />
49,458<br />
198,934<br />
(2,889)<br />
86,331<br />
282,376<br />
13,300<br />
269,077<br />
73,189<br />
195,888<br />
411<br />
1,225,513<br />
8,673<br />
1,216,840<br />
686,730<br />
530,110<br />
221,347<br />
23,965<br />
332,728<br />
(2,832)<br />
72,310<br />
402,206<br />
17,958<br />
384,248<br />
80,971<br />
303,277<br />
625<br />
Growth rates and margins 2Q09 2Q10<br />
Net sales growth<br />
Gross margin<br />
SG&A as % of net sales<br />
Operating profit margin<br />
Operating profit growth<br />
Profit before tax margin<br />
Profit before tax growth<br />
Effective tax rate<br />
Net margin<br />
Net profit growth<br />
NA<br />
34.0%<br />
16.6%<br />
23.1%<br />
NA<br />
32.8%<br />
NA<br />
4.7%<br />
22.8%<br />
NA<br />
41.5%<br />
43.6%<br />
18.2%<br />
27.3%<br />
67.3%<br />
33.1%<br />
42.4%<br />
4.5%<br />
24.9%<br />
54.8%<br />
Balance sheet 4Q09 4Q10<br />
Current assets<br />
Cash<br />
Short-term investment<br />
Net operating receivables<br />
Other receivables<br />
Inventories<br />
Other current assets<br />
2,441,831<br />
1,123,616<br />
776,000<br />
54,938<br />
227,998<br />
199,466<br />
59,813<br />
2,576,321<br />
980,107<br />
814,771<br />
50,736<br />
310,234<br />
316,230<br />
104,243<br />
Long term assets<br />
Net long-term receivables<br />
Fixed assets<br />
Investment in real estate<br />
Long-term investments<br />
Other long-term assets<br />
4,575,263<br />
-<br />
605,360<br />
-<br />
3,919,827<br />
50,076<br />
4,728,236<br />
-<br />
734,235<br />
-<br />
3,941,764<br />
52,287<br />
Total assets 7,017,094 7,304,607<br />
Current liabilities<br />
Long term liabilities<br />
Liabilities<br />
Equity<br />
Chartered capital<br />
Capital surplus<br />
Differences in<br />
Forex revaluation<br />
Other capital<br />
Retained earning<br />
Other reserves + funds<br />
1,210,937<br />
736,618<br />
1,947,555<br />
4,762,088<br />
4,853,998<br />
1,421,817<br />
-<br />
(1,947,256)<br />
434,707<br />
(1,178)<br />
1,031,808<br />
761,409<br />
1,793,217<br />
5,096,066<br />
4,853,998<br />
1,421,817<br />
(1,947,256)<br />
767,507<br />
-<br />
Minority interest<br />
307,451 415,324<br />
Total resources 7,017,094 7,304,607<br />
Note: The pro-forma financials are adjusted for the following:<br />
The impact of restructuring and incorporating Techcombank’s profits as if <strong>Masan</strong> <strong>Group</strong> had acquired its interest in Techcombank on<br />
January 1, 2008;<br />
Adding back the impact of the amortization expense generated by restructuring our 19.99% stake in Techcombank (under Vietnamese Accounting<br />
Standards, goodwill is amortized); and<br />
Adding back the impact of the interest expense in connection to the zero coupon convertible bonds issued in November 2009, which are not<br />
accrued for conversion price, is approximately 50% of listed market price<br />
Please see the disclaimer on the last page of this report.<br />
8
Disclaimer: The financial and valuation numbers provided are based on management estimates. All forward-looking statements made in this<br />
document are based upon current information available to management. We assume no obligation to <strong>update</strong> or alter the forward-looking<br />
statements. Historical results are not indicative of future performance.<br />
For <strong>Investor</strong> Relations please contact:<br />
Danny Le – Head of <strong>Investor</strong> Relations<br />
Tel: +84 8 6256 3862 (ext. 5403)<br />
Email: dannyle@masan.masangroup.com<br />
Huynh Tran Vy – Senior Analyst<br />
Tel: +84 8 6256 3862 (ext. 5405)<br />
Email: vyht@masan.masangroup.com<br />
MASAN GROUP<br />
8 th Floor, Central Plaza<br />
17 Le Duan Street, District 1<br />
Ho Chi Minh City, Vietnam<br />
Tel: +84 8 6256 3862<br />
Fax: +84 8 3827 4115<br />
www.masangroup.com<br />
Please see the disclaimer on the last page of this report. 9