Bruker Diffrac.Measurement Suite User Manual
Bruker Diffrac.Measurement Suite User Manual
Bruker Diffrac.Measurement Suite User Manual

You also want an ePaper? Increase the reach of your titles
YUMPU automatically turns print PDFs into web optimized ePapers that Google loves.
DIFFRAC.SUITE<br />
<strong>User</strong> <strong>Manual</strong><br />
DIFFRAC.MEASUREMENT SUITE<br />
Original Instructions<br />
Innovation with Integrity<br />
XRD
The reproduction, transmission or use of this document or its contents is not permitted without express written<br />
authority. Offenders will be liable for damages. All rights reserved.<br />
We have checked the contents of this manual for agreement with the hardware and software described. Since<br />
deviations cannot be precluded entirely, we cannot guarantee full agreement. However, the data in this manual are<br />
reviewed regularly and any necessary corrections are included in subsequent editions. Suggestions for improvement<br />
are welcome.<br />
All configurations and specifications are subject to change without notice.<br />
Order no. DOC-M88-EXX191 V3.0. Updated: Nov 29, 2012.<br />
© 2009 - 2012 <strong>Bruker</strong> AXS GmbH, Karlsruhe, Germany.<br />
All trademarks and registered trademarks are the sole property of their respective owners.<br />
Printed in the Federal Republic of Germany.<br />
<strong>Bruker</strong> AXS GmbH<br />
Östliche Rheinbrückenstr. 49<br />
76187 Karlsruhe, Germany<br />
Tel. +49 721 5 09 97-0<br />
Fax +49 721 5 09 97-56 54<br />
info@bruker-axs.de<br />
www.bruker.com
<strong>Bruker</strong> AXS <strong>Measurement</strong> <strong>Suite</strong><br />
<strong>User</strong> <strong>Manual</strong><br />
<strong>Bruker</strong> AXS <strong>Measurement</strong> <strong>Suite</strong><br />
Table of Contents<br />
<strong>Bruker</strong> AXS <strong>Measurement</strong> <strong>Suite</strong> ............................................................................... 1<br />
Introduction to <strong>Bruker</strong> AXS <strong>Measurement</strong> <strong>Suite</strong> .......................................................................... 1<br />
System Configuration ..................................................................................................................... 1<br />
Standard Configuration .............................................................................................................. 1<br />
Extended Configuration ............................................................................................................. 2<br />
Emergency Operation ..................................................................................................................... 3<br />
The <strong>Measurement</strong> Server ............................................................................................................... 4<br />
General ...................................................................................................................................... 4<br />
Setting up the System with the <strong>Measurement</strong> Server................................................................ 4<br />
Making Preliminary Settings for <strong>Measurement</strong> Server ....................................................... 4<br />
Selecting the Instruments ................................................................................................... 6<br />
Getting and Releasing Control of and Reconnecting to Instruments ................................. 9<br />
Other Options of the Start Menu ....................................................................................... 10<br />
The <strong>Measurement</strong> Client ............................................................................................................... 12<br />
General .................................................................................................................................... 12<br />
The Plug-in Concept ................................................................................................................ 12<br />
Logging In and Out ........................................................................................................... 12<br />
Shell Interface ................................................................................................................... 12<br />
Menus of Shell Interface ................................................................................................... 13<br />
The File Menu ............................................................................................................ 13<br />
The Help Menu .......................................................................................................... 14<br />
Getting a Connection to an Instrument with the <strong>Measurement</strong> Client ..................................... 15<br />
DATABASE MANAGEMENT ......................................................................................................... 18<br />
General .................................................................................................................................... 18<br />
Screen Layout and Operation .................................................................................................. 18<br />
Instrument Configuration .................................................................................................. 18<br />
Controlled Devices Window ....................................................................................... 19<br />
Entering and Deleting Devices in/from the Database ........................................ 20<br />
Instrument Configurations Window ............................................................................ 20<br />
Deleting Configurations ...................................................................................... 21<br />
<strong>User</strong> Management ............................................................................................................ 21<br />
<strong>User</strong> and Group Rights Concept ............................................................................... 21<br />
<strong>User</strong>s Table ............................................................................................................... 21<br />
Deleting <strong>User</strong>s and Storing Additional <strong>User</strong> Data .............................................. 23<br />
Groups Table ............................................................................................................. 25<br />
Adding or Removing Rights to/from a <strong>User</strong> Group ............................................. 26<br />
Deleting a <strong>User</strong> Group ........................................................................................ 26<br />
Audit Trail .......................................................................................................................... 26<br />
File Menu and Audit Trail Context Menu ................................................................... 27<br />
General Settings ............................................................................................................... 28<br />
General Settings Window .......................................................................................... 29<br />
Database Backup/Restore Window ........................................................................... 30<br />
Database Maintenance Window ....................................................................................... 31<br />
Load Experiments ...................................................................................................... 31<br />
Load Logs .................................................................................................................. 32<br />
START JOBS .................................................................................................................................. 33<br />
DOC-M88-EXX191 V3.0 – 11.2012<br />
i
<strong>User</strong> <strong>Manual</strong><br />
<strong>Bruker</strong> AXS <strong>Measurement</strong> <strong>Suite</strong><br />
General .................................................................................................................................... 33<br />
Screen Layout and Operation ................................................................................................. 33<br />
The Start Jobs tab ............................................................................................................ 34<br />
Editing the <strong>Measurement</strong> Information ....................................................................... 36<br />
The Start Jobs Context Menu ................................................................................... 36<br />
The Column Editor .................................................................................................... 37<br />
The Start Jobs Menu ................................................................................................. 39<br />
<strong>User</strong> Right Restrictions .................................................................................................... 39<br />
The Start Jobtemplates tab .............................................................................................. 39<br />
Creating a new template ........................................................................................... 40<br />
Working with optional parameters ............................................................................ 42<br />
The Well Plate tab ............................................................................................................ 43<br />
The Wellplate Control context menu ......................................................................... 44<br />
Camera Control context menu .................................................................................. 44<br />
JOBLIST ........................................................................................................................................ 46<br />
General .................................................................................................................................... 46<br />
Screen Layout and Operation ................................................................................................. 46<br />
The Joblist and Job Details Windows .............................................................................. 46<br />
Job History Window ......................................................................................................... 48<br />
Scheduled Job Window.................................................................................................... 48<br />
Scheduling of Jobs ........................................................................................................... 48<br />
Speed Buttons .................................................................................................................. 51<br />
The Joblist Menu and Job List Context Menu ................................................................. 51<br />
CONFIG .......................................................................................................................................... 53<br />
General .................................................................................................................................... 53<br />
Screen Layout and Operation ................................................................................................. 53<br />
Config Tree Window ......................................................................................................... 54<br />
Component Status .................................................................................................... 55<br />
Properties Window ........................................................................................................... 55<br />
Editing Control .......................................................................................................... 56<br />
Plugs and Sockets .................................................................................................... 57<br />
Resource Providers .................................................................................................. 59<br />
Resource Consumers ............................................................................................... 59<br />
The File Menu .................................................................................................................. 60<br />
The Offline Mode Menu .................................................................................................... 60<br />
The Config Menu .............................................................................................................. 61<br />
The View Menu ................................................................................................................ 67<br />
The Network Menu ........................................................................................................... 70<br />
Speed Buttons .................................................................................................................. 71<br />
The Config Tree Context Menu ........................................................................................ 72<br />
Add Components ...................................................................................................... 73<br />
Add Components: Show Details ............................................................................... 75<br />
Add Components: Modify Names ............................................................................. 75<br />
Register new components ........................................................................................ 76<br />
Clone Component ..................................................................................................... 77<br />
Create Component from Scratch .............................................................................. 77<br />
Cut ............................................................................................................................. 78<br />
Copy .......................................................................................................................... 78<br />
Paste Component ..................................................................................................... 78<br />
Paste Values ............................................................................................................. 78<br />
Apply Values from Section ........................................................................................ 78<br />
Rename Component ................................................................................................. 79<br />
Delete Component .................................................................................................... 80<br />
The Edit Menu .................................................................................................................. 80<br />
TOOLS ........................................................................................................................................... 81<br />
General .................................................................................................................................... 81<br />
Screen Layout and Operation ................................................................................................. 81<br />
Component Tree Window ................................................................................................ 82<br />
ii<br />
DOC-M88-EXX191 V3.0 – 11.2012
<strong>Bruker</strong> AXS <strong>Measurement</strong> <strong>Suite</strong><br />
<strong>User</strong> <strong>Manual</strong><br />
Component State Window ....................................................................................................... 83<br />
Changing the Value of Properties .............................................................................. 85<br />
TOOLS-Specific Menus .................................................................................................... 86<br />
The Utilities Menu ...................................................................................................... 86<br />
Dialog Boxes for Commands ..................................................................................... 88<br />
Speed Buttons .................................................................................................................. 89<br />
Diagnosing Faults and Malfunctions and Taking Remedial Action .................................. 90<br />
The Settings Menu ............................................................................................................ 91<br />
RemoteControl ......................................................................................................................... 93<br />
<strong>Measurement</strong> ........................................................................................................................... 94<br />
COMMANDER ................................................................................................................................ 96<br />
General .................................................................................................................................... 96<br />
Screen Layout and Operation .................................................................................................. 96<br />
COMMANDER Page ........................................................................................................ 96<br />
Instrument Components Panel ......................................................................................... 97<br />
Sample Changer Control ........................................................................................... 98<br />
Drive Control .............................................................................................................. 99<br />
Position Control ................................................................................................ 101<br />
X-Ray Generator Control ......................................................................................... 101<br />
Detector Control ....................................................................................................... 102<br />
Slit Control ............................................................................................................... 104<br />
Special optics control ............................................................................................... 104<br />
Scan Control ................................................................................................................... 105<br />
The Scan Setup Area .............................................................................................. 105<br />
The Chart Area ........................................................................................................ 106<br />
Context Menu ................................................................................................... 107<br />
Video Tab ......................................................................................................... 107<br />
Speed buttons ................................................................................................................. 109<br />
The File Menu ................................................................................................................. 109<br />
The Commander Menu ................................................................................................... 110<br />
<strong>User</strong> Script Editor ..................................................................................................... 112<br />
DAVINCI ........................................................................................................................................ 114<br />
General .................................................................................................................................. 114<br />
Screen Layout and Operation ................................................................................................ 114<br />
DETECTOR ................................................................................................................................... 117<br />
General .................................................................................................................................. 117<br />
Detector Menu ........................................................................................................................ 117<br />
Browse LYNXEYE XE detector ...................................................................................... 117<br />
Keep Shutter Close ......................................................................................................... 118<br />
1D Detector Calibration .......................................................................................................... 118<br />
Resolution and Zero Offset ............................................................................................. 118<br />
Calibration by Theoretical Calculation ..................................................................... 119<br />
Calibration by <strong>Measurement</strong> .................................................................................... 121<br />
Calibrate by Existing Data ....................................................................................... 122<br />
Results ..................................................................................................................... 122<br />
LYNXEYE XE .................................................................................................................. 123<br />
Load and Save The Detector State ......................................................................... 123<br />
Low and High Discriminators ................................................................................... 123<br />
Veto Discriminator ................................................................................................... 124<br />
Results .............................................................................................................. 125<br />
Low and High Discriminators with X-Ray ................................................................ 126<br />
Results .............................................................................................................. 127<br />
Flood Field ............................................................................................................... 128<br />
ADC Monitor ............................................................................................................ 128<br />
Detector Browse ...................................................................................................... 130<br />
LOG ............................................................................................................................................... 131<br />
General .................................................................................................................................. 131<br />
Screen Layout and Operation ................................................................................................ 131<br />
DOC-M88-EXX191 V3.0 – 11.2012<br />
iii
<strong>User</strong> <strong>Manual</strong><br />
<strong>Bruker</strong> AXS <strong>Measurement</strong> <strong>Suite</strong><br />
The Log Context Menu................................................................................................... 132<br />
CAMERA HIGH RESOLUTION ................................................................................................... 134<br />
General .................................................................................................................................. 134<br />
Screen Layout and Operation ............................................................................................... 134<br />
The Camera Menu ......................................................................................................... 135<br />
Camera Properties Dialog .............................................................................................. 136<br />
<strong>User</strong> Right Restrictions .................................................................................................. 136<br />
RESULTS MANAGER ................................................................................................................. 137<br />
General .................................................................................................................................. 137<br />
Screen Layout and Operation ............................................................................................... 137<br />
Opening a previously stored view .................................................................................. 137<br />
Results view page .......................................................................................................... 138<br />
Monitoring ...................................................................................................................... 141<br />
Removing views ............................................................................................................. 141<br />
Specifying views ............................................................................................................. 141<br />
Specification view ........................................................................................................... 142<br />
General search criteria ................................................................................................... 143<br />
Shown parameters ......................................................................................................... 144<br />
Sample name filter ......................................................................................................... 145<br />
<strong>Measurement</strong> method filter ............................................................................................ 145<br />
Operator filter ................................................................................................................. 145<br />
Filtering for time intervals ............................................................................................... 146<br />
Appearance .................................................................................................................... 147<br />
Formatting views ............................................................................................................ 147<br />
Launcher View ............................................................................................................... 148<br />
Database Maintenance ............................................................................................................... 149<br />
General .................................................................................................................................. 149<br />
Screen Layout and Operation ............................................................................................... 149<br />
Update Database .................................................................................................................. 150<br />
Overwrite Database ............................................................................................................... 152<br />
Database Troubleshooting ........................................................................................................ 154<br />
Script Designer ........................................................................................................................... 157<br />
General .................................................................................................................................. 157<br />
Screen Layout and Operation ............................................................................................... 157<br />
Opening the Script Designer .......................................................................................... 157<br />
The Main Window .......................................................................................................... 157<br />
The Menus .............................................................................................................. 157<br />
File ................................................................................................................... 158<br />
Edit ................................................................................................................... 159<br />
View ................................................................................................................. 160<br />
<strong>User</strong> Functions ................................................................................................. 160<br />
Script ................................................................................................................ 161<br />
The Toolbars ........................................................................................................... 162<br />
Script Item Panel ..................................................................................................... 162<br />
Component Factory ................................................................................................ 162<br />
Item Editor ............................................................................................................... 163<br />
Output ..................................................................................................................... 163<br />
Find Results ............................................................................................................ 163<br />
Error List.................................................................................................................. 163<br />
Breakpoints ............................................................................................................. 163<br />
Controlling Script Items .................................................................................................. 164<br />
License Notes ............................................................................................................................. 168<br />
LGPL ..................................................................................................................................... 168<br />
Apache Licence ..................................................................................................................... 168<br />
GPL ....................................................................................................................................... 168<br />
Microsoft Public License (Ms-PL) .......................................................................................... 168<br />
Others .................................................................................................................................... 168<br />
Instrument Firmware modules ............................................................................................... 168<br />
iv<br />
DOC-M88-EXX191 V3.0 – 11.2012
<strong>Bruker</strong> AXS <strong>Measurement</strong> <strong>Suite</strong><br />
<strong>User</strong> <strong>Manual</strong><br />
Index ............................................................................................................................................. 170<br />
DOC-M88-EXX191 V3.0 – 11.2012<br />
v
<strong>User</strong> <strong>Manual</strong><br />
<strong>Bruker</strong> AXS <strong>Measurement</strong> <strong>Suite</strong><br />
(intentionally left blank)<br />
vi<br />
DOC-M88-EXX191 V3.0 – 11.2012
<strong>Bruker</strong> AXS <strong>Measurement</strong> <strong>Suite</strong><br />
<strong>User</strong> <strong>Manual</strong><br />
<strong>Bruker</strong> AXS <strong>Measurement</strong> <strong>Suite</strong><br />
Introduction to <strong>Bruker</strong> AXS <strong>Measurement</strong> <strong>Suite</strong><br />
The <strong>Bruker</strong> AXS <strong>Measurement</strong> <strong>Suite</strong> is a set of software applications, implemented as a modular system.<br />
These are used to accomplish all essential measurement-related tasks with <strong>Bruker</strong> AXS analytical<br />
X-ray instruments. The suite of applications includes, for example, COMMANDER, JOBLIST, and<br />
START JOBS.<br />
The application modules are delivered as plug-ins loaded into a shell, which provides convenience<br />
and flexibility.<br />
The suite of applications forms the client component of a client-server system. In this manual the<br />
<strong>Bruker</strong> AXS <strong>Measurement</strong> <strong>Suite</strong> is often referred to as the “<strong>Measurement</strong> Client” and the server via<br />
which the modules communicate with the X-ray instruments is called the “<strong>Measurement</strong> Server”.<br />
The third component of the client-server system is the database into and from which the modules of<br />
the <strong>Bruker</strong> AXS <strong>Measurement</strong> <strong>Suite</strong> write and read information.<br />
System Configuration<br />
The <strong>Measurement</strong> Server, its related database and the <strong>Measurement</strong> Client can be used in different<br />
configurations depending on the needs of the user.<br />
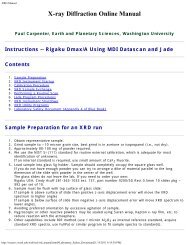
Standard Configuration<br />
In the standard configuration, single instances of the <strong>Measurement</strong> Server and the <strong>Measurement</strong> Client<br />
are run together with the database on a PC. This computer is connected to a single X-ray instrument<br />
via TCP/IP.<br />
DOC-M88-EXX191 V3.0 – 11.2012 1
<strong>User</strong> <strong>Manual</strong><br />
<strong>Bruker</strong> AXS <strong>Measurement</strong> <strong>Suite</strong><br />
Fig. 1:<br />
Standard configuration<br />
Extended Configuration<br />
If the measurement software is running in the extended configuration, one instance of the <strong>Measurement</strong><br />
Server is linked to several instruments. It can control several instruments at a time.<br />
The <strong>Measurement</strong> Server is linked to one or several instances of the <strong>Measurement</strong> Client via TCP/IP<br />
connections, which run on separate PCs.<br />
The database runs on a separate computer and is accessed directly by the <strong>Measurement</strong> instances.<br />
The advantage of this arrangement is that all instruments use the same database for instrument configuration,<br />
user management and the storage of measurement results.<br />
2<br />
DOC-M88-EXX191 V3.0 – 11.2012
<strong>Bruker</strong> AXS <strong>Measurement</strong> <strong>Suite</strong><br />
<strong>User</strong> <strong>Manual</strong><br />
Fig. 2:<br />
Extended configuration<br />
More complex configurations can include several instances of the <strong>Measurement</strong> Server. The instances<br />
share the same database.<br />
Emergency Operation<br />
<strong>User</strong>s can continue to perform essential tasks with some of the plug-in modules of the <strong>Measurement</strong><br />
Client if the database connection fails during start-up of the client.<br />
Emergency Operation in the Case of Database Failure<br />
If the connection to the database fails, it will be recognized by the <strong>Measurement</strong> Server and the<br />
<strong>Measurement</strong> Client. The system then automatically switches to its emergency operation mode. This<br />
means that the program will function without a database. Except in the case of the DATABASE MAN-<br />
AGEMENT plug-in, which will enable the user to perform all the tasks that can be accomplished with<br />
the plug-ins under normal operating conditions. However, the modules suffer a certain reduction in<br />
functionality. Data stored in the database, such as that relating to measurement methods or user<br />
rights, or the results of measuring operations, are no longer available. Without a connection to the<br />
database, such data can only be stored in the file system of the PC hosting the plug-in.<br />
Upon switching to emergency operation, the system assigns the name “Repair<strong>User</strong>”, to the user,<br />
which is displayed in the login window. The user must use this name to log in and must enter a special<br />
password supplied to him by the system administrator.<br />
Emergency Operation in the Case of System Failure<br />
If a working connection cannot be established with an instrument via the <strong>Measurement</strong> Server, a direct<br />
connection can be established and used by the TOOLS and CONFIG plug-ins. With this direct connection,<br />
these modules can be used normally.<br />
DOC-M88-EXX191 V3.0 – 11.2012 3
<strong>User</strong> <strong>Manual</strong><br />
<strong>Bruker</strong> AXS <strong>Measurement</strong> <strong>Suite</strong><br />
The <strong>Measurement</strong> Server<br />
General<br />
The <strong>Measurement</strong> Server regulates the data traffic between the <strong>Bruker</strong> X-ray instruments and instances<br />
of the <strong>Measurement</strong> Client with their plug-ins. It ensures that only one plug-in instance has<br />
control of an instrument at any one time. It also performs the scheduling of jobs to be executed on the<br />
instruments to which it is connected.<br />
Setting up the System with the <strong>Measurement</strong> Server<br />
Before using the <strong>Bruker</strong> AXS <strong>Measurement</strong> <strong>Suite</strong>, certain preliminary system settings must be made in<br />
the <strong>Measurement</strong> Server.<br />
To make these settings, start the <strong>Measurement</strong> Server and then right-click the symbol , which appears<br />
in the system tray at the bottom right of the screen. This will cause the start menu to appear.<br />
Fig. 3:<br />
<strong>Measurement</strong> Server start menu<br />
The functions of the start menu are explained in the following sections.<br />
Making Preliminary Settings for <strong>Measurement</strong> Server<br />
Before making the preliminary system settings in the <strong>Measurement</strong> Server, some preliminary settings<br />
for the <strong>Measurement</strong> Server itself are required. This is done using the item “Options” and the subitems<br />
“Common Options” and “Logging Options” of the start menu.<br />
Choose the sub-item “Common Options” to open the dialog box Common Options.<br />
Fig. 4:<br />
Dialog box Common Options<br />
4<br />
DOC-M88-EXX191 V3.0 – 11.2012
<strong>Bruker</strong> AXS <strong>Measurement</strong> <strong>Suite</strong><br />
<strong>User</strong> <strong>Manual</strong><br />
In this dialog box, check the check boxes to choose the options.<br />
Try to get instrument control at MS start-up: At start-up, the <strong>Measurement</strong> Server will always try to<br />
get control of the instrument(s) that it controlled at the end of the last session (see Section Getting and<br />
Releasing Control of and Reconnecting to Instruments on page 9).<br />
Check connections to known instruments in Instrument Selection dialog: Connections to known<br />
instruments will be automatically checked by the <strong>Measurement</strong> Server whenever the dialog box Select<br />
Instruments is opened (see Section Selecting the Instruments on page 6).<br />
The <strong>Measurement</strong> Server will call a “StandBy”- script after the last executed measurement and after<br />
a period that can be configured using the configuration-plugin. The script will perform actions like setting<br />
the generator voltage and current to standby values. It is possible to disable the calling of the<br />
script between a time period, e.g. during working hours. This requires the “Use time dependent<br />
standby values” setting to be active. Changed values are immediately recognized.<br />
Choosing the sub-item “Logging Options” opens the dialog box Logging Options.<br />
Fig. 5:<br />
Dialog box Logging Options<br />
This dialog box contains a series of options for the type of logging information provided in the LOG<br />
plug-in.<br />
Standard: Standard logging information will be provided in the LOG plug-in.<br />
Runtime, Communication and Instructions: Choosing one of these options will cause extra information<br />
to be provided. If “Communication” is chosen, for example, information relating to communication<br />
between the <strong>Measurement</strong> Client, the <strong>Measurement</strong> Server and the instruments will be provided<br />
in addition to the standard logging information.<br />
Choose the sub-item “Select database” to change the database configuration of the <strong>Measurement</strong><br />
Server. The dialog will only be editable if there is no instrument currently connected to the <strong>Measurement</strong><br />
Server. If you get a message box that tells you that there are currently instruments connected to<br />
the <strong>Measurement</strong> Server, please go to the “Select instruments” dialog and remove all instruments.<br />
Fig. 6:<br />
Dialog box Select Database<br />
When the Select Database dialog is opened, you can directly type in the IP address or the hostname<br />
of the database server and the port of the PostgreSQL server and click “Accept” to save the new values.<br />
DOC-M88-EXX191 V3.0 – 11.2012 5
<strong>User</strong> <strong>Manual</strong><br />
<strong>Bruker</strong> AXS <strong>Measurement</strong> <strong>Suite</strong><br />
After you have saved a new database configuration, please exit the <strong>Measurement</strong> Server and restart it<br />
so that the new settings are applied.<br />
If you do not know the exact connection data of your database server, you can press the “Search…”<br />
button that will open the “Database Search” dialog. In this dialog, you can select an IP address range<br />
that should be scanned for a running database server, the port of the database server and a timeout<br />
how long the Database Search should wait for a reply from each IP address. The first two bytes of the<br />
address range must always be the same as the fields for the start of the address range and the end of<br />
the address range to prevent very long durations of the search. The first 3 bytes are pre-filled with the<br />
first 3 bytes of your own network interface when you open the dialog.<br />
After you have clicked “Start Search”, the <strong>Measurement</strong> Server will try to connect to a running database<br />
on each IP address within the selected range. If the connection is successful, the IP address and<br />
hostname are listed in the selection list and you can select it. If you have found and selected the database<br />
server you want to connect to, click the Accept button and the connection data will get typed in to<br />
the “Select Database” dialog.<br />
Fig. 7:<br />
Dialog box Search Database<br />
Selecting the Instruments<br />
To select the instruments to be used, choose “Select instruments” in the start menu. This opens the<br />
dialog box Select instruments.<br />
6<br />
DOC-M88-EXX191 V3.0 – 11.2012
<strong>Bruker</strong> AXS <strong>Measurement</strong> <strong>Suite</strong><br />
<strong>User</strong> <strong>Manual</strong><br />
Fig. 8:<br />
Dialog box Select instruments – typical appearance when initially opened.<br />
This dialog box contains a table with the following columns:<br />
Source: Indicates whether the listed instruments are only known to the <strong>Measurement</strong> Server or<br />
whether they are known and have been entered in the database as well. Those of the first type are<br />
indicated by the word “broadcast” and those of the second type by the word “database”.<br />
Instrument: Lists all instruments known to the <strong>Measurement</strong> Server and found during the automatic<br />
search carried out when the dialog box is opened.<br />
Location: In this column the IP address and the port number of the instrument are displayed.<br />
MAC: The unique network id provided by the manufacturer of the network card<br />
Version: The reported firmware version for the instrument.<br />
Alive: Indicates whether the test connections were successfully established between the instruments<br />
and the <strong>Measurement</strong> Server. If the user has chosen the corresponding option using the item “Options”<br />
of the start menu (see Section Making Preliminary Settings for <strong>Measurement</strong> Server on page 4),<br />
an attempt to establish test connections is made automatically when the dialog box is opened.<br />
Assigned to: In this column the network name of the PC is displayed and hosts the instance of the<br />
<strong>Measurement</strong> Server to which the instrument has been assigned.<br />
Assign to this MS: Allows the user to select an instrument and assign it to the present instance of the<br />
<strong>Measurement</strong> Server. After checking the appropriate box in this column, click on the Accept button<br />
(see below) to make the assignment. The network name of the PC hosting the <strong>Measurement</strong> Server<br />
instance is then displayed in the “Assigned to” column.<br />
Assigning an instrument with “broadcast” status to the <strong>Measurement</strong> Server instance causes the instrument<br />
to be registered in the database (and thus changes its status). At the same time, the particular<br />
<strong>Measurement</strong> Server instance is also entered in the database if it has not already been registered<br />
there. Instruments and <strong>Measurement</strong> Server instances can also be entered in the database directly<br />
using the DATABASE MANAGEMENT plug-in (see Section Entering and Deleting Devices in/from the<br />
Database on page 20).<br />
The Assign to this MS column can also be used to deselect instruments. To do this, delete the check<br />
mark from the appropriate box by clicking it on and then clicking on the Accept button. The network<br />
name of the PC hosting the instance of the <strong>Measurement</strong> Server to which the instrument has been<br />
assigned will disappear from the “Assigned to” column.<br />
DOC-M88-EXX191 V3.0 – 11.2012 7
<strong>User</strong> <strong>Manual</strong><br />
<strong>Bruker</strong> AXS <strong>Measurement</strong> <strong>Suite</strong><br />
It is only possible to connect to an instrument with a minimal required firmware version that is<br />
shown above the table. Lines with instruments having a firmware below the needed version are painted<br />
with a light red background color.<br />
The buttons below the table have the following functions:<br />
Accept is used in conjunction with the functionality of the “Assign to me” column to assign instruments<br />
to the present instance of the <strong>Measurement</strong> Server. It can also be used to deselect instruments.<br />
When the Accept button is activated, an attempt is made to establish a connection between the selected<br />
instrument and the <strong>Measurement</strong> Server. Whether this attempt is successful or not is shown in<br />
the dialog box Status window (see following section.)<br />
When an instrument using this button is deselected, the connection between the instrument and the<br />
<strong>Measurement</strong> Server is interrupted.<br />
Search is used to carry out additional searches for known instruments.<br />
Cancel allows the user to exit the dialog box. When the user exits the dialog box, all data entered<br />
during the present session, but not saved using the Accept button, will be deleted.<br />
Fig. 8 shows the dialog box Select instruments as it typically appears when opened for the first time.<br />
In this case many instruments are known but have not yet been entered in the database. This is indicated<br />
by the “Broadcast” entry in the first column. Likewise, no instrument has yet been assigned to<br />
the <strong>Measurement</strong> Server. Test connections were successfully established to all the instruments.<br />
Fig. 9:<br />
Dialog box Select instruments – typical appearance after two instruments have been selected<br />
Fig. 9 shows the same dialog box as it typically appears after two instruments have been selected.<br />
The two selected instruments may have been entered in the database after being selected during the<br />
present session or a previous session, or database registration may have been performed using the<br />
DATABASE MANAGEMENT plug-in. The unselected instruments may have been entered in the database<br />
after being selected during the present session or a previous session, and subsequently deselected,<br />
or they may have been simply entered in the database using DATABASE MANAGEMENT.<br />
The user can also work with this dialog box without using a mouse by scrolling through the rows using<br />
the arrow keys ↑ and ↓. The check boxes in the “Assign to me” column can be checked using the<br />
space bar. Accept can be activated with and Search with . The user can exit the<br />
dialog box using .<br />
8<br />
DOC-M88-EXX191 V3.0 – 11.2012
<strong>Bruker</strong> AXS <strong>Measurement</strong> <strong>Suite</strong><br />
<strong>User</strong> <strong>Manual</strong><br />
Getting and Releasing Control of and Reconnecting to Instruments<br />
Getting control of the instruments the user wants to work with, releasing control of them, and reestablishing<br />
faulty connections is done using the dialog box Status window. This is done by selecting “Status<br />
window” in the start menu. This dialog box also provides information relating to connections and<br />
can be used to monitor jobs being executed on the instruments.<br />
Fig. 10: Dialog box Status window<br />
The table in the upper part of the dialog box contains the following columns:<br />
Instrument: Contains a list of the selected instruments.<br />
Control: Indicates whether the <strong>Measurement</strong> Server has control of each selected instrument.<br />
Status: It is possible to see whether a connection exists between the <strong>Measurement</strong> Server and the<br />
instrument. Connections are established when instruments are assigned to the <strong>Measurement</strong> Server<br />
in the dialog box Select instruments.<br />
Current job: In this column the ID of the job being currently executed is displayed.<br />
Sample pos.: Indicates the position of the sample belonging to the current job in the magazine or<br />
loading tray. In the case of wafers, the samples are held in cassettes or front-opening unified pods.<br />
Created by: In this column the name of the client that created the job is displayed.<br />
Progress: Shows the progress of the measurement from 1 to 100.<br />
Scan mode: Indicates the scan mode of the scan currently being executed.<br />
The buttons below the table have the following functions:<br />
Get control allows the user to get control of an instrument. If the corresponding option has been chosen<br />
by the item “Options” of the start menu (see Section Making Preliminary Settings for <strong>Measurement</strong><br />
Server on page 4), an attempt to obtain control of all the selected instruments is automatically made at<br />
each start-up of the <strong>Measurement</strong> Server. If control of one or more instruments has not been obtained,<br />
another attempt can be made using this button.<br />
DOC-M88-EXX191 V3.0 – 11.2012 9
<strong>User</strong> <strong>Manual</strong><br />
<strong>Bruker</strong> AXS <strong>Measurement</strong> <strong>Suite</strong><br />
The control state can also be changed by clicking on the “Control” check box which will toggle the<br />
state.<br />
An attempt to get control will fail if control has been given to another instance of the <strong>Measurement</strong><br />
Server or an instance of the TOOLS plug-in or CONFIG plug-in. These plug-ins are capable of communicating<br />
directly with the instruments in emergency operation (see Section Emergency Operation<br />
on page 3). Notice of failure and a description of the cause are given in a pop-up window.<br />
Release control allows the user to release control of an instrument. When control of an instrument is<br />
released, it is made available for use by another instance of the <strong>Measurement</strong> Server or by an instance<br />
of the TOOLS or CONFIG plug-in for direct communication with the instrument.<br />
Reconnect allows the user to establish or reestablish a faultless connection between the <strong>Measurement</strong><br />
Server and the instrument. In the case of existing connections, which are faulty, the connection<br />
is broken and then reestablished. In the case of non-existing connections, an attempt is made to establish<br />
a working connection.<br />
The current instrument configuration and actual values can be saved in a file with the ending “biml”.<br />
The file can be used by the wizard.<br />
Pressing the “Stop Drives” button will force all drives to stop immediately.<br />
“Safety board reset” shows a password dialog and allows resetting the safety board.<br />
The “Statistics” panel which is located in the lower part of the dialog box consists of the following<br />
sections:<br />
Error messages<br />
Error messages relating to the connections between the <strong>Measurement</strong> Server and the instruments are<br />
displayed in this section. If, for example, an attempt to reestablish a connection fails, a corresponding<br />
error message is displayed in the data field.<br />
Network packets<br />
This section provides information on the number of data packets received or sent by the <strong>Measurement</strong><br />
Server from or to an instrument from the time the connection was established. In addition, the average<br />
time between sending a request and receiving an answer is given.<br />
To get this information, highlight the particular instrument in the table using the selection bar. This<br />
information will appear in the data fields.<br />
The Reset counters button at the bottom of this section is used to reset the values to zero.<br />
Job scheduler status<br />
This section displays information relating to the job scheduler controlled by the <strong>Measurement</strong> Server.<br />
It contains the following fields:<br />
Status indicates whether the scheduler is idle or active, i.e., whether a job is being executed or not.<br />
Error message displays information relating to a scheduler malfunction.<br />
The button Clear error state below these fields is used to try to correct a scheduler malfunction. If<br />
possible, the scheduler is restarted. If the error reoccurs, the error message will reappear.<br />
Other Options of the Start Menu<br />
Except for the options described above, the start menu of the <strong>Measurement</strong> Server contains the options<br />
Connected Clients and About.<br />
Connected Clients<br />
The option Connected Clients opens the dialog box Connected clients.<br />
10<br />
DOC-M88-EXX191 V3.0 – 11.2012
<strong>Bruker</strong> AXS <strong>Measurement</strong> <strong>Suite</strong><br />
<strong>User</strong> <strong>Manual</strong><br />
Fig. 11: Dialog box Connected clients<br />
The <strong>Measurement</strong> Clients in this dialog box are listed in table form. This means that the plug-ins of the<br />
<strong>Bruker</strong> AXS <strong>Measurement</strong> <strong>Suite</strong>, which are currently connected to a selected instrument are listed.<br />
The columns contain the following information:<br />
Name: Contains a list of the connected clients.<br />
Host: Name of computer hosting the client.<br />
Instrument/Channel: Name of selected instrument or “Binary channel” for a fast binary connection.<br />
Control: Indicates which client currently has control of the instrument.<br />
Connected: Indicates which clients are currently connected to the instrument.<br />
Received and Sent: Indicates how many data packets have been sent and received by the <strong>Measurement</strong><br />
Server to and from each client from the time the connection was established.<br />
Reset: Resets the values shown in the Received and Sent columns to zero.<br />
About<br />
The option “About” in the menu opens an information window containing basic <strong>Measurement</strong> Server<br />
data.<br />
Fig. 12: About window<br />
DOC-M88-EXX191 V3.0 – 11.2012 11
<strong>User</strong> <strong>Manual</strong><br />
<strong>Bruker</strong> AXS <strong>Measurement</strong> <strong>Suite</strong><br />
The <strong>Measurement</strong> Client<br />
General<br />
The <strong>Measurement</strong> Client consists of a set of application modules that allows the user to, make system<br />
settings in the database, configure the components of a <strong>Bruker</strong> AXS X-ray instrument, perform instrument<br />
set-up, create and start jobs, monitor the processing of jobs, view the results of measurements in<br />
chart form in real time, diagnose faults and malfunctions and carry out “repairs” on impaired components,<br />
and view records of user actions and system events.<br />
NOTE<br />
The modules which are used depend on the type of <strong>Bruker</strong> AXS X-ray instrument, its operation and<br />
application. Modules for tasks other than those described above may be delivered, as well.<br />
The Plug-in Concept<br />
The <strong>Bruker</strong> AXS plug-in technology permits convenient and flexible use of the application modules.<br />
These are loaded as plug-ins into a shell, which provides quick and easy access to their user interfaces.<br />
The user can switch between the modules freely with a minimum risk of error in the handling of<br />
data. The shell facilitates the exchange of data between the modules. Only one connection to the instrument<br />
needs to be established. This connection can be shared by other plug-ins.<br />
The shell is extendable and can accommodate any number of plug-ins depending on the user’s needs.<br />
Logging In and Out<br />
All users of the <strong>Bruker</strong> AXS <strong>Measurement</strong> <strong>Suite</strong> must be entered in the database and assigned to a<br />
user group before logging in. These preliminary tasks are performed by the Lab Manager and/or the IT<br />
Administrator, who are each given a default password. Passwords can be changed when logging in<br />
for the first time.<br />
Once user rights have been assigned, the user can log into the software system by clicking on the<br />
<strong>Measurement</strong> <strong>Suite</strong> exe file or a corresponding icon on the desktop. This opens the login window.<br />
Fig. 13: Log-in window with drop-down list of user groups<br />
Click on the button in the Login Name data field to open the drop-down list of user groups. Select the<br />
user group the user belongs to and enter the password that has been assigned by the Lab Manager or<br />
the IT Administrator.<br />
Shell Interface<br />
The user interface of the shell is divided into two main parts. On the left side the navigation bar containing<br />
icons represents the plug-ins currently loaded in the shell. To the right of the navigation bar<br />
there is an area where the interfaces of the loaded plug-ins can be displayed as tab pages. The tabs<br />
for the plug-ins are located above this area in a row. To display the interfaces click on these tabs.<br />
Alternatively, the interfaces will be displayed by clicking on the plug-in icons in the navigation bar.<br />
12<br />
DOC-M88-EXX191 V3.0 – 11.2012
<strong>Bruker</strong> AXS <strong>Measurement</strong> <strong>Suite</strong><br />
<strong>User</strong> <strong>Manual</strong><br />
Fig. 14: <strong>User</strong> interface of shell<br />
Status Bar<br />
Located at the bottom of the screen a status bar with status information is displayed. This includes,<br />
icons indicating the current status of the X-ray tube (On/Off) and the tube shutter (Open/Close) of the<br />
connected instrument (see Section Fehler! Verweisquelle konnte nicht gefunden werden. on<br />
page Fehler! Textmarke nicht definiert.) at the left end of the status bar. To the right of these icons,<br />
system errors and warnings are displayed. Further to the right the current values of the X and Y axes<br />
will appear when COMMANDER is used (see Chapter COMMANDER on page 96).<br />
Menus of Shell Interface<br />
The menu bar of the shell interface contains a series of menus which varies according to the plug-in<br />
currently used. The first four menus File, Edit, Help and Window in the menu bar are common to all<br />
plug-ins. The other menus are plug-in-specific and appear only when the plug-ins to which they belong<br />
are opened.<br />
The File menu can offer, in addition to options available for all plug-ins, additional options for a specific<br />
plug-in or plug-ins, depending on the set of modules actually loaded in the shell.<br />
The Edit menu can only be opened from certain plug-ins.<br />
The Help menu provides copyright, license, system and other information relating to the use of <strong>Bruker</strong><br />
AXS software. The information, with information on the status of the currently connected instrument,<br />
can be saved into a file.<br />
The Window menu allows the user to navigate between the plug-ins.<br />
The File Menu<br />
The file menu is located in the menu bar at the top of the screen and is available for all plug-ins.<br />
DOC-M88-EXX191 V3.0 – 11.2012 13
<strong>User</strong> <strong>Manual</strong><br />
<strong>Bruker</strong> AXS <strong>Measurement</strong> <strong>Suite</strong><br />
Fig. 15: File menu (without DATABASE MANAGEMENT and COMMANDER-specific items)<br />
The File menu contains the following options:<br />
<strong>User</strong> Log Out allows the user to transfer the plug-in to another user without having to close down the<br />
shell. Choosing this item opens a log-in window. The new user is required to enter his log-in data in<br />
this window as usual.<br />
Application identifies the results of a measurement as belonging to a certain type of measurement<br />
when they are saved to a results file. This is taken into account by the evaluation software.<br />
In addition, , the selection of an application determines the names of drives listed in the Drive Control<br />
area of COMMANDER and the component tree of TOOLS since the names of certain drives are application-specific.<br />
Save State saves the instrument status in addition to general information into a Zip file (see section<br />
The Help Menu for details).<br />
Connect and Disconnect are used to connect with and disconnect from an instrument (see Section<br />
Getting a Connection to an Instrument with the <strong>Measurement</strong> Client on page 15).<br />
Exit is used to exit the shell.<br />
The File menu can be extended to include functions for a specific plug-in or plug-ins.<br />
The Help Menu<br />
The Help menu provides copyright, license, system and other information relating to the use of <strong>Bruker</strong><br />
AXS software. It also allows the user to save this information with details of the status of the currently<br />
connected instrument to a Zip file. which can be sent to <strong>Bruker</strong> Service for analysis in the event of a<br />
malfunction or the file can be opened later for analytical purposes.<br />
14<br />
DOC-M88-EXX191 V3.0 – 11.2012
<strong>Bruker</strong> AXS <strong>Measurement</strong> <strong>Suite</strong><br />
<strong>User</strong> <strong>Manual</strong><br />
Fig. 16: Dialog About<br />
System Info: This button opens the system information dialog box. The system information can be<br />
saved into a NFO file using the Save option of the File menu within this box.<br />
Save: This button saves information relating to the use of <strong>Bruker</strong> software, as well as an overview of<br />
the status of the currently connected instrument. This information can be saved in a Zip file. The overview<br />
of the instrument status can be displayed in some plug-ins.<br />
Getting a Connection to an Instrument with the <strong>Measurement</strong> Client<br />
Before working with one of the plug-ins of the <strong>Measurement</strong> Client a connection to the instrument with<br />
which the user wants to work must be established if this connection does not already exist. A direct<br />
connection with CONFIG or TOOLS may be preferred, when establishing a direct connection to an<br />
instrument.<br />
Getting an Indirect Connection to an Instrument by Browsing the Database<br />
When the shell is opened, the system automatically attempts to establish a connection using the<br />
<strong>Measurement</strong> Server to/with the instrument which was used in the last session. If this attempt fails, or<br />
if the user prefers to change the instrument with which he is working, or if he prefers a connection<br />
to/with an instrument for the first time, select File Connect to open the dialog box Connection.<br />
Fig. 17: Dialog box Connection<br />
In this dialog box the IP address and port of a <strong>Measurement</strong> Server are displayed in the extendable<br />
Device field, the names of the instrument(s) that has/have been assigned to it are also displayed.<br />
DOC-M88-EXX191 V3.0 – 11.2012 15
<strong>User</strong> <strong>Manual</strong><br />
<strong>Bruker</strong> AXS <strong>Measurement</strong> <strong>Suite</strong><br />
If the instrument to be used is assigned to this <strong>Measurement</strong> Server, select its name in the Device<br />
field and click on the Connect button to establish a connection.<br />
If the instrument to be selected has been assigned to another instance of the <strong>Measurement</strong> Server,<br />
double-click on the Browse button in the bottom right corner of the dialog box to browse the database.<br />
(Alternatively, click on the button to the right of the Browse button and select “Database” in the<br />
resulting drop-down menu.) This opens a pop-up window containing a list of all the <strong>Measurement</strong><br />
Servers entered in the database.<br />
Fig. 18: Pop-up window Browse database<br />
Here the <strong>Measurement</strong> Server can be selected to which the instrument to be used has been assigned<br />
(see Section Selecting the Instruments on page 6). Mark the <strong>Measurement</strong> Server name with a mouse<br />
click. Then click on the Select button. The pop-up window will disappear and the dialog box Connection<br />
will reappear. In the extendable Device field of the dialog box the name(s) of the instrument(s)<br />
assigned to the selected instance of the <strong>Measurement</strong> Server will now be displayed. In the IP address<br />
and port fields the address data of the newly selected <strong>Measurement</strong> Server instance will be displayed,<br />
as well.<br />
Finally, select the instrument to be used from the Device field and click on the Connect button in the<br />
dialog box to establish a connection with the selected instrument.<br />
Getting a Direct or Indirect Connection to an Instrument by Browsing the UDP Network<br />
Getting a direct connection to an instrument requires special user rights. If the user does not have<br />
these rights, the system will display an error message when the user tries to establish a connection.<br />
To establish a direct connection, select “Network” in the drop-down menu of the dialog box Connection<br />
as described above. Selecting “Network” opens the dialog box Browse network.<br />
Fig. 19: Dialog box Browse network<br />
All of the instruments which have been contacted directly using the network are listed in the dialog box<br />
in table form. The instruments contacted via a <strong>Measurement</strong> Server are listed. The dialog box contains<br />
the following columns:<br />
Direct Connect: Indicates which instruments have been contacted directly over the network. Those<br />
contacted directly are marked with a check mark.<br />
16<br />
DOC-M88-EXX191 V3.0 – 11.2012
<strong>Bruker</strong> AXS <strong>Measurement</strong> <strong>Suite</strong><br />
<strong>User</strong> <strong>Manual</strong><br />
IP address: Contains the IP addresses of instruments that have been contacted directly and IP addresses<br />
of <strong>Measurement</strong> Server instances through which instruments have been contacted indirectly.<br />
<strong>Measurement</strong> Server name: Contains the names of the <strong>Measurement</strong> Server instances, through<br />
which instruments specified in the Instrument name column have been contacted. Instruments, which<br />
have been contacted directly, are marked “instrument”.<br />
Instrument name: Contains a list of all instruments that have been contacted directly and indirectly<br />
over the network.<br />
Description: Contains a description of the instrument or the <strong>Measurement</strong> Server through which the<br />
instrument has been contacted.<br />
To establish a direct connection to one of the instruments which has been contacted directly, mark<br />
the specific instrument, using the left mouse button and then press the right mouse button. The singleitem<br />
menu<br />
will appear. Click on this menu to select the instrument. The dialog box<br />
Connection reappears with the name of the instrument in the Device field and the IP address and port<br />
of the instrument in the upper fields. Click on the connect button to establish a direct connection with<br />
the instrument.<br />
Alternatively, the user can select an instrument by marking it and clicking on the Select button in the<br />
bottom left corner of the dialog box.<br />
To get an indirect connection to an instrument by browsing the network, proceed in the same way as<br />
in a direct connection. However, select an instrument with which contact has been made through a<br />
<strong>Measurement</strong> Server instance. This instrument will not be identified by a check mark in the rightmost<br />
column.<br />
In this case, the instrument name appears in the dialog box Connection with the address data of the<br />
related <strong>Measurement</strong> Server. Click on the Connect button to establish the connection with the instrument.<br />
During the connection to the <strong>Measurement</strong> Server that controls the selected instrument, the <strong>Measurement</strong><br />
Client will check if the <strong>Measurement</strong> Server is running with the same database as the <strong>Measurement</strong><br />
Client. If the <strong>Measurement</strong> Server is running on a different database, the <strong>Measurement</strong> Center<br />
will change its configuration to the same database server as the <strong>Measurement</strong> Server. In such a<br />
case, the <strong>Measurement</strong> Client will have to restart so that the change of the database configuration can<br />
get applied. A message box will show up inform you about this.<br />
Use the Search button in the bottom right-hand corner of the dialog box Browse network to initiate<br />
new searches via the network for the instruments.<br />
Breaking a Connection with an Instrument<br />
To break an existing connection with an instrument, select File Disconnect.<br />
DOC-M88-EXX191 V3.0 – 11.2012 17
<strong>User</strong> <strong>Manual</strong><br />
<strong>Bruker</strong> AXS <strong>Measurement</strong> <strong>Suite</strong><br />
DATABASE MANAGEMENT<br />
General<br />
The DATABASE MANAGEMENT plug-in is divided into the sections: Instrument Configuration, <strong>User</strong><br />
Management, Audit Trail, General Settings and Database Maintenance.<br />
Instrument Configuration is used to maintain basic settings for X-ray instruments and the <strong>Measurement</strong><br />
Server instance or instances to which they have been assigned. In this section the user can also<br />
manage the configurations that can be applied to instruments and their components.<br />
<strong>User</strong> Management is used to view and manage user data and user and group rights.<br />
Audit Trail provides a list of user actions that have been logged in the database.<br />
General Settings allows the user to maintain general system settings. This section also provides functionality<br />
that allows database backups and, if required, restores the database after such a backup has<br />
been made.<br />
Finally, Database Maintenance is used to copy or move Experiment data or log file data to a backup<br />
database. Thus, obsolete data are removed from the working database, to increase the speed of the<br />
database operation.<br />
Screen Layout and Operation<br />
The user interface of the DATABASE MANAGEMENT plug-in consists of tab pages corresponding to<br />
the different sections of the plug-in. The sections are accessed by tabs located at the bottom of the<br />
screen.<br />
Instrument Configuration<br />
The Instrument Configuration page contains two windows: Controlled Devices and Instrument Configurations.<br />
In the first of these windows there is a table containing basic settings for the <strong>Measurement</strong><br />
Server instance or instances and for the assigned instruments in each case. The second window contains<br />
a table in which information on the configurations is displayed. This information can be used by<br />
each instrument.<br />
18<br />
DOC-M88-EXX191 V3.0 – 11.2012
<strong>Bruker</strong> AXS <strong>Measurement</strong> <strong>Suite</strong><br />
<strong>User</strong> <strong>Manual</strong><br />
Fig. 20: Instrument Configuration page<br />
Controlled Devices Window<br />
The table in the Controlled Devices window has the following columns:<br />
Device ID: The unique ID of the device can be an instrument or a <strong>Measurement</strong> Server. The ID is<br />
generated by the database.<br />
Device Name: The name of the device. This name can be changed by the user.<br />
Network Name/Address: The network name or the IP address of the device.<br />
Device Description: In this column an accurate description of the device should be entered.<br />
Active: If the check boxes in this column are marked, an attempt to get control of the corresponding<br />
instrument will be made at each start-up of the <strong>Measurement</strong> Server to which the instrument has been<br />
assigned. Unmark the check box if the instrument is to be ignored by the <strong>Measurement</strong> Server at startup.<br />
Advanced Settings: If this check box is marked at the top right of the screen, three additional columns<br />
with their information will be added to the table. These columns include the TCP/IP Port, the<br />
“Assigned to <strong>Measurement</strong> Server” entry, and the “Is Instrument” check box.<br />
TCP/IP Port: The port at which the instrument or <strong>Measurement</strong> Server listens for connections. Instruments<br />
listen by default at port 4284, while <strong>Measurement</strong> Servers listen at port 1904.<br />
Assigned to <strong>Measurement</strong> Server: The name or the IP address of the <strong>Measurement</strong> Server to which<br />
the instrument has been assigned.<br />
DOC-M88-EXX191 V3.0 – 11.2012 19
<strong>User</strong> <strong>Manual</strong><br />
<strong>Bruker</strong> AXS <strong>Measurement</strong> <strong>Suite</strong><br />
Is Instrument: This column contains check boxes indicating whether the corresponding device is an<br />
instrument or <strong>Measurement</strong> Server. An unchecked check box means that the device is a <strong>Measurement</strong><br />
Server.<br />
NOTE<br />
To change the settings in the Controlled Devices table, the user right “Change Software Configuration”<br />
is required.<br />
Entering and Deleting Devices in/from the Database<br />
Entering Devices in the Database<br />
As explained in the Section Instrument Configuration above, instruments are entered in the database<br />
automatically when they are assigned to a <strong>Measurement</strong> Server instance using the dialog box Select<br />
Instruments of the particular <strong>Measurement</strong> Server instance. At the same time, this <strong>Measurement</strong><br />
Server instance will be entered in the database if it has not already been registered there. Once devices<br />
have been entered as described, they will appear in the Controlled Devices table.<br />
Instruments and <strong>Measurement</strong> Server instances can also be entered directly in the database by adding<br />
them to the list of devices in the Controlled Devices table. Enter the relevant information for the<br />
new instrument or <strong>Measurement</strong> Server instance in the empty row at the bottom of the list. Click on the<br />
Save changes button at the bottom right of the window to store the new information in the database<br />
and then restart the <strong>Measurement</strong> Server.<br />
NOTE<br />
Any changes made in the Controlled Devices table will not be stored in the database until they are<br />
saved and the <strong>Measurement</strong> Server is restarted!<br />
Deleting Devices from the Database<br />
A device can be deleted by right-clicking on the appropriate row in the Controlled Devices table. When<br />
this is done, a context menu appears. Click on “Delete devices” to delete the device and its configurations<br />
from the database.<br />
NOTE<br />
To change the settings in the Controlled Devices table, the user right “Change Software Configuration”<br />
is required.<br />
Instrument Configurations Window<br />
The Instrument Configurations window contains a table listing all configurations applicable to a selected<br />
instrument. These configurations have been entered in the database using CONFIG.<br />
An instrument can be assigned an unlimited number of configurations, but at any one time only one<br />
configuration can be the active configuration.<br />
To display the configurations for an instrument, select the instrument by marking its device ID in the<br />
Controlled Devices window.<br />
The Instrument Configurations table contains the following columns:<br />
Instrument Configuration ID: This column contains the unique ID of the instrument configuration.<br />
This ID is created by the database.<br />
Description: An accurate description of the instrument configuration should be entered.<br />
Last Modified: Date/time of the last change to the configuration.<br />
20<br />
DOC-M88-EXX191 V3.0 – 11.2012
<strong>Bruker</strong> AXS <strong>Measurement</strong> <strong>Suite</strong><br />
<strong>User</strong> <strong>Manual</strong><br />
Active: The check box in this column should be marked to activate the configuration. Only one configuration<br />
can be active at one time.<br />
The Save Changes button to the right below the Instrument Configurations window allows the user to<br />
save the changes to the database.<br />
The Download to Instrument button loads the selected conGroup Rights Conceptfiguration into the<br />
firmware of the appropriate instrument and restarts the instrument in order to activate the configuration.<br />
NOTE<br />
To change the settings in the Instrument Configurations table, the user right “Change Software Configuration”<br />
is required.<br />
Deleting Configurations<br />
A configuration can be deleted by right-clicking on the appropriate row in the Instrument Configurations<br />
table. In this case a context menu will appear. Click on “Delete Configuration” to delete the instrument<br />
configuration.<br />
<strong>User</strong> Management<br />
The <strong>User</strong> Management page allows the user to manage the access rights of users and the user<br />
groups to which they are assigned. New users can be created and granted user rights by assigning<br />
them to one or several groups.<br />
The <strong>User</strong> Management page contains two tables: <strong>User</strong>s and Groups. These are described in detail in<br />
the following sections.<br />
NOTE<br />
To change the settings of the <strong>User</strong> Management page, the user rights “Create <strong>User</strong>”, “Delete <strong>User</strong>”<br />
and “Modify <strong>User</strong>” are required.<br />
<strong>User</strong> and Group Rights Concept<br />
The user and group rights concept implemented in the <strong>Measurement</strong> <strong>Suite</strong> software is similar to that of<br />
the Windows operating system. However, the groups, group rights and user rights are independent of<br />
those of the Windows operating system. This means that users and groups used in the <strong>Measurement</strong><br />
<strong>Suite</strong> have to be specially created. They do not have any relevance for the operating system users.<br />
The software is delivered with a set of predefined groups and users.<br />
Groups: Groups are assigned group rights. The rights of a particular group are given to all users who<br />
are members of this group.<br />
<strong>User</strong>s: <strong>User</strong>s can be members of several groups and inherit all rights from these groups.<br />
<strong>User</strong>s Table<br />
The <strong>User</strong>s table contains a list of users, their user IDs, passwords, login names, and the user groups<br />
to which they have been assigned. In this table users can be added and deleted, user properties can<br />
be changed, new users can be assigned to user groups, and the user groups to which existing users<br />
belong can be changed.<br />
DOC-M88-EXX191 V3.0 – 11.2012 21
<strong>User</strong> <strong>Manual</strong><br />
<strong>Bruker</strong> AXS <strong>Measurement</strong> <strong>Suite</strong><br />
Fig. 21: <strong>User</strong> Management page<br />
The table contains the following columns:<br />
<strong>User</strong> ID: The unique ID of the user. The ID is created by the database.<br />
Login Name: The login name of the user. The login names are displayed in the login dialog when the<br />
software is started, or if the function Change <strong>User</strong> has been selected.<br />
Limitation: The login name of the <strong>Bruker</strong> Service user cannot be changed.<br />
First Name: The first name of the user.<br />
Last Name: The last name of the user.<br />
Group Memberships: In this column all available groups are displayed. <strong>User</strong>s can be added to and<br />
removed from groups.<br />
To assign a new user to a group or groups, or to assign an existing user to an extra group or groups,<br />
left-click on the corresponding cell in this column. The following context menu will appear.<br />
22<br />
DOC-M88-EXX191 V3.0 – 11.2012
<strong>Bruker</strong> AXS <strong>Measurement</strong> <strong>Suite</strong><br />
<strong>User</strong> <strong>Manual</strong><br />
Fig. 22: Context menu Group membership<br />
Select the appropriate group or groups from this menu, click on OK. The group or groups will appear<br />
in the Group Memberships column alongside the user’s name.<br />
Limitation: The <strong>Bruker</strong> Service group can only be assigned to a user if the logged-in operator is a<br />
member of the <strong>Bruker</strong> Service group.<br />
Password: In this column a user’s password can be changed.<br />
Active: If the check box in this column is unchecked, the user account can be temporarily disabled.<br />
Adding new users<br />
To create a new user, enter the relevant information in the empty row at the bottom of the table. The<br />
<strong>User</strong> ID is 0 as long as the user’s information is not saved in the database.<br />
Save Changes: This button becomes active if there are unsaved changes in the table.<br />
Deleting <strong>User</strong>s and Storing Additional <strong>User</strong> Data<br />
To delete users or enter additional user data and maintain user profiles, right-click on the table to get<br />
the following context menu:<br />
This context menu offers the following options:<br />
Delete <strong>User</strong>: Deletes the selected user from the database<br />
Limitations:<br />
<br />
<br />
The <strong>Bruker</strong> Service user cannot be deleted.<br />
At least one user with the group membership Lab Manager is required. If the selected user is<br />
the last member of this group, the account cannot be deleted.<br />
Properties: This opens the dialog box <strong>User</strong> properties.<br />
DOC-M88-EXX191 V3.0 – 11.2012 23
<strong>User</strong> <strong>Manual</strong><br />
<strong>Bruker</strong> AXS <strong>Measurement</strong> <strong>Suite</strong><br />
Fig. 23: Dialog box <strong>User</strong> properties<br />
Some of the properties in this dialog box are the same as those in the <strong>User</strong>s table. Changing them<br />
here also changes them in the <strong>User</strong>s table.<br />
In addition, the user’s email address, postal address, phone/fax numbers and employee ID can be<br />
stored. The dialog box also contains a memo field in which additional text information can be entered<br />
and stored.<br />
Limitations: The user with the <strong>Bruker</strong> Service login name cannot change his login name or password.<br />
The Profile panel<br />
This panel allows the user to maintain one or several user profiles. Each user can have an unlimited<br />
number of user profiles. Only one profile can be active at a time. The user profile allows storage of<br />
user interface settings of the plug-ins or a user-specific path to measurement method files (measurement<br />
methods are also called “experiments” in the software) or result files, etc..<br />
The panel contains the following data fields:<br />
<strong>Measurement</strong> Methods: This enables the user to have his own individual path to the measurement<br />
methods directory independently of the default settings made in the General Settings window of the<br />
General Settings page (see Section General Settings Window on page 29).<br />
Result Files: As for the data field <strong>Measurement</strong> Methods above.<br />
Scripts Directory: As for the data field <strong>Measurement</strong> Methods above.<br />
The buttons in the Profile panel have the following functions:<br />
New: Use this button to create a new profile. Click it on, and a dialog box will appear:<br />
24<br />
DOC-M88-EXX191 V3.0 – 11.2012
<strong>Bruker</strong> AXS <strong>Measurement</strong> <strong>Suite</strong><br />
<strong>User</strong> <strong>Manual</strong><br />
Fig. 24: Dialog box Create a new profile<br />
Enter a unique name in the dialog box and click on OK. The new profile becomes the active profile in<br />
the Profile panel.<br />
Delete: Click on this button to delete the selected profile and all the user-specific settings it contains. If<br />
the default profile is deleted and the dialog box <strong>User</strong> properties is opened again, a new profile with<br />
the name “Default Profile” will be created and used automatically.<br />
Fig. 25: Dialog box Delete a profile<br />
Rename: This button is used to rename the active profile. Enter a new unique name in the related<br />
dialog box and click on OK.<br />
Fig. 26: Dialog box Rename a profile<br />
Groups Table<br />
The Groups table lists all user groups and indicates the number of access rights assigned to them.<br />
These rights are defined in the database. Groups can be added and removed, and the user rights of a<br />
group can be changed.<br />
The table has the following columns:<br />
Group ID: The unique ID of a group. Created by the database.<br />
Group Name: The unique name of a group. If a group is added to the table and a group with this<br />
name already exists, an error message will be displayed.<br />
Limitations: The group names <strong>Bruker</strong> Service and Lab Managers cannot be changed. The Lab Managers<br />
group is the highest group available to the customer. The <strong>Bruker</strong> Service group is the highest<br />
group available to <strong>Bruker</strong> Service personnel.<br />
Description: A description of the group including, for example, its access rights.<br />
Access Rights: Left-clicking on a cell in this column opens the context-sensitive dialog box Assign<br />
group rights for group: [name of group] (see following section).<br />
DOC-M88-EXX191 V3.0 – 11.2012 25
<strong>User</strong> <strong>Manual</strong><br />
<strong>Bruker</strong> AXS <strong>Measurement</strong> <strong>Suite</strong><br />
Last Modified: Date and time of the last modification to the group.<br />
Adding or Removing Rights to/from a <strong>User</strong> Group<br />
The user can add or remove rights to and from a user group by using the context-sensitive dialog box<br />
Assign group rights for group: [name of group], which is obtained by left-clicking on the appropriate<br />
cell in the Access Rights column of the Groups table.<br />
Fig. 27: Dialog box Assign group rights for group: [name of group]<br />
This dialog box contains a table listing all the available rights and their descriptions<br />
To add a right to the group, simply check the appropriate check box in the Right Granted column and<br />
click on OK. Rights are removed from groups by unchecking the check boxes.<br />
Rights highlighted in grey cannot be added to or removed from the group.<br />
Deleting a <strong>User</strong> Group<br />
Delete a user group by first selecting the group in the Group name column and then right-clicking in<br />
any other column of the Groups table. The context menu Delete group will appear.<br />
Click on Delete group in this context menu to delete the selected group.<br />
Limitations:<br />
<br />
<br />
A group can only be deleted if it no longer has any members.<br />
The groups Lab Managers and <strong>Bruker</strong> Service cannot be deleted.<br />
Audit Trail<br />
The Audit Trail page contains a table in which details of actions performed by users are displayed and<br />
recorded in the database. All actions performed from the time the software was first used. A specific<br />
26<br />
DOC-M88-EXX191 V3.0 – 11.2012
<strong>Bruker</strong> AXS <strong>Measurement</strong> <strong>Suite</strong><br />
<strong>User</strong> <strong>Manual</strong><br />
time period can also be displayed. The actions are listed chronologically, with the most recent actions<br />
entered at the top of the list.<br />
To display the logged actions, choose the desired time frame in the scrollable list in the data field at<br />
the bottom right of the page and then click on “Reload”.<br />
Fig. 28: Audit Trail page<br />
The table on the Audit Trail page contains the following columns:<br />
Audit Trail ID: ID number of the logged action.<br />
<strong>User</strong> ID: ID number of the initiator of the action.<br />
Audit Trail Created: Date on which the action was logged.<br />
Description: Description of action.<br />
File Menu and Audit Trail Context Menu<br />
The File menu contains two Audit Trail-specific functions in a sub-menu in addition to its common<br />
functions.<br />
DOC-M88-EXX191 V3.0 – 11.2012 27
<strong>User</strong> <strong>Manual</strong><br />
<strong>Bruker</strong> AXS <strong>Measurement</strong> <strong>Suite</strong><br />
Fig. 29: File menu (with Audit Trail-specific items)<br />
These functions are:<br />
Print Preview: Shows a preview of the audit trail information to be printed.<br />
Print Audit Trail: Prints the audit trail information shown in the preview.<br />
These functions are also available via the Audit Trail context menu, which is obtained by right-clicking<br />
anywhere in the table of the audit trail information.<br />
General Settings<br />
The General Settings page contains two windows: the General Settings window and the Database<br />
Backup/Restore window. The General Settings window allows the user to make system-wide settings<br />
and change them as required. In the Database Backup/Restore window the user can make a backup<br />
of the database and then restore the database by loading the backup.<br />
28<br />
DOC-M88-EXX191 V3.0 – 11.2012
<strong>Bruker</strong> AXS <strong>Measurement</strong> <strong>Suite</strong><br />
<strong>User</strong> <strong>Manual</strong><br />
Fig. 30: General Settings page<br />
Password Settings<br />
Any changes made to the password settings will only apply to new passwords entered in the database<br />
in <strong>User</strong> Management.<br />
When the expiry time for passwords is set to zero, passwords will not expire. If a value other than zero<br />
is entered for the expiry time, users will be requested to change their passwords when logging in after<br />
expiration.<br />
NOTE<br />
Any changes made to the general settings on the General Settings page will only become effective<br />
after the <strong>Measurement</strong> <strong>Suite</strong> has been restarted.<br />
General Settings Window<br />
The General Settings window contains data entry fields in which the user can maintain the following<br />
system-wide settings:<br />
Auto delete Logentries [days]: The time lapse in days when the database logfile entries are deleted<br />
by the system.<br />
Auto Logout after [Minutes]: The time lapse in minutes between the cessation of user interaction<br />
and the reappearance of the login window. A value of 0 disables this feature.<br />
Axscom enabled: Enables/Disables the Axscom automation interface in the measurement server<br />
Broadcast Port: Default port at which the instruments listen for TCP/IP communication.<br />
DOC-M88-EXX191 V3.0 – 11.2012 29
<strong>User</strong> <strong>Manual</strong><br />
<strong>Bruker</strong> AXS <strong>Measurement</strong> <strong>Suite</strong><br />
Communication timeout [s]: The time lapse in seconds between the sending of a data packet from<br />
the <strong>Measurement</strong> Client to the <strong>Measurement</strong> Server or from the <strong>Measurement</strong> Server to the instrument<br />
and the interruption of the connection if no reply is received. In this case, an error message is<br />
displayed and the connection must be re-established.<br />
<strong>Measurement</strong> Methods Directory: Defines the default path to the directory in which the measurement<br />
methods (also called “experiments” in the software) are stored. The default path is %AP-<br />
PDATA%\<strong>Bruker</strong> AXS\Experiments. On an English-language operating system this is the path<br />
\Documents and Settings\All <strong>User</strong>s\<strong>Bruker</strong> AXS\Experiments.<br />
Min Password Length [characters]: Defines the minimum required length of a password. 0 ignores<br />
this feature.<br />
Password Expires after [days]: The time period between the creation of a password and its expiry.<br />
Results Directory: Defines the default path to the directory in which the measurement results are<br />
stored. The default path is %APPDATA%\<strong>Bruker</strong> AXS\Results. On an English-language operating<br />
system the path is \Documents and Settings\All <strong>User</strong>s\<strong>Bruker</strong> AXS\Results.<br />
Scripts Directory: Defines the default path to the directory in which the scripts are stored. The default<br />
path is %APPDATA%\<strong>Bruker</strong> AXS\Scripts. On an English-language operating system this is the path<br />
\Documents and Settings\All <strong>User</strong>s\<strong>Bruker</strong> AXS\Scripts.<br />
Work file based:True if the framework works with files e.g. bsml experiment files. False if the framework<br />
works database based only. In this case, files like experiment files are imported into the database<br />
once, and then reused with the help of an Open Database dialog. Result files are also stored in<br />
the database only, but can be exported if necessary. See START JOBS plugin for details.<br />
Database Backup/Restore Window<br />
Creating a Database Backup<br />
To make a database backup, first click on the Create Database Backup button at the top of the Database<br />
Backup/Restore window to open a standard Windows “Save as” dialog box. Enter a file name in<br />
the appropriate field of this dialog box. Backup files are of the type “backup”. The “Database backup”<br />
directory into which backup files are saved has been created as standard by <strong>Bruker</strong> AXS.<br />
In the DOS box at the password prompt enter 1 and press return.<br />
After saving the contents of the database to the backup file, information concerning the successful or<br />
unsuccessful completion of the backup and the path to the backup file is displayed in the Backup/Restore<br />
window.<br />
Restoring a Database<br />
If the database runs on the same computer as the instance of the <strong>Measurement</strong> Client which is being<br />
used ( as in the standard system configuration), the database can be restored after a backup has<br />
been made. This means that all information entered in the database after the backup is made will be<br />
deleted. Restoration of the database requires the closing down of the <strong>Measurement</strong> Server and client.<br />
To restore a database, click on the Restore Database button near the top of the Database Backup/Restore<br />
window. A pop-up window will appears and warn the user about the resulting loss of data.<br />
The pop-up window will request confirmation that the user wants to proceed.<br />
Please refer chapter Database Maintenance for details about the database restore procedure.<br />
Finally, the user must restart the <strong>Measurement</strong> Server and the <strong>Measurement</strong> Client.<br />
NOTE<br />
It is only possible to make a backup of a database and restore it afterwards if the <strong>Measurement</strong> Client<br />
and the database run on the same computer.<br />
30<br />
DOC-M88-EXX191 V3.0 – 11.2012
<strong>Bruker</strong> AXS <strong>Measurement</strong> <strong>Suite</strong><br />
<strong>User</strong> <strong>Manual</strong><br />
Database Maintenance Window<br />
With the Database Maintenance Window data from the current database can be deleted or moved into<br />
a backup database. A backup database is automatically created during the installation of the software.<br />
Cleaning the database may increase the speed of the software, and help the user to keep a better<br />
overview. Every measurement generates several KB of data on the hard disk and in the database.<br />
While the hard disk can be cleaned easily, the database cleaning is using the Database Maintenance<br />
program.<br />
Right click the mouse on an item or a group of items displayed in the context menu with the following<br />
options:<br />
Move copies the data into the backup database, and delete them from the current database,<br />
Delete just deletes the data from the current database.<br />
Fig. 31: Database Maintenance<br />
In the combo box in the right corner, the user can display either Experiments or log files.<br />
Load Experiments<br />
This loads all experiments from the database and displays the result in a tree view, sorted by month.<br />
To delete/move data, either select the month checkbox to select all experiments of a month or click<br />
the + to open a month and display the single experiments.<br />
To start a delete/move action with the selected items, press the right mouse over the tree view. After a<br />
security question, the clean-up process starts and the status is displayed in the status window below.<br />
DOC-M88-EXX191 V3.0 – 11.2012 31
<strong>User</strong> <strong>Manual</strong><br />
<strong>Bruker</strong> AXS <strong>Measurement</strong> <strong>Suite</strong><br />
NOTE<br />
Depending on the number of selected items, a database maintenance procedure can take a while to<br />
finish. The user can stop the process at any time by pressing the Stop button.<br />
Load Logs<br />
This loads all log entries from the database and displays the result in a tree view, sorted by month. To<br />
delete/move data, either select the month checkbox to select all logs for that month, or click the + to<br />
open a month and display the single experiments.<br />
Fig. 32: Database Maintenance<br />
To start a delete/move action with the selected items, press the right mouse over the tree view. After a<br />
security question, the clean-up process will begin, and the status will be displayed in the status window<br />
below.<br />
32<br />
DOC-M88-EXX191 V3.0 – 11.2012
<strong>Bruker</strong> AXS <strong>Measurement</strong> <strong>Suite</strong><br />
<strong>User</strong> <strong>Manual</strong><br />
START JOBS<br />
General<br />
The START JOBS plug-in is used to create and start jobs in which measurements are carried out on<br />
samples by the connected instrument according to predefined methods (also called “experiments” in<br />
the software). <strong>Measurement</strong> information for a job is entered in a row of the START JOBS table. This<br />
information can be copied into other rows and thus, multiple jobs can be easily created for batch processing.<br />
After several jobs have been created, they are started together as a group, at which point<br />
they are automatically deleted from the table and reappear in the job list of the JOBLIST plug-in. This<br />
job list contains jobs that are to be carried out (“waiting” or “pending” jobs) and jobs that are currently<br />
in progress (“active” or “running” jobs) on instruments assigned to the <strong>Measurement</strong> Server with which<br />
the <strong>Measurement</strong> Client is connected.<br />
START JOBS can also combine single jobs into a group or batch of jobs. Those groups can then easily<br />
be started by just pressing one button. Additionally variable job parameters that are not know during<br />
the creation of a batch job are also supported.<br />
Jobs are normally executed in the order in which they have been created. However, high-priority jobs<br />
take precedence over standard jobs.<br />
Jobs can also be created and started using COMMANDER. In this case, however, the measuring operations<br />
are carried out not according to a predefined method but according to parameters that are set<br />
on an individual basis for the jobs using the functionality provided by the plug-in. This measuring information<br />
can be saved as a method to a file and later used to create jobs in START JOBS.<br />
NOTE<br />
The term “start” in relation to the processing of jobs with START JOBS refers to the initiation of a process<br />
that may include a waiting period - the length of which depends on the number of pending jobs<br />
with a higher priority on the waiting list and on the duration of their execution - before the actual<br />
measuring operation begins.<br />
ATTENTION!<br />
Before measurements can be carried out on an instrument, its drives and sample changer must be<br />
initialized. The user can initialize the drives by using the Drive Control (see Section Fehler! Verweisquelle<br />
konnte nicht gefunden werden. on page Fehler! Textmarke nicht definiert.) and the sample<br />
changer by using the Sample Changer Control (see Section Fehler! Verweisquelle konnte nicht<br />
gefunden werden. on page Fehler! Textmarke nicht definiert.) in COMMANDER.<br />
Screen Layout and Operation<br />
The user interface of the START JOBS plug-in consists of three tabs at the bottom of the plugin. The<br />
Start Jobs tab is a table in which measurement information is entered for the creation of jobs.<br />
In the Start Jobtemplates tab the user can create user defined batch jobs that later can simply be<br />
started by just pressing a single button.<br />
The Well Plate tab shows a Well plate where the user can add jobs by just clicking a measurement<br />
position on the well. All jobs on the plate will be measured with the same experiment and script file. In<br />
the optional camera control, the user can additionally identify structures and create experiments that<br />
are measured at the selected position.<br />
NOTE<br />
The Well Plate tab is only available, if a Component/Samplechanger/Screening unit is configured in<br />
the instrument configuration.<br />
The Camera Control in the Well Plate tab is only available, if a Component/Video unit is configured in<br />
the instrument configuration.<br />
DOC-M88-EXX191 V3.0 – 11.2012 33
<strong>User</strong> <strong>Manual</strong><br />
<strong>Bruker</strong> AXS <strong>Measurement</strong> <strong>Suite</strong><br />
The Start Jobs tab<br />
The Start Jobs tab contains a table to add necessary experiment information. Each row of the table<br />
contains a separate job with its measurement information.<br />
<strong>User</strong>-defined columns can be added to the table. The standard built-in columns with which the table is<br />
provided can be set to Hidden if not needed.<br />
Fig. 33: <strong>User</strong> interface of START JOBS plug-in<br />
The standard columns are:<br />
Valid: This shows the status of the experiment validation. If the checkbox Validate experiment before<br />
start is checked, every new experiment is validated against the actual instrument configuration. If the<br />
instrument settings allow a measurement of the experiment, the column shows a green OK item. If not,<br />
a red error item is shown and a hint is shown as an indication of the change needed in the instrument<br />
to measure this experiment.<br />
Sample Position: The sample position column contains a combo box for each job in which the user<br />
can select one of the available sample positions for the instrument. For information on the sample<br />
positions that can be selected for different types of a sample changer, see Section Fehler! Verweisquelle<br />
konnte nicht gefunden werden. on page Fehler! Textmarke nicht definiert..<br />
If an instrument has only one sample position, the column is hidden. The default position (1A01) is<br />
used automatically.<br />
Sample ID: An arbitrary ID given to a sample by the user for identification.<br />
Experiment Name: The name of an existing measurement method (called “experiment” here) file<br />
(bsml file). Type the name of this file into the text field without the filename extension. If a user-specific<br />
path to the experiments directory has been defined (see Section Deleting <strong>User</strong>s and Storing Additional<br />
<strong>User</strong> Data on page 23), it will be added automatically to the filename to form the pathname with the file<br />
34<br />
DOC-M88-EXX191 V3.0 – 11.2012
<strong>Bruker</strong> AXS <strong>Measurement</strong> <strong>Suite</strong><br />
<strong>User</strong> <strong>Manual</strong><br />
extension bsml. If no user-specific path has been defined, the default path to the directory (see Section<br />
General Settings Window on page 29) will be added to the filename. Both the user-specific path<br />
and the default path to the experiments directory can be changed in DATABASE MANAGEMENT.<br />
Alternatively, the browse button in the right-hand corner of the text field can be clicked on and the<br />
experiments file can be selected. The pathname will be displayed automatically in the field.<br />
Result File Name: The name of a result file (brml file) in which the measurement result is to be stored.<br />
Type the name of this file without the filename extension into the text field. The default path to the<br />
results directory (see Section General Settings Window on page 29) and the filename extension will<br />
be added automatically to the filename. However, if a user-specific path has been defined (see Section<br />
Deleting <strong>User</strong>s and Storing Additional <strong>User</strong> Data on page 23), this path will be added to the file<br />
name as well as the file extension to the filename. Both the user-specific path and the default path to<br />
the results directory can be changed in DATABASE MANAGEMENT.<br />
Alternatively, the browse button in the right-hand corner of the text field can be clicked and the result<br />
file can be selected. The pathname will be displayed automatically in the field.<br />
Script Name: The name of a file (cs file) containing a measurement script used for the measurement.<br />
Type the name of this file without the filename extension into the text field and the path to the directory<br />
and the filename extension will be added to the filename.<br />
All scripts are located in the predefined Scripts subdirectory within the <strong>Bruker</strong> AXS directory.<br />
If this text field remains empty, a default script is used.<br />
Mode: The measurement mode used for this measurement. The available measurement modes are:<br />
<br />
<br />
<br />
<br />
<br />
<br />
<br />
QL - Qualitative<br />
RE - Reference sample for quantitative measurements<br />
ST - Standard sample for quantitative measurements<br />
UN - Unknown sample for quantitative measurements<br />
TT - Texture measurement in transmission<br />
TR - Texture measurement in reflection<br />
RI - Internal Reference<br />
Time Scale: The value entered for this parameter is used as a multiplication factor for multiplication of<br />
the measurement time defined in the measurement method. For example, a value of 2 multiplies the<br />
measurement time by a factor of two.<br />
Priority: If the priority check box is checked, the job has a high priority. High-priority jobs interrupt<br />
standard jobs, which are running. In this case, the sample belonging to the job that is interrupted is<br />
removed from the measurement position and returned to its position in the magazine or tray. When the<br />
high-priority job is finished, the standard job will only be resumed if no other high-priority jobs have<br />
been initiated.<br />
If the standard job is interrupted during the measuring operation, the measuring operation will be resumed<br />
from the point of interruption.<br />
Validate experiment before start: If marked this checks an experiment against the actual instrument<br />
configuration. See the description of the Valid column above. If at least one experiment validation has<br />
failed at the initiation of the experiments, a warning will be shown and only valid experiments can be<br />
started. If the checkbox is unmarked, all experiments can be started. However, they may fail later in<br />
the JOBLIST plugin.<br />
Newly created jobs are started by clicking on:<br />
Start () Jobs: This button indicates the number of jobs for which sufficient measurement information<br />
has been entered to allow a start. If only one sample position (the default position 1A01) is available<br />
for the instrument, entering a method is sufficient for a start. In this case, the column “Sample Position”<br />
does not appear in the table.<br />
DOC-M88-EXX191 V3.0 – 11.2012 35
<strong>User</strong> <strong>Manual</strong><br />
<strong>Bruker</strong> AXS <strong>Measurement</strong> <strong>Suite</strong><br />
Editing the <strong>Measurement</strong> Information<br />
The measurement information in the rows of the table can be edited as a row of information or as the<br />
contents of a single cell.<br />
In the first case, the row must be selected by clicking on the button at the left end of the row. A<br />
pointer appears on the button, indicating that the row is ready for editing.<br />
In the second case, the cell must be selected with a mouse click. A pen appears on the button at<br />
the left end of the row containing the cell, indicating that the cell is ready for editing.<br />
Editing a Row of Information<br />
A row of information can be edited with the help of three speed buttons located below the menu bar.<br />
Cuts the selected measurement information and saves it to the clipboard.<br />
Copies the selected measurement information to the clipboard.<br />
Pastes the measurement information into the row. Any existing information is overwritten.<br />
Multiple rows for cutting, copying and pasting can be selected by scrolling up or down through the<br />
rows while holding down the shift key. Alternatively, a cell in a row can be clicked on (the pointer on<br />
the button at the end of the row then becomes a pen), the Return or Escape key should be pressed.<br />
Scroll through the rows while holding down the shift key.<br />
The contents of rows can also be copied using Ctrl-C and pasted using Ctrl-V.<br />
The contents of the bottom row of the table can be copied repeatedly into the lower rows by simply<br />
pressing the return key after selecting the row.<br />
The first three options in the Start Jobs context menu can also be used, namely Copy, Paste and<br />
Clear Row, which is obtained by right-clicking anywhere in a row. For a description of the functions of<br />
this menu, see Section The Start Jobs Context Menu on page 36. With the fourth option Clear All the<br />
measurement information of all rows can be deleted.<br />
The functions Clear Row and Clear All are also available in the Start Jobs menu, which is described in<br />
Section The Start Jobs Menu on page 39.<br />
Editing the Contents of a Single Cell<br />
The information in a single cell can be edited by first selecting the cell with the left mouse button and<br />
then right-clicking to it to open the editing context menu.<br />
Fig. 34: Editing context menu 95<br />
Before selecting any of the options of this menu first mark the contents of the cell using Select All.<br />
The Start Jobs Context Menu<br />
A right click on any part of the table opens the Start Jobs context menu.<br />
36<br />
DOC-M88-EXX191 V3.0 – 11.2012
<strong>Bruker</strong> AXS <strong>Measurement</strong> <strong>Suite</strong><br />
<strong>User</strong> <strong>Manual</strong><br />
Fig. 35: Start Jobs context menu<br />
This context menu contains the following items:<br />
Create result file names(s): This automatically creates valid result file names from the actual experiment<br />
file name.<br />
Copy: Copies the selected row or rows onto the clipboard.<br />
Paste: Pastes the selected row or rows into the table.<br />
Clear row: Clears the selected row.<br />
Clear all: Clears the complete table.<br />
Save job list as …: Opens a dialog box that can be used to save the job settings as a job list file. A<br />
job list file can be reloaded during a later session. Thus, the batch processing is facilitated using a predefined<br />
job list.<br />
Load job list …: Opens a dialog box that can be used to load an existing job list file.<br />
Column Editor…: Opens the dialog box Column Editor (see following section).<br />
Restore column default settings: Removes all non-standard columns and restores the built-in default<br />
columns.<br />
The Column Editor<br />
The Column Editor is available in the Start Jobs menu and Start Jobs context menu and enables the<br />
user to define and add new columns to the START JOBS table if required. Thus, additional measurement<br />
information can be entered in the table during the creation of jobs.<br />
The built-in standard columns can be hidden, thus making room for new columns.<br />
DOC-M88-EXX191 V3.0 – 11.2012 37
<strong>User</strong> <strong>Manual</strong><br />
<strong>Bruker</strong> AXS <strong>Measurement</strong> <strong>Suite</strong><br />
Fig. 36: Dialog box Column editor showing standard columns<br />
Clicking on “Column Editor” in one of the above-mentioned menus opens the dialog box Column Editor.<br />
The columns are listed in the left window of this dialog box. Selecting a column displays properties<br />
of the column in the data fields on the right side of the dialog box. These fields can be used to define<br />
new columns. In the case of built-in standard properties these fields are deactivated and their information<br />
cannot be changed.<br />
Fig. 37: Dialog box Column editor showing data fields in which a new column can be defined<br />
The buttons beneath the window on the left have the following functions:<br />
New Column: Creates a non-standard column.<br />
Delete Column: Deletes a selected non-standard column.<br />
38<br />
DOC-M88-EXX191 V3.0 – 11.2012
<strong>Bruker</strong> AXS <strong>Measurement</strong> <strong>Suite</strong><br />
<strong>User</strong> <strong>Manual</strong><br />
The following parameters define the columns:<br />
Column Type: A column can be one of the following types: string, file name, numeric, choice, and<br />
checkbox.<br />
Column Title: The title of the new column. This title appears in the table.<br />
Parameter Name: Name of the parameter that is sent to the <strong>Measurement</strong> Server. For example, the<br />
parameter name can be used by an evaluation plug-in for additional calculations.<br />
Default Value: The default value that is used if the field in the table remains empty.<br />
Choices: If the column type is “choice”, the user can enter the values that are later available in the<br />
table in this field.<br />
Min : Minimum value that can be entered in the table if the column type is numeric.<br />
Max : Maximum value that can be entered in the table if the column type is numeric.<br />
: Moves a selected column up in the column list and thus to the left in the table.<br />
: Moves a selected column down in the column list and thus to the right in the table.<br />
: Exports column settings to an xcol file in the <strong>Bruker</strong> ASX directory or another directory.<br />
: Imports column settings from an xcol file.<br />
To create a new column, click on the New Column button. The words “Enter column title” appear at<br />
the bottom of the column list. Select these words to activate the property fields on the right. After entering<br />
the properties, click on OK to create the new column.<br />
The Start Jobs Menu<br />
The Start Jobs menu in the menu bar provides functions that are also available in the Start Jobs context<br />
menu. For a description of these functions, see Section The Start Jobs Context Menu on page 36.<br />
Fig. 38: Start Jobs Menu<br />
<strong>User</strong> Right Restrictions<br />
The logged-in user can start jobs only if he has been assigned the user right “Start Job”. For information<br />
on user rights, see Section <strong>User</strong>s Table on page 21.<br />
The Start Jobtemplates tab<br />
In the Start Jobtemplates tab, the user can very easy create its own batch jobs that consist on one or<br />
more single jobs. Additionally variable parameters are allowed, e.g. a sample ID that is undefined during<br />
setting up the actual batch job can be defined as variable. If the batch job is started later, a dialog<br />
comes up where the user must add the missing sample ID.<br />
DOC-M88-EXX191 V3.0 – 11.2012 39
<strong>User</strong> <strong>Manual</strong><br />
<strong>Bruker</strong> AXS <strong>Measurement</strong> <strong>Suite</strong><br />
Fig. 39: Start Jobtemplates screen<br />
In order to start a batch job, the user must simply click one of the buttons on the screen. All jobs that<br />
are defined in the batch are sent to the measurement server and executed on the connected instrument.<br />
Creating a new template<br />
To create a new batch job, press the New Template button. The Batch Template Dialog is displayed<br />
with the measured experiments on the left side:<br />
40<br />
DOC-M88-EXX191 V3.0 – 11.2012
<strong>Bruker</strong> AXS <strong>Measurement</strong> <strong>Suite</strong><br />
<strong>User</strong> <strong>Manual</strong><br />
Fig. 40: The Batch Template Dialog<br />
To add a new experiment to the template, select it in the left table and press Add Experiment. The<br />
experiments are copied to the top right table. To insert an experiment, select the experiment in the left<br />
table, and the row in the right table and press Insert Experiment. The new experiment is inserted<br />
above the selected row.<br />
Remove Experiment removes the selected experiment from the right table.<br />
NOTE<br />
The experiment order in the right table defines the order in which the experiments are executed later<br />
on the instrument.<br />
New Column: Opens a dialog to create user defined parameters for an experiment.<br />
Fig. 41: <strong>Measurement</strong> Parameter Dialog<br />
Predefined parameters are <strong>User</strong>taskfile and Scriptfile. To add a parameter, just type the parameter<br />
name and press OK.<br />
A new column in the right table is created with the name of the given parameter. In case of <strong>User</strong>task<br />
or Scriptfile, a file can be selected that is executed together with the experiment.<br />
DOC-M88-EXX191 V3.0 – 11.2012 41
<strong>User</strong> <strong>Manual</strong><br />
<strong>Bruker</strong> AXS <strong>Measurement</strong> <strong>Suite</strong><br />
In case of a user defined parameter e.g. LOI, the parameter is send to the evaluation software together<br />
with the value the user added. E.g. LOI=3.14 .<br />
Edit Column: Allows to change the name of a parameter. Use the dropdown button to select the parameter<br />
to change.<br />
Remove Column: Allows to remove a parameter from the table.<br />
Button Label: The text that is displayed on the button. Note: Without a button label, the OK button is<br />
not available, and thus the template cannot be saved.<br />
Button Tooltip: An optional label for the button that can be used to give the user an additional hint<br />
about the purpose of the template.<br />
Button Color and Font Color: Allows to change the Button background and the button font color.<br />
Working with optional parameters<br />
Optional parameters allow the user to define placeholders at the creation time of a template. At the<br />
execution time, a dialog is shown, where the user replaces the placeholders by actual values. For<br />
example the sample ID might not be known at design time.<br />
To add an optional parameter, simply type an “?” in the field<br />
Fig. 42: Optional Parameter example<br />
In the example above the only optional parameter is the sample ID. If the user executes the job, an<br />
additional dialog comes up and forces the user to add all missing parameters. After all missing parameters<br />
are added, the OK button becomes enabled, and the jobs are queued into the measurement<br />
server.<br />
42<br />
DOC-M88-EXX191 V3.0 – 11.2012
<strong>Bruker</strong> AXS <strong>Measurement</strong> <strong>Suite</strong><br />
<strong>User</strong> <strong>Manual</strong><br />
Fig. 43: Missing parameter example<br />
Batch template visible: This hides the button on the user interface e.g. if the user want to measure the<br />
template with the help of the AXSCOM interface only. See Fehler! Verweisquelle konnte nicht gefunden<br />
werden.<br />
The Well Plate tab<br />
In the Well Plate tab, the user can start experiments on a well plate control, or start experiments with<br />
the help of an (optinal) video camera. All jobs entered on the tab will be executed with the same experiment-<br />
and script file. Additionally, all experiments will get the same plate id.<br />
Fig. 44: The Well Plate tab<br />
DOC-M88-EXX191 V3.0 – 11.2012 43
<strong>User</strong> <strong>Manual</strong><br />
<strong>Bruker</strong> AXS <strong>Measurement</strong> <strong>Suite</strong><br />
In the Magazine/Area control, the user can switch between different types of well plates if they are<br />
configured in the CONFIG plugin.<br />
Experimentname: This defines the experiment used for all jobs on the well<br />
Scriptname: This defines the optional scriptfile used for all jobs on the well<br />
Plate ID: This defines a plate identifier for all jobs on the well<br />
NOTE<br />
Depending on the configured well plates, the number of columns and rows can vary, also the number<br />
and location of checkboxes within a well position.<br />
Once an experiment position is selected in the well plate control, it occurs in the start jobs control below.<br />
Here the experiment parameters can be modified as well. Once all required information’s for an<br />
experiment are available, you can start the experiments with the help of the Start Jobs button.<br />
The jobs are scheduled into the JOBLIST plugin.<br />
The Wellplate Control context menu<br />
Press the right mouse on the well plate control, and a context menu appears:<br />
Drive to this position: This can be used to quickly drive the stage between the wells of a plate. This<br />
function drives the stage to the selected position<br />
Select all xxx in this row: Selects all items in the row of the well<br />
Select all xxx in this column: Selects all items in the column of the well<br />
Select all xxx: This selects all similar subitems in the entire well<br />
The unselect functions deselect the items selected with the functions above.<br />
If a /Component/Video unit is installed in the instrument, the camera control is available. With the help<br />
of the CAMERA plugin, a x,y,z stage can be calibrated. If the stage and camera are calibrated, the<br />
camera control displays mouse positions in [mm].<br />
Camera Control context menu<br />
Press the right mouse on the optional camera control, and a context menu appears:<br />
44<br />
DOC-M88-EXX191 V3.0 – 11.2012
<strong>Bruker</strong> AXS <strong>Measurement</strong> <strong>Suite</strong><br />
<strong>User</strong> <strong>Manual</strong><br />
Move stage to this position: Moves the stage to the current mouse position<br />
Stop all drives: Stops the movement of all drives<br />
Increase/Decrease sample illumination: If a /Component/SampleIllumination unit is configured in<br />
the system, you can modify the sample illumination<br />
Move stage perpendicular to the camera: If you work with the well plate, the camera and the well<br />
must be perpendicular to each other. This drives the stage to the value configured in the Camera:<br />
Horizontal Angle<br />
Lock reticle: Prevents the reticle to be moved on the screen<br />
Reset the reticle to the image center: Moves the reticle to the middle of the camera<br />
Save camera image with experiment: Saves an image with every experiment. The image is made<br />
when you select Measure here (see below)<br />
Measure here: Creates an experiment at the actual mouse position, recalculated in stage x,y,z coordinates.<br />
This adds the experiment into the Start Jobs control on the left.<br />
DOC-M88-EXX191 V3.0 – 11.2012 45
<strong>User</strong> <strong>Manual</strong><br />
<strong>Bruker</strong> AXS <strong>Measurement</strong> <strong>Suite</strong><br />
JOBLIST<br />
General<br />
The JOBLIST plug-in enables the user to monitor the processing of jobs that have been started using<br />
START JOBS or another plug-in of the <strong>Measurement</strong> Client instance, or by other <strong>Measurement</strong> Client<br />
instances connected to the same <strong>Measurement</strong> Server with which the <strong>Measurement</strong> Client instance is<br />
connected, and that are to be executed (“waiting” or “pending” jobs) or are currently in progress (“active”<br />
or “running” jobs) on the currently connected instrument. The jobs are listed in table form. On<br />
completion the jobs are automatically deleted from the job list and reappear in a list of completed jobs.<br />
The user can stop pending and running jobs, and later resume (This means that an attempt is made to<br />
resume suspended jobs) or delete them. Jobs stopped in this way are called “suspended” jobs.<br />
Jobs that cannot be executed are automatically stopped and assigned the status “suspended” by the<br />
software.<br />
The measurement information for suspended jobs can be modified in the job list before they are resumed.<br />
Therefore, a suspended job must not be newly created.<br />
JOBLIST also allows the user to create scheduled jobs. These jobs are generated automatically from<br />
a template that is created using the measurement information of a completed job. They can be started<br />
at a specific time and repeated a defined number of times at a specific time interval.<br />
Scheduled jobs are displayed in a Scheduled Jobs list before being executed. Upon initiation of the<br />
measuring operation, scheduled jobs are automatically deleted from the Scheduled Jobs list and appear<br />
as active jobs in the job list.<br />
Job Priority Levels<br />
There are three priority levels for jobs – high, normal, and low. Jobs can be assigned a high or a normal<br />
priority in START JOBS, as scheduled jobs can be prioritized in JOBLIST. Suspended jobs in<br />
JOBLIST can be assigned one of the three priorities before they are resumed.<br />
In general, jobs are listed in the job list and executed in the order in which they have been created.<br />
However, if jobs with different priority levels have been started, those of a higher priority are executed<br />
before those of a lower priority level. Moreover, running jobs of a lower priority are interrupted to accommodate<br />
those of a higher priority level.<br />
Screen Layout and Operation<br />
The Joblist and Job Details Windows<br />
The JOBLIST page contains two movable windows. The Joblist window in the upper part of the page<br />
contains the actual job list. This is a list in table form of pending and active jobs and their related<br />
measurement information.<br />
In the Job Details window in the lower part of the page the processing information for the jobs that<br />
appear in the job list is displayed. . The events that occur from initiation of a job start are shown in<br />
table form. The latest event is reported in a message text in the top row.<br />
To obtain the details of a job, select the job in the job list by clicking on any table cell in the row containing<br />
its measurement information. Details of the job will appear in the Job Details window.<br />
Repositioning the Joblist and Job Details Windows<br />
Both the Joblist window and the Job Details window can be repositioned on the screen. To do this,<br />
place the mouse pointer on the title bar of the window. Hold down the left mouse button and start<br />
dragging the window. While the window is being dragged, a set of blue docking points will become<br />
visible on the screen. If the title bar is dropped during this time at any point, the window will become<br />
docked in this position. The position information is stored in the current user’s profile. This means that<br />
the next time the <strong>Measurement</strong> Client is started, any window that has been repositioned in this way<br />
will be found in its newly docked position<br />
46<br />
DOC-M88-EXX191 V3.0 – 11.2012
<strong>Bruker</strong> AXS <strong>Measurement</strong> <strong>Suite</strong><br />
<strong>User</strong> <strong>Manual</strong><br />
Fig. 45: The Joblist and Job Details windows<br />
The table in the Joblist window contains the following columns:<br />
Job ID: Every job has a unique job ID. This ID number is assigned by the database.<br />
Result file name: Name of the result file.<br />
Position: The position of the sample in the magazine or tray.<br />
Sample ID: An arbitrary ID number assigned to a sample by an operator.<br />
Instrument: The instrument with which the sample is to be measured.<br />
Experiment name: The name of the measurement method (called “experiment” here) used to measure<br />
the sample.<br />
Script name: The name of the measurement script used.<br />
<strong>Measurement</strong> type: The type of measurement.<br />
Job status: The status of the job, for example, Error, Warning, Waiting and Stopped.<br />
Status messages: Detailed status messages, if available.<br />
Operator: Login name of the operator who started the job.<br />
Start time: Estimated starting time of the job. If the job has already been initiated, the actual start time<br />
will be displayed.<br />
End time: Estimated time at which the job is to be completed.<br />
<strong>Measurement</strong> time: Estimated duration of the job measurement.<br />
Progress: The progress of the measuring operation from 1% to 100%.<br />
DOC-M88-EXX191 V3.0 – 11.2012 47
<strong>User</strong> <strong>Manual</strong><br />
<strong>Bruker</strong> AXS <strong>Measurement</strong> <strong>Suite</strong><br />
Priority: The priority (low, normal or high) of the sample.<br />
Editing the <strong>Measurement</strong> Information of Suspended Jobs in the Joblist Window<br />
The measurement information of suspended jobs can be changed in the Joblist window by first clicking<br />
on that specific job in the table cell. The symbol changes to the symbol at the left end of the<br />
row of information, indicating a switch to editing mode. The information can be altered as required.<br />
Job History Window<br />
The Job History window, accessed by the tab located in the bottom left-hand corner of the JOBLIST<br />
page, contains a list in table form of all the jobs executed in the last seven days. Their measurement<br />
information and completion time is included.<br />
Fig. 46: Job History window<br />
A completed job in the Job History window can be restarted by right-clicking on any table cell in the<br />
row of related measurement information<br />
The Job History context menu will appear:<br />
Fig. 47: Job History context menu<br />
The measurement information of a completed job can be used to create templates from which scheduled<br />
jobs can automatically be generated (see Section Scheduling of Jobs on page 48 below). This is<br />
done using the Job History context menu described above or with the Joblist menu (see Section The<br />
Joblist Menu and Job List Context Menu on page 51).<br />
Scheduled Job Window<br />
The Scheduled Job window, similar to the Job History window, is opened using a tab in the bottom<br />
left-hand corner of the JOBLIST page. It is divided into two panes whose width can be increased or<br />
reduced by seizing and dragging the splitter line that separates them.<br />
The left-hand window pane contains a schedule of jobs generated by templates that are listed in the<br />
right-hand pane. The jobs move up the schedule as preceding jobs are executed one by one.<br />
For information on the creation of templates for the automatic generation of scheduled jobs, see the<br />
following section.<br />
Scheduling of Jobs<br />
Jobs can be scheduled using functionality provided in the Job History and Scheduled Job windows.<br />
A schedule template is created using the measurement information of a job that has already been<br />
executed. This template is used to generate a job that is started at a defined point in time and is auto-<br />
48<br />
DOC-M88-EXX191 V3.0 – 11.2012
<strong>Bruker</strong> AXS <strong>Measurement</strong> <strong>Suite</strong><br />
<strong>User</strong> <strong>Manual</strong><br />
matically repeated a defined number of times at a defined time interval. Each repetition of the job is<br />
treated as a separate job and assigned its own job ID by the software.<br />
To create scheduled jobs, select the job whose measurement information is to be reused from among<br />
the list of completed jobs in the Job History window. This can be done by right-clicking on any table<br />
cell in the row containing the job’s measurement information.<br />
The Job History context menu shown in Fig. 47 will appear.<br />
In this menu, select Create scheduled job(s) to open the dialog box Scheduled job.<br />
Fig. 48: Dialog box Scheduled job<br />
This dialog box contains the following data fields:<br />
Schedule Template ID: An ID number assigned by the database to the new schedule template.<br />
Job ID: The ID number of the job whose measurement information will be used to create the new<br />
template. When the scheduled jobs are generated from the template, they will be automatically assigned<br />
their own job ID number.<br />
Instrument: The name of the instrument on which the scheduled job(s) is/are to be performed.<br />
Sample ID: An arbitrary ID given to the sample by the user for identification.<br />
Experiment Name: Name of the measurement method (called “experiment” here) to be used in the<br />
measuring operation(s).<br />
Result File Name: Enter here the name of the result file in which the results of the measuring operation(s)<br />
are to be saved.<br />
First start: Select a date and time for execution of the first scheduled job from the drop-down calendar<br />
in the data field or modify an existing date and time. If Now has been clicked on, the present date and<br />
time will be entered.<br />
Number of Jobs: The number of scheduled jobs to be generated from the schedule template. However,<br />
this value is equivalent to the number of jobs actually generated only when the number selected<br />
for Completed Jobs (see below) is 0. The number of jobs actually generated is equivalent to the difference<br />
between the value selected for Number of Jobs and the value for Completed Jobs. For example,<br />
if Number of Jobs is 10 and Completed Jobs is 6, then 4 jobs will be carried out.<br />
DOC-M88-EXX191 V3.0 – 11.2012 49
<strong>User</strong> <strong>Manual</strong><br />
<strong>Bruker</strong> AXS <strong>Measurement</strong> <strong>Suite</strong><br />
This arrangement allows the user to reuse schedule templates from which jobs have already been<br />
generated. For example, if the user has used a template to create 10 jobs, he can reuse the same<br />
template to create 5 more jobs by selecting 15 for Number of Jobs and 10 for Completed Jobs.<br />
If the user selects 0 for Number of Jobs, the jobs will be repeated endlessly. In this case, he can only<br />
stop them by deactivating the scheduling or deleting the template in the right-hand pane of the Scheduled<br />
Jobs window (see below).<br />
Completed Jobs: The number of completed jobs. The value selected here, together with that for<br />
Number of Jobs, determines the number of jobs actually carried out (see Number of Jobs above).<br />
As each job is completed, the value for Completed Jobs is automatically augmented by 1.<br />
If 0 is selected for Number of Jobs, the value for Completed Jobs will not be augmented.<br />
Interval and Unit: Select the time interval between the repeated jobs.<br />
Scheduling template active: Check this checkbox to activate the scheduling. If the scheduling is not<br />
activated, no scheduled jobs will be executed. However, once the template is created the user can<br />
activate the scheduling in the Schedule jobs window at a later point in time (see below).<br />
Priority Job: By checking this check box scheduled job(s) can be assigned as a high priority.<br />
After the scheduling data have been entered in the dialog box, click OK.<br />
Fig. 49: Scheduled Jobs window<br />
The newly created template with its measurement and scheduling information will appear in the list of<br />
templates in table form in the right-hand pane of the Scheduled Jobs window. The left-hand pane contains<br />
the schedule of the jobs that have been generated from the templates. This schedule is limited to<br />
the jobs that are planned for execution within the next 24 hours.<br />
The planned jobs move to the top of the schedule as preceding jobs are carried out. When the measurement<br />
begins, the job disappears from the schedule and reappears as a running job in the job list.<br />
Templates whose job scheduling has not been activated during their creation appear in the list of templates.<br />
However, no jobs are generated from these templates The scheduling can be activated at any<br />
time by checking the corresponding check box in the Active column of the table. The scheduling information<br />
of an inactive template can be modified before the template is activated, if necessary,. To do<br />
this, right-click on any table cell in the row containing the template’s measurement and scheduling<br />
information. A context menu appears.<br />
Fig. 50: Schedule template context menu<br />
Click on Properties to obtain the dialog box Scheduled job and modify the scheduling information as<br />
required. Then click OK and the changes will be adopted in the template.<br />
50<br />
DOC-M88-EXX191 V3.0 – 11.2012
<strong>Bruker</strong> AXS <strong>Measurement</strong> <strong>Suite</strong><br />
<strong>User</strong> <strong>Manual</strong><br />
Templates and the jobs generated from them can be deleted using the same context menu. Running<br />
jobs will continue to be executed until they are completed.<br />
Speed Buttons<br />
Speed buttons are provided in the speed bar beneath the menu bar for two frequently used JOBLIST<br />
functions. These are:<br />
Stop all jobs<br />
Delete all jobs<br />
These functions are also available using the Joblist menu. They are described in detail in the following<br />
section.<br />
The Joblist Menu and Job List Context Menu<br />
The Joblist menu in the menu bar contains commands for managing jobs as well as creating and<br />
managing schedule templates. These commands are also available using the context menus. The first<br />
six items of the menu are available in the Job list context menu described in this section. ”Restart Job”<br />
and “Create scheduled jobs” are available in the Job History context menu (see Section Job History<br />
Window on page 48 ). “Delete schedule template” and “Properties” are available in the Schedule template<br />
context menu (see Section Scheduling of Jobs on page 48).<br />
Fig. 51: Joblist menu<br />
The items of the Joblist menu provide the following functions:<br />
Stop job(s): Stops all selected jobs. Stopped jobs are assigned the status “suspended”.<br />
Delete job(s): Deletes jobs with a “suspended” status. The job(s) must first be selected.<br />
Resume job(s): Resumes jobs with a “suspended” status. The job(s) must first be selected.<br />
When jobs are resumed, an attempt is made to start their execution. If this fails, the jobs become<br />
pending jobs.<br />
Restart Job(s): Restarts the selected job(s) in the list of completed jobs in the Job History window.<br />
Stop all jobs: Stops the jobs running on all controlled instruments as well as all pending jobs.<br />
Stopped jobs are assigned the status “suspended”.<br />
Delete all jobs: Deletes all jobs with a “suspended” status.<br />
DOC-M88-EXX191 V3.0 – 11.2012 51
<strong>User</strong> <strong>Manual</strong><br />
<strong>Bruker</strong> AXS <strong>Measurement</strong> <strong>Suite</strong><br />
Resume all jobs: Resumes all jobs with a “suspended” status. An attempt is made to start execution<br />
of the jobs. If this fails, the jobs become “pending” jobs.<br />
Restart all jobs: Restarts all jobs in the list of completed jobs in the Job History window.<br />
Scheduler: Opens the scheduler sub-menu.<br />
Create Scheduled Job(s): Opens the dialog box Scheduled job. A completed job must be selected.<br />
Its measurement information will be used for the creation of a schedule template.<br />
Delete schedule template: Deletes the selected schedule template in the list of schedule templates in<br />
the right-hand pane of the Scheduled Jobs window.<br />
Properties: Opens the dialog box Scheduled job containing the parameters for the selected schedule<br />
template in the list of schedule templates in the right-hand pane of the Scheduled Jobs window.<br />
In addition to the first six items of the Joblist menu, the Job list context menu obtained by clicking on<br />
the job list contains the items “Visible Columns” and “Reset to column defaults”.<br />
Fig. 52: Job list context menu<br />
Visible Columns: Displays a list of all columns that are visible in the Joblist window. Columns not<br />
required can be unchecked by the user. The information is stored in the active user profile of the user.<br />
This means that, only the checked columns will appear in the window at the next start of the <strong>Measurement</strong><br />
Client.<br />
Reset to column defaults: Removes all previous column settings from the user profile and shows the<br />
standard columns described in Section 0 above.<br />
52<br />
DOC-M88-EXX191 V3.0 – 11.2012
<strong>Bruker</strong> AXS <strong>Measurement</strong> <strong>Suite</strong><br />
<strong>User</strong> <strong>Manual</strong><br />
CONFIG<br />
General<br />
The CONFIG plug-in is used to configure X-ray instruments for the performance of measuring operations.<br />
This involves the creation of an instrument configuration for a set of hardware components and<br />
component clusters. The configuration is then used by the instrument firmware to determine which<br />
components are available for operation and to set their initial parameters at start-up time.<br />
Creating a configuration for a set of hardware components requires a firmware definition. This is a<br />
detailed description of the hardware components allowed for the instrument, as well as their functionality<br />
and constraints. An instrument’s firmware definition is automatically loaded from the firmware into<br />
CONFIG when a connection is established with the instrument. If working with CONFIG off-line without<br />
a connection to the instrument, a firmware definition can be loaded directly from a file or database<br />
using functionality provided by the Offline Mode menu.<br />
The loaded firmware definition is automatically saved to the database every time the configuration is<br />
saved to the database.<br />
As soon as the firmware definition is loaded existing configurations can be changed or new ones can<br />
be created. The active configuration can be changed, which appears on the screen when a connection<br />
with the instrument has been established, by adding and deleting components and changing the settings<br />
for component properties. The entry for the active configuration can be overwritten with the modified<br />
configuration in the database (see “Save Configuration to Database” in Section Save Configuration<br />
To Database on page 64). Finally, the modified configuration can be activated (see “Activate<br />
Configuration” in Section Activate Configuration on page 66).<br />
Any inactive configuration can be changed by loading it into CONFIG from a file or the database, editing<br />
its information, and then overwriting the configuration file or the entry for the configuration in the<br />
database.<br />
Completely new configurations can be created and saved to a file or the database.<br />
ATTENTION!<br />
A completely new or changed instrument configuration must be saved to the database before it can be<br />
applied to the instrument.<br />
To activate a new configuration, copy it from the database to the instrument and restart the instrument<br />
firmware.<br />
In contrast with other plug-ins, CONFIG can communicate with the X-ray instruments directly, without<br />
the <strong>Measurement</strong> Server acting as an intermediary.<br />
Getting Control of the Instrument<br />
Control of the instrument by CONFIG is required for activation of a configuration. This is obtained automatically<br />
by the software, regardless of whether the user has established an indirect (that is, using<br />
the <strong>Measurement</strong> Server) or direct connection between CONFIG and the instrument. If, when activation<br />
of a configuration is attempted, the instrument is controlled by another plug-in instance, this will be<br />
signaled by an error message.<br />
As with other plug-ins, getting control of a connected instrument by means of an indirect connection<br />
presupposes that control of the instrument has already been obtained for the <strong>Measurement</strong> Server.<br />
This is done using the item “Status window” of the start menu of the <strong>Measurement</strong> Server (see Section<br />
Getting and Releasing Control of and Reconnecting to Instruments on page 9).<br />
Screen Layout and Operation<br />
The CONFIG page consists of two windows: the Config Tree window to the left, in which the components<br />
of an instrument are arranged hierarchically in a tree structure and the Properties window ad-<br />
DOC-M88-EXX191 V3.0 – 11.2012 53
<strong>User</strong> <strong>Manual</strong><br />
<strong>Bruker</strong> AXS <strong>Measurement</strong> <strong>Suite</strong><br />
joining it to the right, with sub-windows containing groups of data entry fields in which settings for the<br />
instrument components can be made and existing settings changed.<br />
Fig. 53: Interface of the CONFIG plug-in<br />
A series of speed buttons is located directly above the Config Tree window (see Section Speed Buttons<br />
on page 89 below) for quick and easy access to the most frequently used CONFIG functions.<br />
The two windows are separated by a splitter line. The width of both windows can be altered by seizing<br />
this line with the mouse pointer and dragging it to the left or right.<br />
NOTE<br />
The appearance of the Configuration tab page varies depending on the connected instrument, since<br />
the mounted components may vary in each case.<br />
Config Tree Window<br />
The configuration tree shown in the Config Tree window is a logical arrangement of the configurable<br />
components of an X-ray instrument. In some cases, the hierarchical relationship between a component<br />
at one level and sub-components at the level below it reflects a physical state. In this case, the<br />
higher-level component is called a “container”. The component ControlRack, for example, contains a<br />
set of sub-components DIBoardO, AIBoard0 and AIBoard2, which are circuit boards that are inserted<br />
into the control rack.<br />
Selecting a component in the configuration tree causes its configurable properties to appear in the<br />
Properties window.<br />
The first tree item (Basic Instrument Information, see Fig. 54) shows firmware version and network<br />
information of the currently connected Instrument and network information of the <strong>Measurement</strong> Server.<br />
54<br />
DOC-M88-EXX191 V3.0 – 11.2012
<strong>Bruker</strong> AXS <strong>Measurement</strong> <strong>Suite</strong><br />
<strong>User</strong> <strong>Manual</strong><br />
When configuring the X-ray instrument it is advised to start with the highest component in the tree and<br />
then work through the other components in their hierarchical order.<br />
Component Status<br />
Icons to the left of the component names in the configuration tree indicate the current status of the<br />
components. Components for which no icons appear have the status OK.<br />
If a component has an error or warning status, the status will also be indicated for all higher-level<br />
components in the tree. If one lower-level component has a warning status but another has an error<br />
status, the higher-level components will be assigned an error status since this is prioritized.<br />
Component Status Icons<br />
Icon Description Meaning<br />
Error<br />
An incorrect value has been entered for a component property (for example, it<br />
lies outside the allowed range, the socket is already used by another plug, or<br />
a lower-level component has an error status). To correct the error adjust the<br />
setting.<br />
Unknown<br />
Warning<br />
A component of this type is not described in the current firmware definition.<br />
Therefore, the firmware will ignore this component. The properties cannot be<br />
changed.<br />
This could be caused by an unconnected optional plug or the warning status<br />
of a lower-level component.<br />
.<br />
NOTE<br />
By placing the mouse pointer on a component name in the configuration tree, a tooltip appears that<br />
indicates the current status. If an error and a warning message appears, a reason for the status is<br />
given.<br />
Properties Window<br />
The Properties window contains several sub-windows that vary in number and kind according to the<br />
component selected.<br />
The plugs of the component along with the components to which they are connected are listed in table<br />
form in the sub-window “Plugs”. The socket numbers of the target components into which the plugs<br />
are plugged are listed as well. Editable data fields are provided. These allow a plug to be plugged<br />
into the socket of a selected target component. These allow the existing plug-socket connections to<br />
be changed as required.<br />
In the sub-window “Sockets” the sockets of the component and the components whose plugs are<br />
plugged into them are listed in table form. Since data cannot be entered in the table, this overview can<br />
only be used for diagnostic purposes.<br />
The sub-windows “Settings”, “Expert Settings” and “Advanced Settings” contain other sets of component<br />
properties. A special sub-window “Registers” for drives contains drive-specific properties. In these<br />
sub-windows data fields are provided for editing the property settings.<br />
Each of the sub-windows can be opened and closed by clicking on the button in the top right corner.<br />
This button appears as either: closed or open.<br />
Some sub-windows, such as those for expert settings or registers, are closed by default. In order to<br />
edit the settings the sub-windows must be opened.<br />
DOC-M88-EXX191 V3.0 – 11.2012 55
<strong>User</strong> <strong>Manual</strong><br />
<strong>Bruker</strong> AXS <strong>Measurement</strong> <strong>Suite</strong><br />
Fig. 54: Properties window (on the right) with sub-windows containing properties for the water cooling<br />
unit<br />
At the bottom of the Properties window the following buttons are located:<br />
values.<br />
Discards any changes made in the present session and restores the previous<br />
Click on this button to record any changes made to the property settings for a<br />
component. Otherwise, these changes will be lost when switching to the properties of another component<br />
or when exiting the module.<br />
Click on these buttons to scroll up and down through the items of<br />
the tree. Press the ↑ and ↓ arrow keys of the keyboard to scroll through the components.<br />
Editing Control<br />
When editing settings in the Properties window use the editing control, which provides a guide for the<br />
entering of data in the data fields.<br />
To activate the editing control, place the mouse pointer over the name of a parameter, a unit of measure,<br />
or a data entry field. In the first two cases, an information window will appear with the raw name<br />
and a description of the parameter. This window contains information on the constraints which apply to<br />
the parameter value as well as its default value. In the third case, a tooltip providing information on the<br />
constraints and the default value will appear.<br />
56<br />
DOC-M88-EXX191 V3.0 – 11.2012
<strong>Bruker</strong> AXS <strong>Measurement</strong> <strong>Suite</strong><br />
<strong>User</strong> <strong>Manual</strong><br />
Fig. 55: Information window<br />
Fig. 56: Tooltip<br />
If an incorrect value is entered, the error will be displayed in red and a red warning symbol next to the<br />
data field will appear. .<br />
Fig. 57: Warning symbol indicating an incorrect value<br />
Plugs and Sockets<br />
Some hardware components of the X-ray instruments are connected to other components by electrical<br />
cables. This physical reality is reflected in the software program by plugs and sockets. A plug corresponds<br />
to a cable with a male connector and a socket corresponds to a female connector. For example,<br />
the cable that connects the motor to the axes indexer board is represented by a plug in the configuration.<br />
A plug may also be regarded as an outgoing connection. A socket may be regarded as an incoming<br />
connection from/to an instrument component.<br />
Plugs have statuses that are indicated by icons:<br />
Plug Status Icons<br />
Icon Meaning Description<br />
OK<br />
Plug is OK.<br />
Warning<br />
Error<br />
1) The optional plug is not connected.<br />
2) Status unknown. The plug is not described in the firmware definition. This<br />
plug can be deleted using the menu item “Delete Unknown Plugs” in the Edit<br />
menu (see Section The Edit Menu on page 80).<br />
A mandatory plug is not connected or the plug path points to a non-existent<br />
component or socket.<br />
The settings of the plug and the sockets of the component Safety Board are shown in Fig. 586 as they<br />
appear in the sub-windows “Plugs” and “Sockets”.<br />
DOC-M88-EXX191 V3.0 – 11.2012 57
<strong>User</strong> <strong>Manual</strong><br />
<strong>Bruker</strong> AXS <strong>Measurement</strong> <strong>Suite</strong><br />
Fig. 58: Sub-windows “Plugs” and “Sockets” containing settings for the plug and sockets of the Safety<br />
Board<br />
As shown in the table of the sub-window “Plugs”, the plug Safety Connector of the component Safety<br />
Board is connected to socket 1 of the target component UIOBoard0.<br />
In the column “Connected to Component” the path to the target component is specified.<br />
Information on the constraints regarding the connection of a plug is obtained by clicking on the information<br />
button<br />
at the end of the row of plug information. This opens the Plug Details window.<br />
Fig. 59: Plug Details window for plug Safety Connector<br />
The field “Constraint” in the Plug Details window indicates whether the plug is mandatory or optional.<br />
Mandatory plugs must be connected in the configuration by the user, otherwise, the instrument will not<br />
work properly. If a mandatory plug is not connected, it will be assigned a red status icon. If an optional<br />
plug is not connected, a yellow status icon will appear as a warning..<br />
58<br />
DOC-M88-EXX191 V3.0 – 11.2012
<strong>Bruker</strong> AXS <strong>Measurement</strong> <strong>Suite</strong><br />
<strong>User</strong> <strong>Manual</strong><br />
Other fields indicate the type of component and socket to which the component must be connected, if<br />
connection is mandatory or desired by the user.<br />
The field “Status” contains the same information as that which is displayed for the plug in the Status<br />
column of the Plugs table.<br />
Connecting a Plug<br />
To connect a plug, select a target component with the required socket type from the appropriate dropdown<br />
list in the “Connected to component” column of the Plugs table. Now select a socket number<br />
from the appropriate drop-down list in the “Socket number” column. Finally, click on Apply. The plug<br />
will be plugged into the selected socket of the selected target component.<br />
If the target component drop-down list is empty, this means there are no target components of the<br />
required type with a free socket of the required type in the configuration. In this case, to establish a<br />
connection a new component of the type specified in the Plug Details window must be created (for<br />
example, /Component/LogicalDrive/Detector). To learn how to add a new component, see Section The<br />
Config Tree Context Menu on page 72.<br />
Resource Providers<br />
Resource providers and consumers extend functionality provided by the plugs and sockets described<br />
above. It provides additional degree of freedom for a more detailed configuration and additional properties<br />
for transformation of hardware signals.<br />
Resource Provider is very similar to Socket. Control for the resource provider consists of four columns:<br />
Status, Type, Name and Connected Component, which shows component connected to the resource.<br />
Fig. 60: Resource Providers.<br />
Resource Consumers<br />
Resource consumer functionality is very similar to the plug functionality. Every resource consumer has<br />
a name, which is shown in the Name column. Resource consumer could be connected to some resource<br />
provider of the required type. The type of the provider is displayed in the Type column. The<br />
particular resource can be selected by the name in the Element column.<br />
Fig. 61: Resource Consumers.<br />
The properties button<br />
at the left end of the row opens Resource Configuration dialog. One<br />
can specify there additional transformation properties e.g. Translation Offset or Translation Scalar<br />
shown in the Figure below. This dialog shows also some additional information about resource e.g.<br />
description of the required resource, type of the required resource, constraint of the consumer.<br />
Consumer with a Required constrained has to be connected to the resource, whereas Optional constraint<br />
allows a consumer to be unconnected as well.<br />
DOC-M88-EXX191 V3.0 – 11.2012 59
<strong>User</strong> <strong>Manual</strong><br />
<strong>Bruker</strong> AXS <strong>Measurement</strong> <strong>Suite</strong><br />
Show Components button displays a list of all components from the current configuration, that contain<br />
at least one required resource.<br />
Fig. 62: ResourceConfiguration Dialog.<br />
The File Menu<br />
This menu contains the following items:<br />
Save State: Saves instrument state into the file. The State file contains a complete description of the<br />
instrument and includes the following items: instrument configuration, firmware definition, actual property<br />
values of all components, translation table and system information.<br />
Open State: Opens instrument configuration from the state file.<br />
The Offline Mode Menu<br />
The Offline Mode menu is located in the menu bar at the top of the screen. It allows the creation of<br />
new configurations in offline mode. This means that configurations are possible without establishing a<br />
connection to the instrument. Instead of loading the firmware definition into CONFIG from the instrument,<br />
it is loaded from a file or the database. However, the Offline Mode menu also enables the user<br />
to load the firmware definition from the instrument for the creation of configurations in online mode. In<br />
addition, a menu item allows the user to save the currently loaded firmware definition to a file.<br />
Fig. 63: Offline Mode menu<br />
This menu contains the first three items which are provided in a sub-menu:<br />
Open Firmware Definition from File: Loads a firmware definition from the file on the hard disk of the<br />
computer. When this option is selected, the window Open firmware definition from file opens.<br />
60<br />
DOC-M88-EXX191 V3.0 – 11.2012
<strong>Bruker</strong> AXS <strong>Measurement</strong> <strong>Suite</strong><br />
<strong>User</strong> <strong>Manual</strong><br />
Select a firmware definition file with the extension bfdef in this window and then click on Open.<br />
Open Firmware Definition from Database: Loads the firmware definition from the database. When<br />
this option is selected, the dialog box Open firmware definition from database opens.<br />
Fig. 64: Dialog box Open firmware definition from database<br />
Select the instrument to which the firmware definition belongs in the upper window of this dialog box<br />
and then select the firmware definition in the lower window. Then click the Open button.<br />
Open Firmware Definition from Instrument: Loads the firmware definition from the currently connected<br />
X-ray instrument.<br />
Save Firmware Definition To File: Saves the currently loaded firmware definition to a file on the<br />
hard disk. When this option is selected, the window Save firmware definition to file opens. An existing<br />
file can be overwritten or newly created.<br />
The Config Menu<br />
The Config menu is located in the menu bar at the top of the screen and is used to edit and activate<br />
configurations.<br />
Fig. 65: Config menu with opened Open Configuration sub-menu<br />
The menu contains the following items:<br />
Open Configuration From File: Loads a configuration from the ConfigTemplates directory, which is<br />
the standard directory for configuration files and template files or a directory.<br />
DOC-M88-EXX191 V3.0 – 11.2012 61
<strong>User</strong> <strong>Manual</strong><br />
<strong>Bruker</strong> AXS <strong>Measurement</strong> <strong>Suite</strong><br />
Choosing this option opens the window Open Configuration from File, in which are displayed the<br />
contents of the ConfigTemplates directory. Configuration files have the extension bfcfg. Select the file<br />
to import and click on Open.<br />
Open Configuration From Database: Loads a configuration from the database. When this option is<br />
chosen, the dialog box Open Configuration opens.<br />
Fig. 66: Dialog box Open Configuration from Database<br />
Select the instrument to which the configuration belongs in the upper window of this dialog box and<br />
then select the configuration in the lower window. Then click the Open button.<br />
By clicking on Show All Versions check box, all previously saved versions of the highlighted configuration<br />
are shown. One can open any older version of the configuration.<br />
62<br />
DOC-M88-EXX191 V3.0 – 11.2012
<strong>Bruker</strong> AXS <strong>Measurement</strong> <strong>Suite</strong><br />
<strong>User</strong> <strong>Manual</strong><br />
Fig. 67: Dialog box Open Configuration from Database. Show All Versions.<br />
Open Configuration From Instrument: Loads the active configuration from the currently connected<br />
X-ray instrument.<br />
Upgrade Config File: Upgrades selected configuration file to the firmware version, which is currently<br />
loaded in the Configuration Plugin. The user can see the currently loaded firmware version in the user<br />
control Instrument Control Software Version from the first tree item: Basic Instrument Information<br />
(see Fig. 54).<br />
New Configuration: Clears the currently loaded configuration.<br />
Fig. 68: Config menu with opened Save Configuration sub-menu<br />
Save Configuration To File: Saves the currently loaded configuration to the ConfigTemplates directory<br />
or a directory of choice.<br />
If a configuration should be saved with the intention of loading it later using the Open Configuration<br />
from File function (see above) it should be saved to the ConfigTemplates directory. Likewise, if a configuration<br />
should be saved in part or whole using the Import Templates function (see below), it should<br />
be saved to the ConfigTemplates directory. This is the standard directory for template and configuration<br />
files.<br />
DOC-M88-EXX191 V3.0 – 11.2012 63
<strong>User</strong> <strong>Manual</strong><br />
<strong>Bruker</strong> AXS <strong>Measurement</strong> <strong>Suite</strong><br />
NOTE<br />
Saving a configuration to a file or database will not cause it to become active on the instrument. Use the<br />
Save and Activate function to make configuration active for an instrument or use the Activate Configuration<br />
function (see below).<br />
Save Configuration To Database: Saves the currently loaded configuration to the database. When<br />
this option is chosen, the dialog box Save Configuration to Database opens.<br />
Fig. 69: Dialog box Save Configuration to Database<br />
The Save and Activate button activates the current configuration for an instrument. This function includes<br />
the copying of the configuration to the instrument, to the database and restarts the instrument<br />
firmware.<br />
The user can overwrite an existing database entry for a configuration or create a new one. In order to<br />
overwrite an existing database entry, select it in the lower window of the dialog box and click on Save<br />
and Activate. To create a new entry, overwrite the name of the configuration entry with the new name<br />
in the data field at the top of the dialog box. Then click on Save and Activate.<br />
If the activation is successful, a notification window will appear (see Fig. 73). The connection between<br />
the <strong>Measurement</strong> Server and the instrument must then be re-established.<br />
Once this has been done, the newly activated configuration can be used for measuring operations.<br />
Save the currently edited configuration to the database.<br />
64<br />
DOC-M88-EXX191 V3.0 – 11.2012
<strong>Bruker</strong> AXS <strong>Measurement</strong> <strong>Suite</strong><br />
<strong>User</strong> <strong>Manual</strong><br />
Select the instrument to which the configuration belongs from the list of instruments in the upper window<br />
of this dialog box. Save the configuration to the database. In doing so, an existing entry can be<br />
overwritten for a configuration or newly created. To overwrite an existing entry, select it in the lower<br />
window of the dialog box and click on Save. To create a new entry, overwrite the name of the selected<br />
configuration with the name of the new configuration in the data field at the top of the dialog box and<br />
then click on Save.<br />
Fig. 70: Config menu with opened Templates sub-menu<br />
Import Templates (From File): Inserts the contents or part of the contents of a template file into the<br />
configuration that is currently being edited.<br />
A template is a collection of property settings for a group of logically connected components that can<br />
be used in the modification of existing configurations or in the creation of wholly new ones. For example,<br />
when an existing configuration contains a certain type of generator and water cooling unit, new<br />
settings for these component types can be imported from a template file into the configuration.<br />
A collection of templates for each type of instrument operated by the customer is delivered with the<br />
software. These templates are located in folders in the ConfigTemplates directory, which is the standard<br />
directory for template files and configuration files.<br />
Templates can be created by exporting the property settings for a component or a group of components<br />
from loaded configurations (see the Export Templates function below.)<br />
With the Import Templates function, the user can import complete configurations or parts of configurations<br />
from configuration files created and saved using the Save Configuration to File function (see<br />
above). In this case, the configuration file serves as the template file.<br />
Choosing this option opens the “Import Sections from file” window, which shows the contents of the<br />
ConfigTemplates directory. The names of configuration files have the extension bfcfg. The template<br />
files have the extension bfscn.<br />
To import a template or configuration in whole or in part, select the appropriate file in the “Import Sections<br />
from file” window and click on Open. This opens the dialog box Import Sections from the File.<br />
DOC-M88-EXX191 V3.0 – 11.2012 65
<strong>User</strong> <strong>Manual</strong><br />
<strong>Bruker</strong> AXS <strong>Measurement</strong> <strong>Suite</strong><br />
Fig. 71: Dialog box Import Sections from the File<br />
In this dialog box, all the components whose settings can be imported from the selected file are shown<br />
and arranged in a hierarchical structure. Selecting one of the components causes a description of the<br />
component to appear in the Component description sub-window. If the Show Details check box is<br />
checked, the component types and absolute paths for the components appear in columns.<br />
Select the desired component or components by clicking the corresponding check boxes, and then<br />
click on OK. The related settings will be imported.<br />
Export Templates (To File): Exports the property settings for a component or group of components to<br />
a template file in the ConfigTemplates directory or a directory.<br />
Before choosing this option, select the component or components whose settings are to be exported<br />
in the Configuration tree. To export a single component and its settings, press and hold down the<br />
key and click on the component. To export a range of components and their settings, press and<br />
hold down the shift key and click on the top and bottom components in the range. The intervening<br />
components will be automatically selected. Alternatively, the user can scroll through the range of components<br />
using the ↑ and ↓ arrow keys while holding down the shift key.<br />
After selecting the component or components, click on the menu item. This opens the window Export<br />
Config Sections to File, in which the contents of the ConfigTemplates directory, the standard directory<br />
for template files and configuration files, are shown.<br />
Type a name for the template file (the extension bfscn is supplied by the software) into this window<br />
and click on Save to create the template and save it to the ConfigTemplates directory.<br />
Activate Configuration: Activates any configuration from the database for use by an instrument in<br />
measuring operations. Configurations must be saved to the database before they can be activated.<br />
The activation function includes the upload of the configuration from the database to the currently<br />
connected instrument (the configuration present in the instrument will be overwritten) and the restart of<br />
the instrument firmware.<br />
66<br />
DOC-M88-EXX191 V3.0 – 11.2012
<strong>Bruker</strong> AXS <strong>Measurement</strong> <strong>Suite</strong><br />
<strong>User</strong> <strong>Manual</strong><br />
Choosing the Activate Configuration option opens the dialog box Activate Configuration.<br />
Fig. 72: Dialog box Activate Configuration<br />
In this dialog box a list of configurations available in the database for the currently connected instrument<br />
is displayed. Select the configuration to be activated and then click on the Activate button. The<br />
configuration will be copied to the instrument and the instrument firmware will be automatically restarted.<br />
A notification window will appear informing the user that activation has been successful and that the<br />
connections between the <strong>Measurement</strong> Server and the instrument and between the plug-in and the<br />
instrument must be re-established.<br />
Fig. 73: Notification window<br />
Click on OK in this window to confirm that this information has been read before re-establishing the<br />
connections.<br />
Once this has been done , the newly activated configuration can be used for present tasks.<br />
The View Menu<br />
The View menu is located in the menu bar at the top of the screen. This allows the user to view the<br />
contents of the XML files of the currently loaded configuration and firmware definition. In addition, a<br />
firmware component reference in RTF format from the XML file of the firmware definition can be generated.<br />
This reference can be a useful tool in the creation of configurations.<br />
DOC-M88-EXX191 V3.0 – 11.2012 67
<strong>User</strong> <strong>Manual</strong><br />
<strong>Bruker</strong> AXS <strong>Measurement</strong> <strong>Suite</strong><br />
Other options allow the user to show the type of the selected component and description of the component<br />
in a special window that is opened for this purpose at the bottom of the Config Tree window.<br />
Fig. 74: View menu<br />
The menu items are as follows:<br />
Firmware Component Reference: Allows the user to generate a firmware component reference in<br />
RTF format from the XML file of the firmware definition. This RTF document can be copied to the clipboard<br />
and then pasted into a Word document.<br />
Selecting this option opens the dialog box Generate component reference.<br />
Fig. 75: Dialog box Generate Component Reference<br />
This dialog box contains two tab pages. The Settings page contains three columns of check boxes<br />
that allow the user to specify the type of information to be included in the component reference.<br />
In the first column of check boxes, check the Config box to include those properties that are displayed<br />
and whose values can be changed in CONFIG. If the Write box is checked, the displayed properties<br />
and values can be changed in COMMANDER and TOOLS. . Checking the Read box will display those<br />
properties whose values cannot be changed in COMMANDER and TOOLS.<br />
After choosing these settings, click on the Generate button to generate the component reference. The<br />
generated reference will appear as an RTF document on the RTF Text tab page.<br />
68<br />
DOC-M88-EXX191 V3.0 – 11.2012
<strong>Bruker</strong> AXS <strong>Measurement</strong> <strong>Suite</strong><br />
<strong>User</strong> <strong>Manual</strong><br />
Fig. 76: Generated component reference<br />
When generated, the reference will be copied to the clipboard automatically. It can then be pasted<br />
into a Word document. If only a section of the reference is to be copied, mark the section with the<br />
mouse and click on the Copy RFT button to copy it to the clipboard.<br />
Configuration: Opens a window in which the contents of the XML file of the configuration currently<br />
loaded in CONFIG are displayed.<br />
Fig. 77: Configuration window showing contents of XML file of currently loaded configuration<br />
Firmware Definition: Opens a window in which the contents of the XML file of the firmware definition<br />
currently loaded in CONFIG are displayed.<br />
DOC-M88-EXX191 V3.0 – 11.2012 69
<strong>User</strong> <strong>Manual</strong><br />
<strong>Bruker</strong> AXS <strong>Measurement</strong> <strong>Suite</strong><br />
Fig. 78: Firmware definition window showing contents of XML file of currently loaded firmware definition<br />
Set Component Sorting Indexes: This menu option provides functionality that is of interest to <strong>Bruker</strong><br />
Support personnel only. Show Component Type: Shows the type of the selected component in a<br />
window that is opened especially for this purpose at the bottom of the Config Tree window. The name<br />
of the component type is preceded by the names of other component types in a hierarchical order<br />
specified in the firmware definition. If this item has been chosen, a checked check box appears alongside<br />
the item name in the menu, indicating that the function remains active for any further components<br />
that are selected. It can be deactivated by clicking on the check box.<br />
Show Component Description: Shows a description of the selected component in a window that is<br />
opened especially for this purpose at the bottom of the Config Tree window. When the option “Show<br />
Component Type” is chosen, a checked check box appears next to the item name in the menu. This<br />
indicates that the function remains active for any other components that are selected. It can be deactivated<br />
by clicking on the check box.<br />
The Network Menu<br />
The Network menu is located in the menu bar at the top of the screen and contains the single option:<br />
Instrument Setup.<br />
Fig. 79: Network menu<br />
Instrument Setup: Allows the user to perform the instrument network setup. Choosing this option<br />
opens the dialog box Instrument network setup. The name of the instrument, its static network address<br />
or the dynamic address acquisition, the network mask and communication ports, etc. can be<br />
specified.<br />
70<br />
DOC-M88-EXX191 V3.0 – 11.2012
<strong>Bruker</strong> AXS <strong>Measurement</strong> <strong>Suite</strong><br />
<strong>User</strong> <strong>Manual</strong><br />
Fig. 80: Dialog box Instrument network setup<br />
After entering this data, click on the button Save to Instrument to save the settings to the instrument.<br />
Successful uploading of the network setup to the instrument is confirmed by a dialog box.<br />
Fig. 81: Dialog box Network Setup is successfully written to the instrument<br />
Click on Yes in this dialog box to enable the new network setup for the instrument. Otherwise, the<br />
instrument will run with the old network settings until the next reboot of the instrument.<br />
When Yes is selected, the connection between the instrument and the <strong>Measurement</strong> Server will be<br />
broken and a notification window will appear.<br />
Fig. 82: Notification window Instrument is rebooted<br />
Re-establish the connections between the <strong>Measurement</strong> Server and the instrument and between the<br />
shell and the <strong>Measurement</strong> Server in order to continue working with CONFIGURATION plugin.<br />
Speed Buttons<br />
The speed buttons are located in a row directly below the Menu bar. They provide quick mouse access<br />
to frequently used CONFIG functions.<br />
DOC-M88-EXX191 V3.0 – 11.2012 71
<strong>User</strong> <strong>Manual</strong><br />
<strong>Bruker</strong> AXS <strong>Measurement</strong> <strong>Suite</strong><br />
Add components. <strong>Manual</strong> and automatic component configuration. For the automatic component<br />
configuration, see Register new components on page 69.<br />
Export template<br />
Clone component<br />
Delete component<br />
Open configuration from currently connected instrument<br />
Open configuration from database<br />
Open configuration from file<br />
Save currently loaded configuration to file<br />
Save currently loaded configuration to database<br />
Save configuration to instrument and activate<br />
For detailed information on the functions “Add components”, “Export template”, “Clone component”<br />
and “Delete component”, which are also accessible using the context-sensitive menu of the Config<br />
Tree window, see Section The Config Menu on page 61.<br />
For detailed information on the functions “Open configuration from currently connected instrument”,<br />
“Open configuration from database”, “Open configuration from file”, “Save currently loaded configuration<br />
to file”, “Save currently loaded configuration to database”, and “Save configuration to instrument<br />
and activate”, which are also available in the Config menu, see Section Speed Buttons on page 51.<br />
The Config Tree Context Menu<br />
The Config Tree context menu is opened by right-clicking anywhere in the Config Tree window. It provides<br />
access to editing functions of CONFIG.<br />
72<br />
DOC-M88-EXX191 V3.0 – 11.2012
<strong>Bruker</strong> AXS <strong>Measurement</strong> <strong>Suite</strong><br />
<strong>User</strong> <strong>Manual</strong><br />
Fig. 83: Config Tree context menu<br />
The Import Template and Export Template options of this menu are also provided by the Config menu.<br />
For a description of these options, see Section The Config Menu on page 61.<br />
NOTE<br />
The functions “Add Components”, “Clone Component” and “Delete Component” are also available as<br />
speed buttons (see Section Speed Buttons on page 71)<br />
Add Components<br />
Adds a new component or components with their property settings to the currently loaded configuration.<br />
This function facilitates the modification of existing configurations and the creation of wholly new<br />
ones.<br />
Choosing this option opens the dialog box Add Components. In the left sub-window of this dialog box<br />
the contents of the Instrument Configurations directory are displayed. This is the standard directory<br />
for template files and configuration files. These files are stored in folders in the directory, as described<br />
in Section The Config Menu on page 61.<br />
DOC-M88-EXX191 V3.0 – 11.2012 73
<strong>User</strong> <strong>Manual</strong><br />
<strong>Bruker</strong> AXS <strong>Measurement</strong> <strong>Suite</strong><br />
Fig. 84: Dialog box Add Components<br />
To add a component or components, select the appropriate folder in the left pane with a double mouse<br />
click. Then select a template file or a configuration file with a single mouse click from the contents of<br />
the folder that are then displayed in this pane. The components contained in the selected file will be<br />
displayed. They will be arranged in a hierarchical structure, in the Component pane on the right. A<br />
description of the component will be displayed in the Component description pane near the bottom of<br />
the dialog box when this component is selected. The Insertion status column shows if the insertion of<br />
the component into current configuration is possible for every component in the template:<br />
Ok.Component will be copied from template into configuration.<br />
Component with the same name and path is already existing in the configuration. Only<br />
compatible values will be copied from a template into existing component. An existing component<br />
preserves its type.<br />
Can not insert the component into configuration. A parent component with given path<br />
does not exist in the configuration.<br />
(The components from the Component pane can be cleared by clicking on the arrow pointing backwards<br />
at the top of the left pane. Double-clicking on this arrow returns the user to the folder<br />
level within the Instrument Configurations directory.)<br />
Select the desired component or components by selecting the corresponding check boxes in the<br />
Component pane with a mouse and click on OK. The component or components along with their settings<br />
will be added to the configuration.<br />
74<br />
DOC-M88-EXX191 V3.0 – 11.2012
<strong>Bruker</strong> AXS <strong>Measurement</strong> <strong>Suite</strong><br />
<strong>User</strong> <strong>Manual</strong><br />
Add Components: Show Details<br />
The component types and absolute paths for the components appear in the Component pane when<br />
the Show Details box is checked.<br />
Fig. 85: Show Details<br />
Add Components: Modify Names<br />
This menu allows to adjust names and modify absolute paths of the components in the template before<br />
adding them into configuration.<br />
To change a component name click with left mouse button onto the component and type the new<br />
name. When changing the name or path of the component, paths of all subcomponents will be adjusted<br />
automatically.<br />
Fig. 86: Changing the name of the component.<br />
DOC-M88-EXX191 V3.0 – 11.2012 75
<strong>User</strong> <strong>Manual</strong><br />
<strong>Bruker</strong> AXS <strong>Measurement</strong> <strong>Suite</strong><br />
For complex instruments with multiple tracks, it allows to select a track where the component has to be<br />
inserted.<br />
To select another track or change component absolute path click with left mouse button onto component’s<br />
path and select new path from the upcoming drop down list. Absolute path can be changed only<br />
for top level components.<br />
Fig. 87: Changing the track for the component.<br />
Register new components<br />
Automatically adds optical components that support self-recognition to the currently edited configuration.<br />
In this mode all mounted optical components are automatically recognized in the instrument. The corresponding<br />
configuration template is automatically offered for adding to the currently edited configuration.<br />
In the left top pane a list of new chips that have been recognized in the instrument is displayed. Every<br />
chip has unique identifier and corresponds to a certain optical component.<br />
The left bottom pane displays component names, which belong to the highlighted chip item.<br />
The middle pane displays the recommended configuration template for all components that belong to<br />
the highlighted chip item. The right top pane lists all components in the recommended configuration<br />
template.<br />
In general, all components from the recommended template should be inserted.<br />
The required chip can be selected by clicking on the line in the Recognized new chips pane.<br />
To add a configuration template to the currently edited configuration, click on the Insert button. The<br />
highlighted chip item will now disappear from the list of the Recognized new chips.<br />
One can repeat this operation until all chips disappear from the list.<br />
76<br />
DOC-M88-EXX191 V3.0 – 11.2012
<strong>Bruker</strong> AXS <strong>Measurement</strong> <strong>Suite</strong><br />
<strong>User</strong> <strong>Manual</strong><br />
Fig. 88: Dialog box Add Components with enabled automatic component registration.<br />
Clone Component<br />
Creates an exact copy of a component including all of its property settings.<br />
Select this item after right-clicking on the component to be cloned in the configuration tree to open the<br />
menu. This will open the dialog box Name for the new component. Overwrite the name of the component<br />
to be cloned with the name of the clone.<br />
Fig. 89: Dialog box Name for the new component<br />
The red icon on the left side of the “New name for the component” field indicates a mandatory data<br />
entry. Once a new name is entered, the icon disappears. The icon also serves as a warning if the entry<br />
in this field has already been used by a component in the configuration. In this case, the red icon<br />
will reappear after having left the field.<br />
After the new name has been entered, click on OK and the clone will appear at the same level in the<br />
configuration tree as the component from which it was cloned.<br />
Create Component from Scratch<br />
Creates a new component in the currently loaded configuration without importing the component and<br />
its property settings from a template file or a configuration file.<br />
Select this item after right-clicking on the “parent” component in the configuration tree to open the<br />
menu. The “parent” component is the component under which the new component will be added at<br />
the next level in the configuration tree. This opens the dialog box Create Component.<br />
DOC-M88-EXX191 V3.0 – 11.2012 77
<strong>User</strong> <strong>Manual</strong><br />
<strong>Bruker</strong> AXS <strong>Measurement</strong> <strong>Suite</strong><br />
Fig. 90: Dialog box Create Component<br />
In this dialog box select the requested component from a list of allowed component types and then<br />
enter the new component’s name in the “Component Name” field.<br />
The red icon at the left end of the “Component Name” field indicates that data entry in this field is<br />
mandatory. Once the data has been entered, the icon disappears. The icon also serves as a warning if<br />
a name that has already been used by a component in the configuration is entered . In this case, the<br />
red icon appears after having left the field.<br />
Due to software constraints, the first character of the new component’s name must be a letter.<br />
After the new component’s name has been entered, click on OK. The new component will appear with<br />
default property settings under the parent component in the configuration tree.. These settings must<br />
be edited as required.<br />
Cut<br />
Cuts highlighted component from the configuration and stores it in the temporary storage. Child components<br />
will be lost in this case.<br />
Copy<br />
Copy the highlighted component with all properties, resource and plug values from the highlighted<br />
component into the temporary storage.<br />
Paste Component<br />
Pastes previously copied component as child to the highlighted component.<br />
Paste Values<br />
Paste all properties, resource and plug values from the temporary storage into highlighted component.<br />
Values can be pasted into the component only if the values were previously copied from the component<br />
of the same or related type of component.<br />
Apply Values from Section<br />
Applies the property settings of a source component in a template file or configuration file to a target<br />
component in the currently loaded configuration. Only the components in the file that have the same<br />
type as the target component are displayed for selection as the source component and thus for application<br />
of their settings.<br />
78<br />
DOC-M88-EXX191 V3.0 – 11.2012
<strong>Bruker</strong> AXS <strong>Measurement</strong> <strong>Suite</strong><br />
<strong>User</strong> <strong>Manual</strong><br />
Right-click on the target component in the configuration tree to open the menu. This opens the window<br />
Apply Values from Section, in which a template file (extension bfscn) or a configuration file<br />
(extension bfcfg) can be selected by double-clicking. This file is located in the standard ConfigTemplates<br />
directory. This in turn opens the dialog box Apply Values from Section, in which a list in table<br />
form is displayed . These are similar to the target components. Next to each component the component<br />
type is displayed. Select the appropriate component in the table by clicking on the component<br />
itself or the component type next to it, or scroll up and down using the arrow keys ↑ and ↓. Finally,<br />
click on Apply to apply the property settings of the source component to the target component.<br />
Fig. 91: Dialog box Apply Values from Section<br />
NOTE<br />
Only settings for properties common to both the source component and the target component will be<br />
copied.<br />
Rename Component<br />
Renames a component in the currently loaded configuration.<br />
Right-click on the component to be renamed in the configuration tree to open the menu. This will open<br />
the dialog box New component name Type in the new name. Finally, click on OK to rename the<br />
component.<br />
Fig. 92: Dialog box New component name<br />
The red icon in this dialog box at the left end of the data entry field indicates that the data entry in<br />
this field is mandatory. Once a name is entered, the icon disappears. The icon also serves as a warning<br />
to indicate that the data entry has already been used for a component in the configuration. In this<br />
case, the red icon appears after having left the field.<br />
DOC-M88-EXX191 V3.0 – 11.2012 79
<strong>User</strong> <strong>Manual</strong><br />
<strong>Bruker</strong> AXS <strong>Measurement</strong> <strong>Suite</strong><br />
Delete Component<br />
Deletes a selected component.<br />
Select this item after right-clicking on the component to be deleted in the configuration tree to get the<br />
menu.<br />
The Edit Menu<br />
The Edit menu is located in the menu bar at the top of the screen.<br />
Fig. 93: The Edit menu<br />
The first four items of this menu are also available in the Config Tree context menu. For a description<br />
of these functions, see Section The Config Tree Context Menu on page 72.<br />
Delete Unknown Properties: Deletes all properties that have an “unknown” status This refers to<br />
properties not described in the firmware definition from the selected component.<br />
Delete All Unknown Properties: Deletes all properties that have an “unknown” status. This refers to<br />
properties that are not described in the firmware definition from all components in the configuration.<br />
Delete Unknown Plugs: Deletes all plugs that have an “unknown” status. This refers to plugs which<br />
are not described in the firmware definition.<br />
80<br />
DOC-M88-EXX191 V3.0 – 11.2012
<strong>Bruker</strong> AXS <strong>Measurement</strong> <strong>Suite</strong><br />
<strong>User</strong> <strong>Manual</strong><br />
TOOLS<br />
General<br />
The TOOLS plug-in provides the user with information on the state of the components of an instrument.<br />
This is used primarily to diagnose faults or malfunctions that may occur during measurements<br />
and to carry out “repairs”. This refers to the restoration of impaired components to their normal working<br />
state.<br />
If a fault or malfunction occurs, the components affected are automatically assigned an error status<br />
and the cause of the error is indicated in error registers for these components. This allows the problem<br />
to be identified and resolved quickly.<br />
The necessary “Repair” work usually involves changing of property values and/or sending commands<br />
to the instrument software (firmware), which executes them. For example, if a drive has moved<br />
beyond an upper or lower limit as a result of a malfunction it can no longer be used for normal measuring<br />
operations. However, the drive can be moved back within the limit using the Step up or Step down<br />
commands. Thus, the drive will be restored to its normal working state.<br />
In some cases, the remedial measures can only be carried out directly on the instrument. For example,<br />
if an X-ray tube fails, it must be replaced by an instrument technician.<br />
TOOLS can also be used to perform operations on instrument components for reasons unconnected<br />
with a fault or malfunction. For example, a drive may need to be repositioned in order to permit access<br />
to an instrument part that requires readjustment.<br />
The plug-in indicates faults or malfunctions with an error status to the components. Likewise, impending<br />
problems are indicated in the same manner. The reason for the warning is indicated in the warning<br />
registers. The user is then able to take the necessary preventive measures. For example, if the conductivity<br />
of the water in the water cooling unit is too high, the water registry of the component will be<br />
signaled. The user can then respond by replenishing the water.<br />
Finally, TOOLS can be used to monitor an instrument during measurements and other operations.<br />
Getting Control of the Instrument<br />
Control of the instrument by TOOLS is required for sending information to the instrument, for example,<br />
while changing property values or performing “repairs”. In TOOLS, control of the instrument can be<br />
obtained and released using the Get Control/Release Control speed button in the TOOLS interface<br />
(see Section Speed Buttons on page 89). If , the instrument is controlled by another plug-in instance<br />
when control is requested, a window will appear requesting confirmation.. If confirmed, control will be<br />
handed over. Any measurement and/or other operations, which are in progress will be aborted.<br />
As is the case with other plug-ins, obtaining control of a connected instrument for the plug-in by using<br />
an indirect connection presupposes that control of the instrument has already been obtained for the<br />
<strong>Measurement</strong> Server. Obtaining control of the instrument is carried out by selecting the item “Status<br />
window” in the start menu of the <strong>Measurement</strong> Server (see Section Getting and Releasing Control of<br />
and Reconnecting to Instruments on page 9).<br />
Screen Layout and Operation<br />
The TOOLS page consists of two windows: the Component Tree window to the left contains the components<br />
of a connected instrument, which are arranged hierarchically in a tree structure. This is similar<br />
to the CONFIG plug-in and the Component State window adjoining it to the right, in which information<br />
on the state of the component selected in the component tree is displayed. This information also includes<br />
the properties of the component. For some properties, data entry fields are available. In these<br />
fields the property values for “repair” or other purposes can be changed..<br />
In addition, two TOOLS-specific menus, the Settings menu and the Utilities menu (some components<br />
only), are provided in the menu bar at the top of the screen.<br />
The Settings menu is used to save an overview of component states for later use and to access Direct<br />
Command Mode for changing property values and sending of commands easily.<br />
The Utilities menu provides a component-specific set of commands. These commands are made<br />
available as speed buttons. (see Section Speed Buttons on pages 89 below).<br />
DOC-M88-EXX191 V3.0 – 11.2012 81
<strong>User</strong> <strong>Manual</strong><br />
<strong>Bruker</strong> AXS <strong>Measurement</strong> <strong>Suite</strong><br />
Fig. 94: <strong>User</strong> interface of the TOOLS plug-in<br />
The two windows on the TOOLS page are separated by a splitter line. To increase or reduce the width<br />
of the views offered by each window, this line must be dragged with the mouse pointer to the right or<br />
left. In addition, the height can be increased or reduced by dragging the lower edge of the screen with<br />
the mouse pointer up or down.<br />
Component Tree Window<br />
As in the CONFIG plug-in, the tree shown in the Component Tree window is a logical arrangement of<br />
the components of the connected X-ray instrument. Some of the components are actually subcomponents<br />
of other components (the term “components” is used loosely in the software and in this documentation<br />
to describe both components and subcomponents), and in these cases the component tree<br />
also reflects this physical state. In such cases, the higher-level component is called a “container”. For<br />
example, the component ControlRack contains a set of subcomponents DIBoardO, AIBoard0 and<br />
AIBoard2, which are circuit boards that are inserted into this control rack.<br />
The component tree also contains virtual components such as RemoteControl and <strong>Measurement</strong>. The<br />
functions of these two components are described in Sections RemoteControl on page 93 and <strong>Measurement</strong><br />
on page 94 below.<br />
Selecting a component in the component tree causes information on the state of the component to<br />
appear in the Component State window.<br />
Right click brings up the context menu.This menu provides a list of operations supported by the component.<br />
The menu is identical to the Utilities menu.<br />
The status of each component is indicated by a status icon that appears alongside the component<br />
name. Except for the OK icon, which does not appear in the Component Tree window, all icons appear<br />
in both windows. The following status icons are used:<br />
82<br />
DOC-M88-EXX191 V3.0 – 11.2012
<strong>Bruker</strong> AXS <strong>Measurement</strong> <strong>Suite</strong><br />
<strong>User</strong> <strong>Manual</strong><br />
Component Status Icons<br />
Icon Meaning Description<br />
OK<br />
The component can now be used in measurements.<br />
Busy<br />
Warning<br />
Error<br />
Disabled<br />
Unmounted<br />
Unknown<br />
The component is currently in operation.<br />
A warning has been given for a component. However, for the time being the<br />
component can be used in measurements<br />
Indicates a faulty component. This means that the component cannot be<br />
used in measurements. Other components that are dependent on the faulty<br />
one cannot be used either.<br />
The component is not available. Use the CONFIG plug-in to check whether<br />
the component has been configured correctly.<br />
The component is not mounted on the instrument. The user can change<br />
this status by mounting the component.<br />
No status has been transmitted by the firmware.<br />
Component State Window<br />
At the top of the Component State window the name of the selected component is displayed. Directly<br />
to the left, an icon indicating the component’s status is also shown. This icon appears next to the<br />
component in the component tree, except for when it indicates the status OK .<br />
Fig. 95: Component State Window (on the right) showing selected component with subcomponents<br />
If the component contains subcomponents, these are displayed in the area below the name of the<br />
component. The user can navigate to any subcomponent by clicking on its name. The subcomponent<br />
is then automatically selected in the component tree and information on its state is displayed in the<br />
Component State window.<br />
DOC-M88-EXX191 V3.0 – 11.2012 83
<strong>User</strong> <strong>Manual</strong><br />
<strong>Bruker</strong> AXS <strong>Measurement</strong> <strong>Suite</strong><br />
Properties Area<br />
The Properties area is located directly below the subcomponents area or the component name. In this<br />
area, the most important properties of the component and their values are displayed.<br />
Fig. 96: Properties area for component Enclosure with an open property information window<br />
In most cases, some or all of the properties can be edited. Properties whose values can be changed<br />
are recognized by the buttons in their data fields. These buttons are used to send newly entered<br />
property values to the instrument.<br />
Position the mouse pointer above the name of a property. A property information window will appear<br />
and a description of the property and the restrictions applying to the value in each case will be given.<br />
Registers<br />
A set of component registers, either in tab pages or as lists is usually located below the Properties<br />
area. The user can navigate between the lists by clicking on the list names in the list directory. The set<br />
of registers often includes error, warning, and state registers. If a component has an error status, the<br />
nature of the error is indicated by a checked box next to an item in the error register. Likewise, the<br />
nature of a warning is indicated by a checked item in the warning register. Information about the current<br />
state of the component is provided in the state register. A checked item does not necessarily<br />
mean that the component has an error or warning status.<br />
Fig. 97: Alarm register for a water cooling unit<br />
Miscellaneous Properties Window<br />
The Misc button in the bottom left-hand corner of the Component State Window provides access to<br />
the Misc. Properties window, in which all properties of the component, their values and units of measure<br />
in tabular form are displayed. Descriptions of the properties are also provided.<br />
84<br />
DOC-M88-EXX191 V3.0 – 11.2012
<strong>Bruker</strong> AXS <strong>Measurement</strong> <strong>Suite</strong><br />
<strong>User</strong> <strong>Manual</strong><br />
Fig. 98: Misc Properties window<br />
As in the Properties section, the values of editable properties can be changed. For more information<br />
on changing property values, see the following section.<br />
Changing the Value of Properties<br />
To change the value of properties in the Properties area of the Component State window and in the<br />
Misc. Properties window, sufficient user rights are necessary. In addition, the TOOLS plug-in instance<br />
must have control of the instrument. (To get control of the instrument for the TOOLS plug-in, follow the<br />
instructions in Section Speed Buttons on page 89 below.)<br />
Changing the Values of Properties in the Properties Area<br />
Place the mouse pointer on the data entry field of a changeable property in the Properties area and a<br />
tooltip will appear, describing the constraints applying to the value entered. This is standard for data<br />
entry fields for properties throughout the application modules of the <strong>Bruker</strong> AXS <strong>Measurement</strong> <strong>Suite</strong>.<br />
Fig. 99: Properties area with tooltip for the property Ramp down<br />
After changing the value of a property, click on the button in the data field to send the newly entered<br />
value to the instrument.<br />
If an erroneous value for a property has been entered, the value will appear in red font after having<br />
clicked on the send button. If, the value has not been accepted by the instrument for any reason, a red<br />
icon with a white cross will appear to the left of the data field. When the mouse pointer is positioned<br />
over the red icon, a text appears stating the reason for rejection of the newly entered value.<br />
Fig. 100: Red icon and red font indicating an incorrect value<br />
DOC-M88-EXX191 V3.0 – 11.2012 85
<strong>User</strong> <strong>Manual</strong><br />
<strong>Bruker</strong> AXS <strong>Measurement</strong> <strong>Suite</strong><br />
Changing the Values of Properties in the Misc. Properties Window<br />
To change the value of a property in the Misc. Properties window, click on the appropriate cell in the<br />
value column to open a window containing a standard data entry field for a property. Enter the new<br />
value in this field within the specified constraints. After entering the new value, click on the Send button<br />
to send it to the instrument.<br />
To exit the window containing the date entry field at any time, press the Esc button.<br />
Fig. 101: Dialog box for changing property values in Misc. Properties window<br />
In the example shown in Fig. 101: the value for the target position of the drive has been changed. This<br />
moves the drive to the newly specified position.<br />
CAUTION<br />
The changing of property values may result in damage to the instrument. Both the property values and<br />
the instrument should be kept under close observation during these operations. For safety reasons,<br />
ReadWrite rights for the TOOLS plug-in should be granted to experienced users only.<br />
TOOLS-Specific Menus<br />
In addition to the File, Edit, Help and Window menus (common to all plug-ins), the menu bar of the<br />
TOOLS plug-in contains the Settings menu and (some components only), the Utilities menu. While<br />
the contents of the Settings menu are the same for all components, those of the Utilities menu differ<br />
according to the selected component.<br />
The most important commands of the Utilities menu are made available as speed buttons, which are<br />
arranged in a row directly below the menu bar.<br />
In the following section, the Utilities menu for drives of the stepper type is described by way of example.<br />
The Utilities Menu<br />
As explained above, the commands made available in the Utilities menu are employed to carry out<br />
“repair” and other operations on components. In Fig. 102 a version of the Utilities menu specific to<br />
drives of the stepper type is shown by example. Versions with other items are available for other types<br />
of drives. However, many of these items are the same as those in the menu version of the stepper<br />
drive. The items shown within the utilities menu are identical to the ones displayed by object tree context<br />
menu.<br />
86<br />
DOC-M88-EXX191 V3.0 – 11.2012
<strong>Bruker</strong> AXS <strong>Measurement</strong> <strong>Suite</strong><br />
<strong>User</strong> <strong>Manual</strong><br />
Fig. 102: Utilities menu for a stepper drive<br />
Utilities Menu Commands for Drives of Stepper Type<br />
Command Name Description<br />
Find Reference<br />
Move drive to position of light barrier serving as reference point for<br />
ZI value<br />
Go<br />
Go to<br />
Initialize<br />
Reset<br />
Steps<br />
Stop<br />
Drive teaching<br />
Tune drive<br />
Repair<br />
Initialize drive<br />
Reset drive<br />
Steps<br />
Stop drive<br />
Enable drive teaching<br />
Moves the drive upwards and downwards at speeds controlled by<br />
a slider. The user must choose between two maximum speeds.<br />
Guides the user through a repair process by calling several methods.<br />
Whenever available, this command should be used to carry<br />
out repairs. For more detailed information on the Repair command,<br />
see below.<br />
The most important commands of the Utilities menu version for stepper drives are available as speed<br />
buttons (see Section Speed Buttons on page 89 below) as with other versions of the Utilities menu.<br />
Repair Command<br />
The Repair command is only available for components that can be “repaired” in a user-guided automatic<br />
process.<br />
Initially, the Repair method analyzes the component. If the component is faulty, the method starts to<br />
“repair” the component by calling available methods using the commands of the speed buttons and<br />
DOC-M88-EXX191 V3.0 – 11.2012 87
<strong>User</strong> <strong>Manual</strong><br />
<strong>Bruker</strong> AXS <strong>Measurement</strong> <strong>Suite</strong><br />
the Utilities menu. During this process the user may be asked to make decisions that the repair method<br />
itself is unable to make. He may be asked to decide, for example, in what direction the drive should<br />
be moved in search for a reference point.<br />
Fig. 103: Dialog box Repairing – with request for user guidance<br />
The user follows the “repair” process in the dialog box Repairing. In the example shown above, the<br />
user has been requested to specify the direction in which the search for a reference point is to be carried<br />
out.<br />
The repair process can be stopped with the Stop command at any time. For example, if a drive is<br />
moved in the wrong direction during a search for a reference point and there is a risk of collision with<br />
another drive, the Stop command can be used to interrupt the movement. The Find Reference command<br />
can then be used to initiate a search in the other direction. If the “repair” should continue the<br />
dialog box must first be closed and the Repair process started again. Alternatively, the remaining<br />
repair work can be carried out manually with the commands provided.<br />
When the “repair” has been successfully completed, a notification is displayed in the upper part of the<br />
dialog box.<br />
Dialog Boxes for Commands<br />
Some commands require setting of parameters. When such a command is selected by clicking on an<br />
item in the Utilities menu or on a speed button, a dialog box for the value entry will appear. Examples<br />
of two dialog boxes are shown below.<br />
Dialog Box Go<br />
The dialog box Go is opened when the drive-specific command Go is selected.<br />
Fig. 104: Dialog box Go<br />
88<br />
DOC-M88-EXX191 V3.0 – 11.2012
<strong>Bruker</strong> AXS <strong>Measurement</strong> <strong>Suite</strong><br />
<strong>User</strong> <strong>Manual</strong><br />
The values of the parameters can be changed in the data fields. Click on the specific parameter or<br />
click directly on the data field. Restrictions for entering values will then appear. . After the values have<br />
been entered, click on the Send button to send the command to the instrument.<br />
CAUTION<br />
Sending commands may result in damage to the hardware, for example, through the collision of two<br />
drives. Therefore, ReadWrite access rights should be granted to advanced users only. When sending<br />
commands, keep the instrument under observation with a camera.<br />
Dialog Box Tune Drive<br />
The dialog box Tune Drive is opened when the drive-specific command Tune drive has been selected.<br />
Fig. 105: Dialog box Tune Drive<br />
The combo box on the left side of this dialog box offers two maximum speeds - slow and fast - for<br />
selection. Dragging the slider in the lower part of the dialog box to the left causes the drive to move<br />
downwards; dragging it to the right causes it to move upwards. The further the slider is dragged in<br />
either direction, the faster the drive moves. The maximum speed is the speed selected in the combo<br />
box. The actual speed is shown in the Actual value field. When the mouse button is released, the<br />
slider jumps back to the central position and stops the drive movement.<br />
CAUTION<br />
When moving the drive using the dialog box Tune Drive, always allow for the delay that occurs between<br />
actuation of the slider and the resulting acceleration/deceleration of the drive. This time lag is<br />
due to the mass inertia of the drive.<br />
Speed Buttons<br />
Depending on the component selected in the Configuration tree, different speed buttons are available<br />
in the speed bar directly below the menu bar. The speed buttons provide access to the most important<br />
commands of the Utilities menu version made available for the selected component.<br />
A Get Control/Release Control speed button is provided in all cases independently of the component<br />
selected. If control of the connected instrument has not yet been obtained, this button remains in the<br />
Get Control state . It switches automatically to the Release Control state when control is<br />
obtained.<br />
The Get Control/Release Control speed button is located at the left end of the speed bar.<br />
If the TOOLS plug-in instance does not have control of the connected instrument, all speed buttons<br />
that provide access to commands of the Utilities menu will be disabled.<br />
Fig. 106: Speed bar as it appears for a selected drive – control not yet obtained<br />
DOC-M88-EXX191 V3.0 – 11.2012 89
<strong>User</strong> <strong>Manual</strong><br />
<strong>Bruker</strong> AXS <strong>Measurement</strong> <strong>Suite</strong><br />
Fig. 107: Speed bar as it appears for a selected drive – control obtained<br />
Getting and Releasing Control of the Connected Instrument<br />
The TOOLS plug-in is unique among the modules of the <strong>Bruker</strong> AXS <strong>Measurement</strong> <strong>Suite</strong>: The control<br />
of the connected instrument must be requested and obtained from the <strong>Measurement</strong> Server or from<br />
the instrument itself before operations can be carried out on the instrument.<br />
If a direct connection with the instrument has been established activating the Get Control/Release<br />
Control speed button in the Get Control state sends a GetControl command to the instrument. An<br />
attempt will then be made by the TOOLS plug-in to get control If a connection with the instrument has<br />
been established using the <strong>Measurement</strong> Server, the command will be sent to the <strong>Measurement</strong><br />
Server and a similar attempt to get control will be made. The <strong>Measurement</strong> Server can only give instrument<br />
control to the TOOLS plug-in if control has already been granted (see Section Getting and<br />
Releasing Control of and Reconnecting to Instruments on page 9, above) and has not been passed on<br />
to another plug-in instance.<br />
ATTENTION!<br />
Obtaining control of an instrument with the TOOLS plug-in will abort all measuring operations being<br />
carried out on the instrument. When control is released, the job is restarted.<br />
Click on the Get Control/Release Control speed button in the Release Control state to release control<br />
of the connected instrument.<br />
If the user leaves TOOLS or exits the <strong>Bruker</strong> AXS <strong>Measurement</strong> <strong>Suite</strong> without releasing control of the<br />
instrument in this way, control will be released automatically.<br />
Diagnosing Faults and Malfunctions and Taking Remedial Action<br />
This section describes how to diagnose a fault or malfunction and provides the necessary commands<br />
to rectify the situation. An error affecting a drive of the stepper type serves as an example. Errors affecting<br />
other instrument components, must be solved using relevant hardware manuals, which provide<br />
information on remedial action. Once the problem is identified the appropriate commands must be<br />
selected for the component by the software.<br />
Fig. 108 below shows an error register for drives of the stepper type.<br />
Fig. 108: Error register for drives of stepper type<br />
Checked items in the error register whose names end with “limit’ indicate that a limit has been exceeded<br />
and the actual drive position is incorrect. With the command Steps or Tune drive, the drive<br />
must be moved back to a position within the limit. For example, a drive for which Lower limit is<br />
90<br />
DOC-M88-EXX191 V3.0 – 11.2012
<strong>Bruker</strong> AXS <strong>Measurement</strong> <strong>Suite</strong><br />
<strong>User</strong> <strong>Manual</strong><br />
checked must be moved upwards to be brought back within the limit. Depending on the drive and the<br />
nature of the error, the command Tune drive may be unavailable.<br />
If multiple drives must be moved to resolve the error, the order in which they should be restored to<br />
their normal operating state must be predicted by studying the drive arrangement on the instrument.<br />
If Homing Error or Wrong Home Mark is checked, the user must search for a reference point using the<br />
command Find Reference.<br />
For various other errors, the user should use the command Reset and then select Stop. After this<br />
procedure has been completed, the error flag must be re-analyzed. After a drive has been reset, it<br />
may be necessary to search for the reference and use Initialize.<br />
CAUTION<br />
Moving drives may result in damage to the instrument. Both the drives and the instrument should be<br />
kept under close observation during these operations. For reasons of safety, ReadWrite rights for the<br />
TOOLS plug-in should be granted to experienced users only.<br />
The Settings Menu<br />
The Settings menu is located in the menu bar at the top of the screen.<br />
Fig. 109: Settings menu<br />
The Settings menu contains the following items:<br />
Open State: Displays an overview of an instrument state that has been saved previously to a file using<br />
the Save function of the File menus Save State entry.<br />
Saving and Opening Instrument States<br />
The overview of the current state of an instrument provided by both windows of the TOOLS page can<br />
be saved to a Zip file using the File menu. This file can be opened later and the overview displayed for<br />
analytical purposes. The file can also be sent to a <strong>Bruker</strong> Service specialist for analysis when support<br />
is needed to identify malfunctions.<br />
When the Zip file is opened, the instrument state overview is displayed in an Offline State window. The<br />
interactive functionality of the two windows of the TOOLS page is still available. This means that the<br />
components in the Component Tree window can be selected and their status can be viewed in the<br />
Component State window as is normally done when working with TOOLS.<br />
Direct Command Mode: Offers a convenient way of changing component properties and/or sending<br />
commands to an instrument. Choosing this option opens the Direct Command Mode window.<br />
DOC-M88-EXX191 V3.0 – 11.2012 91
<strong>User</strong> <strong>Manual</strong><br />
<strong>Bruker</strong> AXS <strong>Measurement</strong> <strong>Suite</strong><br />
Fig. 110: Direct Command Mode window<br />
The Direct Command Mode window consists of three sub-windows: “Instrument”, “Command History”<br />
and “Command”.<br />
The component tree is displayed in the Instrument sub-window..<br />
The properties and commands which belong to the components are displayed as branches in a tree.<br />
The commands are identified by a violet symbol and the properties are identified by a yellow and grey<br />
symbol.<br />
The Command sub-window has three panes. When a component is selected in the component tree,<br />
its related commands and properties appear in the left-hand pane of the Command sub-window,<br />
where they are arranged as in the component tree. The name of the component appears in the upper<br />
pane and a description of the component appears in the right-hand pane.<br />
When a command is selected in the component tree or in the left-hand pane of the Command subwindow,<br />
its name appears next to the component name in the upper pane. The related parameters<br />
and their default values may be displayed as well. When parameters have not been assigned a default<br />
value, a question mark will be displayed in its place. In the right-hand pane information related to the<br />
command and its parameters will be displayed. This includes a description of the command (called a<br />
“method” in this pane) and lists of the restrictions for parameter value data entry. The parameter value<br />
measurement units is listed as well.<br />
92<br />
DOC-M88-EXX191 V3.0 – 11.2012
<strong>Bruker</strong> AXS <strong>Measurement</strong> <strong>Suite</strong><br />
<strong>User</strong> <strong>Manual</strong><br />
Fig. 111: Entering values for commands in Command sub- window of Direct Command Mode window<br />
When a property is selected in the component tree or left-hand pane, its name and a related default<br />
value or question mark are displayed. A description of the property and its value restrictions are displayed<br />
in the Command window in a manner similar to that described for the “selection of commands”<br />
above.<br />
Enter a value or values for a command or property, then press the Return key to send the new values<br />
to the instrument software. If a value that is not permitted has been entered, this value will not be sent<br />
and a red exclamation symbol appears in the right hand corner of the Command sub-window. If the<br />
mouse pointer is moved over this symbol, an explanation concerning the rejected data is displayed.<br />
When data is successfully sent to the instrument software, the contents of the upper pane of the<br />
Command sub-window disappear. This data reappears in the Command history sub-window. The<br />
information can be copied, reinserted in the upper pane using the paste function, changed if necessary,<br />
or resent. The user can repeat a previous command quickly and easily.<br />
Switching between components and their related commands and properties is facilitated by a search<br />
function. To search for a component, mark the contents of the upper pane by pressing CTRL + A.<br />
Type in the first letter or letters of the name of the component. Each additional letter which is typed in<br />
refines the search. The search results are displayed in a list in the left-hand pane. The user can scroll<br />
through the list and select the desired component using the mouse button or the tab key.<br />
The tab key can be used to navigate between the values and question marks in the upper pane. The<br />
selected value or question mark is highlighted in blue, while other entries are displayed in red. Simply<br />
overwrite the default value or question mark to change a value.<br />
RemoteControl<br />
The virtual component RemoteControl is located in the lower part of the component tree. . If this component<br />
is selected, information on the control status of the instrument is displayed in the “Instrument<br />
Master” field of the “Properties” panel of the Properties window.<br />
DOC-M88-EXX191 V3.0 – 11.2012 93
<strong>User</strong> <strong>Manual</strong><br />
<strong>Bruker</strong> AXS <strong>Measurement</strong> <strong>Suite</strong><br />
Fig. 112: RemoteControl view<br />
If the instrument is already controlled by a plug-in that is connected to it using a <strong>Measurement</strong> Server<br />
instance, the name of the PC hosting the <strong>Measurement</strong> Server instance and the name of the user of<br />
the plug-in appear in the “Instrument Master” field. If the instrument is controlled by a plug-in that is<br />
connected directly to the instrument, the name of the computer hosting the plug-in and the name of<br />
the plug-in user is displayed. Click on the text to insert the cursor. Then, scroll the text in the field to<br />
the left and right by using the arrow buttons.,<br />
If the instrument is not controlled by a plug-in, no information is displayed in the “Instrument Master”<br />
field. In this case, the user can obtain control of the instrument with the Get Control command.<br />
<strong>Measurement</strong><br />
Like RemoteControl, the component <strong>Measurement</strong> is a virtual component. It can be used to monitor<br />
the status of an instrument before, during and after measuring operations.<br />
Fig. 113: <strong>Measurement</strong> view<br />
The Properties area in the Component State window contains fields in which the values of important<br />
properties are displayed. The properties Max Setup Time and Max Step Setup Time can be altered.<br />
94<br />
DOC-M88-EXX191 V3.0 – 11.2012
<strong>Bruker</strong> AXS <strong>Measurement</strong> <strong>Suite</strong><br />
<strong>User</strong> <strong>Manual</strong><br />
If a measuring operation is currently in progress, control of the instrument cannot be obtained. However,<br />
once the control of the instrument is obtained , the values in the fields “Max Setup Time” and<br />
“Max Step Setup Time” can be altered.<br />
DOC-M88-EXX191 V3.0 – 11.2012 95
<strong>User</strong> <strong>Manual</strong><br />
<strong>Bruker</strong> AXS <strong>Measurement</strong> <strong>Suite</strong><br />
COMMANDER<br />
General<br />
The COMMANDER plug-in is used to create simple measurements and to perform basic operations on<br />
the instrument. The COMMANDER plug-in has three main functions. First is to display instrument<br />
states including current hardware settings, running measurement progress and results. Second is to<br />
perform basic instrument operations like moving instrument components or setting generator power.<br />
And the last one is to create and perform simple measurements.<br />
To perform actions and measurements COMMANDER plug-in needs to create and initiate jobs corresponding<br />
to the actions requested. Jobs can be created and started only when COMMANDER has<br />
control of the instrument and no other jobs are running. Jobs started successfully will appear in the job<br />
list of the JOBLIST plug-in, where they are shown running.<br />
Normal jobs started by the COMMANDER are considered standard jobs. These jobs may be interrupted<br />
by high priority jobs while running.<br />
COMMANDER can be used to set drive properties and to move drives to new positions, as is done<br />
with TOOLS. In addition, properties of the X-ray generator and detector can be controlled.<br />
Drive settings and measurement conditions established in COMMANDER can be saved to an experiment<br />
file and used to create jobs in START JOBS.<br />
Getting Control of the Instrument<br />
Control of the instrument by COMMANDER is required for sending information to the instrument such<br />
as the initialization of a drive or when starting a scan. If the instrument is controlled by another plug-in<br />
instance, the data fields for the instrument settings and the initiation of a scan will be deactivated.<br />
Obtaining control of a connected instrument for the plug-in presupposes that control of the instrument<br />
has already been obtained for the <strong>Measurement</strong> Server. Obtaining control of the <strong>Measurement</strong> Server<br />
is achieved by using the “Status window” in the start menu of the <strong>Measurement</strong> Server (see Section<br />
<strong>Measurement</strong> Server: Getting and Releasing Control of and Reconnecting to Instruments).<br />
Screen Layout and Operation<br />
COMMANDER Page<br />
The COMMANDER page is divided into two main control areas: Instrument Components Panel and<br />
Scan Control. Hardware components and properties are displayed in the Instrument Components<br />
Panel. <strong>Measurement</strong> conditions, progress and results are displayed in the Scan Control. Instrument<br />
Components Panel is the area on the left side of COMMANDER page. It consists of multiple controls<br />
each representing a specific part of instrument hardware. Using these controls one can perform simple<br />
operations on the instrument, for example loading sample into the instrument or setting generator<br />
power.<br />
Scan Control is the area on the right side of the page. Scan Control can be used to view measurement<br />
results. These results are displayed in chart form in real time as measuring operations (called “scans”<br />
in this module). Depending on the detector, scans can be 0D, 1D or 2D. In the picture below you can<br />
see an example of a 2D scan. Scan Control can also be used to create and start jobs that are not executed<br />
according to a predefined measurement method (also called “experiment” in the software) such<br />
as START JOBS, but according to parameters set on an individual basis for each of the jobs.<br />
96<br />
DOC-M88-EXX191 V3.0 – 11.2012
<strong>Bruker</strong> AXS <strong>Measurement</strong> <strong>Suite</strong><br />
<strong>User</strong> <strong>Manual</strong><br />
Fig. 114: COMMANDER page<br />
Instrument Components Panel<br />
Instrument Components Panel is used to view instrument state and to change hardware settings.<br />
Each control area (later referred as component control) inside Instrument Components Panel corresponds<br />
to a specific part of the instrument hardware.<br />
NOTE<br />
Controls displayed in the Instrument Components Panel depend on the instrument type and configuration.<br />
Some controls described below might not be present in your system.<br />
Data entry field<br />
Component controls can contain two types of data entry fields: actual and edited. Actual data fields<br />
show current hardware settings. This type of data field is read-only and has shaded gray background.<br />
Edited data fields are used to define new hardware settings. This type of data field has white background<br />
and the displayed value can be different from the actual hardware setting. Each control has a<br />
special set button to apply new hardware settings entered in the edited data entry field. Placing<br />
checkmark to the right of the edited data entry field selects the entered value to be used during measurement<br />
operation.<br />
When mouse pointer is placed on a read-only data field, a hint window will appear. This window contains<br />
detailed settings information, including data restrictions - allowed and default values. Status icon<br />
indicates whether current value falls within the limits of the component restriction.<br />
DOC-M88-EXX191 V3.0 – 11.2012 97
<strong>User</strong> <strong>Manual</strong><br />
<strong>Bruker</strong> AXS <strong>Measurement</strong> <strong>Suite</strong><br />
Fig. 115: Information window for read-only data field<br />
Placing the mouse pointer on an editable data field causes a hint with similar information to appear.<br />
For both types of data fields, values that lie outside the limits are displayed in red. In the case of the<br />
editable data field, a red symbol to the left of the data field indicates that the entered value is incorrect.<br />
Component Status<br />
All component controls contain a state image to display current state of the corresponding hardware.<br />
Icon Meaning Description<br />
OK<br />
The component has been initialized.<br />
Busy<br />
Not Initialized.<br />
Error<br />
Unknown<br />
The component is currently in operation.<br />
The component has not been initialized.<br />
The component is faulty and cannot be used in measurements. Hardware<br />
dependent on this component cannot be used.<br />
The status has not been received from the firmware.<br />
Sample Changer Control<br />
Fig. 116: Sample Changer Control area<br />
The Sample Changer Control is used to load a sample from its position in a tray or magazine (called<br />
“sample position”) into its measuring position in preparation for a scan. When the scan has been completed,<br />
the sample can be unloaded and returned to its original position.<br />
Loading a sample in this way can save time during creation and execution of jobs. During the time it<br />
takes for the sample to be loaded, the user can set scan parameters or prepare the scan. Scanning<br />
begins immediately after the Start button is pressed<br />
In the read-only data field to the left of this area the position of the sample presently in the measuring<br />
position in the instrument is displayed. This is the actual position in the tray or magazine from which<br />
98<br />
DOC-M88-EXX191 V3.0 – 11.2012
<strong>Bruker</strong> AXS <strong>Measurement</strong> <strong>Suite</strong><br />
<strong>User</strong> <strong>Manual</strong><br />
the sample was loaded and to which it will be unloaded. In the picture above read-only field displays<br />
1A01, which means sample 1A01 is currently loaded for measurement.<br />
To load a sample into the instrument, select the sample position from the drop-down menu of the data<br />
entry field (recognizable by its white background) to the right of the read-only field.<br />
Sample positions are always a combination of a single-digit number, a letter, and a two-digit number<br />
(for example, 1A01, 1B16 and 3C09) irrespective of the type of sample changer used. With a 9-<br />
position FLIP-STICK sample changer, positions always begin with 1A. (examples are: 1A07 and<br />
1A09.) With a D8 AUTO-CHANGER, always begin with 1, (examples are: 1A01, 1B10 and 1C03.)<br />
With a D4 sample changer supporting multiple areas, the position begins with any single-digit number,<br />
(examples are, 1A01, 3B06, and 2C03.)<br />
Thus, position 8 in a 9-position FLIP-STICK sample changer is 1A08. The position in row 3 and column<br />
D in a single-area D8 sample changer is 1D03 and the position in row 5 and column B of area 2<br />
in a D8 sample changer supporting multiple areas is 2B05.<br />
The default position is 1A01.<br />
Samples that are fragile or do not fit into sample positions are placed in the sample lift of the sample<br />
changer by hand. In these cases select MAN in the drop-down menu.<br />
After selecting the sample position as described above, click on the load button<br />
to load the<br />
sample. After the scan has been completed, click on the unload button<br />
its original position in the tray or magazine.<br />
to return the sample to<br />
If the Load option is not used, click on Start after creating the scan and selecting the sample position.<br />
The sample will be loaded automatically before the actual measurement begins.<br />
When the sample has been successfully loaded, the sample position will appear as the active position<br />
in the read-only data field. However, if the sample changer has not been initialized, the sample will not<br />
be loaded and a red line will appear in the left data field. In this case, click on the initialize button<br />
to initialize the sample changer. Now click on the load button again.<br />
If another job is running, the data entry field of the Sample Changer area is deactivated.<br />
Drive Control<br />
The Drive Control area displays goniometer and sample stage drives. Drive Control is used to set<br />
drive properties and to move drives to a desired position in preparation of a measurement.<br />
Fig. 117: Drive Control area<br />
DOC-M88-EXX191 V3.0 – 11.2012 99
<strong>User</strong> <strong>Manual</strong><br />
<strong>Bruker</strong> AXS <strong>Measurement</strong> <strong>Suite</strong><br />
Each line (excluding header line) in the Drive Control corresponds to a specific drive. The information<br />
provided for each drive is the name, current position and unit in which placement of the drive is measured.<br />
NOTE<br />
Only the drives on a connected instrument are listed in the Drive Control area.<br />
Actual values can be copied to the fields for target values by clicking on the<br />
of the list of drives.<br />
copy button at the top<br />
The Properties buttons<br />
open dialog boxes. The property values can be changed here.<br />
Initializing and Moving Drives<br />
Drives are initialized and moved using the Initialize and Go buttons located at the top of the<br />
Drive Control area. The drives must be selected before initializing and moving the drives. . Otherwise<br />
the commands will have no effect.<br />
The drives can be selected or deselected individually by clicking on the check box provided. To select<br />
or deselect all drives click on the checkbox in the header line on top.<br />
Drives must be initialized before they can be moved or before their properties can be set.<br />
To move a drive to a desired position, enter a value for the target position. Check the corresponding<br />
check box and click on the Go button. The drive will move to the target position. Several drives can be<br />
moved simultaneously.<br />
Before scans are initiated, their drives can be moved automatically to target positions. After entering<br />
the values for the target positions, check the corresponding check boxes. The drives will be moved to<br />
these positions when the scan is started.<br />
NOTE<br />
On start of measurement operation values entered in the edited data entry fields are used for the selected<br />
drives.<br />
To stop all moving drives, click on the<br />
button in the Scan Control area (see below).<br />
CAUTION<br />
Moving drives can result in damage to the instrument. When performing such operations, keep the<br />
drive(s) and the instrument under close observation.<br />
When stopping a drive, be aware of the time lag between clicking the Stop button and the actual stopping<br />
of the drive. This time lag is due to a communication delay.<br />
Changing Drive Properties<br />
To change the values of important drive properties, click on the Properties button provided for<br />
the drive. Enter the new values in the dialog box, which will appear. Fehler! Verweisquelle konnte<br />
100<br />
DOC-M88-EXX191 V3.0 – 11.2012
<strong>Bruker</strong> AXS <strong>Measurement</strong> <strong>Suite</strong><br />
<strong>User</strong> <strong>Manual</strong><br />
nicht gefunden werden. shows the dialog box for Theta settings, which is identical to dialog boxes for<br />
other drives.<br />
Fig. 118: Dialog box Theta Settings<br />
Oscillation:<br />
When this box is checked a measuring operation is in progress with a drive oscillation based on the<br />
current amplitude and speed settings.<br />
In this case, the right check box is deactivated.<br />
Select the right check box when oscillation is required for further measuring operations.<br />
Amplitude and Speed:To enter new values for speed and amplitude, oscillation needs to be activated.<br />
New values can be entered in the data entry fields on the right.<br />
Offset: The distance (in degrees or millimeters), in which the drive is to be shifted in order to obtain a<br />
theoretical measured value at the point where it is expected.<br />
Encoder: When this check box is checked, the positions of the drive will be recorded at each measurement<br />
step while the measuring operation is being carried out. These values can be saved with the<br />
measurement data in a file using the command “Save raw file” (see Section Fehler! Ungültiger Eigenverweis<br />
auf Textmarke. on page 97 below).<br />
After the new values have been entered, click on Close to save them. They will be implemented in the<br />
next measuring operation.<br />
Position Control<br />
Position control is used to save drive positions displayed in the drive control. It can be activated by<br />
selecting Position Control in Commander Menu.<br />
To save or load target positions in edited data entry fields first select the position in the drop down<br />
menu and then press corresponding button. Positions in the drop down menu can be renamed.<br />
Position control only saves and loads values entered in the edited data entry fields, it will not move the<br />
drives.<br />
X-Ray Generator Control<br />
The X-Ray Generator Control area is used to change generator settings.<br />
As in the other control areas of COMMANDER, the read-only data fields of the X-Ray Generator Control<br />
area contain actual values.<br />
Enter voltage and current values in the edible data fields. Scroll boxes are provided. After choosing<br />
the desired values, click on the Set button to send them to the generator.<br />
DOC-M88-EXX191 V3.0 – 11.2012 101
<strong>User</strong> <strong>Manual</strong><br />
<strong>Bruker</strong> AXS <strong>Measurement</strong> <strong>Suite</strong><br />
A new value for power, (in watts), will be displayed in the data field below the Set button. This value is<br />
computed automatically from the voltage and current values which were entered. The transfer of the<br />
new values for voltage and current requires a few seconds delay.<br />
However, if a scan is started using Scan Control (see Section Scan Control on page 93 below) and<br />
without having clicked on Set, the voltage and current values, which were entered will be adopted<br />
automatically and used to calculate a new value for power.<br />
Fig. 119: X-Ray Generator Control area<br />
The shutter of the X-ray tube can be opened and closed by using the Open/Close button. When the<br />
shutter is closed, this button is labeled “Open” and vice versa.<br />
If the shutter is closed when a scan starts, the shutter will open automatically.<br />
The X-ray generator can be turned on and off by using the On/Off button. When the generator is off,<br />
this button is labeled “On” and vice versa.<br />
When the Open/Close and On/Off buttons are used, the symbols to their left change accordingly.<br />
If the instrument is a multi-X-ray tube system, select the tube in the tube combo box. This automatically<br />
activates the track with this tube and the new axis offsets are calculated automatically by the instrument.<br />
Detector Control<br />
The Detector Control area allows the user to select the type of detector to be used in measuring operations<br />
and to set properties for this detector. The type of detector available depends on the detectors,<br />
which are mounted on the selected instrument and included in the instrument configuration. Select<br />
the detector type from a drop-down list in the data entry field.<br />
Fig. 120: Detector Control area<br />
Property values for the selected detector type can be changed by clicking on the properties button<br />
. This opens a dialog box.<br />
The dialog box for the scintillation detector settings is described as an example.<br />
102<br />
DOC-M88-EXX191 V3.0 – 11.2012
<strong>Bruker</strong> AXS <strong>Measurement</strong> <strong>Suite</strong><br />
<strong>User</strong> <strong>Manual</strong><br />
Fig. 121: Dialog box Scintillation detector 1<br />
In the dialog box Szinti enter the target values for the high voltage and amplifier gain.<br />
In addition, a pulse height range (Discriminator 1) can be defined. The electrical impulses are registered<br />
by the detector within this pulse range. The range is defined by a lower voltage level and a window<br />
width. These define the extent of the voltage range above the lower level.<br />
Click the check box “Use for <strong>Measurement</strong>” to record the discriminator for use in the next measurement.<br />
OK adopts all the entered values for the next measuring operation. They can be saved along with<br />
other settings to a method file for use in future measuring operations (see Section Fehler! Ungültiger<br />
Eigenverweis auf Textmarke. on page 97 below).<br />
Apply sends the new values to the detector. They will be displayed as current values in the read-only<br />
data fields. If the new values are not transferred with this button, the values will be sent to the detector<br />
automatically when a new job is started.<br />
Update Config updates the configuration file with the new settings.<br />
Cancel closes the dialog box. Entered data will be lost.<br />
For some scintillation detectors additional discriminators can be used. Then Additional Settings button<br />
will be present.<br />
Additional Settings opens a secondary dialog box in which additional discriminators can be defined.<br />
Fig. 122: Dialog box Additional Settings<br />
DOC-M88-EXX191 V3.0 – 11.2012 103
<strong>User</strong> <strong>Manual</strong><br />
<strong>Bruker</strong> AXS <strong>Measurement</strong> <strong>Suite</strong><br />
An additional discriminator (Discriminator 2) can be created in the dialog box Additional Settings, as<br />
is set up in the primary dialog box. Likewise, an open-ended discriminator (Discriminator 3) that has a<br />
pre-defined lower voltage level of 6.4 V can also be created. However, it will not have an upper voltage<br />
level.<br />
The buttons provided in the dialog box Scintillation detector 1 allows the user to change the settings.<br />
This means that after the initial settings have been chosen, the user can record, apply or cancel these<br />
settings.<br />
NOTE<br />
Any combination of discriminators can be used in a scan.<br />
Slit Control<br />
Depending on the slit installed in the instrument, there are two different types of slit controls – fixed slit<br />
control and variable slit control.<br />
Fixed Slit Control<br />
This control is used to set opening size of the slit.<br />
In the read-only field current opening size is displayed. To change the opening size, enter new value<br />
in the edited data entry field and press “Send changes” button<br />
Another way to set the slit opening for the measurement is to enter new value and select the control<br />
by clicking on the checkbox. New value will be set to the instrument when Start button is pressed.<br />
Variable Slit Control<br />
This control allows setting slit mode and slit opening size.<br />
Drop down menu displays current selected mode. To change slit mode select new option from the<br />
drop down menu.<br />
Read-only field shows current slit opening. New slit opening size can be set the same way as for Fixed<br />
Slit Control<br />
Special optics control<br />
Pathfinder and Special Optic Control<br />
Pathfinder control is used to select optic to be used. Selecting one of the options in the dropdown<br />
menu will automatically select corresponding optic mode in the component. If motorized slit is selected,<br />
extra data entry fields will appear where slit opening size can be set. To change the slit opening<br />
size, enter new value in the edited data entry field and press<br />
button.<br />
Rotary Absorber and Filter Wheel Controls<br />
These controls are used in the same manner as Slit Controls. In the read-only field currently selected<br />
filter position is displayed. To change filter or absorber, select new option from the drop down menu<br />
104<br />
DOC-M88-EXX191 V3.0 – 11.2012
<strong>Bruker</strong> AXS <strong>Measurement</strong> <strong>Suite</strong><br />
<strong>User</strong> <strong>Manual</strong><br />
and press button. For rotary absorber there is additional Auto option. Setting this option will<br />
make rotary absorber to switch positions automatically. If the checkbox is marked, then the value in<br />
edited data entry field will be used.<br />
Scan Control<br />
The Scan Control area can be separated into two parts - Chart area where scan images are displayed<br />
and Scan Setup area where measurement conditions can be set. One can start a new scan by pressing<br />
Start button or stop a running scan by pressing Stop button. A stopped scan can be continued by<br />
clicking the Resume button. The scan will be continued from the point where it was interrupted.<br />
The Scan Setup Area<br />
Fig. 123: Scan Setup area<br />
NOTE<br />
The available Scan types, Scan modes and parameter fields are dependent on the instrument configuration<br />
and the selected detector type. Likewise, they are also dependent on the application type, which<br />
can be selected in the File menu.<br />
The following parameter settings can be used:<br />
Scan type and Scan mode: The scan type and scan mode from the drop-down list can be chosen<br />
individually. Each scan type determines which drives will be used.<br />
Time: The duration of each measurement within the scan.<br />
Steps: The number of steps in the scan. This corresponds to the number of measurements.<br />
Start: Drive position at the beginning of a scan.<br />
Increment: A measurement takes place with each increment.<br />
Stop: Drive position at the end of a scan.<br />
When the mouse pointer is placed on any of the fields, a tooltip will appear describing the restrictions<br />
applying to the entered values.<br />
The values displayed in many of the data fields are interdependent. Changing a value in one field will<br />
adjust values in other fields accordingly. For example, if the number of steps in a scan is changed, the<br />
value for the stop position of the drive will be adjusted automatically.<br />
Status information is displayed in the data field directly below the Scan mode field. The status information<br />
displays the progress of the scan.<br />
DOC-M88-EXX191 V3.0 – 11.2012 105
<strong>User</strong> <strong>Manual</strong><br />
<strong>Bruker</strong> AXS <strong>Measurement</strong> <strong>Suite</strong><br />
The following buttons are located in the top right-hand corner of the Scan Control area.:<br />
Starts the scan. If the scan has been stopped, it will be restarted from the beginning.<br />
this button.<br />
Stops the scan. Only scans started from COMMANDER page can be stopped using<br />
Continues the scan from the point at which it was stopped with the Stop button.<br />
The zoomed area fills the entire Chart area when the results of the next scan are plotted.<br />
Autorepeat: If this is checked, a 0D/1D scan repeats endlessly until the user stops the measurement.<br />
At the end of the scan range, the scan starts from the beginning again and the counts are increased.<br />
The Script button is used to maintain a list of user selectable scripts.<br />
The list of scripts is opened when the arrow to the right of the Script button is clicked.<br />
In order to maintain the list of scripts, click on the script button and a dialog box will open:<br />
Fig. 124: Script Edit Dialog<br />
This dialog box allows the user to add/remove scripts to and from the list of scripts. A script can be<br />
e.g. a measurement or an alignment script. See chapter <strong>User</strong> Script Editor to learn how to create<br />
these scripts.<br />
Once a script is added to the button, it can be executed just by selecting it from the list and starting it.<br />
The Chart Area<br />
The results of a scan are displayed in the chart. The data is displayed in real time while the measurement<br />
is being carried out.<br />
The scan progress is visualized next to the X-axis in the appropriate unit, e.g. in degrees, millimeters,<br />
seconds or number of steps.<br />
For example, the number of photons or the temperature is measured along the Y-axis.<br />
A row of tool buttons located above the chart is used to control the display. The following buttons control<br />
the scaling of the Y-axis:<br />
Linear scale<br />
Logarithmic scale<br />
Square root scale<br />
106<br />
DOC-M88-EXX191 V3.0 – 11.2012
<strong>Bruker</strong> AXS <strong>Measurement</strong> <strong>Suite</strong><br />
<strong>User</strong> <strong>Manual</strong><br />
Scale based on number of photons (counts) per second<br />
The following button controls the background on which the results are displayed:<br />
The scan results are displayed on a grid<br />
A data field with a drop-down list of X-axis scales is located to the right of the button. From this list the<br />
options “2Theta”, “Theta”, “Time” and “Step #” can be selected. The scaling of the X-axis is changed<br />
accordingly.<br />
A data field to the far right is a drop-down menu. This drop-down menu can be used to switch between<br />
different plots. The list of plots is dependent on the scan settings. For example, if two discriminators<br />
have been defined for the registration of electrical impulses by the detector (see Section Fehler! Verweisquelle<br />
konnte nicht gefunden werden. on page Fehler! Textmarke nicht definiert.), two different<br />
plots will be produced.<br />
A third data field contains a drop-down list of all the scans that have been carried out since the current<br />
COMMANDER session was started. These scans are identified by their scan type and the date of<br />
execution. The scan results are displayed by selecting the items from the list.<br />
Context Menu<br />
The Chart area context menu is opened by right-clicking on the chart area.<br />
Fig. 125: Chart area context menus<br />
Zoom reset: Cancels zooming.<br />
Zooming<br />
The user can zoom into the graphical display by drawing a rectangle around the desired area. Click on<br />
the display to mark the upper or lower left-hand corner of the rectangle. Hold down the left mouse<br />
button, and draw the rectangle to the right of this starting point. When the mouse button is released,<br />
the area contained within the rectangle is then displayed over the entire Chart area.<br />
If zooming is performed during a scan, the zoomed area is reset automatically after a few seconds.<br />
Dots: Shows the peaks in the graph as dots (0D/1D detector only).<br />
Smoothing: Smoothens a 2D detector image<br />
Automatic Intensity Scale: The intensity of a 2D frame with low count-rate is scaled for better visibility.<br />
When a 2D experiment is performed, the Chart Area contains an additional color scaling control. This<br />
control is used to select the lower and upper color intensity definition and different color schemas. Use<br />
the right mouse button to select these options.<br />
Video Tab<br />
For the instruments equipped with a camera there is a special video tab in the Chart area. Video Tab<br />
area displays images received from the camera. To switch back to scans in the Chart area select<br />
<strong>Measurement</strong> Tab below the image.<br />
DOC-M88-EXX191 V3.0 – 11.2012 107
<strong>User</strong> <strong>Manual</strong><br />
<strong>Bruker</strong> AXS <strong>Measurement</strong> <strong>Suite</strong><br />
Right click on the image brings up a video context menu.<br />
Move stage to this position option will move drives to match the XYZ position selected on the image.<br />
Measure here option will start a measurement with drive position matching XYZ position displayed on<br />
the image.<br />
Selecting Stop all drives option will terminate drive movement.<br />
Additional options in the video context menu are covered in the CAMERA plugin description.<br />
108<br />
DOC-M88-EXX191 V3.0 – 11.2012
<strong>Bruker</strong> AXS <strong>Measurement</strong> <strong>Suite</strong><br />
<strong>User</strong> <strong>Manual</strong><br />
Speed buttons<br />
COMMANDER plug-in has two special speed buttons – save results and stop all jobs<br />
Save Result File button saves the measurement results displayed on the screen<br />
Stop All Jobs button terminates all running and scheduled jobs.<br />
If laser pointer is installed on the instrument, additional laser button will appear in the speed buttons<br />
toolbox. will appear when the laser is turned on and when the laser is off. Pressing this<br />
button will trigger the laser pointer to switch on and off.<br />
The File Menu<br />
Fig. 126: File menu (with COMMANDER-specific items)<br />
Application: The Application Type switches the visible names of the axes in the Drive Control. These<br />
are defined by certain XRD communities. Not only are the axis names changed, but also the Scan<br />
Type and the Scan Mode, depending on the Application Type and the active detector. Please refer to<br />
the instrument manual for a detailed list of scans available.<br />
Save Last Measured Rawfile: Saves the measurement results which are displayed in the chart to a<br />
brml file. This file can be opened for evaluation purposes using e.g. the EVA software package.<br />
Save Experiment: Saves the settings made in the control areas to a bsml file. This file can be used<br />
as an experiment file for the creation of jobs using the START JOBS plug-in (see Section Screen Layout<br />
and Operation on page 33).<br />
Page Setup and Print: Provides functions for chart printing.<br />
Sample ID: This opens a dialog to define the sample ID for commander jobs. The default sample ID is<br />
“Commander Sample ID”. If the sample ID is changed, all new samples measured with the COM-<br />
MANDER are stored in the JOBLIST and in the database with the new ID.<br />
DOC-M88-EXX191 V3.0 – 11.2012 109
<strong>User</strong> <strong>Manual</strong><br />
<strong>Bruker</strong> AXS <strong>Measurement</strong> <strong>Suite</strong><br />
The Commander Menu<br />
Fig. 127: Commander menu<br />
The Commander menu provides the following options:<br />
Stop All Jobs: This stops all jobs running on the instrument. This function is available as speed button<br />
in the toolbar.<br />
Ratemeter: Opens a rate meter window. The current count rate registered by the detector is displayed<br />
as a bar and a number in the window. This windows is only available if the instrument is not in scanning<br />
mode. When scans are being performed, the Commander menu cannot be opened and the rate<br />
meter is unavailable.<br />
The rate meter can be used to adjust the X-ray optics of an instrument.<br />
Fig. 128: The rate meter window<br />
The current count rate is displayed in the upper right corner of the window. In the upper left corner the<br />
current count rate is given as a percentage of the maximum recorded count rate. The recording begins<br />
automatically when the rate meter window is opened.<br />
To save a count rate, click on Set as reference. The data displayed in the upper half of the window<br />
will be saved and displayed in the lower part of the window. The saved count rate can be used as a<br />
reference for comparisons with other count rates when making adjustments to the X-ray optics.<br />
The tube shutter must be opened to register counts. Click on Open Shutter to open the shutter. Click<br />
on Close Shutter to close it.<br />
PSD Realtime Display: Opens a real-time window for PSD detectors like VÅNTEC and LYNXEYE.<br />
This window displays the channel content of those detectors. This windows is only available if the<br />
instrument is not in scanning mode. When scans are being performed, the Commander menu cannot<br />
be opened and the PSD real time display is unavailable.<br />
To open the tube shutter and start count rate registration, click on the Open Shutter button. Click on<br />
Close Shutter to close the tube shutter and stop registration.<br />
110<br />
DOC-M88-EXX191 V3.0 – 11.2012
<strong>Bruker</strong> AXS <strong>Measurement</strong> <strong>Suite</strong><br />
<strong>User</strong> <strong>Manual</strong><br />
Each vertical bar in the graph represents a channel. The Integrate button is located at the bottom of<br />
the window. Integration calculates the average of the values measured at each of the channels. The<br />
calculation is continuous. This means that that measurement variations at different channels are reduced<br />
and the tops of the bars gradually form a smoother line.<br />
Fig. 129: PSD Reatime Display with graph before averaging<br />
Fig. 130: PSD Real time Display with graph after several minutes of integrating<br />
To cancel the integration process, click on the Reset button. The count rates at the channels will be<br />
registered with their natural variations.<br />
Direct Command: Opens the Direct command mode window by which component properties can be<br />
set and commands to the instrument software can be sent. This offers a convenient way to repair<br />
components and carry out other operations on components. This direct command functionality is also<br />
available in TOOLS (see Section The Settings Menu on page 91).<br />
Transmit Drive Positions: Sends the drive positions set in COMMANDER to the Adjusted Positions<br />
table in the Sample Alignment page of the XRD Wizard software application.<br />
DOC-M88-EXX191 V3.0 – 11.2012 111
<strong>User</strong> <strong>Manual</strong><br />
<strong>Bruker</strong> AXS <strong>Measurement</strong> <strong>Suite</strong><br />
Reference and Offset Determination: Calculates the new ZI and offset values. These values can be<br />
set to obtain a peak at a theoretical drive position when measurements of a certain sample are carried<br />
out. ZI values are permanent. This means, when a ZI value is set, it is added to the configuration of<br />
the instrument. Therefore, the ZI value applies to all future measurements carried out on the instrument.<br />
Conversely, offset values are temporary. They apply only for the duration of the instrument session<br />
and are deleted when the instrument is shut down.<br />
Choosing this menu item opens the dialog box “ZI and Offset Determination”.<br />
Fig. 131: Dialog box Reference and Offset Determination – determination of a new offset<br />
The initial information displayed in this dialog box relates to the last completed measurement.<br />
To set a new offset value, enter a value of the theoretical position and click on the tab Offset to display<br />
the current offset and the newly calculated offset value. Click on OK to apply the new offset value.<br />
Fig. 132: Dialog box Reference and Offset Determination – determination of a new ZI value<br />
To set a new ZI value, enter a value for the theoretical position and click on the tab ZI Value to display<br />
the current ZI value and the newly calculated ZI value. Click on OK to apply the new ZI value.<br />
<strong>User</strong> Script Editor<br />
This command opens a dialog window for a simplified interactive script development. These scripts<br />
are used mainly for high resolution applications, but can also be used to change instrument properties.<br />
112<br />
DOC-M88-EXX191 V3.0 – 11.2012
<strong>Bruker</strong> AXS <strong>Measurement</strong> <strong>Suite</strong><br />
<strong>User</strong> <strong>Manual</strong><br />
Fig. 133: The <strong>User</strong> Script Editor<br />
The scripts are developed by drag and drop operations. The user selects an item in the left work item<br />
tree, and drags it into the right edit field. By pasting a work item in the edit field, the execution order is<br />
defined. A double click on a line in the edit field allows to define function parameters.<br />
Select Run to save the script and run it.<br />
Use <strong>User</strong> Script for <strong>Measurement</strong>: If this menu item is checked, the current script in the <strong>User</strong> Script<br />
Editor is being used for the next measurement to be performed with the COMMANDER.<br />
For more information about script development, see chapter Script Designer<br />
DOC-M88-EXX191 V3.0 – 11.2012 113
<strong>User</strong> <strong>Manual</strong><br />
<strong>Bruker</strong> AXS <strong>Measurement</strong> <strong>Suite</strong><br />
DAVINCI<br />
General<br />
The DAVINCI plug-in provides an overview of the components currently mounted on the tracks and at<br />
the center of the goniometer of the connected instrument, as well as their properties. For example,<br />
these components include, the X-ray tube, optical systems including slits and absorbers, a rotating<br />
stage or Eulerian cradle, and the detector.<br />
DAVINCI can be used to perform set-up operations. For example, if a rotary absorber is mounted on<br />
the goniometer, the user can choose between absorbers of different absorption factors. In the case of<br />
TWIN-optic, the user can choose between alternative optical systems. Settings for motorized slits can<br />
also be defined.<br />
The component positions, their location on the primary and secondary tracks and the list of available<br />
components, that can be mounted in each of these positions, are defined in the instrument configuration.<br />
For example, the component "tube mount" and the lower-level components "tube Cu" and "tube<br />
Mo" can be defined in the configuration. These components are assigned to position 1 on the primary<br />
track.<br />
A component recognition system checks whether the components currently mounted in their positions<br />
on the goniometer actually belong to those positions as defined in the instrument configuration. If a<br />
component is incorrectly positioned, a component status error icon appears at the position in the overview.<br />
Getting Control of the Instrument<br />
Control of the instrument by DAVINCI is required to send information to the instrument. For example,<br />
this would apply to new parameter values for a motorized slit. Therefore, the DAVINCI plug-in requests<br />
control to change a parameter value automatically. If the instrument is already controlled by another<br />
plug-in instance, an error message will appear if an attempt is made to send the information.<br />
Similar to other plug-ins, obtaining control of a connected instrument requires that control of the instrument<br />
has already been obtained by the <strong>Measurement</strong> Server. This is done by the item “Status<br />
window” of the <strong>Measurement</strong> Server’s start menu (see Section Getting and Releasing Control of and<br />
Reconnecting to Instruments on page 9).<br />
Screen Layout and Operation<br />
A graphical representation of a goniometer and its tracks is shown on the DAVINCI tab page. Panels<br />
providing information about the current state of the component positions are displayed on top of the<br />
tracks and at the center of the goniometer.<br />
114<br />
DOC-M88-EXX191 V3.0 – 11.2012
<strong>Bruker</strong> AXS <strong>Measurement</strong> <strong>Suite</strong><br />
<strong>User</strong> <strong>Manual</strong><br />
Fig. 134: Interface of DAVINCI - Overview of tracks and center of goniometer of connected instrument<br />
Component positions can be occupied by a single component. For example, a detector or a component<br />
that accommodates another lower-level component, a slit mount and a slit.<br />
When the positions are completely filled with components, each of the information panels contains a<br />
component status icon, a component type icon and left and right information windows with a white<br />
background.<br />
The component status icon serves as a general status icon for all components belonging to a position.<br />
For example, if a Soller mount is located at its position, an OK status icon appears indicating that the<br />
Soller mount is correctly positioned. If both a Soller mount and a Soller slit are located at the position,<br />
but the Soller slit is incorrectly positioned, an “error” status icon appears. If a position is empty, an<br />
“unmounted” status icon is displayed.<br />
The component status icons used in DAVINCI are the same as those used in CONFIG and TOOLS.<br />
For a description of the icons and their meanings, see Section Component Tree Window on page 82.<br />
The gray and blue component type icon represents the most principle component in the position. If the<br />
principle component is absent, the icon will not appear. If the position is taken by a rotary absorber<br />
and its different absorbers the component type icon represents the rotary absorber. If the position is<br />
taken by a Soller mount and a Soller slit, the icon represents the Soller slit. However, if the position is<br />
taken by a TWIN optics, two component type icons appear, which represent the two alternative optical<br />
systems, such as a Goebel mirror and a motorized slit. Both icons are displayed on the information<br />
panel regardless of the optical system that has been chosen.<br />
Component type icons are also imprinted on the hardware components. This enables the user to locate<br />
the required component quickly during manual instrument setup.<br />
When a position is occupied by a single component, the name of the component appears in the left<br />
information window. When it is occupied by two or more components, the name of the principle component<br />
is shown. However, when the position is occupied by a TWIN-optic, the name of the TWINoptic<br />
will be displayed. The name of the chosen optical system will not be shown. If no components<br />
are present, “Empty Position” will be displayed in the left information window.<br />
DOC-M88-EXX191 V3.0 – 11.2012 115
<strong>User</strong> <strong>Manual</strong><br />
<strong>Bruker</strong> AXS <strong>Measurement</strong> <strong>Suite</strong><br />
To summarize, the most important property of the mounted component is displayed in the right information<br />
window. When two components are present, the principle component is displayed. If a rotary<br />
absorber is mounted, the type of absorber that has been chosen will be displayed. Likewise, if a<br />
TWIN-optic is mounted, the chosen optical system will be displayed.<br />
When the mouse pointer is placed over one of the various elements of an information panel, a window<br />
providing information about the element will be opened. When the pointer is placed over a component<br />
type icon, an information window with the name and a description of the component type will<br />
be displayed. Similarly, if the pointer is placed over a position number a window will be opened containing<br />
information about the position as defined in the instrument configuration.<br />
If the user clicks on an information panel a window will be opened that shows the properties of components<br />
mounted in the position. In some cases, data entry fields are provided that can be used for<br />
making settings, as with a motorized slit, or choosing between alternative components, as with a<br />
TWIN-optic or rotary absorber. Buttons are provided in the data fields for sending the new settings<br />
to the instrument.<br />
Similar to other plug-ins, DAVINCI contains an edit control. If the mouse pointer is placed over a parameter<br />
name, a unit, or a data field, a window will be opened. This window provides a description of<br />
the parameter and the restrictions applying to its value. If the field contains a value that has already<br />
been set, this will be indicated. For a full description of the edit control, see Section Editing Control on<br />
page 56.<br />
116<br />
DOC-M88-EXX191 V3.0 – 11.2012
<strong>Bruker</strong> AXS <strong>Measurement</strong> <strong>Suite</strong><br />
<strong>User</strong> <strong>Manual</strong><br />
DETECTOR<br />
General<br />
DETECTOR plugin is used to calibrate detectors for desired measurement mode. In the DETECTOR<br />
plugin one can simply with just a few mouse clicks perform detector specific calibration measurement,<br />
evaluate estimated data and apply new calibration settings to the detector. DETECTOR plugin provides<br />
a set of special calibration procedures for every detector type and model, for example resolution<br />
and zero offset determination, flood field determination etc.<br />
The actually mounted detector will be automatically selected by the DETECTOR plugin. In case if the<br />
instrument has more than one detector mounted on multiple tracks one has to select the desired detector<br />
name in the dropdown box as it shown in figure below.<br />
Fig. 135: Detector selection<br />
In order to be able to make measurements with help of the DETCTOR plugin, one has to connect the<br />
DIFFRAC.SUITE to the measurement server and it presupposed that the <strong>Measurement</strong> Server has<br />
already obtained the control over the instrument.<br />
Detector Menu<br />
DETECTOR plugin has Detector menu at the top of the view.<br />
Fig. 136: Detector menu<br />
Browse LYNXEYE XE detector<br />
This opens a dialog to find a LYNXEYE XE detector in the local area network.<br />
DOC-M88-EXX191 V3.0 – 11.2012 117
<strong>User</strong> <strong>Manual</strong><br />
<strong>Bruker</strong> AXS <strong>Measurement</strong> <strong>Suite</strong><br />
Fig. 137: Browse LYNXEYE XE detector dialog.<br />
Fig. 138: Selecting Network Interface.<br />
Select network interface (network adapter) in the drop down list box and click Browse button to find<br />
detector, as shown in the picture above.<br />
When detector has been found its name, IP address and MAC address will be displayed.<br />
Keep Shutter Close<br />
This function can be applied only to 2D detectors.<br />
1D Detector Calibration<br />
Position sensitive detectors (1D detectors) like LYNXEYE XE, LYNXEYE, SSD160, VÅNTEC-1 can be<br />
adjusted and calibrated with help of DETECTOR plugin.<br />
Resolution and Zero Offset<br />
Determination of the detector angular resolution (angular size of the single detector channel) and zero<br />
offset of the detector. This function supports LYNXEYE XE, LYNXEYE, SSD160 and VÅNTEC-1 detectors.<br />
118<br />
DOC-M88-EXX191 V3.0 – 11.2012
<strong>Bruker</strong> AXS <strong>Measurement</strong> <strong>Suite</strong><br />
<strong>User</strong> <strong>Manual</strong><br />
Fig. 139: Resolution And Offset.<br />
Calibration by Theoretical Calculation<br />
In order to get the calibration measurement succeeded one need to specify approximate values for the<br />
current detector resolution and zero offset. When even approximate values of the resolution and zero<br />
offset are unknown, one can calculate them theoretically with help of Calculate button.<br />
The secondary track radius, total number of the detector channels and size of the single detector<br />
channel will be determined automatically by the DETECTOR plugin.<br />
DOC-M88-EXX191 V3.0 – 11.2012 119
<strong>User</strong> <strong>Manual</strong><br />
<strong>Bruker</strong> AXS <strong>Measurement</strong> <strong>Suite</strong><br />
Fig. 140: Calibration by Theoretical Calculation.<br />
Enables editing of the track radius, number of channels and size of the channel values.<br />
By clicking the<br />
figure below.<br />
button, the view will be changed to the “Results” view as shown in<br />
Fig. 141: Results of the Resolution And Zero Offset Calculation.<br />
“Quality of the Calibration” will stay unchanged in the case of theoretical calculation.<br />
displays calculated zero offset of the detector.<br />
displays calculated resolution of the detector.<br />
In order to apply calculated resolution and zero offset values to the instrument one has to click the<br />
button. This will save the configuration with new values into the database<br />
and into the instrument, which requires a restart of the instrument and reconnection of the DETEC-<br />
TOR plugin.<br />
NOTE<br />
The LYNXEYE XE detector will immediately change the actual and configuration values for the instrument<br />
without restart of the instrument.<br />
120<br />
DOC-M88-EXX191 V3.0 – 11.2012
<strong>Bruker</strong> AXS <strong>Measurement</strong> <strong>Suite</strong><br />
<strong>User</strong> <strong>Manual</strong><br />
Calibration by <strong>Measurement</strong><br />
For the best angular resolution results one has to perform calibration measurement for the detector.<br />
When doing so, the DETECTOR plugin will perform a set of fixed scans and after that calculate automatically<br />
the resolution and zero offset of the detector.<br />
Fig. 142: Calibration by <strong>Measurement</strong><br />
Calibration measurement provides following options:<br />
Determines position of the two theta axis.<br />
Determines position of the theta axis.<br />
When checked, the Theta value is set automatically to a half of 2Theta value. In<br />
order to specify a user defined value, please uncheck the box. Unchecking the box enables Use Actual<br />
button.<br />
Copies actual position of the theta axis into the Theoretical Theta Peak field.<br />
Determines maximum detector opening. <strong>Measurement</strong><br />
has to be started with maximum detector opening.<br />
less then maximum detector opening.<br />
Determines the range of the measurement. It should be<br />
Determines the increment of the detector position between<br />
two fixed scans.<br />
scan.<br />
Determines the measurement time for a single fixed<br />
When the instrument has a sample rotation axes, one can specify rotation speed for every axis.<br />
DOC-M88-EXX191 V3.0 – 11.2012 121
<strong>User</strong> <strong>Manual</strong><br />
<strong>Bruker</strong> AXS <strong>Measurement</strong> <strong>Suite</strong><br />
Specifies rotation speed for the sample rotation axis.<br />
Saves a calibration experiment with specified parameters to a file. One can start<br />
the save “brml” file as a job with help of Fehler! Verweisquelle konnte nicht gefunden werden.<br />
plugin.<br />
Starts the calibration measurement, analyses measured data and calculates<br />
resolution and zero offset values.<br />
Parameter values for all other optics (e.g. variable slit size.), which are not displayed in the DETEC-<br />
TOR plugin could be set in the COMMANDER or Fehler! Verweisquelle konnte nicht gefunden<br />
werden. plugins.<br />
One can observe the progress of the calibration measurement in the COMMANDER plugin.<br />
Aborts actually running calibration measurement started by DETECTOR plugin.<br />
When calibration measurement has been finished the DETECTOR plugin will change automatically to<br />
the Results view.<br />
Calibrate by Existing Data<br />
One can analyse saved calibration data again by clicking the<br />
button. In the upcoming<br />
file open dialog one can select “brml” file to analyse. DETECTOR plugin will change automatically<br />
to the Results window, which is described in the next section.<br />
detector again.<br />
Reloads a selected “brml” file and determines resolution and zero offset for the<br />
Results<br />
The view of the Results of the resolution and zero offset calibration is shown in picture below.<br />
Fig. 143: Results of the Resolution and Zero Offset measurement<br />
The “Quality of the Calibration” field will be displayed at the top of the Results view and can take following<br />
values:<br />
Calibration measurement has not been done.<br />
122<br />
DOC-M88-EXX191 V3.0 – 11.2012
<strong>Bruker</strong> AXS <strong>Measurement</strong> <strong>Suite</strong><br />
<strong>User</strong> <strong>Manual</strong><br />
Quality of the calibration measurement is not satisfying.<br />
1e-2.<br />
Quality of the calibration is satisfying. Number of points >= 6 and standard deviation <<br />
1.5e-3.<br />
Quality of the calibration is excellent. Number of points >= 10 and standard deviation <<br />
Saves measured calibration data to a “brml” file. A saved file can be analysed<br />
again in the “Calibrate by Existing Data” section.<br />
In order to apply measured resolution and zero offset values to the instrument one has to click the<br />
button. This will save the configuration with new values into the instrument<br />
and into the database, which requires restart of the instrument and reconnection of the DETECTOR<br />
plugin to the measurement server. <strong>Measurement</strong> server has also to be reconnected to the instrument.<br />
NOTE<br />
The LYNXEYE XE detector will immediately change the actual and configuration values for the instrument<br />
without restart of the instrument.<br />
LYNXEYE XE<br />
Load and Save The Detector State<br />
A LYNXEYE XE detector can be used in few different modes (e.g. High Resolution or High Count<br />
Rate) moreover it could be used with different X-Ray tubes (e.g. Cu or Mo tubes). A detector requires<br />
a set of special calibrations to be done for every combination of tube and mode. Making a set of calibrations<br />
once one can save the calibrated detector state to a file. The LYNXEYE XE detector allows to<br />
simply reload a detector state from the file without restarting of the instrument, when using desired<br />
tube and mode combination again.<br />
restart of the instrument.<br />
Loads all detector settings from a file into detector. It does not need a<br />
Saves all detector settings to file.<br />
Low and High Discriminators<br />
Performs trimming of the low and high discriminators with help of the internal simulated pulses without<br />
X-Ray beam.<br />
Internal simulated pulses are used when trimming with help of X-Ray beam is not possible, in other<br />
cases trimming with the monochromatic X-Ray beam is recommended.<br />
DOC-M88-EXX191 V3.0 – 11.2012 123
<strong>User</strong> <strong>Manual</strong><br />
<strong>Bruker</strong> AXS <strong>Measurement</strong> <strong>Suite</strong><br />
Fig. 144: Low and High Discriminators<br />
The functions of all dialogs and buttons are identical to the functions described in the Low and High<br />
Discriminators with X-Ray chapter.<br />
Please refer to the Low and High Discriminators with X-Ray chapter for more information.<br />
Veto Discriminator<br />
A LYNXEYE XE has a veto discriminator, which can discriminate signals, that come simultaneously in<br />
the neighbour channels. This normally happens when the same gamma quant deposits its energy in<br />
more than one channel.<br />
The veto discriminator can be adjusted for every single detector channel in the Veto Discriminator<br />
section. Veto calibration will be done with the closed shutter.<br />
Fig. 145: Veto Discriminator<br />
Veto trimming provides following options:<br />
Determines detector mode:<br />
High Resolution applies settings for maximum energy resolution to the detector.<br />
124<br />
DOC-M88-EXX191 V3.0 – 11.2012
<strong>Bruker</strong> AXS <strong>Measurement</strong> <strong>Suite</strong><br />
<strong>User</strong> <strong>Manual</strong><br />
High Count Rate applies settings for maximum count rate to the detector.<br />
Actual Settings is a user custom mode. Trimming will be performed with actual detector settings.<br />
Actual detector settings can be set in the TOOLS plugin. It is recommended only for advanced users.<br />
Determines amplification gain of the detector.<br />
Clears veto calibration of the detector.<br />
will be not changed.<br />
Qualifies actual veto calibration of the detector. Actual settings of the detector<br />
Starts calibration measurement and determines veto calibration for the detector.<br />
Calibration will be applied automatically to the detector. Actual and configuration values of the<br />
detector will be changed. Configuration with new values will be written into database. The instrument<br />
does not require restart or reconnect.<br />
Status and progress of the detector calibration or qualification will be shown in the status display, see<br />
figure below.<br />
Fig. 146: Status and progress of the measurement.<br />
When calibration or qualification measurement has been finished, the DETECTOR plugin will change<br />
automatically to the Results view.<br />
button in the toolbar menu at the top-left cor-<br />
One can abort actual measurement by clicking the<br />
ner.<br />
Results<br />
View of the Results of the veto trimming calibration is shown in the figure bellow.<br />
Fig. 147: Veto Trimming Results<br />
Mean Value, V This is optimum value for the Veto Discriminator.<br />
Standard Deviation, V Statistical deviation of the discriminator values for all channels.<br />
DOC-M88-EXX191 V3.0 – 11.2012 125
<strong>User</strong> <strong>Manual</strong><br />
<strong>Bruker</strong> AXS <strong>Measurement</strong> <strong>Suite</strong><br />
6Sigma width, V Interval on the discriminator axis, which includes about 99,7 % of measured values<br />
for all channels, usually it is less than 1 LSB, which is 0,002 V for LYNXEYE XE.<br />
Low and High Discriminators with X-Ray<br />
LYNXEYE XE has high and low energy discriminators. For best energy discrimination results every<br />
detector channel has to be trimmed with help of monochromatic X-Ray beam.<br />
LYNXEYE XE detector has to be set up for the calibration as it described in the detector manual.<br />
View of the trimming of the low and high discriminators with help of X-Ray measurement is shown<br />
below.<br />
Fig. 148: Trimming with X-Ray<br />
Trimming with X-Ray provides following options:<br />
Determines energy of the X-Ray source.<br />
Actual value specified in the X-Ray tube will be automatically set into this field.<br />
Determines wave length of the X-Ray<br />
source. Actual value specified in the X-Ray tube will be automatically set into this field.<br />
Determines detector mode:<br />
High Resolution applies settings for maximum energy resolution to the detector.<br />
High Count Rate applies settings for maximum count rate to the detector.<br />
Actual Settings is a user custom mode. Trimming will be performed with actual detector settings. It is<br />
recommended only for advanced users.<br />
Determines amplification gain of the detector.<br />
Clears actual high and low discriminator trim values and correction values.<br />
126<br />
DOC-M88-EXX191 V3.0 – 11.2012
<strong>Bruker</strong> AXS <strong>Measurement</strong> <strong>Suite</strong><br />
<strong>User</strong> <strong>Manual</strong><br />
Qualifies quality of the actual trimming settings for the load and high discriminators.<br />
Detector settings will stay unchanged.<br />
Starts trimming measurement, determines trimming settings and applies them to<br />
the detector. Actual and configuration settings of the detector will be changed. Configuration with new<br />
settings will be written into database. At the end of the trimming the view will be changed to Results<br />
view.<br />
Status and progress of the detector calibration or qualification will be shown in the status display, see<br />
figure below.<br />
Fig. 149: Status and progress of the measurement.<br />
button in the toolbar menu at the top-left cor-<br />
One can abort actual measurement by clicking the<br />
ner.<br />
Results<br />
Displays results of the calibration for low and high discriminators.<br />
Fig. 150: Results of the calibration.<br />
“Quality of the Calibration” can take following values:<br />
Calibration measurement has not been done.<br />
Quality of the calibration measurement is not satisfying.<br />
DOC-M88-EXX191 V3.0 – 11.2012 127
<strong>User</strong> <strong>Manual</strong><br />
<strong>Bruker</strong> AXS <strong>Measurement</strong> <strong>Suite</strong><br />
Quality of the calibration is satisfying.<br />
Quality of the calibration is excellent.<br />
Following statistical parameters will be displayed:<br />
Mean Value, V Discriminator value, which corresponds to the energy of the X-Ray radiation used in<br />
the calibration.<br />
Standard Deviation, V Statistical deviation of the discriminator values for all channels.<br />
6Sigma width, V Interval on the discriminator axis, which includes about 99,7 % of measured values<br />
for all channels, usually it is less than 1 LSB, which is 0,002 V for LYNXEYE XE.<br />
Flood Field<br />
Flood field calibration equalizes sensitivity of detector channels by determining of linear coefficients for<br />
every channel.<br />
Detector should be set up for the calibration as it described in the LYNXEYE XE detector manual.<br />
Fig. 151: Flood Field Determination<br />
Flood field determination provides following options:<br />
Specifies measurement time.<br />
Actual detector flood corrections.<br />
Starts a flood field calibration measurement. Coefficients will be automatically<br />
determined from the measured data and applied to instrument, actual and configuration values of the<br />
instrument will be changed. The new configuration will be written into database.<br />
The status bar at the bottom displays progress and status of the calibration measurement.<br />
ADC Monitor<br />
Monitors and records LYNXEYE XE detector properties (e.g. high voltage, ASIC temperature, etc.)<br />
over time.<br />
128<br />
DOC-M88-EXX191 V3.0 – 11.2012
<strong>Bruker</strong> AXS <strong>Measurement</strong> <strong>Suite</strong><br />
<strong>User</strong> <strong>Manual</strong><br />
Fig. 152: ADC Monitor<br />
In order to record detector data ensure that Collect Data check box is checked.<br />
Select properties to be recorded by checking them in the list at the top left corner.<br />
ADC monitor provides following options:<br />
Collects detector data (e.g. Temp ASIC 1, etc.) when checked.<br />
Keeps position of the chart when checked.<br />
Keeps zoom of the chart when checked.<br />
Specifies data collection period.<br />
Saves collected data to file with text based format.<br />
DOC-M88-EXX191 V3.0 – 11.2012 129
<strong>User</strong> <strong>Manual</strong><br />
<strong>Bruker</strong> AXS <strong>Measurement</strong> <strong>Suite</strong><br />
Loads data from file.<br />
Clears actual data.<br />
Specifies zoom – minimum and maximum values for the chart axes.<br />
Prints actual chart.<br />
Opens print preview dialog.<br />
Detector Browse<br />
Finds LYNXEYE XE detector in the local area network.<br />
Select network interface (network adapter) in the drop down list box and click Browse button to find<br />
detector.<br />
When the detector has been found its name, IP address and MAC address will be displayed.<br />
See more description in the Browse LYNXEYE XE detector section in the Detector Menu.<br />
130<br />
DOC-M88-EXX191 V3.0 – 11.2012
<strong>Bruker</strong> AXS <strong>Measurement</strong> <strong>Suite</strong><br />
<strong>User</strong> <strong>Manual</strong><br />
LOG<br />
General<br />
The LOG plug-in provides a record of user actions and system events that have occurred during use<br />
of the <strong>Measurement</strong> <strong>Suite</strong>. The entries are displayed in table form. The actions and events are listed<br />
chronologically with the most recent entries appearing at the top of the list.<br />
Screen Layout and Operation<br />
Fig. 153: Interface of LOG<br />
Three toggle buttons are located above the table. The user can alter the display of errors, warnings<br />
and items of information that have occurred since the recording began. Additionally, the user can filter<br />
the table by the following items:<br />
Instruments : This filters the table by the instrument to which the framework was connected.<br />
Modules : This filters the table by software modules that produced the log entry.<br />
Date/Time : This filters the table by using predefined time settings.<br />
NOTE<br />
The number of events listed in this table is limited to 10000 items.<br />
The filter settings are stored in the user profile of the database and are reloaded at the next start of the<br />
software.<br />
When a button is pressed down, the items belonging to the button are included in the table. Otherwise,<br />
the items are excluded. This allows a very easy event filtering.<br />
DOC-M88-EXX191 V3.0 – 11.2012 131
<strong>User</strong> <strong>Manual</strong><br />
<strong>Bruker</strong> AXS <strong>Measurement</strong> <strong>Suite</strong><br />
The Log Context Menu<br />
The Log context menu is opened by clicking with the right mouse button anywhere in the table on the<br />
LOG page.<br />
Fig. 154: Log context menu<br />
This context menu contains the following items:<br />
Copy selection to clipboard: Copies information from the table to the clipboard. The information can<br />
be pasted into an email or a Word document.<br />
To copy information to the clipboard, first select the row or rows of information in the table. Select a<br />
single line with a mouse click or multiple lines by holding down the Shift key and scrolling through the<br />
rows using the arrow keys ↑ and ↓. Right-click on the selected row or rows to open the context menu.<br />
Level: Allows the user to choose between different types of logging information. Choosing “Standard”<br />
provides standard logging information. The other options provide additional information in addition to<br />
the standard information. For example, the option “Communication” provides additional information<br />
relating to the communication between the <strong>Measurement</strong> Client, the <strong>Measurement</strong> Server, and the<br />
instruments.<br />
Visible Columns: Allows the user to select the columns to be displayed in the table from a set of predefined<br />
columns.<br />
Reset to column defaults: Displays the default columns Category, Date/Time, Description and Details<br />
in the table. Resets the filter settings.<br />
Details: Shows a dialog with detailed information about the event. With the Up/Down buttons, The<br />
user can switch to the next/previous event.<br />
132<br />
DOC-M88-EXX191 V3.0 – 11.2012
<strong>Bruker</strong> AXS <strong>Measurement</strong> <strong>Suite</strong><br />
<strong>User</strong> <strong>Manual</strong><br />
Fig. 155: Log details dialog<br />
DOC-M88-EXX191 V3.0 – 11.2012 133
<strong>User</strong> <strong>Manual</strong><br />
<strong>Bruker</strong> AXS <strong>Measurement</strong> <strong>Suite</strong><br />
CAMERA HIGH RESOLUTION<br />
General<br />
The CAMERA HIGH RESOLUTION plug-in is used to work with IP based high resolution web cameras.<br />
The user can watch a certain area in an instrument remotely, or watch the alignment of a sample<br />
or instrument components. If a microscope camera is mounted on the instrument, the camera can be<br />
calibrated. Thus, on screen distance measurements are possible.<br />
To configure a camera to be used in the CAMERA plugin, use the CONFIG plugin and define a component<br />
of the type /Component/Video. Locate the IP address of the camera and configure the Camera<br />
IP Address property of the component. After a restart of the firmware and a reconnect of the framework,<br />
the CAMERA plugin will attempt to connect to the camera. If successful, the camera displays an<br />
image.<br />
The number of frames/second depends on the connection speed, the illumination level, the gain and<br />
the size of the images. Up to 12 frames/second can be transmitted with Gigabit Ethernet connections.<br />
The number of cameras is unlimited. Each camera is displayed in a new tab. To reduce the network<br />
load, the camera is disabled if the plug-in is not visible.<br />
Screen Layout and Operation<br />
The user interface of the CAMERA plug-in consists of a tab for each configured camera. Each camera<br />
has its own properties which can be set in the Camera menu.<br />
Fig. 156: <strong>User</strong> interface of CAMERA plug-in<br />
The cross-line can be dragged around by clicking in the middle of the cross-line with the left mouse<br />
button. The cross-line can be used for measurements. To reach the camera origin, select Restore<br />
camera origin from the menu.<br />
134<br />
DOC-M88-EXX191 V3.0 – 11.2012
<strong>Bruker</strong> AXS <strong>Measurement</strong> <strong>Suite</strong><br />
<strong>User</strong> <strong>Manual</strong><br />
The Camera Menu<br />
Fig. 157: Menu of CAMERA plug-in<br />
Zoom in: Increases the zoom level by increasing the image. The zoom is increased at the middle of<br />
the cross line center.<br />
Zoom out: Decreases the zoom level digitally.<br />
Zoom minimal: Sets the zoom level to minimum.<br />
Zoom maximal: Sets the zoom level to maximal.<br />
Enable Laser: This menu item is available if a laser is configured in the instrument. This toggles the<br />
laser (On/Off).<br />
Enable Cross line: Toggles the cross line (On/Off) on the camera picture.<br />
Enable Cross line Numbers: Toggles the numbering on the cross line (On/Off) on the camera picture.<br />
Enable Timestamp: Toggles the timestamp (On/Off) on the camera picture.<br />
Calibrate Cross line: Calibrates the screen/real world relationship in pixel/mm. After a camera picture<br />
is calibrated, the cross line displays the real world distances in [mm]. To calibrate the picture, click<br />
and drag the mouse on a visible object with known dimensions. After releasing the mouse, type the<br />
dimension in [mm] in the dialog box.<br />
Restore camera origin: Moves the cross line back to a stored cross line position.<br />
Save camera origin: Saves the actual camera position as camera origin.<br />
Properties: Shows the Camera properties dialog<br />
DOC-M88-EXX191 V3.0 – 11.2012 135
<strong>User</strong> <strong>Manual</strong><br />
<strong>Bruker</strong> AXS <strong>Measurement</strong> <strong>Suite</strong><br />
Camera Properties Dialog<br />
Fig. 158: The Camera Properties Dialog<br />
Camera Name: Name of the camera defined in the CONFIG plugin. The name is also shown at the<br />
bottom of the tab.<br />
Camera IP Address: This shows the camera IP Address as defined in the CONFIG plugin.<br />
Timestamp Text: Each camera image can have a timestamp and a timestamp text in the right bottom<br />
corner. The timestamp can be enabled with the checkbox.<br />
Crossline Color: Defines the color of the cross line.<br />
Camera Resolution: To increase the frame rate, the user can select between Full Frames and Half<br />
Frames. Selecting Half Frames reduces the network load and increases the frame rate, but reduces<br />
the image quality.<br />
<strong>User</strong> Right Restrictions<br />
The logged-in user can change CAMERA settings only if he has been assigned the user right “Change<br />
Software Configuration”. For information on user rights, see Section <strong>User</strong>s Table on page 21.<br />
NOTE<br />
Since high resolution cameras generate a high network bus load, there are some restrictions<br />
<br />
<br />
<br />
<br />
<br />
Only one client is allowed to view the camera image at one time. If a second client connects to<br />
the same instrument, a second image will not be displayed for this client.<br />
A Gigabit Ethernet connection is recommended to obtain the best quality. A fast Ethernet connection<br />
can function. However, the frame rate will be reduced dramatically, since all other client<br />
communication with the instrument must be performed using the same network connection.<br />
If the network connection is too slow, the camera might be disabled and the camera image will<br />
be frozen. In order to render the camera functional again, reconnect the framework after the<br />
network connection is improved.<br />
There is no limitation in the number of cameras which can be used in an instrument, since<br />
hidden cameras are disabled and when necessary, reactivated automatically.<br />
Only a basic set of camera parameters are predefined by the CAMERA plugin. Use the camera<br />
vendors software utilities to improve image quality. To facilitate high resolution of the image,<br />
install the camera drivers manually. The drivers can be found on the <strong>Measurement</strong> <strong>Suite</strong><br />
software CD.<br />
136<br />
DOC-M88-EXX191 V3.0 – 11.2012
<strong>Bruker</strong> AXS <strong>Measurement</strong> <strong>Suite</strong><br />
<strong>User</strong> <strong>Manual</strong><br />
RESULTS MANAGER<br />
General<br />
Jobs that have been successfully started with the START JOBS plug-in are stored in the database.<br />
Locate measurement results and search the database for finished and ongoing measurements with<br />
the RESULTS MANAGER.<br />
Screen Layout and Operation<br />
Fig. 159: RESULTS MANAGER screen layout<br />
The main screen of the RESULTS MANAGER is composed of one or several views that are arranged<br />
in tab pages. The page either shows the results of the database (results view) or shows the search<br />
criteria and display properties (specification view). <strong>User</strong>s can easily toggle between both views with<br />
the Query/View button.<br />
A view specification contains information for all search criteria and display properties. These specifications<br />
can be named and stored for future use.<br />
Views can be newly defined or be retrieved from previously stored views. The stored views can be<br />
opened from the main menu.<br />
If the application is closed or if a different user logs in, the views that are currently displayed, will be<br />
stored automatically. These settings are retrieved automatically during the user’s next log-in.<br />
Opening a previously stored view<br />
Click on the menu item “Open view”.<br />
A selection window will open. A list of database views that have been stored will be displayed. If a<br />
view specification has not been stored previously one of two pre-defined views that have been installed<br />
with the RESULTS MANAGER should be chosen..<br />
All measurements: Displays all jobs in the database.<br />
All finished measurements: Displays all finished jobs in the database.<br />
DOC-M88-EXX191 V3.0 – 11.2012 137
<strong>User</strong> <strong>Manual</strong><br />
<strong>Bruker</strong> AXS <strong>Measurement</strong> <strong>Suite</strong><br />
Fig. 160: Open View dialog<br />
Select the name of the view in the window to be opened. Click OK to confirm.<br />
A new tab page will be created and displayed. If the database search yields any results, they will be<br />
displayed.<br />
The user can open several views and switch between them by clicking on the corresponding tabheader.<br />
Results view page<br />
The results view is composed of a table listing the results of the database query.<br />
Right clicking on a column header opens a column menu.<br />
Fig. 161: Column header properties<br />
This menu allows the user to perform one of the following tasks:<br />
Remove This Column: Removes the selected column<br />
Column Chooser:<br />
Best fit:<br />
Allows the user to select the displayed columns of the table.<br />
Fits the selected column to a suitable size, so that all contents are visible.<br />
Best fit (all columns) Fits all columns to a suitable size.<br />
Auto Stretch on/off Toggle auto-sizing on and off. If there are only a few columns, auto sizing<br />
stretches the columns to the width of the table. If the view contains several columns, the columns become<br />
too narrow. In this event, turn off the column-auto-sizing and scroll the contents of the table<br />
horizontally.<br />
Left Click on a column header to sort the table by column. A second click changes the direction of the<br />
sorting. A third click removes the sorting.<br />
138<br />
DOC-M88-EXX191 V3.0 – 11.2012
<strong>Bruker</strong> AXS <strong>Measurement</strong> <strong>Suite</strong><br />
<strong>User</strong> <strong>Manual</strong><br />
Fig. 162: Column Sorting<br />
Note that the view is not updated automatically. The view can be refreshed by clicking on the refresh<br />
button.<br />
.Refresh button<br />
The view can be replaced by opening another view. Use the list box “View” to open another view..<br />
View selection<br />
A detail view can be added to the main view. The detail view s displays more detailed information<br />
about the results of the selected rows. To activate the view, select an entry from the list box “Details”.<br />
Fig. 163: Scan preview<br />
DOC-M88-EXX191 V3.0 – 11.2012 139
<strong>User</strong> <strong>Manual</strong><br />
<strong>Bruker</strong> AXS <strong>Measurement</strong> <strong>Suite</strong><br />
The only detail view supported in this version of the RESULTS MANAGER is the scan view display. If<br />
the database contains scan data of the selected results, the scan will be displayed here. Several<br />
scans may be selected and displayed at the same time.<br />
The size of the detail view can be changed by clicking on the “Splitting button”. Drag the separator and<br />
switch between the horizontal and the vertical splitting direction.<br />
Fig. 164: Enable Views<br />
Additionally, actions on the selected scans can be carried out. The currently selected action is displayed<br />
on the action button. The user can trigger the action by selecting the results in the table and<br />
clicking on the action button.<br />
Fig. 165: The action button<br />
“Action” button<br />
The only action supported in this version of the RESULTS MANAGER is the “Save BRML” action. If<br />
the database contains measured data, this action can be used to retrieve the brml file from the database.<br />
If the database contains no measurements or if the search criteria of the view are too restrictive to<br />
yield any results a corresponding message will be displayed instead.<br />
Fig. 166: No results of a filter<br />
140<br />
DOC-M88-EXX191 V3.0 – 11.2012
<strong>Bruker</strong> AXS <strong>Measurement</strong> <strong>Suite</strong><br />
<strong>User</strong> <strong>Manual</strong><br />
Monitoring<br />
Monitoring views are updated automatically after the results in the database have changed.<br />
NOTE<br />
Use the monitoring mode when an automatic results display is required.<br />
If the user is searching for specific results, it is more efficient to use a query view.<br />
Monitoring can be activated by right clicking on the tab header of a view and selecting the monitoring<br />
mode.<br />
Fig. 167: Monitoring mode<br />
Right clicking again switches the view back into Query mode.<br />
Fig. 168: Query mode<br />
Removing views<br />
Click the cross button on the tab to remove a view from the list of tab pages.<br />
Specifying views<br />
To view the search criteria and display settings switch to the view specification. Click the Query button<br />
that is located on the upper left corner of the results view.<br />
Fig. 169: Query button<br />
As an alternative, a view can be newly made Click on the “New View” menu item. A new tab page will<br />
be generated displaying the specification view.<br />
DOC-M88-EXX191 V3.0 – 11.2012 141
<strong>User</strong> <strong>Manual</strong><br />
<strong>Bruker</strong> AXS <strong>Measurement</strong> <strong>Suite</strong><br />
Specification view<br />
Fig. 170: Specification view<br />
The specification view contains a settings overview that is used to browse through the various settings.<br />
If a settings name is clicked on, the dialog box on the right is changed to the corresponding<br />
settings editor.<br />
The settings are organized in different categories. The category named “Filter” represents all settings<br />
that restrict the results by some criteria such as the sample name. The different filters are applied at<br />
the same time. The more filter criteria set, the more restrictive the results will become. A small icon<br />
reports whether any filter criteria have been set on this page.<br />
Filter is set.<br />
Neutral settings<br />
Any changes made in the specification view can be reviewed immediately by returning to the results<br />
view. To switch to the results view, click on the “View” button.<br />
Fig. 171: View button<br />
To save changes, click on the “Save” button. Please note that the old view specification will be overwritten.<br />
Fig. 172: Save button<br />
If the changes are to be saved to a different specification, use the “Save As” button. A new view specification<br />
name will be required.<br />
142<br />
DOC-M88-EXX191 V3.0 – 11.2012
<strong>Bruker</strong> AXS <strong>Measurement</strong> <strong>Suite</strong><br />
<strong>User</strong> <strong>Manual</strong><br />
Fig. 173: Save As button<br />
Click on “Reload” to reset changes and load the last saved version of the view specification.<br />
Fig. 174: Reload button<br />
General search criteria<br />
This section allows the user to set general search criteria:<br />
Fig. 175: Search Criteria<br />
Search space: Decide if only the measured specimen, the specimen whose measurements have not<br />
been finished (Pending, aborted or erroneous jobs) or both are to be queried.<br />
Sorting: Select in which order the results are retrieved from the database and thus, displayed in the<br />
table. The order can be ascending or descending.<br />
The search criteria are:<br />
<br />
<br />
<br />
Time measurement started<br />
Time measurement ended<br />
Time job was created<br />
Displaying multiple measurement<br />
If the same sample name was used several times decide if all or the most recent result should be displayed.<br />
DOC-M88-EXX191 V3.0 – 11.2012 143
<strong>User</strong> <strong>Manual</strong><br />
<strong>Bruker</strong> AXS <strong>Measurement</strong> <strong>Suite</strong><br />
Shown parameters<br />
Fig. 176: Shown parameters<br />
The information to be retrieved from the database is selected here. Each entry of the list represents a<br />
column in the results grid.<br />
The parameters are the following:<br />
<br />
<br />
<br />
<br />
<br />
<br />
<br />
<br />
<br />
<br />
<br />
Sample name: Name of the specimen measured.<br />
<strong>Measurement</strong> method: Name of the experiment used for measuring.<br />
File name: Name of the result file.<br />
Id: Job Id.<br />
Creation time: Time of the job creation.<br />
<strong>Measurement</strong> Started: Starting time of measurement.<br />
<strong>Measurement</strong> Finished: End time of measurement.<br />
Creation Operator: <strong>User</strong> who created the measurement.<br />
<strong>Measurement</strong> Operator: <strong>User</strong> who started the measurement.<br />
Instrument Name: Name of the instrument.<br />
Status: Status of the job. Could be one of the following: Measured, Measuring, Suspended.<br />
144<br />
DOC-M88-EXX191 V3.0 – 11.2012
<strong>Bruker</strong> AXS <strong>Measurement</strong> <strong>Suite</strong><br />
<strong>User</strong> <strong>Manual</strong><br />
Sample name filter<br />
Fig. 177: Sample name filter<br />
The user can either display all results regardless of the sample name used or can filter for specific<br />
sample names.<br />
With the second option a free text can be entered. This text will be matched with the sample name<br />
entry during the database search. This search uses wildcards. Use “*“ to indicate that there might be<br />
optional additional characters, use “?” to indicate one unknown additional character.<br />
E.g.: The string NAME_* delivers all samples named NAME_ but also NAME_23, NAME_ABC<br />
Alternatively, one or several names can be selected from the list of names that have been detected in<br />
the database.<br />
<strong>Measurement</strong> method filter<br />
Either all results can be displayed regardless of the measurement method, or specific measurement<br />
methods can be filtered.<br />
The same search options are offered as in the sample name filter settings.<br />
Operator filter<br />
Fig. 178: Operator filter<br />
DOC-M88-EXX191 V3.0 – 11.2012 145
<strong>User</strong> <strong>Manual</strong><br />
<strong>Bruker</strong> AXS <strong>Measurement</strong> <strong>Suite</strong><br />
It is possible to filter the search results by the user who has created the job, started the measurement<br />
or has performed an evaluation.<br />
The options are:<br />
<br />
<br />
<br />
Anyone: Do not filter by any specific user.<br />
<strong>User</strong> logged in at time of query: Always show the results of the user who is currently logged in<br />
to the framework.<br />
Specific <strong>User</strong>: <strong>User</strong> can be selected from the list. The list contains all names that are registered in<br />
the database.<br />
Filtering for time intervals<br />
Fig. 179: Time interval filter<br />
The results can be filtered by the time of job creation or the time the measurement has finished.<br />
The following options are given for the end of measurement:<br />
<br />
<br />
<br />
<br />
<br />
<br />
All : Do not filter the results<br />
Today: Limit search to the measurements that have been measured today.<br />
This week: Limits the search to the measurements that have been performed this week (starting<br />
on Monday).<br />
This month: Limits the search to the measurements that have been performed this month (starting<br />
on the first).<br />
The Last: Limit search to a specified number of hours, days, or years.<br />
Between And: Limit search to the period between two dates (given dates are included in search).<br />
The same kinds of filter can be set for the time of job creation accordingly.<br />
NOTE<br />
When a measurement is aborted, no finishing time is supplied to the database. To display these<br />
measurements, the filter should be set to the time of job creation.<br />
146<br />
DOC-M88-EXX191 V3.0 – 11.2012
<strong>Bruker</strong> AXS <strong>Measurement</strong> <strong>Suite</strong><br />
<strong>User</strong> <strong>Manual</strong><br />
Appearance<br />
Fig. 180: Appearance<br />
Further aspects of the results display can be set here.<br />
Detail View: Sets the detail view to be shown.<br />
Split: Horizontal or vertical splitting.<br />
Count of results: The number of results in the monitoring view can be restricted to a maximum number<br />
of results. In this case, monitoring only displays the n most recent results. If such a restriction is<br />
not desired, click “All”.<br />
Preferred action: The action that is triggered with the action button can be selected here.<br />
Formatting views<br />
Fig. 181: Formatting views<br />
Further aspects of the results table can be modified on this page.<br />
DOC-M88-EXX191 V3.0 – 11.2012 147
<strong>User</strong> <strong>Manual</strong><br />
<strong>Bruker</strong> AXS <strong>Measurement</strong> <strong>Suite</strong><br />
The sequence of the result columns can be changed by using the arrow buttons.<br />
The visibility of each column can be set to:<br />
<br />
<br />
<br />
<br />
Yes: Visible<br />
No: Not visible<br />
Auto: Only visible if there is a result that displays some contents in that column.<br />
Fixed: Visible and attached to the left side of the grid. A column of this kind cannot be scrolled out<br />
of view.<br />
The original name of the column can be changed to a user-specified display name.<br />
The Formatting of the Column can be changed. The display of dates can be switched between dateonly<br />
and date/time display.<br />
Launcher View<br />
Fig. 182: Launcher View<br />
The “Launcher View” provides an alternative way to open new views.<br />
To open the Launcher, click on the Launcher item in the RESULTS MANAGER menu.<br />
A new tab page will be created. This displays a list of view specifications which are saved on the system.<br />
<br />
<br />
<br />
<br />
To open a view, select an entry in the list and click on “Show”.<br />
To open a view in monitor mode, select an entry in the list and click on “Monitor”.<br />
To create view from scratch, click on “New”<br />
To delete a view permanently from the system, select an entry in the list and click on “Remove”.<br />
NOTE<br />
Views that are deleted using the “Remove” button in the launcher are removed permanently from the<br />
system and cannot be retrieved.<br />
148<br />
DOC-M88-EXX191 V3.0 – 11.2012
<strong>Bruker</strong> AXS <strong>Measurement</strong> <strong>Suite</strong><br />
<strong>User</strong> <strong>Manual</strong><br />
Database Maintenance<br />
General<br />
Database Maintenance is used to install a new database/replace an existing database, or upgrade an<br />
existing database to a newer version. It is used by the installation program during the setup procedure<br />
in an automatic mode, or it can be used in manual mode.<br />
Screen Layout and Operation<br />
Database Maintenance has two options:<br />
<br />
<br />
Upgrade: This keeps existing data in the database, and upgrades the database to the latest<br />
structure. Upgrade is normally made by the installation program during the setup procedure<br />
automatically.<br />
Overwrite: This removes an existing database, deletes any existing data and replaces the entire<br />
database with a new one. A empty valid database with the suffix “.backup” can be found in<br />
the installation directory of the software. Warning: This deletes all settings and measurements/results.<br />
Overwrite is used when a database is to be restored which was created during<br />
a previous backup procedure. Overwrite can also be used to establish an empty database<br />
similar to the state after the installation of the software.<br />
Fig. 183: Screen Layout<br />
To use Database Maintenance, start the application as an Administrator:<br />
Windows XP: double-click with the left mouse button on “Database Maintenance”.<br />
Administrator rights are required to start Database Maintenance.<br />
Under Windows 7: right-click on “Database Maintenance” and selecting “Run as<br />
DOC-M88-EXX191 V3.0 – 11.2012 149
<strong>User</strong> <strong>Manual</strong><br />
<strong>Bruker</strong> AXS <strong>Measurement</strong> <strong>Suite</strong><br />
Administrator” in the resulting dialog box.<br />
If no valid database exists, log in as a Repair <strong>User</strong> in the login window.<br />
The required password is: Repair-<strong>User</strong>.<br />
If a valid database exists, log in with the username and password and click on OK.<br />
Fig. 184: Login Dialog<br />
Update Database<br />
Select Update Database to upgrade an existing database to the latest database structure delivered by<br />
a software update. This is usually performed automatically by the setup program during installation.<br />
Click “Upgrade the database to the latest version”, and select a valid “.backup” database backup file in<br />
the File Open dialog.<br />
In the Warning dialog, click Yes to confirm to continue the process<br />
150<br />
DOC-M88-EXX191 V3.0 – 11.2012
<strong>Bruker</strong> AXS <strong>Measurement</strong> <strong>Suite</strong><br />
<strong>User</strong> <strong>Manual</strong><br />
Fig. 185: Confirm Upgrade<br />
The new selected database is installed in the background as a temporary database.<br />
Fig. 186: Upgrade in process<br />
During the upgrade procedure, Database Maintenance provides progress information.<br />
DOC-M88-EXX191 V3.0 – 11.2012 151
<strong>User</strong> <strong>Manual</strong><br />
<strong>Bruker</strong> AXS <strong>Measurement</strong> <strong>Suite</strong><br />
Fig. 187: Upgrade finished<br />
The application can be closed after the “Patching finished” notification is displayed.<br />
Overwrite Database<br />
Select Overwrite the entire database, if an existing database is to be replaced with a new one. Alternatively,<br />
the command can be used to revert the system to the status at the time of the software installation<br />
by overwriting the current database. The database can also be overwritten with a previously created<br />
backup.<br />
NOTE<br />
ALL the data stored in the current database will be LOST!<br />
NOTE<br />
Before an Overwrite or Upgrade procedure, Database Maintenance creates a security copy of the<br />
existing database. This backup database is stored in the folder:<br />
Documents and Settings\<strong>Bruker</strong> AXS\Database Backup\<br />
Select “Overwrite the entire database”, and select a valid “.backup” database backup file in the File<br />
Open dialog.<br />
152<br />
DOC-M88-EXX191 V3.0 – 11.2012
<strong>Bruker</strong> AXS <strong>Measurement</strong> <strong>Suite</strong><br />
<strong>User</strong> <strong>Manual</strong><br />
Fig. 188: Confirm replace<br />
Confirm the warning dialog to continue.<br />
Fig. 189: Overwrite procedure in progress<br />
DOC-M88-EXX191 V3.0 – 11.2012 153
<strong>User</strong> <strong>Manual</strong><br />
<strong>Bruker</strong> AXS <strong>Measurement</strong> <strong>Suite</strong><br />
Fig. 190: Overwrite procedure completed<br />
After the completion message in the right window the Database Maintenance can be closed.<br />
Database Troubleshooting<br />
In the event of a power failure on the PC containing the database, some database files might be corrupted.<br />
If, only a Repair <strong>User</strong> appears in the login screen of the framework, the database service may<br />
not work correctly.<br />
To correct the problem: Start/Control Panel/Administrative Tools/Services<br />
Fig. 191: The Services screen<br />
154<br />
DOC-M88-EXX191 V3.0 – 11.2012
<strong>Bruker</strong> AXS <strong>Measurement</strong> <strong>Suite</strong><br />
<strong>User</strong> <strong>Manual</strong><br />
Locate the entry “<strong>Bruker</strong> PostgreSQL”. The status of the service must be on “Started”.<br />
If the service is not started, right click on the line and select “Start”. The operating system attempts to<br />
start the service.<br />
If the service status changes to “Started”, log in to the <strong>Measurement</strong> Software again. If the Repair<br />
<strong>User</strong> does not reappear the repair process was successful.<br />
If the service cannot be started, locate the file “postmaster.pid” on the hard disk.<br />
If the software was installed on an English operating system with default settings, the path to the file<br />
is:<br />
c:\<strong>User</strong>s\All <strong>User</strong>s\<strong>Bruker</strong> AXS\data-8.3\<br />
Delete the file and restart the service as described above. If this fails, restart the entire PC.<br />
If the service continues to fail, uninstall the <strong>Bruker</strong> PostgreSQL database by selecting<br />
“Start/Administrative Tools/Control Panel/Add or Remove Programs”<br />
Fig. 192: Add or Remove Programs<br />
Click on “Remove” to un-install <strong>Bruker</strong> PostgreSQL.<br />
After the un-installation, delete the two directories:<br />
data-8.3 and<br />
BAXSdb-8.3<br />
from the hard disk. The locations of the directories on an English operating system are:<br />
c:\<strong>User</strong>s\All <strong>User</strong>s\<strong>Bruker</strong> AXS\<br />
DOC-M88-EXX191 V3.0 – 11.2012 155
<strong>User</strong> <strong>Manual</strong><br />
<strong>Bruker</strong> AXS <strong>Measurement</strong> <strong>Suite</strong><br />
Delete the following directories:<br />
8.3.6<br />
bnpython<br />
postgresql-8.3<br />
from the c:\\Program Files\<strong>Bruker</strong> AXS directory.<br />
After the directories have been removed, install the <strong>Bruker</strong> PostgreSQL database again from the installation<br />
CD of the software.<br />
After the installation, use Database Maintenance to install a valid database backup file.<br />
156<br />
DOC-M88-EXX191 V3.0 – 11.2012
<strong>Bruker</strong> AXS <strong>Measurement</strong> <strong>Suite</strong><br />
<strong>User</strong> <strong>Manual</strong><br />
Script Designer<br />
General<br />
The script designer is an easy to use, yet powerful tool that enables the user to create custom measurement<br />
scripts. The tool provides scriptable access to many aspects of the measurement procedure<br />
as well as to the behavior and the status of the instrument.<br />
High level functions like measurement setup, measurement execution, peak fitting, and so on can be<br />
combined in all thinkable ways and can be arranged via standard structuring elements like loops, conditional<br />
execution, user functions, and so on.<br />
Commonly used high level tasks like complete alignment procedures can be imported from provided<br />
libraries and can easily be integrated into measurement procedures.<br />
Screen Layout and Operation<br />
Opening the Script Designer<br />
The script designer can be opened from the menu item “CommanderScript Designer …” within the<br />
COMMANDER plugin. Selecting this item opens the Script Designer in a separate window.<br />
The Main Window<br />
Fig. 193: The Main Window of the Script Designer<br />
The main window of the script designer consists out of different functional areas:<br />
The Menus<br />
This section describes the individual items and associated dialogs of all menus.<br />
DOC-M88-EXX191 V3.0 – 11.2012 157
<strong>User</strong> <strong>Manual</strong><br />
<strong>Bruker</strong> AXS <strong>Measurement</strong> <strong>Suite</strong><br />
File<br />
New<br />
This item creates a new empty script.<br />
Open…<br />
This item shows a file selection dialog which lets the user choose a script file to open. Supported file<br />
types are “Script-Files” ending with “cs” files that were created with the script designer as well as “Libraries”<br />
ending with “dll” that were created with the script designer.<br />
Note that “cs” files and “dll” files that were not created with the script designer can’t be opened in the<br />
script designer.<br />
Recent Files<br />
This sub menu shows the recently opened files. Clicking on one of them opens the appropriate script<br />
file or library.<br />
Save<br />
This item saves the currently opened script at its associated location. If no file name is known (i.e. new<br />
scripts), a file selection dialog will show up which lets the user select a file name.<br />
Save As Script…<br />
This item shows a file selection dialog which lets the user select a script file name. The actual script<br />
will be saved as a script-file (“cs”).<br />
Save As Library…<br />
This item shows a file selection dialog which lets the user select a library file name. The actual script<br />
will be saved as a library (“dll”) which can be referred by other scripts or libraries via “Library References…”.<br />
Library References…<br />
This item shows the library reference dialog. Within this dialog, the user is able to add libraries (“dll”)<br />
that were created with the script designer to the current script or library. Adding a library means that all<br />
exported functions of the referenced library can be used within the current script or library. The referenced<br />
library functions can be used (called) via the component factory tree in the branch “Library<br />
Functions”.<br />
File Properties…<br />
This item shows a dialog where script associated data can be edited:<br />
Library Namespace<br />
If the current document is saved as a library, this field indicates the namespace which encapsulates<br />
the exported functions of the library. This is useful to arrange library functions of multiple libraries in a<br />
natural way.<br />
Note: Namespaces can be nested by using the period (.). So, for instance, the namespace<br />
“Math.Fitting” would encapsulate the exported functions to another script via “Library FunctionsMathFitting”.<br />
Open Instrument Configuration…<br />
The script designer can be started stand-alone. In that case the designer is not connected to any instrument.<br />
In order to support enumeration of scan types, detector names, drive names, and so on of a<br />
given instrument, its instrument configuration file (“biml”) can be opened. With that, it is possible to<br />
work on scripts offline.<br />
Note: An opened instrument configuration is indicated in squared brackets in the title bar of the script<br />
designer.<br />
Recent Instrument Configuration<br />
This sub menu gives access to recently opened instrument configuration. A click on a recently used<br />
instrument configuration opens the associated configuration.<br />
158<br />
DOC-M88-EXX191 V3.0 – 11.2012
<strong>Bruker</strong> AXS <strong>Measurement</strong> <strong>Suite</strong><br />
<strong>User</strong> <strong>Manual</strong><br />
Close Instrument Configuration<br />
This item closes an opened instrument configuration.<br />
Preferences…<br />
This item shows a dialog which provides access to various user settings that influence the behavior of<br />
the script designer.<br />
Startup<br />
Reopen last script on startup<br />
If this item is enabled, the script or library that was opened when exiting the script designer will automatically<br />
be reopened when starting the script designer the next time.<br />
Reopen last instrument configuration on startup<br />
If this item is enabled, the instrument configuration that was opened when exiting the script designer<br />
will automatically be reopened when starting the script designer the next time.<br />
Default Application Type<br />
Use the following application type as default<br />
The selected application type will be suggested by default when creating a measurement method or<br />
setting up a scan, unless it is overridden by the framework (see next preference item).<br />
Prefer application type provided by framework<br />
If this item is enabled, the default application type (see preference item above) will be acquired from<br />
the application type that is currently selected in the measurement framework.<br />
UI<br />
Automatically collapse previous branch when expanding new branch<br />
This item affects the behavior of the trees of the component factory panel as well as the variables<br />
panel. If this item is enabled, all other branches of the same hierarchy level will automatically collapse<br />
if the user opens a branch. This feature is useful for a better clearness of the actually selected branch.<br />
Bring output window to front on script start<br />
If this item is enabled, the script designer will make sure that the output panel is visible when starting a<br />
script.<br />
Remember UI layout<br />
If this item is enabled, the UI layout (position and sizes of movable windows, toolbar customization,<br />
menu customization, main window position and size, etc.) will be saved when closing the script designer.<br />
These layout settings will automatically be restored when opening the script designer again.<br />
Note: The layout can be reset to factory defaults via the menu item “ViewRestore Default Layout” or<br />
with the keyboard shortcut Ctrl+Shift+R.<br />
Ask user before discarding unsaved changes<br />
If this item is enabled, the script designer will ask the user to save unsaved changes before creating a<br />
new script, opening another script, or leaving the script designer.<br />
Wizard<br />
Show ‘create variable‘ dialog for unknown identifiers<br />
If this item is enabled, a ‘create variable’ dialog shows up each time an unknown variable identifier is<br />
recognized within the item editor panel. This dialog facilitates the creation of new variables.<br />
Exit<br />
This menu item closes the script designer.<br />
Edit<br />
Enable/Disable<br />
This item toggles the enable/disable annotation of the currently selected script items. Note: This item<br />
is also accessible via the context menu (right mouse click) of the script item panel.<br />
DOC-M88-EXX191 V3.0 – 11.2012 159
<strong>User</strong> <strong>Manual</strong><br />
<strong>Bruker</strong> AXS <strong>Measurement</strong> <strong>Suite</strong><br />
Cut<br />
This item removes the currently selected script items and copies them to the clipboard. Note: This item<br />
is also accessible via the context menu (right mouse click) of the script item panel.<br />
Copy<br />
This item copies the currently selected script items to the clipboard. Note: This item is also accessible<br />
via the context menu (right mouse click) of the script item panel.<br />
Paste<br />
This item inserts script items from the clipboard before the actual selection. If no script items are currently<br />
selected, the script items from the clipboard will be appended. Note: This item is also accessible<br />
via the context menu (right mouse click) of the script item panel.<br />
Delete<br />
This item deletes the currently selected script items. Note: This item is also accessible via the context<br />
menu (right mouse click) of the script item panel.<br />
Find<br />
This item shows a dialog which lets the user search any text within the current script. The results of<br />
the search will be shown in the separate panel called ‘Find Results’.<br />
View<br />
Previous Function<br />
This item navigates back to the previously opened user function. With this feature it is easier to navigate<br />
through the user functions of a script or library.<br />
Component Factory<br />
This item shows / hides the component factory panel.<br />
Item Editor<br />
This item shows / hides the item editor panel.<br />
Variables<br />
This item shows / hides the variables panel.<br />
Output<br />
This item shows / hides the output panel.<br />
Find Results<br />
This item shows / hides the find results panel.<br />
Error List<br />
This item shows / hides the error list panel.<br />
Breakpoints<br />
This item shows / hides the breakpoints panel.Restore Default Layout<br />
This item restores the user interface layout of the script designer to the factory settings. The keyboard<br />
shortcut is Ctrl+Alt+R. This is useful if this item can’t be accessed due to a missing menu.<br />
<strong>User</strong> Functions<br />
Add Function…<br />
This item shows a dialog which lets the user create a new user function:<br />
Function Name<br />
This edit field defines the name of the user function. Note: The function name must be unique – function<br />
overloading is not supported.<br />
Return Type<br />
This defines the type of the return value of the user function. Note: The type ‘Void’ indicates that the<br />
user function does not return a value.<br />
160<br />
DOC-M88-EXX191 V3.0 – 11.2012
<strong>Bruker</strong> AXS <strong>Measurement</strong> <strong>Suite</strong><br />
<strong>User</strong> <strong>Manual</strong><br />
Synopsis<br />
This field provides room to document the new function as a whole. Individual calling parameters and<br />
an optional return value can be documented in the “Description” field and the “Return Value Description”<br />
field, respectively.<br />
Return Value Description<br />
This field is intended to document the meaning of the returned value. Note that this field is only accessible<br />
if the return value is not “Void”.<br />
Function Parameters<br />
The function parameter list defines the parameters that need to be provided in order to call the user<br />
function. Function parameters can be added via the ‘New’ button. Their name and type can be defined<br />
via the appropriate widgets. With the buttons ‘Up’ and ‘Down’, the order of the function parameters can<br />
be altered.<br />
Note: When changing the signature of an existing user function (i.e. number, type, and order of function<br />
parameters), all calls to that function need to be revised and updated manually.<br />
Description<br />
This field is intended to document the meaning of the currently selected function parameter.Export<br />
as library function<br />
This check mark box indicates that this user function shall be exported to other scripts or libraries. This<br />
field is only visible if the current script is saved and edited as a library (see menu File->Save As Library<br />
…).<br />
Remove Function…<br />
This item removes the user function that is currently selected in the component factory (not the function<br />
selector).<br />
Parameters…<br />
This item opens the function signature of the currently selected function (via function selector). The<br />
dialog lets the user alter the function name, return type, and parameter number, type, and order of the<br />
function parameters.<br />
Note: When changing the signature of an existing user function (i.e. number, type, and order of function<br />
parameters), all calls to that function need to be revised and updated manually.<br />
Script<br />
Check Script<br />
This item test-compiles the current script with the C# compiler in order to see if there are any errors in<br />
the script. If errors are detected, they will be shown in the ‘Error List’ panel. A double click on an error<br />
item will navigate the user to the erroneous location within the script that caused the compilation error.<br />
View C#...<br />
This item opens a read-only editor which shows the C# source code that is generated by the script<br />
designer from the current script. This is a diagnostic feature. However, this feature also demonstrates<br />
advanced script programmers how to create pure C# scripts without using the script designer.<br />
Run<br />
This item compiles and runs the current script. If a library is started via this item, it is compiled and<br />
executed as a script (therefore also the function ‘Main’ is executed, although the function ‘Main’ is not<br />
used when saved and used as a library).<br />
Debug<br />
This item is similar to the ‘Run’ item except that the compilation includes additional debug information.<br />
This item is only useful if a C# debugger is attached and used.<br />
Documentation …<br />
This item opens a dialog which creates a document from the built-in documentation system. The documentation<br />
covers built-in functions as well as documented user functions and their parameters.<br />
DOC-M88-EXX191 V3.0 – 11.2012 161
<strong>User</strong> <strong>Manual</strong><br />
<strong>Bruker</strong> AXS <strong>Measurement</strong> <strong>Suite</strong><br />
Built-In Object Functions<br />
This check mark box indicates that built-in object functions shall be included in the generated document.<br />
Built-In Static Functions<br />
This check mark box indicates that built-in static functions shall be included in the generated document.<br />
<strong>User</strong> Functions<br />
This check mark box indicates that user functions shall be included in the generated document.<br />
Suppress Undocumented Items<br />
This check mark box indicates that undocumented functions will not be included into the resulting document.<br />
Save As<br />
This check mark box indicates that the generated document shall be saved. The path to the generated<br />
document can be selected via the field below.<br />
Open in Internet Explorer<br />
This check mark box indicates that the generated document shall be opened in a web browser. If<br />
“Save As” is not selected, a temporal path is created automatically.<br />
The Toolbars<br />
By default, there are two toolbars which are located above the script item panel (below the menu).<br />
One contains shortcuts to the most frequently used functions.<br />
The other toolbar contains the function selector which is used to switch the actually displayed function<br />
content in the script item panel.<br />
Script Item Panel<br />
The script item panel is the area in the middle of the window. It is a list of single script items that build<br />
up the currently selected function (see function selector toolbar above). When starting with an empty<br />
script, this area is completely empty (white).<br />
Component Factory<br />
The component factory is a movable tree panel which is by default docked at the left side of the script<br />
item panel. It contains all possible script items that can be created by dragging and dropping items<br />
from the component factory panel into the script item panel.<br />
The creatable script items are ordered hierarchically within the tree panel. The items are classified into<br />
the following main groups:<br />
Control<br />
This group contains all script items that influence the program flow of the script. It includes standard<br />
elements like conditional branching (“if” statements), loops (“for” or “while” statements), exception<br />
handling, and other flow controlling statements of procedural programming languages.<br />
Object Functions<br />
This group contains all the functions that refer to distinct variables (“objects”) of a specific type. In object<br />
oriented programming languages, these functions are also known as the “methods” of a specific<br />
type.<br />
These functions provide the interface to the measurement and instrument logic.<br />
Static Functions<br />
This group contains all built-in static functions. Static functions are not related to specific variable<br />
types (like object functions). Static functions can therefore be called from anywhere without the need<br />
for an associated variable type.<br />
<strong>User</strong> Functions<br />
This group contains the (static) functions that are defined within this script. By dragging and dropping<br />
functions from this group, the associated user defined function will be called.<br />
162<br />
DOC-M88-EXX191 V3.0 – 11.2012
<strong>Bruker</strong> AXS <strong>Measurement</strong> <strong>Suite</strong><br />
<strong>User</strong> <strong>Manual</strong><br />
Note: In order to create new user functions or change existing ones, use the function selector widget<br />
from the toolbar.<br />
Library Functions<br />
This group contains (static) functions from referred libraries. They provide access to higher level tasks<br />
that are encapsulated in libraries.<br />
Note: This group is only visible if the actual script refers to libraries. See also the menu item<br />
“FileLibrary References …”.<br />
Item Editor<br />
The item editor is a movable form panel which is by default docked at the bottom side of the script<br />
item panel. Its content is context sensitive and reflects adjustable parameters of the currently selected<br />
script item of the script item panel.<br />
Output<br />
The output editor is a movable text panel that is by default docked at the bottom side of the script item<br />
panel. By default, it shares the same docking window as the item editor and is therefore accessible via<br />
the tab selector “Output”.<br />
The output panel shows textual output created by scripts via the static function “LoggingWriteToOutput”.<br />
It is primarily intended as a monitoring and debugging feature.<br />
Find Results<br />
“Find Results” is a movable text panel that is by default docked at the bottom side of the script item<br />
panel. By default, it shares the same docking window as the item editor and is therefore accessible via<br />
the tab selector “Find Results”.<br />
“Find Results” lists all matching items that were previously searched with the menu item Edit->Find.<br />
Double clicking on a result line brings the appropriate item into focus.<br />
Error List<br />
“Error List” is a movable text panel that is by default docked at the bottom side of the script item panel.<br />
By default, it shares the same docking window as the item editor and is therefore accessible via the<br />
tab selector “Error List”.<br />
“Error Lists” lists all errors and warnings created by the script compiler. Double clicking on an error or<br />
warning line within this list brings the appropriate item into focus.<br />
Breakpoints<br />
“Breakpoints” is a movable text panel that is by default docked at the bottom side of the script item<br />
panel. By default, it shares the same docking window as the item editor and is therefore accessible via<br />
the tab selector “Breakpoints”.<br />
“Breakpoints” lists all active breakpoints that were set within the current script. Double clicking on a<br />
breakpoint line within this list brings the appropriate item into focus. Note that breakpoints can only be<br />
used if a debugger is attached to the script designer.Variables<br />
The variables widget is a movable panel that is by default docked at the right side of the script item<br />
panel. Its task is to display all declared variables in the given context as well as creating, editing, and<br />
deleting variables. Besides, each variable shows its associated object functions and properties. Depending<br />
on the context, variables, functions, and properties can be dragged from this panel and<br />
dropped into the script item panel and/or into fields of the item editor.<br />
Predefined<br />
This section of the variables panel displays the variables that are always available when starting a<br />
script.<br />
Global<br />
This section of the variables panel displays the variables that are globally defined by the script. Globally<br />
defined variables can be accessed by any user function.<br />
DOC-M88-EXX191 V3.0 – 11.2012 163
<strong>User</strong> <strong>Manual</strong><br />
<strong>Bruker</strong> AXS <strong>Measurement</strong> <strong>Suite</strong><br />
Local<br />
This section of the variables panel displays the variables that are locally defined by the currently selected<br />
user function. These variables are only accessible within the current user function and can’t be<br />
accessed by any other function.Function<br />
This section of the variables panel displays the function variables. These are the varaibles that are<br />
passed to the user function by the function caller. Note that these variables are also local and can only<br />
be accessed by the user function itself.<br />
Scope<br />
This section of the variables panel displays scope variables. Scope variables are only accessible within<br />
a distinct scope. Scope variables are implicitly defined by some kind of control blocks like “For / End<br />
For”, “ForEach / End ForEach”, or “Try / Catch / Finally / End Try” and are only accessible within their<br />
scope.<br />
Controlling Script Items<br />
Script items that control the program flow can be created via the “Control” branch of the component<br />
factory tree. The goal of this section is to describe each control item and its associated parameters<br />
that can be manipulated via the item editor panel.<br />
Note that the principal program flow is top down starting at the first (most upper) script item of a function.<br />
Note also that each element has an additional text filed called “Comment” which may or may not contain<br />
a line of text which describes, documents or simply comments the intention of the statement.<br />
Comment<br />
The purpose of a comment item is to place a comment line in the script item panels. A comment item<br />
is usually used to document the behaviour and or the intention of the following script items. A comment<br />
item does not influence the program flow. The one and only field that is editable for a comment<br />
item is its “Comment” field which may contain one line of free text.<br />
Conditional Branching<br />
Conditional branching is intended to execute blocks of script items depending on the outcome of a<br />
given condition.<br />
If / End If<br />
The block of script items which is surrounded by “if / end if” is only executed if and only if the associated<br />
conditional expression field evaluates to “true”. The associated conditional expression can be edited<br />
via the text field “Boolean Expression” in the item editor. Besides, any variable or subordinated<br />
function which is needed within this expression can be dragged from the variables panel and dropped<br />
into this text field.<br />
Else If<br />
The “else if” statement is a supplementary optional statement that can be used inside an “if / end if”<br />
block. Its conditional expression is only evaluated if none of the preceding “else if” or the embracing<br />
“if” statements evaluated to “true”. If the “else if” condition is considered (because none of the previous<br />
conditions hold), the following block of script items is executed if and only if the expression evaluates<br />
to “true”.<br />
Note: The “else if” item has no meaning outside of an “if / end if” block. If found outside of an “if / end<br />
if” block, the compiler will marks this as a syntactical error.<br />
Else<br />
The “else” statement is a supplementary optional statement that can be used inside an “if / end if”<br />
block. Its following block of script items will only execute if none of the previous “if” and optional “else<br />
if” conditions hold.<br />
Note that an “else” item can only be used inside an “if /end if” block. If the block contains one or more<br />
of the optional “else if” blocks, the “else” item may only occur after the last “else if” statement.<br />
164<br />
DOC-M88-EXX191 V3.0 – 11.2012
<strong>Bruker</strong> AXS <strong>Measurement</strong> <strong>Suite</strong><br />
<strong>User</strong> <strong>Manual</strong><br />
Conditional Multi Branching<br />
Conditional multi branching compares an expression (declared in “switch / end switch”) against multiple<br />
unique constants (declared in one or more “case / end case” statements). If the evaluated expression<br />
matches a given constant, the block of script items inside the associated “case / end case” statement<br />
will be executed. If none of the given constants matches the evaluation result of the expression<br />
the script items inside the optional statement “default case / end case” will be executed.<br />
Switch / End Switch<br />
This statement is the surrounding required statement for conditional multi branching. It defines the<br />
expression field that will be evaluated to compare the result against constants defined in nested “case<br />
/ end case” statements. The type of the expression results must be a type that can be expressed as<br />
constants (literals). These are namely the types ‘int’ and ‘string’, but also other types might be suitable.<br />
Note that all script items inside a “switch / end switch” must be nested in either a “case / end case” or<br />
inside the “default case / end case” statement.<br />
Case / End Case<br />
The “case / end case” statement compares its (optionally multiple) constants against the expression<br />
evaluation result of the surrounding “switch / end switch” statement. If one of its constants matches the<br />
evaluation result, the nested block of script items will be executed.<br />
Note that all constants must be unique, that is no constant must be equal to any other case constant<br />
inside the same “switch / end switch” block.<br />
Default Case / End Case<br />
Code surrounded by the “default case / end case” statement is executed if and only if none of the constants<br />
given by the other “case / end case” statements within the same “switch / end switch” block<br />
match the expression.<br />
Exceptions<br />
Exception handling (throwing as well as catching exceptions) is supported by the script designer. Exceptions<br />
are usually raised (thrown) if there is an error situation which can’t be resolved at this point<br />
within the code. Raised (thrown) exceptions in turn can be caught by the function caller, who then<br />
decides how to deal with the error situation.<br />
Throw<br />
The “throw” statement raises (throws) a new exception. The thrown exception is always of the type<br />
“UException” which supports definition of an error text, an error category, an error ID, and an error<br />
severity. If a thrown exception is not caught by a caller via the “Try / Catch / Finally / End Try” statement,<br />
the thrown execution will result in the termination of the script, and the error message attached<br />
to the exception will be printed to the “Output” window.<br />
Try / Catch / Finally / End Try<br />
The “Try / Catch / Finally / End Try” statement catches any exception that was raised while executing<br />
the script items between “Try” and “Catch”. If an exception is raised by a script item (possibly a user<br />
function) the remainder of script items between “Try” and “Catch” will be skipped and the items between<br />
“Catch” and “Finally” will be executed. The “Try / Catch / Finally / End Try” statement defines an<br />
exception variable which needs to be named by the user and which may be used between “Catch” and<br />
“Finally” in order to retrieve exception information. It is accessible via the “Scope” variables of the “Variables”<br />
panel.<br />
Finally, the script items between “Finally” and “End Try” will always be executed when leaving the<br />
whole “Try / Catch / Finally / End Try” block, regardless if an exception was thrown and caught or if no<br />
exception occurred<br />
Loops<br />
Loops are one of the very basic statements of any procedural / object oriented program languages.<br />
They are used to repeat a block of script items several times. Loops come and in different flavours in<br />
order to suit different situations.<br />
For / End For<br />
The “For / End For” loop defines a counting variable (of type integer) which needs to be named by the<br />
user and which can be accessed via the “Scope” variables of the “Variables” panel. The variable will<br />
DOC-M88-EXX191 V3.0 – 11.2012 165
<strong>User</strong> <strong>Manual</strong><br />
<strong>Bruker</strong> AXS <strong>Measurement</strong> <strong>Suite</strong><br />
be initialized with the value given by the expression “Start” and will be incremented by one after each<br />
execution of the nested script items. The loop will be executed one last time if the counting variable<br />
reaches the expression given by “End” and will be left afterwards.<br />
Note that “End” must be greater or equal to the “Start” expression. Nonobservance will result in an<br />
endless loop.<br />
Note: If you need more detailed control over a loop (i.e. counting variable type, stepping size, stepping<br />
direction), consider using the “While / End While” statement instead.<br />
While / End While<br />
The script items between the “While” and “End While” statement will be executed as long as the associated<br />
condition (Boolean expression) evaluates to ‘true’. Note that the expression will be evaluated<br />
before executing the nested items. The loop will be left immediately if the expression evaluates to<br />
false.<br />
Do / While<br />
The script items between “Do” and “While” statement will be executed as long as the associated condition<br />
(Boolean expression) evaluates to ‘true’. Note that the expression will be evaluated after executing<br />
the nested items. Therefore the loop always executes at least one time.<br />
ForEach / End ForEach<br />
The “for each” statement may be used to iterate through all items of an enumerable collection like lists<br />
(UList), but also other enumerable objects like “UExperiments”, “UExperiment”, or strings. The<br />
user needs to provide an iteration variable name and the collection that shall be iterated. The iteration<br />
variable type is determined automatically via the given collection.<br />
Note that the iterated collection within a “for each”-loop must not be modified. Therefore, the order of<br />
the elements and the size of the collection can’t be changed within a “for each”-loop. If you need to<br />
change the elements of a collection within a loop, consider using one of the alternative loops like “For /<br />
end for”, “while / end while”, or “do / while”, instead.<br />
Break<br />
The “break” statement can be used inside any loop. The “break” statement leaves the actual loop immediately<br />
and the program flow continues after the broken loop. Note that for nested loops, the<br />
“break” statement only leaves (breaks) the most inner loop.<br />
Continue<br />
The continue statement can be used inside any loop. The “continue” statement skips the remainder of<br />
the script items inside the loop and continues execution at the expression evaluation.<br />
Return<br />
The “Return” statement leaves the actual function immediately and returns the provided expression<br />
result to the caller. Note that the type of the resulting value must match the return type of the function<br />
declaration. If the return type is “Void”, the return expression must be left blank.<br />
Note: A “Return” statement inside the “Main” function terminates the script.<br />
Set Variable<br />
The “Set Variable” statement assigns a value (the result of an expression) to a variable.<br />
Verbatim C# Statement<br />
“Verbatim C# Statement” inserts plain C# code provided by the user at the current position. It is intended<br />
for advanced users, who are familiar with the C# programming language, to access extended<br />
C# syntax and techniques that can’t be accomplished with the standard elements of the script designer.<br />
166<br />
DOC-M88-EXX191 V3.0 – 11.2012
<strong>Bruker</strong> AXS <strong>Measurement</strong> <strong>Suite</strong><br />
<strong>User</strong> <strong>Manual</strong><br />
DOC-M88-EXX191 V3.0 – 11.2012 167
<strong>User</strong> <strong>Manual</strong><br />
<strong>Bruker</strong> AXS <strong>Measurement</strong> <strong>Suite</strong><br />
License Notes<br />
The <strong>Bruker</strong> AXS <strong>Measurement</strong> <strong>Suite</strong> is protected by copyright law and international treaties.<br />
Unauthorized reproduction or distribution of this program, or any portion of it, may result in severe civil<br />
and criminal penalties, and will be prosecuted to the maximum extent possible under the law.<br />
The <strong>Bruker</strong> AXS <strong>Measurement</strong> <strong>Suite</strong> is based on modules that are under the license models below.<br />
Please check the different license models for details.<br />
<strong>Bruker</strong> AXS will provide upon written request via email and/or traditional paper mail the applicable<br />
GPL and LGPL source code files via CD-ROM for a nominal cost to cover shipping and media charges<br />
as allowed under the GPL and LGPL.<br />
LGPL<br />
NHibernate<br />
Mono.Security<br />
Npgsql<br />
Apache Licence<br />
Castle Core<br />
Castle.DynamicProxy2<br />
log4net<br />
GPL<br />
ICSharpCode.SharpZipLib<br />
Microsoft Public License (Ms-PL)<br />
Ionic.Zip<br />
Others<br />
Iesi.Collections<br />
NUnit<br />
SQLite<br />
Instrument Firmware modules<br />
In the instrument, the Linux based firmware uses the modules listed below that are under a GPL license.<br />
This modules are available on request as required by the GPL license policy:<br />
Module License Homepage<br />
Linux GPLv2 http://kernel.org<br />
Bridge GPLv2+ http://bridge.sourceforge.net<br />
<strong>Bruker</strong>AXS drivers GPLv2 n.a.<br />
Busybox GPLv2 http://busybox.net<br />
Directfb LGPLv2+ http://www.directfb.org/<br />
Dosfstools GPLv2+ ftp://ftp.uni-erlangen.de/pub/Linux/LOCAL/dosfstools/<br />
168<br />
DOC-M88-EXX191 V3.0 – 11.2012
<strong>Bruker</strong> AXS <strong>Measurement</strong> <strong>Suite</strong><br />
<strong>User</strong> <strong>Manual</strong><br />
e3 GPLv2+ http://sites.google.com/site/e3editor/<br />
gcc GPLv2+/LGPLv2.1+ http://gcc.gnu.org<br />
gcrypt LGPLv2.1+ http://directory.fsf.org/project/libgcrypt/<br />
glibc LGPLv2.1+ http://www.gnu.org/software/libc/<br />
gnutls LGPLv2.1+ http://www.gnu.org/software/gnutls/<br />
grub GPLv3+ http://www.gnu.org/software/grub/<br />
inetutils GPLv3+ http://www.gnu.org/software/inetutils/<br />
kvm GPLv2/LGPLv2.1 http://www.linux-kvm.org/page/Main_Page<br />
libelf LGPLv2+ http://www.mr511.de/software/<br />
libgpg-error LGPLv2.1+ http://www.gnupg.org/download/<br />
libtasn1 GPLv3/LGPLv2.1 http://www.gnu.org/software/libtasn1/<br />
libxau modified MIT http://xorg.freedesktop.org/archive/individual/lib/<br />
libz ZLIB http://www.zlib.net/<br />
lm-sensors GPLv2+ http://www.lm-sensors.org/<br />
nano GPLv3+ http://www.nano-editor.org/<br />
nas modified MIT http://www.radscan.com/nas.html<br />
nct GPLv2+ n.a.<br />
ncurses modified MIT http://www.gnu.org/software/ncurses/ncurses.html<br />
pam 3-clause BSD/GPL http://www.kernel.org/pub/linux/libs/pam/<br />
realtek r8168 GPLv2+ http://www.realtek.com.tw/<br />
rtai GPLv2+/LGPLv2+ http://www.rtai.org/<br />
schedutils GPLv2 http://rlove.org/<br />
SDL LGPL2.1 http://www.libsdl.org/<br />
Strace 3-clause BSD http://sourceforge.net/projects/strace/<br />
Svgalib free http://www.svgalib.org/<br />
Syslinux GPLv2+ http://syslinux.zytor.com/<br />
Thttpd 2-clause BSD http://acme.com/software/thttpd/<br />
Tunctl GPL http://tunctl.sourceforge.net/<br />
xfree86 XFree86 License http://www.xfree86.org/<br />
DOC-M88-EXX191 V3.0 – 11.2012 169
<strong>User</strong> <strong>Manual</strong><br />
<strong>Bruker</strong> AXS <strong>Measurement</strong> <strong>Suite</strong><br />
Index<br />
Adding users to database 21<br />
Advanced settings 19<br />
Audit trail 18, 26<br />
Audit trail context menu 27<br />
Chart area context menu 107<br />
Column editor 37<br />
Commander menu 110<br />
COMMANDER plug-in 96<br />
Common options 5<br />
Communication timeout 30<br />
Component properties 55, 84<br />
Changing the value of component properties<br />
85<br />
Component status 55<br />
Component status icons 55, 82, 115<br />
Component type icon 115<br />
Components<br />
Adding to config tree 73<br />
Cloning 77<br />
Creating from scratch in configuration 77<br />
Deleting in configuration 80<br />
Renaming in configuration 79<br />
Config menu 61<br />
CONFIG plug-in 53<br />
Config Tree context menu 72<br />
Configuration file<br />
Applying values from configuration file to<br />
component in configuration 78<br />
Configuration tree in CONFIG 54<br />
Connected clients 10<br />
Connecting plug-in to instrument 14, 15<br />
By browsing the database (indirect<br />
connection) 15<br />
By browsing the UDP network (direct and<br />
indirect connections) 16<br />
Controlled Devices window 19<br />
DA VINCI plug-in 114<br />
Database backup/restore 28, 30<br />
DATABASE MANAGEMENT plug-in 18<br />
Deleting a user group 26<br />
Deleting devices from database 20<br />
Deleting users from database 21, 23<br />
Detector control 102<br />
Diagnosing faults and malfunctions 90<br />
Direct command mode 91, 111<br />
Disconnecting plug-in from instrument 14<br />
Drives<br />
Changing drive properties 100<br />
Drive control 99<br />
Initializing and moving 100<br />
Edit menu 13<br />
For CONFIG 80<br />
Editing control 56<br />
Editing the measurement information in START<br />
JOBS 36<br />
Editing the measurement information of<br />
suspended jobs in JOBLIST 48<br />
Emergency operation<br />
In the case of database failure 3<br />
In the case of system failure 3<br />
Entering devices in database 20<br />
Error messages 10<br />
Error register 90<br />
Exiting from <strong>Measurement</strong> <strong>Suite</strong> 14<br />
File menu 13<br />
For all plug-ins 13<br />
Firmware component reference 68<br />
Firmware definition 53<br />
Opening from file, database, or instrument<br />
60<br />
Saving to file 61<br />
General settings 18, 28, 29<br />
Getting control of instruments<br />
For <strong>Measurement</strong> server 9, 19<br />
From TOOLS 81, 89, 90<br />
Goniometer 115<br />
Groups table 25<br />
Handing over plug-in to other user 14<br />
Help menu 14<br />
Instrument configuration 18<br />
Instrument configurations 53<br />
Activating 66<br />
Deleting from database 21<br />
Loading into firmware of instrument 21<br />
Opening from file, database, or instrument<br />
61<br />
Saving to file or database 63<br />
Instrument Configurations window 20<br />
Instrument network setup 70<br />
Instrument state<br />
Opening overview of instrument state 91<br />
Saving overview of instrument state 15, 91<br />
Job history 48<br />
Job priority levels 46<br />
Job scheduler<br />
Malfunction 10<br />
Status 10<br />
Joblist context menu 52<br />
JOBLIST plug-in 46<br />
Log context menu 132<br />
LOG plug-in 131<br />
Logging in/out 12<br />
Logging options 5<br />
Maintaining user data 23<br />
Maintaining user groups 25, 26<br />
Maintaining user profiles 21, 23<br />
<strong>Measurement</strong> (virtual component) 94<br />
<strong>Measurement</strong> client 12<br />
<strong>Measurement</strong> methods ("experiments") 24<br />
Directory 30<br />
<strong>Measurement</strong> server<br />
About <strong>Measurement</strong> server 11<br />
Making preliminary settings for<br />
<strong>Measurement</strong> server 4<br />
<strong>Measurement</strong> server start menu 4<br />
Miscellaneous properties of components 84<br />
Network menu 70<br />
Network packets 10<br />
Offline mode menu 60<br />
Password settings 29<br />
Plug status icons 57<br />
Plug-in concept 12<br />
Plugs and sockets 57<br />
Connecting a plug 59<br />
PSD realtime display 110<br />
Reconnecting to instruments 9<br />
Releasing control of instruments<br />
For <strong>Measurement</strong> server 9<br />
From TOOLS 81, 89<br />
Remote control (virtual component) 93<br />
Repostioning Joblist and Job Details windows<br />
46<br />
170<br />
DOC-M88-EXX191 V3.0 – 11.2012
<strong>Bruker</strong> AXS <strong>Measurement</strong> <strong>Suite</strong><br />
<strong>User</strong> <strong>Manual</strong><br />
Results directory 30<br />
Sample changer control 98<br />
Scan control 105<br />
Scheduled jobs 48<br />
Creating scheduled jobs 49<br />
Scintillation detector settings 103<br />
Scripts directory 30<br />
Sending drive positions from COMMANDER to<br />
XRD Wizard 111<br />
Settings menu 91<br />
Shell interface 12<br />
Speed buttons<br />
In CONFIG 71<br />
In JOBLIST 51<br />
In TOOLS 89<br />
Start Jobs context menu 36<br />
Start Jobs menu 39<br />
START JOBS plug-in 33<br />
Status bar 13<br />
Status window 9<br />
System configuration<br />
Extended configuration 2<br />
Standard configuration 1<br />
System information 15<br />
Templates<br />
Applying values from template file to<br />
component in configuration 78<br />
Exporting to file 66<br />
Importing from file 65<br />
TOOLS plug-in 81<br />
<strong>User</strong> and group rights concept 21<br />
<strong>User</strong> management 18, 21<br />
<strong>User</strong>s table 21<br />
Utilities menu 86<br />
View menu 67<br />
Window menu 13<br />
X-ray generator control 101<br />
ZI and offset determination 112<br />
Zooming in chart area 107<br />
DOC-M88-EXX191 V3.0 – 11.2012 171
<strong>User</strong> <strong>Manual</strong><br />
<strong>Bruker</strong> AXS <strong>Measurement</strong> <strong>Suite</strong><br />
(intentionally left blank)<br />
172<br />
DOC-M88-EXX191 V3.0 – 11.2012