Read the full presentation - Bourbon
Read the full presentation - Bourbon
Read the full presentation - Bourbon

Create successful ePaper yourself
Turn your PDF publications into a flip-book with our unique Google optimized e-Paper software.
STRATEGY<br />
2007 - 2010<br />
PARETO 29 August, 2007
PLAN<br />
External situation (data from industry)<br />
Demand side factors<br />
Market drivers<br />
Market competitive environment<br />
<strong>Bourbon</strong> Fleet<br />
<strong>Bourbon</strong> orders<br />
General information<br />
(costs, crews, use and source of funds, ratios)<br />
PS : <strong>Bourbon</strong> First Half Year Figures – 30 Aug 2007<br />
2
Horizon 2010 – Offshore Division<br />
3
Strong market<br />
Demand side factors<br />
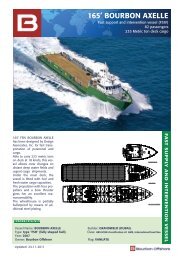
A double challenge<br />
Meet increasing demand AND compensate existing fields production decline<br />
120<br />
90<br />
Estimated future oil demand + 2,3%<br />
96 mmbdj of<br />
additional<br />
production<br />
needed<br />
Historic world demand + 1,6%<br />
m m b d<br />
60<br />
Existing field decline – 8%<br />
30<br />
0<br />
1985 1990 1995 2000 2005 2010 2015 2020<br />
Source: Simmons & Company International – “Today’s Energy Reality”<br />
4
Strong market<br />
Demand side factors<br />
Oil companies will have to adapt to new giant emerging countries’ demand<br />
MBPD<br />
16<br />
14<br />
12<br />
10<br />
8<br />
6<br />
4<br />
2<br />
0<br />
CHINA<br />
1990 - 2030<br />
1990 2003 2010 2015 2020 2025 2030<br />
Production<br />
Consumption<br />
MBPD<br />
6<br />
4<br />
2<br />
0<br />
INDIA<br />
1990 - 2030<br />
1990 2003 2010 2015 2020 2025 2030<br />
Production<br />
Consumption<br />
Data source : EIA<br />
5
Strong market<br />
Demand side factors<br />
National Oil Companies (NOC):<br />
a powerful driver to new oil exploration and production<br />
In 2006<br />
75-80% of oil reserves<br />
held by NOCs<br />
Douglas Westwood<br />
Data source : Schlumberger<br />
« National oil<br />
companies will lead <strong>the</strong><br />
2007 increase in<br />
international spending<br />
with <strong>the</strong> largest<br />
spending growth<br />
among <strong>the</strong> Russian<br />
oil companies »<br />
Lehman Bros,<br />
Dec 06 survey<br />
6
Strong market<br />
Demand side factors<br />
National Oil Companies (NOC):<br />
a powerful driver to new oil exploration and production<br />
Data source : Schlumberger<br />
7
Strong market<br />
Demand side factors<br />
National Oil Companies (NOC):<br />
a powerful driver to new oil exploration and production<br />
Source : « The changing role or national oil companies in international energy markets » - Baker Institute at Rice University<br />
8
Strong market<br />
Demand side factors<br />
The rise of new group of oil and gas companies<br />
Petronas<br />
Petrobras<br />
Petrochina<br />
Gazprom<br />
Saudi Aramco<br />
National<br />
Iranian oil<br />
Company<br />
Petroleos de<br />
Venezuela<br />
« The new seven sisters » (Financial Times 12-03-07)<br />
9
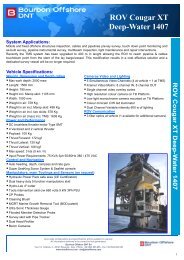
Offshore Division - Market<br />
Market drivers<br />
Rigs (beginning 2007)<br />
93.3% utilization rate<br />
114 drilling rigs under construction :<br />
21 deliveries in 2007 (incl. 5 deepwater)<br />
46 deliveries in 2008<br />
27 deliveries in 2009<br />
20 deliveries in 2010 and after<br />
Source: ODS-Petrodata<br />
10
Offshore Division - Market<br />
Market drivers<br />
Surface units (beginning 2007)<br />
15 floating units installed during <strong>the</strong> year<br />
91 facilities planned over 2007-2010<br />
Source: Infield<br />
11
Offshore Division - Market<br />
Market drivers<br />
Subsea activity (beginning 2007)<br />
460 wellheads installed in 2006<br />
1889 facilities planned over 2007-2010<br />
Source: Infield<br />
12
Strong market<br />
Supply side factors<br />
Bottleneck in equipment-makers<br />
makers, shipyards…<br />
From rigs to subsea equipments (beginning<br />
2007)<br />
Some earliest delivery dates<br />
obtainable today<br />
Q<br />
1<br />
2007<br />
Q<br />
Q<br />
2<br />
3<br />
Q<br />
4<br />
Q<br />
1<br />
2008<br />
Q<br />
Q<br />
2<br />
3<br />
Q<br />
4<br />
Q<br />
1<br />
2009<br />
Q<br />
Q<br />
2<br />
3<br />
Q<br />
4<br />
Q<br />
1<br />
2010<br />
Q<br />
Q<br />
2<br />
3<br />
Q<br />
4<br />
New generation jack-up<br />
Rig semi-sub<br />
Low pressure 400t winch<br />
Engine (ex. 3000 kw, medium speed)<br />
Supply vessel AHTS (ex. 120T)<br />
Supply vessel PSV (ex. GPA 670)<br />
Thrusters…propellers<br />
13
Market competitive environment<br />
Shallow water competitive environment<br />
350<br />
Number of vessels delivered<br />
300<br />
250<br />
200<br />
150<br />
100<br />
50<br />
0<br />
Market competitive environment<br />
Deepwater competitive environment (beginning<br />
2007)<br />
« BOURBON<br />
became <strong>the</strong><br />
deepwater<br />
leader »<br />
(extract from Farstad <strong>presentation</strong> beginning 2007)<br />
15
Market competitive environment<br />
In operation<br />
Under construction<br />
Vessels<br />
(beginning 2007)<br />
TOTAL<br />
BOURBON<br />
21-03-2007<br />
NB of<br />
vessels<br />
Average<br />
age<br />
NB of<br />
vessels<br />
% Vessels<br />
in operation<br />
NB of<br />
vessels<br />
% Vessels<br />
under<br />
construction<br />
AHTS / MPSV<br />
Deep<br />
261<br />
11.8 145 55% 5 3%<br />
PSV / MPSV<br />
Deep<br />
474<br />
8.3<br />
175<br />
37%<br />
17<br />
10 %<br />
AHTS<br />
Continental<br />
752<br />
20.5<br />
211<br />
28%<br />
60<br />
28%<br />
PSV / MPSV<br />
Continental<br />
TOTAL<br />
390<br />
1877<br />
23.8 46 12% 38* 83%<br />
16.9 577 31% 120* 21%<br />
Source : Industry, <strong>Bourbon</strong> estimates<br />
* Including 10 Rigdon<br />
16
Offshore Division - Activity<br />
Fleet at June 30, 2007<br />
Vessels in<br />
operation<br />
Average<br />
age<br />
Vessels<br />
under<br />
construction<br />
TOTAL<br />
MODERN OFFSHORE<br />
170<br />
4.5<br />
177<br />
347<br />
Crewboats<br />
Deepwater supply vessels<br />
Continental supply vessels<br />
103<br />
56<br />
11<br />
5.3<br />
3.6<br />
1.7<br />
62<br />
28<br />
87<br />
165<br />
84<br />
98<br />
TRADITIONAL OFFSHORE<br />
34<br />
18.1<br />
-<br />
34<br />
Crewboats<br />
Deepwater supply vessels<br />
Continental supply vessels<br />
21<br />
2<br />
11<br />
16.5<br />
14.5<br />
21.9<br />
-<br />
-<br />
-<br />
21<br />
2<br />
11<br />
TOTAL<br />
204<br />
6.8<br />
177<br />
381<br />
17
Offshore Division<br />
Contract coverage at June 30, 2007<br />
Long-term<br />
contract<br />
Short-term<br />
contract<br />
Under<br />
construction not<br />
yet assigned<br />
TOTAL<br />
MODERN OFFSHORE<br />
171<br />
21<br />
155<br />
347<br />
Crewboats<br />
Deepwater supply vessels<br />
Continental supply vessels<br />
103<br />
55<br />
13<br />
17<br />
4<br />
0<br />
45<br />
25<br />
85<br />
165<br />
84<br />
98<br />
TRADITIONAL OFFSHORE<br />
24<br />
10<br />
-<br />
34<br />
Crewboats<br />
Deepwater supply vessels<br />
Continental supply vessels<br />
15<br />
1<br />
8<br />
6<br />
1<br />
3<br />
-<br />
-<br />
-<br />
21<br />
2<br />
11<br />
TOTAL<br />
195<br />
31<br />
155<br />
381<br />
18
Offshore Division<br />
Expected deliveries<br />
Vessels under construction at June 30, 2007<br />
Number<br />
Value € m<br />
Deliveries<br />
H2-2007<br />
2007<br />
Deliveries<br />
2008<br />
Deliveries<br />
2009 and<br />
beyond<br />
TOTAL<br />
20<br />
36<br />
6<br />
62<br />
Crew Boats<br />
39<br />
75<br />
26<br />
140<br />
Supply Vessels<br />
5<br />
78<br />
26<br />
260<br />
84<br />
1000<br />
115<br />
1338<br />
TOTAL<br />
25<br />
117<br />
62<br />
335<br />
90<br />
1026<br />
177<br />
1478<br />
In average : one new supply vessel every 12 days over <strong>the</strong> next four years<br />
19
Key success factors<br />
Cost efficiency<br />
Cost *<br />
Building in series in low cost country shipyards<br />
-15%<br />
A<br />
Europe<br />
to<br />
- 30%<br />
B<br />
China<br />
COST EFFICIENCY<br />
Size of order<br />
A = low cost country benefit (local cost impact only)<br />
B = series order benefit (local costs and equipment cost impacts)<br />
* Overall cost benefit depends on size of <strong>the</strong> vessel and percentage of cost of<br />
equipments in <strong>the</strong> vessel price<br />
10 AHTS CW 120t, 54 AHTS GPA 254, 12 PSV P/PX 105,<br />
18 PSV GPA 670, 26 PSV GPA 654<br />
20
Key success factors<br />
Cost efficiency<br />
100%<br />
Ex: Orca Ex: Alexandre Ex: Thera Ex: Topaz Ex: Hermès Ex: GPA 654<br />
59% 45%<br />
Vessels costs<br />
Crew costs<br />
0%<br />
AHTS 170T AHTS 120T AHTS 80 T PSV 4500<br />
DWT<br />
PSV 3000<br />
DWT<br />
PSV 1600<br />
DWT<br />
Consumables,<br />
maintenance<br />
and o<strong>the</strong>rs<br />
21
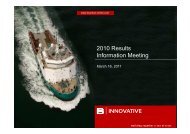
Offshore Division - Activity<br />
Employees at June 30, 2007<br />
Total number of employees : 3 527<br />
214 new employees for 1st semester<br />
The internationalization of crew continues with a<br />
strong increase of Asian crews<br />
14%<br />
9%<br />
32%<br />
8%<br />
23%<br />
3%<br />
11%<br />
Africa Brazil Europe (ex. France) France Mexico Norway Asia<br />
Intensification of internal training: order of 2 AHTS<br />
simulator ; opening scheduled by <strong>the</strong> end of <strong>the</strong> year<br />
for <strong>the</strong> 1st one in Marseille<br />
22
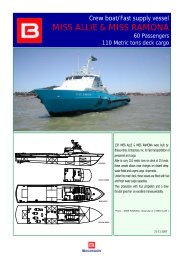
Human Resources<br />
Recruitment zones<br />
Norway<br />
300<br />
Eastern Europe<br />
Mexico<br />
150<br />
300<br />
Brazil<br />
150<br />
France<br />
450<br />
Africa<br />
350<br />
400<br />
1,500<br />
Philippines, Asia<br />
1,200<br />
<strong>Bourbon</strong> Offshore<br />
Operations Area<br />
Recruitment Area<br />
23
Warning<br />
This document may contain non-historical information which<br />
constitutes provisional estimated financial data concerning <strong>the</strong><br />
financial position, results and strategy of BOURBON. These<br />
projections are based on assumptions that may prove to be<br />
incorrect and depend on risk factors that include, without being<br />
limited to: foreign exchange fluctuations, fluctuations in oil and<br />
natural gas prices, changes in <strong>the</strong> investment policies of <strong>the</strong> oil<br />
companies in <strong>the</strong> exploration and production sector, <strong>the</strong> growth in<br />
competing fleets which make <strong>the</strong> market saturated, <strong>the</strong><br />
impossibility of predicting <strong>the</strong> specific client demands, political<br />
instability in certain operating zone, ecological considerations and<br />
general economic conditions.<br />
BOURBON assumes no responsibility for updating provisional data<br />
on <strong>the</strong> basis of new information in light of future events or for any<br />
o<strong>the</strong>r reasons.<br />
24