Sura F
Sura F
Sura F

Create successful ePaper yourself
Turn your PDF publications into a flip-book with our unique Google optimized e-Paper software.
J Bagh College Dentistry Vol. 23(special issue), 2011 Morphometric analysis of<br />
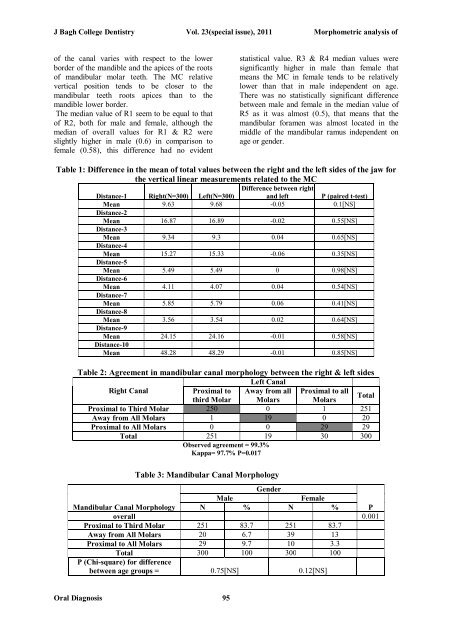
of the canal varies with respect to the lower<br />
border of the mandible and the apices of the roots<br />
of mandibular molar teeth. The MC relative<br />
vertical position tends to be closer to the<br />
mandibular teeth roots apices than to the<br />
mandible lower border.<br />
The median value of R1 seem to be equal to that<br />
of R2, both for male and female, although the<br />
median of overall values for R1 & R2 were<br />
slightly higher in male (0.6) in comparison to<br />
female (0.58), this difference had no evident<br />
statistical value. R3 & R4 median values were<br />
significantly higher in male than female that<br />
means the MC in female tends to be relatively<br />
lower than that in male independent on age.<br />
There was no statistically significant difference<br />
between male and female in the median value of<br />
R5 as it was almost (0.5), that means that the<br />
mandibular foramen was almost located in the<br />
middle of the mandibular ramus independent on<br />
age or gender.<br />
Table 1: Difference in the mean of total values between the right and the left sides of the jaw for<br />
the vertical linear measurements related to the MC<br />
Difference between right<br />
Distance-1 Right(N=300) Left(N=300) and left P (paired t-test)<br />
Mean 9.63 9.68 -0.05 0.1[NS]<br />
Distance-2<br />
Mean 16.87 16.89 -0.02 0.55[NS]<br />
Distance-3<br />
Mean 9.34 9.3 0.04 0.65[NS]<br />
Distance-4<br />
Mean 15.27 15.33 -0.06 0.35[NS]<br />
Distance-5<br />
Mean 5.49 5.49 0 0.98[NS]<br />
Distance-6<br />
Mean 4.11 4.07 0.04 0.54[NS]<br />
Distance-7<br />
Mean 5.85 5.79 0.06 0.41[NS]<br />
Distance-8<br />
Mean 3.56 3.54 0.02 0.64[NS]<br />
Distance-9<br />
Mean 24.15 24.16 -0.01 0.58[NS]<br />
Distance-10<br />
Mean 48.28 48.29 -0.01 0.85[NS]<br />
Table 2: Agreement in mandibular canal morphology between the right & left sides<br />
Left Canal<br />
Right Canal<br />
Proximal to Away from all Proximal to all<br />
third Molar Molars Molars<br />
Total<br />
Proximal to Third Molar 250 0 1 251<br />
Away from All Molars 1 19 0 20<br />
Proximal to All Molars 0 0 29 29<br />
Total 251 19 30 300<br />
Observed agreement = 99.3%<br />
Kappa= 97.7% P=0.017<br />
Table 3: Mandibular Canal Morphology<br />
Gender<br />
Male<br />
Female<br />
Mandibular Canal Morphology N % N % P<br />
overall 0.001<br />
Proximal to Third Molar 251 83.7 251 83.7<br />
Away from All Molars 20 6.7 39 13<br />
Proximal to All Molars 29 9.7 10 3.3<br />
Total 300 100 300 100<br />
P (Chi-square) for difference<br />
between age groups = 0.75[NS] 0.12[NS]<br />
Oral Diagnosis 95