National Wetland Atlas: Kerala - Ministry of Environment and Forests
National Wetland Atlas: Kerala - Ministry of Environment and Forests
National Wetland Atlas: Kerala - Ministry of Environment and Forests

You also want an ePaper? Increase the reach of your titles
YUMPU automatically turns print PDFs into web optimized ePapers that Google loves.
4.0 DATA USED<br />
Remote sensing data<br />
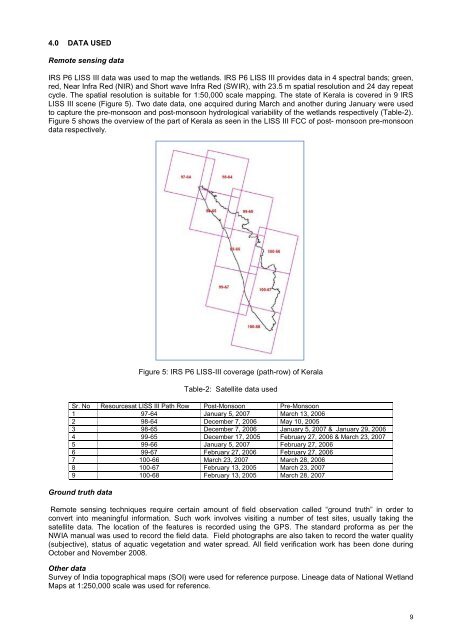
IRS P6 LISS III data was used to map the wetl<strong>and</strong>s. IRS P6 LISS III provides data in 4 spectral b<strong>and</strong>s; green,<br />
red, Near Infra Red (NIR) <strong>and</strong> Short wave Infra Red (SWIR), with 23.5 m spatial resolution <strong>and</strong> 24 day repeat<br />
cycle. The spatial resolution is suitable for 1:50,000 scale mapping. The state <strong>of</strong> <strong>Kerala</strong> is covered in 9 IRS<br />
LISS III scene (Figure 5). Two date data, one acquired during March <strong>and</strong> another during January were used<br />
to capture the pre-monsoon <strong>and</strong> post-monsoon hydrological variability <strong>of</strong> the wetl<strong>and</strong>s respectively (Table-2).<br />
Figure 5 shows the overview <strong>of</strong> the part <strong>of</strong> <strong>Kerala</strong> as seen in the LISS III FCC <strong>of</strong> post- monsoon pre-monsoon<br />
data respectively.<br />
Figure 5: IRS P6 LISS-III coverage (path-row) <strong>of</strong> <strong>Kerala</strong><br />
Table-2: Satellite data used<br />
Sr. No Resourcesat LISS III Path Row Post-Monsoon Pre-Monsoon<br />
1 97-64 January 5, 2007 March 13, 2006<br />
2 98-64 December 7, 2006 May 10, 2005<br />
3 98-65 December 7, 2006 January 5, 2007 & January 29, 2006<br />
4 99-65 December 17, 2005 February 27, 2006 & March 23, 2007<br />
5 99-66 January 5, 2007 February 27, 2006<br />
6 99-67 February 27, 2006 February 27, 2006<br />
7 100-66 March 23, 2007 March 28, 2006<br />
8 100-67 February 13, 2005 March 23, 2007<br />
9 100-68 February 13, 2005 March 28, 2007<br />
Ground truth data<br />
Remote sensing techniques require certain amount <strong>of</strong> field observation called “ground truth” in order to<br />
convert into meaningful information. Such work involves visiting a number <strong>of</strong> test sites, usually taking the<br />
satellite data. The location <strong>of</strong> the features is recorded using the GPS. The st<strong>and</strong>ard pr<strong>of</strong>orma as per the<br />
NWIA manual was used to record the field data. Field photographs are also taken to record the water quality<br />
(subjective), status <strong>of</strong> aquatic vegetation <strong>and</strong> water spread. All field verification work has been done during<br />
October <strong>and</strong> November 2008.<br />
Other data<br />
Survey <strong>of</strong> India topographical maps (SOI) were used for reference purpose. Lineage data <strong>of</strong> <strong>National</strong> <strong>Wetl<strong>and</strong></strong><br />
Maps at 1:250,000 scale was used for reference.<br />
9