Carlisle Health Improvement Plan Health Profile for 2010
Carlisle Health Improvement Plan Health Profile for 2010
Carlisle Health Improvement Plan Health Profile for 2010

You also want an ePaper? Increase the reach of your titles
YUMPU automatically turns print PDFs into web optimized ePapers that Google loves.
<strong>Carlisle</strong> <strong>Health</strong> <strong>Improvement</strong> <strong>Plan</strong><br />
<strong>Health</strong> <strong>Profile</strong> <strong>for</strong> <strong>2010</strong><br />
Jennifer Clay<br />
Public <strong>Health</strong> Intelligence Analyst, NHS Cumbria
Index<br />
Page<br />
Introduction 3<br />
The population of <strong>Carlisle</strong> 4<br />
Migrants 4<br />
Births 5<br />
Population projections 6<br />
<strong>Health</strong> inequalities 7<br />
Life expectancy 9<br />
What are the main causes of disease causing<br />
the low level of life expectancy in <strong>Carlisle</strong>? 11<br />
Infant mortality 11<br />
Mortality and spearheads 12<br />
Premature deaths from circulatory disease 14<br />
Premature deaths from cancer 14<br />
Which type of cancer? 15<br />
Cancer screening 16<br />
What are the behavioural risk factors resulting<br />
in the inequalities gap in life expectancy and infant mortality? 18<br />
Smoking 18<br />
Obesity 21<br />
Obesity and nutrition 23<br />
Obesity and physical activity 23<br />
Mental health 24<br />
Alcohol 25<br />
Chlamydia 27<br />
Teenage pregnancy 28<br />
Breastfeeding 28<br />
Wider determinants of health 30<br />
Work, unemployment and incapacity 30<br />
Fuel poverty 30<br />
Excess winter deaths 31<br />
Child poverty 32<br />
Educational attainment 33<br />
Household income 33<br />
Conclusion 34<br />
<strong>Carlisle</strong> <strong>Health</strong> <strong>Improvement</strong> <strong>Plan</strong><br />
J. Clay<br />
2
Introduction<br />
The purpose of this profile is to bring together data affecting the health and wellbeing of the<br />
people of <strong>Carlisle</strong>. It is aimed at colleagues within the NHS, external partners and the third<br />
sector. Firstly, its’ content will aid future commissioning with the intention of improving health<br />
outcomes <strong>for</strong> the population of <strong>Carlisle</strong>. Secondly, the report may also be useful <strong>for</strong> partners<br />
to assist them with their strategic aims around health improvement. Responding to the<br />
Coalition Government’s White Paper: Equity & Excellence: Liberating the NHS (<strong>2010</strong>) which<br />
suggests a move to locality based GP consortia commissioning arrangements where possible<br />
data are presented at GP practice level. Where this is not feasible data are at local authority<br />
level. National and county comparator in<strong>for</strong>mation is provided.<br />
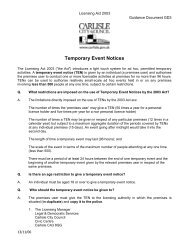
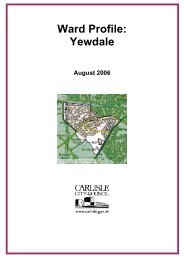
Figure 1: <strong>Carlisle</strong> district and PBC boundary<br />
<strong>Carlisle</strong> <strong>Health</strong> <strong>Improvement</strong> <strong>Plan</strong><br />
J. Clay<br />
3
<strong>Carlisle</strong> district council covers an area of some 400 square miles with 69% of the population<br />
living within <strong>Carlisle</strong> city. Recent changes to the <strong>Carlisle</strong> Practice Based Commissioning<br />
Consortium (PBC) resulted in Dalston surgery joining with the PBC sub-locality of Solway.<br />
The result of this is that the boundary of <strong>Carlisle</strong> PBC is no longer co-terminus with the district<br />
council boundary. Due to these changes two of the three lower super output areas that<br />
constitute Dalston ward have been allocated to Solway locality.<br />
The population of <strong>Carlisle</strong><br />
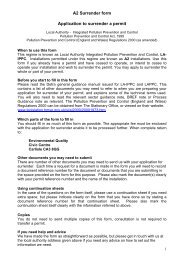
Figure 2: Resident populations<br />
Resident population (thousands)<br />
ONS 2009 Exeter <strong>2010</strong><br />
94.3<br />
98.6<br />
104.7<br />
109.3<br />
103.8<br />
107.5<br />
70.9<br />
72.5<br />
69.7<br />
71.5<br />
51.8<br />
53.3<br />
Allerdale Barrow-in-Furness <strong>Carlisle</strong> Copeland Eden South Lakeland<br />
District council<br />
Figure 2 shows the latest population figures <strong>for</strong> <strong>Carlisle</strong> district council indicate a population<br />
of 104,700 (mid year population estimates, Office <strong>for</strong> National Statistics (ONS). This figure<br />
increases by 4% to 109,300 when the population is taken from the Exeter patient registration<br />
system. The patient registration system tends to record a higher figure than mid year<br />
population estimates. There<strong>for</strong>e one would expect the true population to be between the two<br />
figures. Returning to mid year estimates almost one fifth of <strong>Carlisle</strong>’s residents are aged over<br />
65 years.<br />
Migrants<br />
Table 1: Migrant workers by GP sub localities<br />
Practice sub locality 2006 2007 2008 2009 <strong>2010</strong> Total<br />
Brampton & Longtown 23 49 45 39 40 196<br />
<strong>Carlisle</strong> Medical Group 108 367 255 200 156 1,086<br />
Eden Medical Group 41 95 59 54 26 275<br />
Stanwix Medical Centre 43 90 136 141 102 512<br />
Warwick Rd 67 201 156 109 79 612<br />
<strong>Carlisle</strong> locality 282 802 651 543 403 2,681<br />
Practice list inflation may well be due to the number of students and migrants living in an<br />
area. Table 1 shows there to be almost 2,700 migrants in <strong>Carlisle</strong> PBC locality. Of these<br />
43% are from Poland with the remainder arriving from 100 assorted countries. The majority<br />
of migrants, 61%, fall within the age band 20-35 years. One fifth is aged below 20 years of<br />
age.<br />
<strong>Carlisle</strong> <strong>Health</strong> <strong>Improvement</strong> <strong>Plan</strong><br />
J. Clay<br />
4
Births<br />
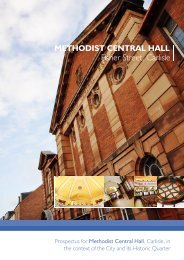
Figure 3: Live birth rate trend<br />
Live birth rate per 1,000 population<br />
E&W Cumbria <strong>Carlisle</strong><br />
12 . 1 12 . 5 12 . 8 13 . 0 12 . 9<br />
11. 8 12 . 0<br />
10 . 7 11. 1 10 . 9<br />
9.7 9.9 10 . 1 10 . 3 10 . 3<br />
2005 2006 2007 2008 2009<br />
On average each year in <strong>Carlisle</strong> there are 1,200 live births. Latest figures <strong>for</strong> 2009 show that<br />
there were 1,229 live births in the district. As shown in figure 3 the live birth rate in <strong>Carlisle</strong> is<br />
usually above that <strong>for</strong> Cumbria but below the national average. The current rate of 12 births<br />
per 1,000 population is just below the national average of 13 births per 1,000 population.<br />
Figure 4: Practice birth rate, 1.7.<strong>2010</strong><br />
<strong>Carlisle</strong> PBC: practice birth rate/1,000 population as at 1st July <strong>2010</strong><br />
<strong>Carlisle</strong> average<br />
13.3<br />
12.4 12.2 12.1 11.8<br />
10.9 10.4 10.0 9.9<br />
7.6<br />
Brunswick<br />
House<br />
Eden<br />
Medical<br />
Group<br />
65 Warwick<br />
Road<br />
Fusehill<br />
Medical<br />
Practice<br />
St Paul's<br />
Medical<br />
Centre<br />
Spencer<br />
Street<br />
Surgery<br />
Esk Valley<br />
Medical<br />
Practice<br />
Stanwix<br />
Medical<br />
Practice<br />
Grosvenor<br />
House<br />
Brampton<br />
Medical<br />
Practice<br />
To have an indication of the birth rate at GP practice level, population figures have been<br />
taken from the Exeter patient registration system. By counting the number of infants aged<br />
below one year, it is possible to calculate a proxy practice birth rate. Using this method the<br />
average birth rate <strong>for</strong> <strong>Carlisle</strong> PBC is 11 births per 1,000 registered population (July, <strong>2010</strong>).<br />
There is a wide variation in practice birth rates with Brunswick House experiencing the<br />
highest rate of 13.3 births and Brampton the lowest at 7.6 births.<br />
<strong>Carlisle</strong> <strong>Health</strong> <strong>Improvement</strong> <strong>Plan</strong><br />
J. Clay<br />
5
Population Projections<br />
Figure 5: Population projections (2008 based)<br />
<strong>Carlisle</strong> projected population<br />
105.1<br />
105.8<br />
106.6<br />
107.3<br />
2008<br />
2009<br />
<strong>2010</strong><br />
2011<br />
108.0<br />
108.6<br />
109.2<br />
109.8<br />
110.5<br />
2012<br />
2013<br />
2014<br />
2015<br />
2016<br />
111.1<br />
111.7<br />
112.3<br />
112.9<br />
113.5<br />
114.1<br />
114.7<br />
2017<br />
2018<br />
2019<br />
2020<br />
2021<br />
2022<br />
2023<br />
115.3<br />
115.9<br />
116.5<br />
117.1<br />
117.7<br />
118.2<br />
118.7<br />
119.2<br />
2024<br />
2025<br />
2026<br />
2027<br />
2028<br />
2029<br />
2030<br />
2031<br />
Figure 5 shows the population projection (2008 based) trend <strong>for</strong> <strong>Carlisle</strong>. By 2033,<br />
projections suggest a growth of 14% in the overall population size of <strong>Carlisle</strong>. This is greatest<br />
increase in the Cumbria economy, but below the projected England growth of 18%.<br />
119.6<br />
120.1<br />
2032<br />
2033<br />
Figure 6: Population projections: population aged 65 plus (2008 based)<br />
% Population projection aged 65 years and over<br />
2008 2033<br />
31% 32%<br />
20% 20%<br />
27% 26%<br />
18% 18% 18%<br />
30%<br />
21%<br />
35%<br />
23%<br />
37%<br />
16%<br />
23%<br />
Cumbria Allerdale Barrow-in-<br />
Furness<br />
<strong>Carlisle</strong> Copeland Eden South<br />
Lakeland<br />
England<br />
Figure 6 examines those aged over 65 years of age. Projections suggest that this age group<br />
will increase in <strong>Carlisle</strong> from 18% of the total population in 2008 to 26% by 2033. Both figures<br />
are above the Cumbria average but below those <strong>for</strong> England.<br />
<strong>Carlisle</strong> <strong>Health</strong> <strong>Improvement</strong> <strong>Plan</strong><br />
J. Clay<br />
6
<strong>Health</strong> Inequalities<br />
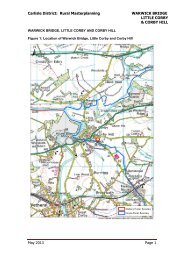
Figure 7: Index of multiple deprivation 2007<br />
In order to tackle health inequalities it is necessary to focus activities on those most in need.<br />
Using the English Indices of Deprivation 2007 which measured seven domains and combined<br />
these to produce the Index of Multiple Deprivation it is possible to identify those areas<br />
<strong>Carlisle</strong> <strong>Health</strong> <strong>Improvement</strong> <strong>Plan</strong><br />
J. Clay<br />
7
experiencing the greatest deprivation, figure 7. The geographical area the Index is based on<br />
is the lower super output area (LSOA). A LSOA nests within an existing ward. A more<br />
populous ward may contain several LSOAs, a sparsely populated ward only one. There<strong>for</strong>e<br />
pockets of deprivation can be detected at sub-ward level.<br />
All LSOAs in England were given a score and ranked. The rank of one indicates the area with<br />
the worst deprivation in the country. Rankings were divided into quintiles (fifths) where<br />
quintile one represents the most deprived and quintile five the least deprived. Taking the<br />
quintile and using a traffic light system where red indicates the worst and dark green the best,<br />
data <strong>for</strong> <strong>Carlisle</strong> district have been mapped.<br />
Figure 8: Most deprived areas of <strong>Carlisle</strong><br />
Figure 8 shows those areas of <strong>Carlisle</strong> experiencing the worst deprivation (quintile one).<br />
Data <strong>for</strong> 2004 and 2007 have been compared. Over the two periods only part of Castle ward<br />
has moved out of quintile one. Between 2004 and 2007 parts of Botcherby, Morton and St<br />
Aidans have slipped into quintile one. The most deprived areas of <strong>Carlisle</strong> are shown in the<br />
table 2.<br />
<strong>Carlisle</strong> <strong>Health</strong> <strong>Improvement</strong> <strong>Plan</strong><br />
J. Clay<br />
8
Table 2: IMD 2007, most deprived areas of <strong>Carlisle</strong><br />
Estimated England rank Cumbria Rank National<br />
LSOA code LSOA description<br />
population (1-32,482) (1-322) Quintile<br />
E01019193 Belle Vue Part 2 1,274 1283 11 1<br />
E01019245 Upperby Part 1 1,474 1364 12 1<br />
E01019197 Botcherby Part 2 1,824 1373 13 1<br />
E01019199 Botcherby Part 4 1,008 2663 24 1<br />
E01019248 Upperby Part 4 1,126 3007 26 1<br />
E01019231 Morton Part 2 1,434 3448 29 1<br />
E01019222 Harraby Part 3 1,425 4934 41 1<br />
E01019234 St Aidans Part 1 1,375 5183 44 1<br />
E01019198 Botcherby Part 3 1,384 5464 46 1<br />
E01019246 Upperby Part 2 1,313 5536 47 1<br />
E01019236 St Aidans Part 3 1,367 5641 49 1<br />
E01019230 Morton Part 1 1,596 5974 52 1<br />
E01019194 Belle Vue Part 3 1,411 6054 53 1<br />
E01019207 Castle Part 4 1,396 6068 54 1<br />
E01019221 Harraby Part 2 1,491 6102 55 1<br />
E01019206 Castle Part 3 1,400 6476 59 1<br />
Most deprived 22,298<br />
Currently around one fifth of <strong>Carlisle</strong>’s population are living within the most deprived<br />
communities in England.<br />
Life expectancy<br />
Figure 9: Life expectancy trend, males and females<br />
Life Expectancy at birth<br />
Years<br />
83.0<br />
82.0<br />
81.0<br />
80.0<br />
79.0<br />
78.0<br />
77.0<br />
76.0<br />
75.0<br />
74.0<br />
73.0<br />
72.0<br />
1991-<br />
1993<br />
1992-<br />
1994<br />
1993-<br />
1995<br />
1994-<br />
1996<br />
1995-<br />
1997<br />
Eng (M) <strong>Carlisle</strong> (M) Eng (F) <strong>Carlisle</strong> (F)<br />
1996-<br />
1998<br />
1997-<br />
1999<br />
1998-<br />
2000<br />
1999-<br />
2001<br />
2000-<br />
2002<br />
2001-<br />
2003<br />
2002-<br />
2004<br />
2003-<br />
2005<br />
2004-<br />
2006<br />
2005-<br />
2007<br />
2006-<br />
2008<br />
The most basic way of measuring the health of a community is to look at when and how<br />
people die. Life expectancy shows the average age a child born today in an area could<br />
expect to live assuming that people are dying at the same rate and ages that we find today. It<br />
is affected by the number of people dying and the age at which they die.<br />
As shown in figure 9, over the past fifteen years there has been a steady improvement in life<br />
expectancy <strong>for</strong> men and women living in <strong>Carlisle</strong>. However life expectancy <strong>for</strong> both males<br />
and females continues to be below the national average.<br />
<strong>Carlisle</strong> <strong>Health</strong> <strong>Improvement</strong> <strong>Plan</strong><br />
J. Clay<br />
9
Figure 10: 2006-08, life expectancy at birth and at age 65 years, males and females<br />
Life exp ectancy at birth, 2006-2008<br />
<strong>Carlisle</strong> Cumbria England<br />
Life expectancy at ag e 65 years, 2006-2008<br />
<strong>Carlisle</strong> Cumbria England<br />
81. 4<br />
81.4<br />
82.0<br />
20.3 20.2<br />
20. 4<br />
77.1<br />
77. 8<br />
77.9<br />
17.2<br />
17.6<br />
17.7<br />
Males<br />
Females<br />
Males<br />
Females<br />
Latest figures in figure 10, show average life expectancy <strong>for</strong> men in <strong>Carlisle</strong> is 77.1 years.<br />
This compares with 77.8 years <strong>for</strong> Cumbria and 77.9 years <strong>for</strong> England. Life expectancy <strong>for</strong><br />
women in <strong>Carlisle</strong> matches that of Cumbria at 81.4 years but is below the national average of<br />
82 years.<br />
Once a man in <strong>Carlisle</strong> has reached his 65 th ye ar of life he can expect to live <strong>for</strong> a further 17.2<br />
years . Again this is below the county and national averages of 17.6 years and 17.7 years<br />
respectively. For women aged 65 living in <strong>Carlisle</strong> they can expect to live <strong>for</strong> a further 20.3<br />
years. This is just above the Cumbria average of 20.2 years and just below the national<br />
average of 20.4 years.<br />
Figure 11: Ward life expectancy at birth, 1999 to 2003, persons<br />
Life expectancy at birth by electoral wards in <strong>Carlisle</strong> (years)<br />
1999 to 2003<br />
75 yrs<br />
83.2 81.7 81.2 81.2 80.8 79.7 79.4 79.1 79.1 78.6 77.7 77.7 77.1 76.6 76.5 76.3 76.3 76.1 75.3 74.7 74.4 73.5<br />
Hayton<br />
Stanwix Urban<br />
Burgh<br />
Wetheral<br />
Great Corby and Geltsdale<br />
Lyne<br />
Stanwix Rural<br />
Belah<br />
Irthing<br />
Yewdale<br />
Brampton<br />
St Aidans<br />
Ward<br />
Dalston<br />
Harraby<br />
Denton Holme<br />
Currock<br />
Longtown & Rockcliffe<br />
Morton<br />
Upperby<br />
Castle<br />
Botcherby<br />
Belle Vue<br />
Consdideration should be given to the location of medical & care establishements<br />
Wider variations in life expectancy can be found when looking at data at sub-district level, see<br />
figure 11 . Someone living in the ward of Hayton has an average life expectancy of 83.2<br />
years. Whereas their opposite number living in Belle Vue ward has a life expectancy of 73.5<br />
years. In other words they die 9.7 years earlier! People living in the wards of Belle Vue,<br />
Botcherby and Castle can expect to die “prematurely” as all three wards have an average live<br />
expectancy of below 75 years of age. A cautionary note must be sounded when looking at<br />
data at a lower level. The location of medical and care establishments should be taken into<br />
consideration when looking at sub-district data. The number of residents within these<br />
establishments will impact on an areas life expectancy.<br />
<strong>Carlisle</strong> <strong>Health</strong> <strong>Improvement</strong> <strong>Plan</strong><br />
J. Clay<br />
10
What are the main diseases causing the low level of life expectancy in <strong>Carlisle</strong>?<br />
Figure 12: Life expectancy and cause of death, 2006-08<br />
The Association of Public <strong>Health</strong> Observatories provides in<strong>for</strong>mation on the differences in life<br />
expectancy <strong>for</strong> a local area compared with the average <strong>for</strong> England, see figure 12. For men<br />
in <strong>Carlisle</strong> three causes of death: circulatory disease, cancer and external causes, account <strong>for</strong><br />
three quarters of the gap in life expectancy when compared with the national average. For<br />
women, replace external causes with digestive diseases. These three diseases are<br />
responsible <strong>for</strong> 80% of the life expectancy gap <strong>for</strong> women living in <strong>Carlisle</strong>.<br />
Infant mortality<br />
Figure 13: Infant mortality trend<br />
Infant death rate per 1,000 population<br />
E&W Cumbria <strong>Carlisle</strong><br />
7.2<br />
5.0 4.4<br />
5.0 4.7<br />
4.8 4.4 4.5 4.8 4.9<br />
4.1 4.7<br />
2.6<br />
3.5<br />
2.4<br />
2005 2006 2007 2008 2009<br />
Infant mortality is a good indicator of the overall health of a society. On average each year in<br />
<strong>Carlisle</strong> five infants die be<strong>for</strong>e reaching their first birthday. As shown in figure 13 infant<br />
mortality rates are at an all time low. In 2009 the mortality rate in <strong>Carlisle</strong> was 2.4 deaths <strong>for</strong><br />
every 1,000 live births. This is well below the national average of 4.7 deaths per 1,000 live<br />
births and that of Cumbria (3.5 deaths per 1,000). During 2009 in <strong>Carlisle</strong>, three babies died<br />
in the first year of life, this compares with eight deaths in 2005. Infant mortality is mainly as a<br />
result of: immaturity, low birth weight, sudden unexpected death in infancy, congenital<br />
mal<strong>for</strong>mations and infection.<br />
<strong>Carlisle</strong> <strong>Health</strong> <strong>Improvement</strong> <strong>Plan</strong><br />
J. Clay<br />
11
The emphasis on reducing smoking during pregnancy, teenage pregnancy obesity, improved<br />
parental nutrition and an increase in breast feeding contribute to reducing the number of<br />
deaths in the first year of life.<br />
Mortality and Spearheads<br />
To tackle health inequalities the Government selected those districts of England with the<br />
greatest inequalities and designated them as “spearhead” areas. <strong>Carlisle</strong> district council falls<br />
within the classification of spearhead.<br />
Figure 14: All causes, all ages mortality trend by gender<br />
DSR<br />
900<br />
850<br />
800<br />
750<br />
700<br />
650<br />
Mortality: all causes, all ages, males<br />
(directly standardised rates)<br />
England Cumbria <strong>Carlisle</strong><br />
2001 2002 2003 2004 2005 2006 2007 2008<br />
DSR<br />
650<br />
600<br />
550<br />
500<br />
450<br />
Mortality: all causes, all ages, females<br />
(directly standardised rates)<br />
England Cumbria <strong>Carlisle</strong><br />
2001 2002 2003 2004 2005 2006 2007 2008<br />
Although showing a downwards trend, figure 14 shows the all age, all cause mortality rates<br />
<strong>for</strong> males and females to be above the county and national averages. The current directly<br />
standardised rate <strong>for</strong> men in <strong>Carlisle</strong> is 760 deaths <strong>for</strong> every 100,000 men. This compares<br />
with 693 deaths per 100,000 men in Cumbria and a national rate of 680 deaths per 100,000<br />
men. Looking to the female population of <strong>Carlisle</strong> the current rate of female mortality is 530<br />
deaths <strong>for</strong> every 100,000 women. This is above county and national rates of 513 deaths per<br />
100,000 and 487 deaths per 1900,000 respectively.<br />
Figure 15: All causes, under 75 years mortality trend by gender<br />
DSR<br />
470<br />
420<br />
370<br />
320<br />
Premature Mortality: all causes, males<br />
(directly standardised rates)<br />
England Cumbria <strong>Carlisle</strong><br />
2001 2002 2003 2004 2005 2006 2007 2008<br />
DSR<br />
320<br />
300<br />
280<br />
260<br />
240<br />
220<br />
Premature Mortality: all causes, females<br />
(directly standardised rates)<br />
England Cumbria <strong>Carlisle</strong><br />
2001 2002 2003 2004 2005 2006 2007 2008<br />
Moving to premature mortality, that is deaths below the age of 75 years. As shown in figure<br />
15, mortality rates in <strong>Carlisle</strong> <strong>for</strong> both sexes remain above county and national levels. Over<br />
the last few years premature mortality followed a general downward trend. However<br />
2008<br />
saw a change locally with morality rates increasing in both men and women. Men in <strong>Carlisle</strong><br />
experience a premature mortality rate of 407 deaths per 100,000 men. This is above the<br />
county rate of 363 deaths per 100,000 men and national rate of 357 deaths per 100,000.<br />
Female premature mortality in <strong>Carlisle</strong> is currently 272 deaths <strong>for</strong> every 100,000 women.<br />
This compares with a rate of 255 deaths <strong>for</strong> every 100,000 women in Cumbria and a national<br />
rate of 227 deaths <strong>for</strong> every 100,000 women. Data recently released to the PCT <strong>for</strong> 2009<br />
indicate a reduction in the number of premature deaths <strong>for</strong> both genders.<br />
<strong>Carlisle</strong> <strong>Health</strong> <strong>Improvement</strong> <strong>Plan</strong><br />
J. Clay<br />
12
Figure 16: Mortality in <strong>Carlisle</strong>, 2009<br />
ge<br />
ta<br />
Percen<br />
100%<br />
90%<br />
80%<br />
70%<br />
60%<br />
50%<br />
40%<br />
30%<br />
20%<br />
10%<br />
0%<br />
<strong>Carlisle</strong> mortality, 2009 by age gr oup<br />
0-74 years 75+ years<br />
336<br />
429<br />
226<br />
150<br />
Male<br />
Female<br />
765<br />
376<br />
Persons<br />
During 2009 in <strong>Carlisle</strong> there were 1,141 deaths, see figure 16. This is a slight reduction of<br />
2% on the previous years’ figure of 1,159 deaths. A third of all deaths in 2009 were in people<br />
aged below 75 years of age. In terms of gender, two fifths of all male deaths were premature.<br />
For women, just over one quarter of all deaths was be<strong>for</strong>e the age of 75 years. Premature<br />
mortality during 2009 fell by 9% when compared with the previous year (411 deaths). There<br />
was a 15% reduction in the number of early deaths in females during the year. Male deaths<br />
declined by 4%.<br />
Figure 16: All age mortality: causes of death in <strong>Carlisle</strong>, 2009<br />
<strong>Carlisle</strong> mortality, all ages, 2009<br />
Circulatory, 36% Circulatory, 37%<br />
Cancer, 32%<br />
Cancer, 27%<br />
Respiratory , 12%<br />
Respiratory , 12%<br />
Digestive, 4%<br />
Digestive, 6%<br />
Other , 15% Other , 17%<br />
Male<br />
Female<br />
Figure 16 shows the main cause of death in <strong>Carlisle</strong> during 2009. Four out of five deaths can<br />
be attributed to three disease groups: circulatory diseases, malignant cancers and respiratory<br />
diseases. For both sexes, death from circulatory diseases tops the table as the main cause<br />
of death. Numbers are fairly evenly split between men and women.<br />
Figure 17: Premature mortality: causes of death in <strong>Carlisle</strong>, 2009<br />
<strong>Carlisle</strong> premature mortality, 2009<br />
Cancer, 36%<br />
Cancer, 45%<br />
Circulatory, 32% Circulatory, 19%<br />
Respiratory , 8%<br />
Respiratory , 11%<br />
Digestive, 6% Digestive, 7%<br />
Other , 17% Other , 17%<br />
Male<br />
Female<br />
<strong>Carlisle</strong> <strong>Health</strong> <strong>Improvement</strong> <strong>Plan</strong><br />
J. Clay<br />
13
Figure 17 shows premature mortality by main cause of death. For this age group cancer is<br />
the primary cause of death, accounting <strong>for</strong> two out of five deaths. Proportionately more<br />
women than men will die from cancer in this age group. Almost half of all female deaths are<br />
attributable to some <strong>for</strong>m of cancer.<br />
Premature deaths from circulatory disease<br />
The main behavioural risk factors that contribute to high levels of circulatory disease are:<br />
smoking, diet and levels of physical activity. In <strong>Carlisle</strong> premature mortality <strong>for</strong> this disease<br />
group are above the county and national level <strong>for</strong> males and females.<br />
Figure 18: Premature mortality from circulatory disease by gender<br />
DSR<br />
Premature Mortality: All circulatory disease, males<br />
(directly standardised rates)<br />
190.0<br />
170.0<br />
150.0<br />
130.0<br />
110.0<br />
90.0<br />
England Cumbria <strong>Carlisle</strong><br />
2001 2002 2003 2004 2005 2006 2007 2008<br />
DSR<br />
Premature Mortality: All circulatory disease, females<br />
(directly standardised rates)<br />
England Cumbria <strong>Carlisle</strong><br />
80.0<br />
70.0<br />
60.0<br />
50.0<br />
40.0<br />
30.0<br />
2001 2002 2003 2004 2005 2006 2007 2008<br />
As shown in figure 18, in <strong>Carlisle</strong> the current male mortality rate from circulatory disease is<br />
103 deaths per 100,000 men slightly above that of England and Cumbria. The rate of 50<br />
deaths out of 100,000 females in <strong>Carlisle</strong> compares favourably with that of Cumbria but is<br />
above the national rate of 44 female deaths. Looking at the broader picture, since 2001<br />
mortality from circulatory disease has decreased by 36% <strong>for</strong> both sexes. Latest figures <strong>for</strong><br />
2009 reveal that the number of male deaths has increased by a fifth over the previous year to<br />
73 deaths and decreased by over a fifth in females to 28 deaths.<br />
Premature deaths from cancer<br />
The risk of developing cancer depends on many factors: including age, lifestyle and genetic<br />
make-up. It is estimated that up to half of all cancers could be avoided if people made<br />
changes to their lifestyles such as stopping smoking, moderate alcohol intake, maintaining a<br />
healthy bodyweight and avoiding excessive sun exposure. Early detection and increased<br />
awareness of screening interventions such as colorectal, breast and cervical screening<br />
provide an opportunity to reduce premature mortality rates.<br />
Figure 19: Premature mortality from cancer by gender<br />
Premature Mortality: All cancers, males<br />
(directly standardised rates)<br />
England Cumbria <strong>Carlisle</strong><br />
Premature Mortality: All cancers, females<br />
(directly standardised rates)<br />
England Cumbria <strong>Carlisle</strong><br />
190.0<br />
140.0<br />
DSR<br />
170.0<br />
150.0<br />
130.0<br />
110.0<br />
DSR<br />
120.0<br />
100.0<br />
80.0<br />
90.0<br />
2001 2002 2003 2004 2005 2006 2007 2008<br />
60.0<br />
2001 2002 2003 2004 2005 2006 2007 2008<br />
In <strong>Carlisle</strong>, as shown in figure 19, the current male mortality rate from cancer is 128 deaths<br />
per 100,000 men, slightly above that <strong>for</strong> England but below the county rate of 164 deaths per<br />
100,000. The female mortality rate of 108 deaths out of 100,000 women is above the national<br />
<strong>Carlisle</strong> <strong>Health</strong> <strong>Improvement</strong> <strong>Plan</strong><br />
J. Clay<br />
14
and county rates of just over 100 deaths per 100,000 women. Looking at the broader picture<br />
since 2001 mortality from cancer has decreased by 13% <strong>for</strong> men and 8% <strong>for</strong> women. Latest<br />
figures <strong>for</strong> 2009 reveal that the numbers of deaths in men have decreased by 17% over the<br />
previous year to 82 deaths. For women, compared with the previous year there has been a<br />
slight increase of 5% in the number of female deaths, with a total of 68 deaths during 2009.<br />
Which type of cancer?<br />
Standardised mortality ratios (SMRs) are used to measure the ratio of deaths in a standard<br />
population, in this case England, with a study population. The standard population is<br />
measured as 100 and the study population is compared with this. Anything above 100 is<br />
worse than average and anything below is better. A statistical test is applied to the SMR to<br />
identify if it is significantly better or worse than would be expected. In this instance this<br />
significance is represented by “faces”. A sad face (red) represents worse than expected and<br />
a happy face (green) better than expected when compared to the national average.<br />
Table 3: Cancer trend by site and gender<br />
Males Deaths SMR with statistical significance<br />
Site ICD No. 02-04 03-05 04-06 2002-04 2003-05 2004-06<br />
All cancers C00-C97 240 221 242 102 96 106<br />
MN Oesophagus C15 16 15 20 103 96 128<br />
MN Stomach C16 12 6 6 117 61 65<br />
MN Colon/Rectum C18-C20 26 29 28 105 118 117<br />
MN Pancreas C25 8 8 7 71 70 60<br />
MN Trachea, Bronchus, Lung C33-C34 69 69 76 113 116 129 <br />
Mal Melanoma Skin C43 .. 5 7 .. 133 179<br />
Mesothelioma C45 5 7 7 88 123 121<br />
MN Prostate C61 18 19 22 104 112 132<br />
MN Kidney ex Renal Pelvis C64 10 6 5 146 86 69<br />
MN Bladder C67 .. .. .. .. .. .. ☺<br />
MN Brain C71 14 7 8 160 79 95<br />
Non-Hodgkin's Lymphoma C82-C85 11 6 6 132 76 80<br />
Leukaemia C91-C95 7 7 10 98 97 139<br />
Females<br />
All cancers C00-C97 192 223 234 96 112 118 <br />
MN Oesophagus C15 10 15 14 181 277 257 <br />
MN Stomach C16 11 10 8 243 227 193<br />
MN Colon/Rectum C18-C20 8 12 12 50 ☺ 85 96<br />
MN Pancreas C25 10 12 18 111 128 186 <br />
MN Trachea, Bronchus, Lung C33-C34 48 55 52 125 142 130<br />
Mal Melanoma Skin C43 .. .. 5 .. .. 180<br />
Mesothelioma C45 .. .. .. .. .. ..<br />
MN Female Breast C50 28 27 35 72 69 90<br />
MN Cervix Uteri C53 .. .. 7 .. .. 191<br />
MN Uterus C54 .. .. 5 .. .. 149<br />
MN Ovary C56 15 21 19 95 136 126<br />
MN Kidney ex Renal Pelvis C64 .. .. .. .. .. ..<br />
MN Bladder C67 .. .. .. .. .. ..<br />
MN Brain C71 7 6 6 120 104 107<br />
Non-Hodgkin's Lymphoma C82-C85 .. .. 6 .. .. 111<br />
Leukaemia C91-C95 .. .. .. .. .. ..<br />
.. Data suppressed (less than five deaths)<br />
Lung cancer in men and women is significantly higher than would be expected. For women<br />
overall, all cancers, oesophageal cancer and stomach cancer are areas of concern.<br />
<strong>Carlisle</strong> <strong>Health</strong> <strong>Improvement</strong> <strong>Plan</strong><br />
J. Clay<br />
15
Cancer screening<br />
Currently there are three national screening programmes operating within the district. These<br />
are: cervical – screening women aged 25 to 64 years, breast – screening women aged 53 to<br />
64 years and bowel screening. Originally bowel screening was offered to men and women<br />
aged 60 to 69 years. This has recently been extended to include the age group 70 to 75<br />
years. Latest coverage figures are shown in table 4.<br />
Table 4: Screening coverage<br />
2009/10 2009 2009/10<br />
Area Breast Bowel Cervical<br />
<strong>Carlisle</strong> 82% 59% 81%<br />
Cumbria 82% 60% 82%<br />
England *77% 52% 79%<br />
*2008/09 coverage<br />
Generally <strong>Carlisle</strong> locality per<strong>for</strong>ms w ell when compared with screening averag es locally and<br />
nationally.<br />
Figure 20: Screening coverage by GP practice<br />
Coverage<br />
90%<br />
85%<br />
80%<br />
75%<br />
70%<br />
65%<br />
60%<br />
55%<br />
50%<br />
45%<br />
40%<br />
Brampton<br />
Medical Pract ice<br />
Warwick Road Surgery<br />
St Paul's Medical Centre<br />
Brunswick House Medical Group<br />
<strong>Carlisle</strong> PBC: Screening covverage<br />
Spencer Street Surgery<br />
Fusehill<br />
Medical Practice<br />
Eden Medical Group<br />
Breast Bowel Cervical<br />
Stanwix Medical Practice<br />
Longto wn Medical Centre<br />
Practice<br />
Grovenor House Surgery<br />
Grosvenor House Surgery<br />
Grosvenor House Surgery<br />
Esk Valley Medical Group<br />
Grosvenor House Surgery<br />
Figure 20 examines screening coverage by GP practi ce. There is a varied picture across the<br />
locality with cervical screening coverage ranging from 69 % to 89% of the target population.<br />
Looking at breast screening, coverage acro ss <strong>Carlisle</strong> ranges from 76% to 90% of target.<br />
Finally bowel screening coverage varies from 51% to 63% o f the targe t populati on.<br />
<strong>Carlisle</strong> <strong>Health</strong> <strong>Improvement</strong> <strong>Plan</strong><br />
J. Clay<br />
16
Figure 21: Progress of spearhead local authorities<br />
With reference to <strong>Carlisle</strong>’s “spearhead” status figures produced by the Department of <strong>Health</strong>,<br />
indicate that <strong>Carlisle</strong> is one of twelve spearhead local authorities that are on track to narrow<br />
the gap in life expectancy. Figure 21 shows the progress spearhead local authorities have<br />
made in narrowing their local life expectancy gap.<br />
<strong>Carlisle</strong> <strong>Health</strong> <strong>Improvement</strong> <strong>Plan</strong><br />
J. Clay<br />
17
What are the main behavioural risk factors resulting in the inequalities gap in life<br />
expectancy and infant mortality?<br />
Figure 22: Behavioural risk factors<br />
There are six main behavioural risk factors that contribute to poor health and health<br />
inequalities: diet, physical exercise, smoking alcohol consumption, teenage pregnancy and<br />
breast feeding. Their impact on health is illustrated in figure 22. These risk factors will be<br />
discussed in the following sections.<br />
Smoking<br />
Smoking is the biggest preventable single cause of preventable illness and death in the UK.<br />
About 90% of lung cancer deaths and 17% of coronary heart disease are attributable to<br />
smoking (ASH, 2007). Smoking during pregnancy is estimated to increase infant mortality by<br />
about 40% (DoH 2007).<br />
Figure 23: Estimated smoking prevalence<br />
Figure 23 takes data from the Joint Strategic Needs Assessment, 2009 report. This shows<br />
that smoking prevalence within <strong>Carlisle</strong> is well above the Cumbria average.<br />
<strong>Carlisle</strong> <strong>Health</strong> <strong>Improvement</strong> <strong>Plan</strong><br />
J. Clay<br />
18
Figure 24: Smoking status by GP practice, June <strong>2010</strong><br />
Smoking status by practice: current smoker<br />
25%<br />
21%<br />
19% 18%<br />
18% 17% 17% 16% 16% 15% 13% 12% 12%<br />
Warwick Road<br />
Brunswick House<br />
Eden Medical<br />
Dr Ward<br />
Drs Adam & Wigmore<br />
St Paul's<br />
Burn Street<br />
Spencer Street<br />
Dr Frost<br />
Dr Ashton<br />
London Road<br />
Stanwix Medical<br />
Brampton Medical<br />
It is difficult to quantify the number of people who smoke. Figure 24 takes data from GP<br />
practice registers. This shows the number of patients aged 16 and over, whose smoking<br />
status has been recorded in the last 15 months with latest status recorded as current smoker.<br />
Smokers ranged from 25% of the register to as low as 12%. Using this methodology over<br />
11,000 current smokers had visited their GP.<br />
Data collected by the Cumbria Stop Smoking Service shows that during the last financial<br />
year, 1,743 residents of <strong>Carlisle</strong> approached the service <strong>for</strong> help with quitting smoking. Of<br />
these over one half successfully quit smoking; just over one third were unsuccessful.<br />
Another source of smoking data is the local tobacco control profiles produced by the<br />
A ssociation of Public <strong>Health</strong> Observatories. Results <strong>for</strong> <strong>Carlisle</strong> are shown in figures 25 and<br />
26.<br />
Figure 25: Local tobacco control profile, part 1<br />
<strong>Carlisle</strong> <strong>Health</strong> <strong>Improvement</strong> <strong>Plan</strong><br />
J. Clay<br />
19
Figure 25: Local tobacco control profile, part 2<br />
<strong>Carlisle</strong> <strong>Health</strong> <strong>Improvement</strong> <strong>Plan</strong><br />
J. Clay<br />
20
Obesity<br />
Obesity is when a person is carrying too much body fat <strong>for</strong> their height and sex. A person is<br />
considered obese if they have a body mass index (BMI) of 30 or greater. In 2008 nearly a<br />
quarter of all adults (16 plus) in England were obese. Just under one third of women, 32%,<br />
were overweight (a BMI of 25-30), and 42% of men were overweight (NHS Choices <strong>2010</strong>).<br />
The number of overweight and obese people is likely to increase. The Foresight (2007)<br />
report, a scientific report used to guide Government policy, has predicted that by 2025, nearly<br />
half of men and over one third of women will be obese. Obesity can cause a number of<br />
health problem, such as type 2 diabetes and heart disease. Being overweight or obese can<br />
also shorten life expectancy,<br />
Figure 26: Patients with Body Mass Index >=30, (January 2009 to March <strong>2010</strong>)<br />
Patients over 16 with BMI of >=30<br />
15.0%<br />
14.0%<br />
11.2% 10.9%<br />
9.8% 9.6% 9.6% 9.1%<br />
7.7%<br />
5.7%<br />
Brunswick<br />
House<br />
Spencer<br />
Street<br />
Brampton<br />
Medical<br />
St Paul's<br />
Medical<br />
Stanwix<br />
Medical<br />
Eden<br />
Medical<br />
Fusehill<br />
Medical<br />
Warwick<br />
Road<br />
Grosvenor<br />
House<br />
Esk Valley<br />
Data taken from the GP QOF (Quality and Outcomes Framework) registers shows a varied<br />
picture across <strong>Carlisle</strong> regarding obesity. Of those patients measured, as many as 15% and<br />
as few as 6% were recorded as obese when viewed at practice level. Looking at <strong>Carlisle</strong> as a<br />
whole this converts to an average of 11%. This is slightly above the county average of<br />
10.5%,<br />
Data taken from the NHS Cumbria Obesity Atlas <strong>2010</strong> examines QOF data in more detail <strong>for</strong><br />
the period 2006/09. This is shown in table 5 . Here data are shown at ward level with a<br />
district and county comparison. The table shows firstly: of those patients who have been<br />
weighed the proportion classified as obese. Secondly of the obese group of patients the<br />
proportion of that group who are also suffering from a long term condition. It must be<br />
remembered that not all of a practices population have been measured. On average 26% of<br />
patients in <strong>Carlisle</strong> had their BMI recorded during the period.<br />
<strong>Carlisle</strong> <strong>Health</strong> <strong>Improvement</strong> <strong>Plan</strong><br />
J. Clay<br />
21
Table 5: Patients recorded with a BMI >=30 and a long term health condition, ward (percentage)<br />
Obese with:<br />
Ward Total Obese Asthma Diabetes COPD CHD Hypertension<br />
Belah 28.8 18.3 17.3 2.7 11.7 48.6<br />
Belle Vue 29.5 14.9 19.3 3.5 11.6 40.6<br />
Botcherby 30.9 18.1 12.9 4.3 14.2 38.6<br />
Brampton 27.3 19.4 14.8 3.8 13.8 42.4<br />
Burgh 25.4 11.3 10.7 2.5 13.2 38.4<br />
Castle 25.0 17.5 16.1 3.9 15.8 37.5<br />
Currock 31.1 18.6 15.3 4.5 9.3 37.5<br />
Dalston 26.9 15.7 14.8 2.4 11.6 41.3<br />
Denton Holme 27.0 18.6 14.3 4.2 15.4 38.2<br />
Great Corby and Geltsdale 20.9 17.9 16.8 3.3 13.0 46.7<br />
Harraby 29.2 17.2 14.3 4.0 13.3 43.5<br />
Hayton 22.3 20.3 17.9 5.3 14.0 45.4<br />
Irthing 25.6 16.7 16.3 3.4 12.3 41.4<br />
Longtown & Rockcliffe 31.9 18.5 23.0 2.3 14.4 41.5<br />
Lyne 26.6 24.5 15.2 5.3 12.6 41.7<br />
Morton 26.9 19.8 21.3 4.4 16.3 51.0<br />
St Aidans 24.8 15.6 13.2 2.2 9.4 35.7<br />
Stanwix Rural 25.7 18.0 14.5 1.3 10.2 45.4<br />
Stanwix Urban 23.7 15.8 13.3 2.0 12.0 46.8<br />
Upperby 31.8 21.7 19.7 5.2 13.8 36.7<br />
Wetheral 22.7 16.4 12.9 2.4 12.4 39.6<br />
Yewdale 28.9 17.4 14.1 3.1 12.3 41.2<br />
<strong>Carlisle</strong> 27.2 17.8 15.8 3.4 12.8 41.8<br />
Cumbria PCT 28.0 18.1 17.5 2.8 12.3 39.8<br />
In addition to in<strong>for</strong>mation from QOF the National Child Measurement Programme (NCMP)<br />
also provides data around young people. Reception year and year 6 pupils are measured. In<br />
Cumbria during 2009/10 of those eligible: 89% of reception year pupils were measured and<br />
86% of pupils in year 6.<br />
Figure 27: Reception year obesity prevalence by district council<br />
NCMP: Reception obesity prevalence 08/09 - 09/10<br />
2008/09 2009/10<br />
14. 2%<br />
9.6% 9.8% 9.6%<br />
9.2%<br />
6.4%<br />
8.0%<br />
12. 5%<br />
8.2%<br />
9.6%<br />
11. 9%<br />
10. 9%<br />
8.0%<br />
7.6%<br />
8.5%<br />
7.3%<br />
England Cumbria Allerdale Barrow-in-<br />
Furness<br />
<strong>Carlisle</strong> Copeland Eden South<br />
Lakeland<br />
<strong>Carlisle</strong> <strong>Health</strong> <strong>Improvement</strong> <strong>Plan</strong><br />
J. Clay<br />
22
Figure 27 shows reception year data <strong>for</strong> 2009/10. Almost 10% of children were recorded as<br />
obese in <strong>Carlisle</strong>. This is an increase on the previous year’s figure of just over 8%. Current<br />
obesity rates are similar to county and national rates.<br />
Figure 28: Year 6 obesity prevalence b y district council<br />
NCMP: Year 6 obesity prevalence 08/09 - 09/10<br />
2008/09 2009/10<br />
19 . 7 %<br />
18 . 7 % 18 . 8 %<br />
18 . 3 %<br />
20.7%<br />
20.0%<br />
21.2% 21.0%<br />
19 . 2 %<br />
18 . 7 %<br />
19 . 6 % 19 . 6 %<br />
19 . 2 % 19 . 3 %<br />
16 . 8 %<br />
15 . 8 %<br />
England Cumbria Allerdale Barrow-in-<br />
Furness<br />
<strong>Carlisle</strong> Copeland Eden South<br />
Lakeland<br />
Figure 28 shows the results <strong>for</strong> yea r 6. Almost<br />
19% of pupils in <strong>Carlisle</strong> are recorded as<br />
being obese. This is in line with national and county averages.<br />
Obesity and nutrition<br />
The Government recommends an intake of at least five portions of fruit or vegetables per<br />
person per day to help reduce the risk of some cancers, heart disease and many other<br />
chronic conditions.<br />
Figure 29: Fruit and vegetable consumption<br />
Figure 29 takes data from the <strong>Health</strong> Survey England. This shows that an estimated 26% of<br />
the population of <strong>Carlisle</strong> reported eating five or more pieces of fruit and vegetables per day.<br />
This is slightly worse than the Cumbria average of 28%.<br />
Obesity and Physical activity<br />
Adults who are physically active have a 20-30% reduced risk of premature death (DoH 2004).<br />
Physical activity has an effect on cardiovascular risk, it reduces the risk of some cancers such<br />
as colorectal cancer, and it reduces the incidence of falls and osteoporosis in the elderly, and<br />
has been shown to reduce depression, stress and anxiety (DoH 2004).<br />
The National Indicator, N18 measures the percentage of the adult population (age 16 years<br />
and over) in a local area who participate in sport and active recreation, at moderate intensity,<br />
<strong>Carlisle</strong> <strong>Health</strong> <strong>Improvement</strong> <strong>Plan</strong><br />
J. Clay<br />
23
<strong>for</strong> at least 30 minutes on at least 12 days out of the last 4 weeks (equivalent to 30 minutes<br />
on 3 or more days a week). Figures taken from Sport England show that just over 20% of the<br />
adult population of <strong>Carlisle</strong> participate in some <strong>for</strong>m of physical activity. This is below the<br />
Cumbria average of 22%.<br />
Mental <strong>Health</strong><br />
Mental well-being is as important as physical health if people are to live their lives to the full.<br />
Mental ill-health is common with one in four people experiencing a mental health problem at<br />
some point in their life. Ten percent of children have a mental health problem.<br />
Table 6: Selected mental health indicators<br />
Indicator<br />
Number<br />
Estimated number of people with a common mental disorder 9,900<br />
Estimated number of people age over 65 with dementia 1,300<br />
Estimated number of adults (16+) who have engaged in deliberate self ham in 2,920-3,200<br />
their lifetime<br />
Admissions to hospital <strong>for</strong> self harm 250<br />
Attendances at A&E departments in a year <strong>for</strong> self harm 520<br />
Average number of suicides each year 13<br />
T he recent Mental <strong>Health</strong> Joint Strategic Needs Assessment: Adults report (NHS Cumbria<br />
<strong>2010</strong>) provides valuable in<strong>for</strong>mation on the mental health of the local community. Data taken<br />
from this report are shown in table 6. This shows a selection of mental health problems<br />
experienced by the residents of <strong>Carlisle</strong>.<br />
Figure 30: Trend <strong>for</strong> suicide and injury undetermined, persons<br />
20.0<br />
18.0<br />
16.0<br />
14.0<br />
12.0<br />
10.0<br />
8.0<br />
6.0<br />
4.0<br />
Suicide & injury undetermined, DSR<br />
1995 1996 1997 1998 1999 2000 2001 2002 2003 2004 2005 2006 2007 2008<br />
6.06<br />
England Cumbria <strong>Carlisle</strong> DC<br />
Looking at a more specific area of mental health, namely suicides; figure 30 shows the trend<br />
in <strong>Carlisle</strong>. This compares the local directly standardised rate (DSR) with the county and<br />
national rate. On the whole the suicide rate <strong>for</strong> <strong>Carlisle</strong> tends to be above the national and<br />
county level. However 2008 saw a dramatic drop in the rate to 6 deaths per 100,000<br />
population (6 deaths). Latest figures <strong>for</strong> 2009 show that the numbers of suicides has<br />
increased to 13 deaths.<br />
<strong>Carlisle</strong> <strong>Health</strong> <strong>Improvement</strong> <strong>Plan</strong><br />
J. Clay<br />
24
Figure 31: Suicide and injury undetermined, 2006-08<br />
DSR:suicides & injury undetermined 2006-08<br />
15.5 11.3 10.9 9.9 8.2 6.6 5.3 7.8<br />
Copeland <strong>Carlisle</strong> Allerdale Cumbria South<br />
Lakeland<br />
Eden<br />
Barrow-in-<br />
Furness<br />
England<br />
To smooth out the peaks and troughs in annual statistics figure 31 compares the three year<br />
average f or suicides. With a rate of 11.3 suicides <strong>for</strong> every 100,000 people , <strong>Carlisle</strong> is above<br />
the county and national average.<br />
Alcohol<br />
High levels of alcohol consumption will increase the risk of several cancers (liver, oral,<br />
pharynx and oesophagus), liver cirrhosis and circulatory disease. Alcohol consumption also<br />
has an impact on accidents, violent incidents and mental health disorders.<br />
Figure 32 takes data from the Local Alcohol <strong>Profile</strong>s <strong>for</strong> England <strong>2010</strong> and show that <strong>Carlisle</strong><br />
is significantly worse than average <strong>for</strong> the following:<br />
• Alcohol specific hospital admissions - under 18 years<br />
• Alcohol specific hospital admissions - males<br />
• Hospital admissions <strong>for</strong> alcohol related harm<br />
• Alcohol-attributable violent crime<br />
• Claimants on incapacity benefit – working age<br />
• Mortality from land transport accidents<br />
<strong>Carlisle</strong> <strong>Health</strong> <strong>Improvement</strong> <strong>Plan</strong><br />
J. Clay<br />
25
Figure 32: Local alcohol profile, <strong>Carlisle</strong><br />
<strong>Carlisle</strong> <strong>Health</strong> <strong>Improvement</strong> <strong>Plan</strong><br />
J. Clay<br />
26
Figure 33: Hospital admissions <strong>for</strong> wholly attributable alcohol related conditions<br />
Rate/1,000<br />
7.0<br />
6.0<br />
5.0<br />
4.0<br />
3.0<br />
2.0<br />
1.0<br />
0.0<br />
65 Warwick Road<br />
Brunswick House Medical<br />
Patients admitted to hospital with a wholly attributable alcohol related<br />
condition<br />
Grosvenor House (Frost)<br />
St Paul's Medical<br />
Eden Medical Group<br />
Fusehill Medical Practice<br />
Grosvenor House (Adam)<br />
Grosvenor House (Ashton)<br />
Grosvenor House (Ward)<br />
Spencer Street Surgery<br />
Stanwix Medical Practice<br />
Brampton Medical<br />
Cumbria<br />
Esk Valley Medical<br />
Alcohol related health problems can be divided into tow groups: those conditions that are<br />
wholly attributable to alcohol and those that are partially attributable to alcohol. Figure 33<br />
takes data from the report: NHS Cumbria: Hospital admissions <strong>for</strong> alcohol specific conditions,<br />
2009. Concentrating on wholly attributable conditions the chart shows hospital admission rate<br />
<strong>for</strong> patients registered with GPs in <strong>Carlisle</strong>. The chart clearly shows those practices above<br />
the Cumbria average rate of 2.6 patients per 1,000 practice population aged over ten years.<br />
Chlamydia<br />
Chlamydia is a sexually transmitted infection (STI) caused by the bacterium chlamydia<br />
trachomatis. In the UK, the numbers of diagnoses of the infection have been steadily<br />
increasing each year since the mid 1990’s, and it has now become the most commonly<br />
diagnosed STI. Chlamydia is called the “silent” disease because most people who get it do<br />
not experience any noticeable symptoms.<br />
Table 7: Chlamydia screening<br />
Chlamydia 2009/10 Cumbria England<br />
Chlamydia tests reported to the National Chlamydia Screening Programme<br />
8,944<br />
(NCSP)<br />
Laboratory reports of chlamydia tests not reported directly to NCSP 2682<br />
Total test 11,626<br />
Resulting positive tests 739<br />
% young people testing positive 6.4% 6.0%<br />
Target population aged 15 -24 years 58,100<br />
% population tested 20.0% 22.1%<br />
Young people under 25 are more likely to be infected. A national screening programme has<br />
been established to test this age group. Not all tests are reported through the national<br />
screening programme. Tests generated in GP surgeries are processed directly by the<br />
laboratories and not reported to the local screening programme. A national target to test 25%<br />
of the population by the end of 2009/10 was set. Due to the nature of how the data are<br />
collected it is not possible to produce an accurate picture of local coverage. However<br />
Cumbria achieved coverage of 20% compared with 22% <strong>for</strong> England; both below target, see<br />
table 7.<br />
<strong>Carlisle</strong> <strong>Health</strong> <strong>Improvement</strong> <strong>Plan</strong><br />
J. Clay<br />
27
Teenage pregnancy<br />
Teenage pregnancy is thought to have various effects on the health and socio-economic<br />
position of both mother and baby. Teenage mothers tend to end up being poorer, having<br />
lower educational attainment and worse mental health as compared to other women from<br />
similar backgrounds (<strong>Health</strong> Development Agency 2004).<br />
Figure 34: Trend in teenage pregnancy (below 18 years of age)<br />
55.0<br />
Teenage pregnancy rate/1,000 women (15-17 yrs)<br />
England Cumbria <strong>Carlisle</strong><br />
50.0<br />
45.0<br />
40.0<br />
35.0<br />
1998-00 2001-03 2004-06 2005-07 2006-08<br />
Teenage pregnancy rates in <strong>Carlisle</strong> continue to be above the county and national rates, as<br />
shown in figure 34. Currently in <strong>Carlisle</strong> there are 51 conceptions <strong>for</strong> every 1,000 women<br />
aged 15 to 17 years. Not all women chose to continue with the pregnancy as 54% terminated<br />
the pregnancy. This is above the county and national rate of 50%.<br />
Breastfeeding<br />
Evidence suggests that breastfeeding <strong>for</strong> at least the first six months of a baby’s life provides<br />
significant benefits <strong>for</strong> both the mother and baby. These benefits include: reducing the risk of<br />
developing diabetes in childhood, fewer respiratory tract infections, middle-ear infections and<br />
gastroenteritis. Babies are also less likely to develop allergies, such as asthma and eczema<br />
if they have bee breast fed.<br />
Figure 35: Breast feeding initiation rates<br />
Breast feeding initiation rates<br />
(Source: Vital Signs DoH)<br />
Cumb<br />
England<br />
ria<br />
72.7% 73.1% 72.6% 72.7% 73.<br />
4%<br />
69.7% 69.2%<br />
65.5%<br />
69.0%<br />
66.9%<br />
2009/10 Q1 2009/10 Q2 2009/10 Q3 2009/10 Q4 <strong>2010</strong>/11 Q1<br />
Breast feeding initiation rates in Cumbria continue to be below the national average, see<br />
figure 35. Currently in Cumbria 67% of new babies are breast fed. Once the baby has gone<br />
home breast feeding status is recorded at 6-8 weeks of age. By this stage breast feeding<br />
rates in Cumbria have fallen to 31% compared to 48 nationally.<br />
<strong>Carlisle</strong> <strong>Health</strong> <strong>Improvement</strong> <strong>Plan</strong><br />
J. Clay<br />
28
Figure 36: Prevalence of breast feeding at 6-8 weeks, locality<br />
Prevelance breast feeding 6-8 weeks<br />
as at quarter 2, <strong>2010</strong>/11<br />
47%<br />
29%<br />
32%<br />
29%<br />
28%<br />
18%<br />
20%<br />
Allerdale<br />
Barrow in<br />
Furness<br />
<strong>Carlisle</strong> Copeland Eden South<br />
Lakes<br />
Cumbria<br />
Breast feeding prevalence data at 6 to 8 weeks are shown in figures 36 and 37 . Latest<br />
figures (quarter 2, <strong>2010</strong>/11) prevalence of 32% in <strong>Carlisle</strong>. This is above the Cumbria<br />
average of 28%. Figure 37 breaks this figure down by GP practice. A wide variation is<br />
shown at this level, ranging from 21% to 28% of mothers still breast feeding their babies at<br />
six to eight weeks.<br />
Figure 37: Prevalence of breast feeding at 6-8 weeks, GP practice<br />
Prevalence breast feeding 6-8 weeks<br />
as at quarter 2, <strong>2010</strong>/11<br />
48%<br />
21%<br />
24%<br />
29% 29%<br />
30% 30%<br />
33%<br />
38%<br />
40%<br />
Brunswick House Surgery<br />
Warwick Road Surgery<br />
St Paul's Practice<br />
Esk Valley Medical Group<br />
Grosvenor House<br />
Eden Medical Group<br />
Spencer Street Surgery<br />
Fusehill Medical Practice<br />
Stanwix Medical Practice<br />
Brampton Medical Practice<br />
<strong>Carlisle</strong> <strong>Health</strong> <strong>Improvement</strong> <strong>Plan</strong><br />
J. Clay<br />
29
Wider determinants of health<br />
It is important to remember that behavioural factors are not the only influences on health.<br />
Social and economic circumstances affect how people behave and consequently their health.<br />
Work, unemployment and incapacity<br />
Being in good employment is protective of health. Conversely, unemployment contributes to<br />
poor health. Getting people back into employment is crucial <strong>for</strong> reducing health inequalities.<br />
However, jobs need to be sustainable and offer a minimum level of quality that not only<br />
includes a decent living wage but also the opportunities <strong>for</strong> in-work development.<br />
Figures <strong>for</strong> 2009/10 showed that in <strong>Carlisle</strong> 81.6% of the population (16 to 64 years) were<br />
economically active. This is above the national average <strong>for</strong> Great Britain of 76.5%. The<br />
unemployment rate was 6.1% in <strong>Carlisle</strong> compared with 7.9% nationally.<br />
During 2009 in <strong>Carlisle</strong>, full-time gross weekly pay was £414. This is below regional and<br />
national rates of £460 and £491 respectively.<br />
Table 8: Benefit claimants<br />
Working age key benefit claimants (February <strong>2010</strong>)<br />
<strong>Carlisle</strong><br />
GB<br />
Number<br />
Total claimants 9,830 14.5% 15.1%<br />
Job seekers 2,050 3.0% 3.9%<br />
ESA & incapacity benefits 4,970 7.4% 6.7%<br />
Lone parents 950 1.4% 1.8%<br />
Carers 730 1.1% 1.1%<br />
Others on income related benefits 270 0.4% 0.5%<br />
Disabled 690 1.0% 1.0%<br />
Bereaved 160 0.2% 0.2%<br />
Source: nomisweb.co.uk<br />
In terms of benefit claimants, <strong>Carlisle</strong> compares favourably with the national average <strong>for</strong> a<br />
range of benefits, see table 8. In total 14.5% of the working age population in <strong>Carlisle</strong> claim<br />
benefits, this is just below the national rate of 15.1%. The employment and support<br />
allowance (ESA) has replaced incapacity benefit and income support. In <strong>Carlisle</strong> 7.4% of the<br />
working age population claim this allowance, this is above the national average of 6.7%.<br />
Fuel Poverty<br />
The number of extra deaths occurring in winter varies depending on temperature, the level of<br />
disease in the population and other factors. These deaths may be partially attributed to the<br />
fact that many people cannot af<strong>for</strong>d to adequately heat their homes (National Energy Action,<br />
2009). A household is said to be in fuel poverty if it needs to spend more than 10% of its<br />
income on fuel to maintain a satisfactory heating regime (usually 21 degrees <strong>for</strong> the main<br />
living area and 18 degrees <strong>for</strong> other occupied rooms). Fuel poverty is caused by the<br />
interaction of a number of factors, but three specifically stand out. These are: energy<br />
efficiency status of the property, cost of energy and household income.<br />
<strong>Carlisle</strong> <strong>Health</strong> <strong>Improvement</strong> <strong>Plan</strong><br />
J. Clay<br />
30
Figure 38: Fuel poverty<br />
Figure 36 illustrates data supplied by the Centre <strong>for</strong> Sustainable Energy<br />
(fuelpovertyindicator.co.uk) at lower super output area level. This shows a varied picture<br />
across the county. The areas shown in the darker shade of red are those households<br />
experiencing the highest rates of fuel poverty.<br />
Excess winter death<br />
There are higher levels of mortality in the winter than in the summer. Excess deaths are<br />
measured by the “excess winter mortality index”. The excess winter mortality (EWM) index is<br />
calculated as excess winter deaths divided by the average non-winter deaths, expressed as a<br />
percentage.<br />
Figure 39: Excess winter deaths<br />
Excess winter deaths (%)<br />
(2009/10 data are provisional)<br />
<strong>Carlisle</strong> Cumbria E&W<br />
16 14 16 18 17 15 22 14 16 19 19 24 6 11 17<br />
2005/06 2006/07 2007/08 2008/09 2009/10<br />
The elderly are more vulnerable than others during the winter. Policies such as “winter fuel<br />
payment” and influenza vaccinations are particularly focussed on older people. Although<br />
EWM is associated with low temperatures, conditions directly relating to cold, such as<br />
hypothermia, are not the main cause of excess winter mortality. The majority of additional<br />
<strong>Carlisle</strong> <strong>Health</strong> <strong>Improvement</strong> <strong>Plan</strong><br />
J. Clay<br />
31
winter deaths are caused by cerebrovascular diseases, ischaemic heart disease and<br />
respiratory diseases (ONS <strong>2010</strong>). As shown in figure 39 the EWM index peaked in <strong>Carlisle</strong><br />
at 22% during the winter of 2007/08. This has now decreased to 6% <strong>for</strong> 2009/10 (provisional<br />
figures).<br />
Child Poverty<br />
The goal to end child poverty by 2020 was set out in the Child Poverty Act. Children are said<br />
to be living in relative income poverty of their household’s income is less than 60% of the<br />
median national income. Using this measure, there are currently 2.8million children living in<br />
poverty in this country. Children and young people living in poverty face a greater risk of poor<br />
health, more accidents, exposure to crime and failing to reach their full potential.<br />
Table 9: Child poverty<br />
% of Children in "Poverty"<br />
Under 16<br />
All Children<br />
England 21.6% 20.9%<br />
Cumbria 15.7% 15.1%<br />
<strong>Carlisle</strong> 16.7% 16.0%<br />
Belah 9.9% 9.6%<br />
Belle Vue 25.4% 24.8%<br />
Botcherby 33.8% 32.5%<br />
Brampton 14.2% 12.9%<br />
Burgh 6.3% 6.5%<br />
Castle 31.3% 28.7%<br />
Currock 23.8% 23.4%<br />
Dalston 6.4% 6.1%<br />
Denton Holme 23.3% 22.3%<br />
Great Corby and Geltsdale 3.4% 3.8%<br />
Harraby 17.0% 16.0%<br />
Hayton 7.8% 7.0%<br />
Irthing 7.1% 7.3%<br />
Longtown & Rockcliffe 9.5% 9.3%<br />
Lyne 9.3% 9.3%<br />
Morton 15.5% 15.0%<br />
St Aidans 21.8% 21.1%<br />
Stanwix Rural 4.2% 4.2%<br />
Stanwix Urban 4.3% 4.2%<br />
Upperby 30.3% 29.7%<br />
Wetheral 2.8% 3.1%<br />
Yewdale 8.7% 9.0%<br />
Source:http://www.hmrc.gov.uk/stats/personal-tax-credits/child_poverty.htm<br />
Data supplied by HM Revenues & Customs shows that around 16% of child in <strong>Carlisle</strong> are<br />
living in poverty, see table 9. This is slightly above the Cumbria average of 15% but below<br />
the national average of 21%. However when this data is broken down to ward level parts of<br />
the district exceed the national rate. The ward of Botcherby has a third of its children<br />
growing up in poverty: compare this with Wetheral ward where only 3% of children are living<br />
in poverty.<br />
<strong>Carlisle</strong> <strong>Health</strong> <strong>Improvement</strong> <strong>Plan</strong><br />
J. Clay<br />
32
Tackling child poverty will lead to reductions in levels of obesity and higher levels of<br />
educational attainment.<br />
Educational attainment<br />
As a result of child poverty, a child’s education suffers. This makes it difficult <strong>for</strong> them to get<br />
the qualifications they need they need to move on to sustainable, well-paid jobs. This limits<br />
their potential to earn the money needed to support their own families in later life, and so a<br />
cycle of poverty is created.<br />
Figure 40: Educational attainment, 2009/10<br />
Educational attainment, 2009/10<br />
England Cumbria <strong>Carlisle</strong><br />
84%<br />
86% 84% 81% 83%<br />
83%<br />
89%<br />
91%<br />
90% 88% 91% 90%<br />
72% 74%<br />
69%<br />
50% 52%<br />
50%<br />
KS1 Reading KS1 Writing KS1 Maths KS2 English & KS2 Science 5 A*-C GCSE' s<br />
maths<br />
Data provided by the County Council <strong>for</strong> 2009/10, figure 40 , shows <strong>Carlisle</strong> compares<br />
favourably with national averages. In all but KS2 English and maths, exams results equal of<br />
exceed those of the national rates. However when compared to county levels, <strong>Carlisle</strong><br />
results are just below those <strong>for</strong> all stages in Cumbria.<br />
Looking to the working population of <strong>Carlisle</strong>, 11.3% (7,300) have no qualifications, this<br />
compares with 12.3% nationally, (NOMIS).<br />
Household Income<br />
Figure 41: Mean household income by district<br />
Mean household income <strong>2010</strong><br />
Source: Cumbria County Council, CACI paycheck data<br />
National average = £35,299<br />
33,338 32,063 31,810 31,696 31,410 30,818 28,013<br />
South<br />
Lakeland<br />
Eden Copeland <strong>Carlisle</strong> Cumbria Allerdale Barrow in<br />
Furness<br />
<strong>Carlisle</strong> <strong>Health</strong> <strong>Improvement</strong> <strong>Plan</strong><br />
J. Clay<br />
33
Figure 41 shows the gross mean household income <strong>for</strong> Cumbria and its six constituent<br />
district councils. All are below the national average income of £35,299. Overall the average<br />
income within <strong>Carlisle</strong> district (£31,696) is just above the county average but below that of<br />
South Lakeland, Eden and Copeland.<br />
Figure 42: Mean household income by district<br />
<strong>Carlisle</strong> wards: mean household income <strong>2010</strong><br />
Source: Cumbria County Council, CACI paycheck data<br />
<strong>Carlisle</strong> average = £31,696<br />
44,302<br />
42,938<br />
40,648<br />
40,176<br />
40,161<br />
39,934<br />
39,135<br />
37,970<br />
37,229<br />
34,488<br />
34,018<br />
33,205<br />
30,598<br />
30,149<br />
29,294<br />
28,161<br />
27,431<br />
26,834<br />
26,434<br />
25,168<br />
23,991<br />
22,609<br />
Wetheral<br />
Stanwix Rural<br />
Great Corby & Geltsdale<br />
Hayton<br />
Burgh<br />
Denton Holme<br />
Dalston<br />
Stanwix Urban<br />
Irthing<br />
Belah<br />
Yewdale<br />
Lyne<br />
Belle Vue<br />
Harraby<br />
Brampton<br />
Longtown & Rockcliffe<br />
St Aidans<br />
Castle<br />
Currock<br />
Botcherby<br />
Morton<br />
Upperby<br />
Figure 42 views the data at ward level shows the wide disparity in household income. Just<br />
over half (12) of <strong>Carlisle</strong>’s wards have an average income that exceeds the district average.<br />
Incomes within the ward of Wetheral are almost double those of Upperby.<br />
Conclusion<br />
This document provides an assessment of the current health of the population of <strong>Carlisle</strong>. It’s<br />
content provides commissioners and partner agencies with an opportunity to address the<br />
health inequalities within the locality.<br />
<strong>Carlisle</strong> <strong>Health</strong> <strong>Improvement</strong> <strong>Plan</strong><br />
J. Clay<br />
34
Contact details:<br />
Name: Jennifer Clay<br />
Title: Public <strong>Health</strong> Intelligence Analyst<br />
Address: NHS Cumbria, 4 Wavell Drive, Rosehill, <strong>Carlisle</strong>, Cumbria CA1 2SE<br />
Tel: 01228 603988<br />
Email: jennifer.clay@cumbriapct.nchs.uk<br />
Web:<br />
www.cumbria.nhs.uk<br />
www.cumbriaobservatory.org.uk<br />
October <strong>2010</strong><br />
<strong>Carlisle</strong> <strong>Health</strong> <strong>Improvement</strong> <strong>Plan</strong><br />
J. Clay<br />
35