Ward Profile: Yewdale
Ward Profile: Yewdale
Ward Profile: Yewdale

Create successful ePaper yourself
Turn your PDF publications into a flip-book with our unique Google optimized e-Paper software.
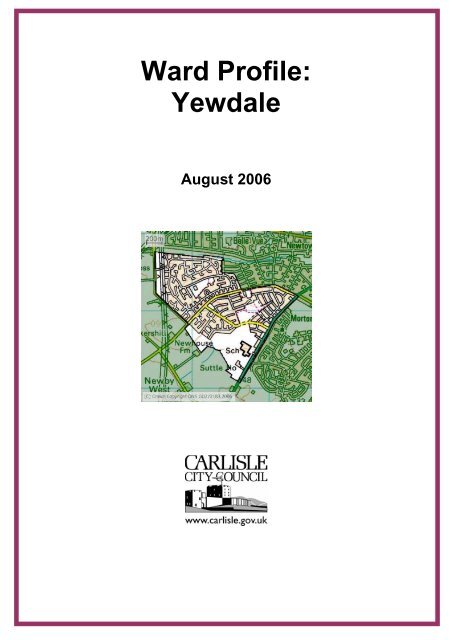
<strong>Ward</strong> <strong>Profile</strong>:<strong>Yewdale</strong>August 2006
<strong>Yewdale</strong> <strong>Ward</strong> <strong>Profile</strong>1. Demographics1.1 Resident Population<strong>Ward</strong> <strong>Yewdale</strong> Carlisle Cumbria North West England0-14 1,044 17,709 85,656 1,300,298 9,277,81415-29 977 17,536 77,704 1,241,465 9,253,98330-44 1,293 22,164 105,654 1,486,588 11,127,51145-59 1,465 19,897 101,097 1,282,607 9,279,69360-74 818 15,088 76,003 920,920 6,494,67175+ 366 8,345 41,493 497,886 3,705,159Total 5,963 100,739 487,607 6,729,764 49,138,831<strong>Ward</strong> <strong>Yewdale</strong> Carlisle Cumbria North West England0-14 18% 18% 18% 19% 19%15-29 16% 17% 16% 18% 19%30-44 22% 22% 22% 22% 23%45-59 25% 20% 21% 19% 19%60-74 14% 15% 16% 14% 13%75+ 6% 8% 9% 7% 8%Total 100% 100% 100% 100% 100%Source: Census 20011.2 ACORN (A Classification of Residential Neighbourhoods)1.3 Index of Multiple Deprivation ScoreIMD ScoreNational Rank(Out of 7976)Cumbria Rank(Out of 168)Carlisle Rank(Out of 22)13.71 4202 108 15For the above ranking system Rank 1 is the most deprived.3
<strong>Yewdale</strong> <strong>Ward</strong> <strong>Profile</strong>2 Local Knowledge OverviewComparison Report CardDistrict Sub Region Region NationalEconomyIndustrial structure C C C CBusiness density E E E ESkills & qualifications D D D ELabour market A A A ASocietyKnowledge workers D D D EProsperity B B B CDeprivation B B B CInequality E E D EHealth B D B CCrime C D C CEnvironmentHousing affordability B A A ACommercial and Industrial floorspaceSustainable transport D C C CAccess to services B A B BSource: www.localknowledge.co.ukAn ‘A’ grade indicates that the area is within the top 20%, while an ‘E’ grade indicates that it isin the bottom 20%. Please note that the scores for Deprivation, Inequality and Crime havebeen inversed to ensure an A grade on any indicator is always a positive result.DefinitionsReport Card TitleEconomyIndustrial StructureBusiness densitySkills & qualificationsLabour marketSocietyKnowledge workersProsperityDeprivationInequalityHealthCrimeEnvironmentHousing affordabilityCommercial & industrial floorspaceSustainable transportAccess servicesDefinitionProportion of employment in Knowledge-driven sectorsBusinesses per 000 populationLocal Future Group skills and qualifications composite, consisting of aweighted average of the working age population qualified to NVQ 1-4Working age population in employment (residence based)Proportion of Managerial, Professional & Technical occupations('Knowledge Workers') amongst employed workforce (residence based)Average total incomeIndex of Multiple Deprivation: average of SOA scoresInequality (range of IMD ranks)Average life expectancyTotal number of offences per 1,000 resident populationHousing affordability index, calculated by dividing average house priceswith average earningsShare of sub-region floorspaceProportion of person travelling to work on foot or by bicycleLocal Futures Group access to services composite, creating by addingthe number of households within 2 Kilometres to key services such asschools, job centres, banks, doctors and supermarkets4
<strong>Yewdale</strong> <strong>Ward</strong> <strong>Profile</strong>3 Community Safety3.1 Local Knowledge Report Score for CrimeDistrict Sub Region Region NationalCrime C D C CSource: www.localknowledge.co.ukPlease see page 4 for definitions.An ‘A’ grade indicates that the area is within the top 20%, while an ‘E’ grade indicates that it isin the bottom 20%. To create a profile of any Report Card theme, click on the indicator title onthe left-hand side. Please note that the scores for Deprivation, Inequality and Crime havebeen inversed to ensure an A grade on any indicator is always a positive result.3.2 Index of Multiple Deprivation Scores for CrimeNational Rank(Out of 7976)Cumbria Rank(Out of 168)Carlisle Rank(Out of 22)4244 45 13For the above ranking system Rank 1 is the highest level of Crime3.3 Counts of Crimes (Date Range Financial year 05/06)Source: Cumbria Police5
<strong>Yewdale</strong> <strong>Ward</strong> <strong>Profile</strong>3.4 Count of Police IncidentsSource: Cumbria Police6
<strong>Yewdale</strong> <strong>Ward</strong> <strong>Profile</strong>4 Economic Prosperity4.1 Local Knowledge Report Card for EconomyDistrict Sub Region Region NationalEconomyIndustrial structure C C C CBusiness density E E E ESkills & qualifications D D D ELabour market A A A ASource: www.localknowledge.co.ukPlease see page 4 for definitions.An ‘A’ grade indicates that the area is within the top 20%, while an ‘E’ grade indicates that it isin the bottom 20%. To create a profile of any Report Card theme, click on the indicator title onthe left-hand side. Please note that the scores for Deprivation, Inequality and Crime havebeen inversed to ensure an A grade on any indicator is always a positive result.4.2 Index of Multiple Deprivation Scores for EconomyIncome RankNational(Out of 7976)IncomeRanksCumbria(Out of 168)IncomeRanksCarlisle(Out of 22)EmploymentRanksNational(Out of 7976)EmploymentRanksCumbria(Out of 168)EmploymentRanksCarlisle(Out of 22)4905 84 13 2788 70 12For the above ranking system Rank 1 is the poorest employment level and the poorestincome level.4.3 Economic Active ResidentsPercentages are based on working age population, except unemployed which is based on economically active.<strong>Yewdale</strong> <strong>Yewdale</strong> Carlisle GB(numbers) (%) (%) (%)All peopleEconomically active 3,188 83.1 79.3 76In employment 3,050 79.5 74.7 71.6Employees 2,835 73.9 65.6 62.6Self employed 215 5.6 9.1 9Unemployed 138 4.3 5.8 5.8MalesEconomically active 1,706 86.8 83.1 81.4In employment 1,607 81.8 77.7 76Employees 1,450 73.8 64.8 63.1Self employed 157 8 12.9 12.9Unemployed 99 5.8 6.5 6.5FemalesEconomically active 1,482 79.1 75.1 70.3Employment 1,443 77 71.5 66.9Employees 1,385 73.9 66.4 62.1Self employed 58 3.1 5 4.8Unemployed 39 2.6 4.9 4.8Source: 2001 Census of Population (Table CAS028 - Sex and Age by Economic Activity)7
<strong>Yewdale</strong> <strong>Ward</strong> <strong>Profile</strong>4.4 Economic Inactive ResidentsPercentages are based on working age population.<strong>Yewdale</strong> <strong>Yewdale</strong> Carlisle GB(numbers) (%) (%) (%)All peopleEconomically inactive 650 16.9 20.7 24Retired 90 2.3 2.5 2.2Student 107 2.8 3.7 5.5Other 453 11.8 14.6 16.3MalesEconomically inactive 259 13.2 16.9 18.6Retired 62 3.2 3.4 3Student 50 2.5 3.4 5.3Other 147 7.5 10.1 10.4FemalesEconomically inactive 391 20.9 24.9 29.7Retired 28 1.5 1.5 1.4Student 57 3 4 5.7Other 306 16.3 19.4 22.6Source: 2001 Census of Population (Table CAS028 - Sex and Age by Economic Activity)4.5 Employment by OccupationFigures are for working age by Soc 2000 major groups. Percentages are based on all persons in employment.<strong>Yewdale</strong> <strong>Yewdale</strong> Carlisle GB(numbers) (%) (%) (%)1 Managers and senior officials 321 10.5 12.2 14.92 Professional 172 5.6 7.6 11.23 Associate professional & technical 344 11.3 11.5 13.94 Administrative & secretarial 421 13.8 11.7 13.25 Skilled trades 381 12.5 13.5 11.86 Personal services 202 6.6 6.8 6.97 Sales and customer services 356 11.7 9 7.78 Process plant and machine operatives 449 14.7 13.3 8.79 Elementary occupations 404 13.2 14.3 11.8Source: 2001 Census of Population (Table CAS033 - Sex and Occupation by Age)8
<strong>Yewdale</strong> <strong>Ward</strong> <strong>Profile</strong>4.6 Residents Claiming Job Seekers Allowance (JSA) benefitsThe percentage figures show the number of JSA claimants as a proportion of resident working-age people.<strong>Yewdale</strong> <strong>Yewdale</strong> Carlisle GB(numbers) (%) (%) (%)All people 56 1.5 2.2 2.6Males 43 2.2 3.3 3.6Females 13 0.7 1.1 1.4Source: claimant count with rates and proportions (July 2006)JSA claimants by age and durationThe percentage figures represent the number of JSA claimants in a particular category as a percentage of all JSAclaimants.<strong>Yewdale</strong> <strong>Yewdale</strong> Carlisle GB(numbers) (%) (%) (%)by age of claimantAged 18-24 15 23.2 31.9 30.3Aged 25-49 35 58.9 50.9 52.4Aged 50 and over 10 17.9 16.1 16.1by duration of claimUp to 6 months 40 71.4 65.4 63.8Over 6 up to 12 months 10 16.1 19.7 20.2Over 12 months 5 12.5 14.9 16Source: claimant count - age and duration (July 2006)9
<strong>Yewdale</strong> <strong>Ward</strong> <strong>Profile</strong>5 Infrastructure, Environmentand Transport5.1 Local Knowledge Report Card Comparison forInfrastructure, Environment and TransportDistrict Sub Region Region NationalEnvironmentHousing affordability B A A ACommercial and Industrial floorspaceSustainable transport D C C CAccess to services B A B BSource: www.localknowledge.co.ukPlease see page 4 for definitions.An ‘A’ grade indicates that the area is within the top 20%, while an ‘E’ grade indicates that it isin the bottom 20%. To create a profile of any Report Card theme, click on the indicator title onthe left-hand side. Please note that the scores for Deprivation, Inequality and Crime havebeen inversed to ensure an A grade on any indicator is always a positive result.5.2 Index of Multiple Deprivation Scores for Accessibility ofServicesNational Rank(Out of 7976)Cumbria Rank(Out of 168)Carlisle Rank(Out of 22)7354 138 12For the above ranking system Rank 1 is the least accessible ward for services.5.3 Census 2001 Travel to Work dataAll people aged 16-74 in employment<strong>Yewdale</strong> Carlisle Cumbria North WestEnglandand WalesAll people aged 16-74 in employment 3110 46858 219908 2900020 23627754People who work mainly at or from home 6% 10% 12% 8% 9%People aged 16 - 74 in employment who usually travel to workby: Underground; metro; light rail; Tram 0% 0% 0% 1% 3%People aged 16 - 74 who usually travel to work by: Train 0% 0% 1% 2% 4%People aged 16 - 74 who usually travel to work by: Bus; MiniBus or coach 14% 9% 5% 9% 7%People aged 16 - 74 who usually travel to work by: Motorcycle;Scooter; moped 1% 1% 1% 1% 1%People aged 16 - 74 who usually travel to work by: Driving a caror van 59% 54% 55% 58% 55%People aged 16 - 74 who usually travel to work by: Passenger ina car or van 8% 7% 8% 8% 6%People aged 16 - 74 who travel to work by:Taxi or minicab 0% 0% 0% 1% 1%People aged 16 - 74 who usually travel to work by: Bicycle 4% 3% 3% 2% 3%People aged 16 - 74 who usually travel to work by: On foot 7% 15% 14% 10% 10%People aged 16 - 74 who usually travel to work by: Other 0% 0% 1% 0% 0%Average distance (km) travelled to fixed place of work 0% 0% 0% 0% 0%Public transport users in households With car or van 12% 6% 4% 7% 10%Public transport users in households Without car or van 3% 3% 2% 4% 4%Source: Census 200110
<strong>Yewdale</strong> <strong>Ward</strong> <strong>Profile</strong>5.4 Table to show the General Land Use.Land Use <strong>Yewdale</strong> Carlisle Total Cumbria North West England TotalDomestic_Buildings_m2 11% 0% 0% 1% 1%Gardens_m2 34% 1% 1% 4% 4%Non_Domestic_Buildigs_m2 1% 0% 0% 1% 1%Road_m2 14% 1% 1% 3% 2%Rail_m2 0% 0% 0% 0% 0%Path_m2 1% 0% 0% 0% 0%Greenspace_m2 37% 95% 92% 84% 88%Water_m2 0% 1% 5% 5% 2%Other_m2 2% 1% 0% 2% 1%Unclassified_m2 0% 0% 0% 0% 0%Total_m2 1,547,619 1,040,467,623 7,095,324,774 14,680,742,126 131,926,495,360Source: ODPM General Land Use Database 2001Note: Percentages are rounded to no decimal places so 0% may be figures between 0.0%and 0.49%11
<strong>Yewdale</strong> <strong>Ward</strong> <strong>Profile</strong>6 Housing6.1 Local Knowledge Report Card Comparison for HousingDistrict Sub Region Region NationalHousing affordability B A A ASource: www.localknowledge.co.ukPlease see page 4 for definitions.An ‘A’ grade indicates that the area is within the top 20%, while an ‘E’ grade indicates that it isin the bottom 20%. To create a profile of any Report Card theme, click on the indicator title onthe left-hand side. Please note that the scores for Deprivation, Inequality and Crime havebeen inversed to ensure an A grade on any indicator is always a positive result.6.2 Index of Multiple Deprivation Score for Living EnvironmentNational Rank(Out of 7976)Cumbria Rank(Out of 168)Carlisle Rank(Out of 227379 163 22For the above ranking system Rank 1 is the poorest Living Environment.6.3 Household SpacesSource: Census 20016.4 Household OwnershipSource: Census 200112
<strong>Yewdale</strong> <strong>Ward</strong> <strong>Profile</strong>7 Health and Well Being7.1 Local Knowledge Report Card Comparison for HealthDistrict Sub Region Region NationalHealth B D B CSource: www.localknowledge.co.ukPlease see page 4 for definitions.An ‘A’ grade indicates that the area is within the top 20%, while an ‘E’ grade indicates that it isin the bottom 20%. To create a profile of any Report Card theme, click on the indicator title onthe left-hand side. Please note that the scores for Deprivation, Inequality and Crime havebeen inversed to ensure an A grade on any indicator is always a positive result.7.2 Index of Multiple Deprivation for HealthNational Rank(Out of 7976)Cumbria Rank(Out of 168)Carlisle Rank(Out of 22)2229 65 12For the above ranking system Rank 1 is the poorest health.7.3 Census 2001 Health DataEngland<strong>Yewdale</strong> Carlisle Cumbria North Westand WalesLimiting long-term illness% people with limiting long-term illness 18% 19% 20% 21% 18%% people of working age with limiting long-term illness 9% 9% 9% 10% 8%England<strong>Yewdale</strong> Carlisle Cumbria North Westand WalesGeneral Health% people who health was : Good 70% 67% 67% 67% 69%% people who health was : Fairly good 21% 23% 23% 22% 22%% people who health was : Not good 9% 10% 10% 11% 9%England<strong>Yewdale</strong> Carlisle Cumbria North Westand WalesProvision of unpaid care% All people who provide unpaid care 11% 10% 11% 11% 10%Source: Census 200113
8 Education<strong>Yewdale</strong> <strong>Ward</strong> <strong>Profile</strong>8.1 Local Knowledge Report Card Comparison for EducationDistrict Sub Region Region NationalSkills & qualifications D D D ESource: www.localknowledge.co.ukPlease see page 4 for definitions.An ‘A’ grade indicates that the area is within the top 20%, while an ‘E’ grade indicates that it isin the bottom 20%. To create a profile of any Report Card theme, click on the indicator title onthe left-hand side. Please note that the scores for Deprivation, Inequality and Crime havebeen inversed to ensure an A grade on any indicator is always a positive result.8.2 Index of Multiple Deprivation for EducationNational Rank Cumbria Rank Carlisle Rank(Out of 7976) (Out of 168) (Out of 22)2688 48 11For the above ranking system Rank 1 is the poorest level of education.8.3 Census 2001 Education DataEngland<strong>Yewdale</strong> Carlisle Cumbria North WestAll people aged 16 - 74and WalesNo qualifications 33% 32% 31% 32% 29%Highest qualification attained level 1 19% 18% 18% 17% 17%Highest qualification attained level 2 21% 21% 20% 19% 19%Highest qualification attained level 3 6% 7% 7% 8% 8%Highest qualification attained level 4/5 11% 15% 17% 17% 20%Other qualifications/level unknown 10% 7% 7% 7% 7%England<strong>Yewdale</strong> Carlisle Cumbria North WestStudents within people aged 16-74and WalesTotal number of full-time students andschoolchildren: Aged 16 - 17 3% 3% 3% 3% 3%Total number of full-time students andschoolchildren: Aged 18 - 74 1% 3% 2% 4% 4%Full-time students aged 18 - 74: Economically active:in employment 1% 1% 1% 1% 1%Full-time students aged 18 - 74: Economically active:Unemployed 0% 0% 0% 0% 0%Full-time students aged 18 - 74: Economicallyinactive 1% 1% 1% 3% 3%Source: Census 2001Note: Percentages are rounded to no decimal places so 0% may be figures between 0.0%and 0.49%14