Education Budgets - UNESCO Islamabad
Education Budgets - UNESCO Islamabad
Education Budgets - UNESCO Islamabad

Create successful ePaper yourself
Turn your PDF publications into a flip-book with our unique Google optimized e-Paper software.
<strong>UNESCO</strong> <strong>Islamabad</strong><br />
United Nations<br />
<strong>Education</strong>al, Scientific and<br />
Cultural Organization<br />
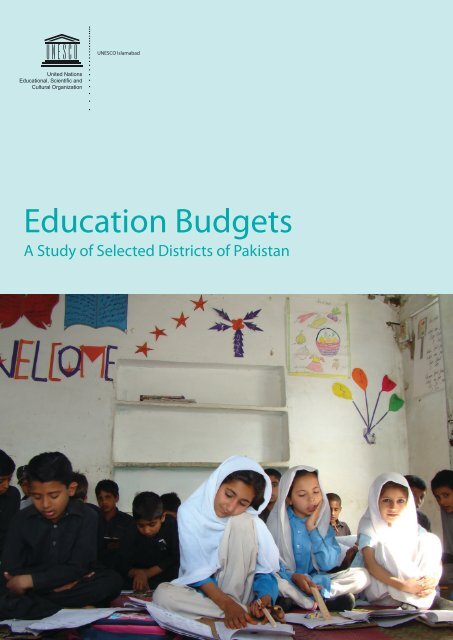
<strong>Education</strong> <strong>Budgets</strong><br />
A Study of Selected Districts of Pakistan
Published by <strong>UNESCO</strong> <strong>Islamabad</strong>, Pakistan<br />
<strong>UNESCO</strong> Office, Serena Business Complex,<br />
7th Floor, Sector G-5, <strong>Islamabad</strong><br />
Email: islamabad@unesco.org<br />
Website: www.unesco.org.pk<br />
© <strong>UNESCO</strong> 2013<br />
All rights reserved<br />
ISBN 978-969-8035-14-3<br />
The designations employed and the presentation of material throughout this publication do not<br />
imply the expression of any opinion whatsoever on the part of <strong>UNESCO</strong> concerning the legal<br />
status of any country, territory, city or area or of its authorities, or concerning the delimitation of<br />
its frontiers or boundaries.<br />
The authors are responsible for the choice and the presentation of the facts contained in this<br />
book and for the opinions expressed therein, which are not necessarily those of <strong>UNESCO</strong> and do<br />
not commit the Organization.<br />
Design/Layout: Sirisak Chaiyasook<br />
Front cover photo: © <strong>UNESCO</strong> Isalamabad<br />
Pakistan/11/OS/039-1
The state shall provide free and<br />
compulsory education to all children of<br />
the age of five to sixteen years in such<br />
manner as may be determined by law.<br />
Article 25-A<br />
Constitution of Pakistan
Preface<br />
<strong>UNESCO</strong> functions as an advisor to the Government, an advocate of international norms and standards,<br />
a convener of relevant stakeholders, a clearing-house for dissemination and sharing of information and<br />
knowledge, a laboratory of innovative ideas and a provider of technical assistance to improve national<br />
capacity.<br />
In accordance with its mandate, <strong>UNESCO</strong> commissioned this study on the education budgeting<br />
processes followed in some selected districts of Pakistan. Its basic purpose was to trace the practices<br />
of budget allocation, priorities, utilization and people’s participation in the preparation of education<br />
budgets. Conducted by the Centre for Peace and Development Initiative (CPDI), this study is a pioneer<br />
effort, providing invaluable information on, and lessons learnt in, education budget formulation for<br />
improvement of the education system in Pakistan, within the framework of the Local Governance<br />
Ordinance (LGO) 2011.<br />
This report furnishes details of the annual education budget making process, its implementation and<br />
effectiveness along with the individual and comparative analyses of the education budgets in selected<br />
districts. The study highlights several aspects of the budget making process which seek serious policy<br />
attention to make it, among others, transparent and participatory. It raises issues that across districts<br />
budget allocations for the education sector are uneven, inadequate and annual increases are, at best,<br />
marginal in real terms. Salary-related expenses are predominant in district education budgets, allowing<br />
limited funds for non-salary expenditures essential for maintenance and development of the system.<br />
Weak governance persists as a serious challenge.<br />
The key value of this study lies in its timing and its usefulness in the very near future. Of recent, given<br />
the additional challenges to education governance and finance, the budgeting process has gained<br />
prominence. In July 2011, under the 18th Amendment of the Constitution, education was fully devolved<br />
to the provinces. This has added to the responsibilities of the provinces as now the educational policy,<br />
planning and curriculum development has been placed within the provincial mandate. In addition,<br />
Article 25-A of the Constitution calls for the provision of free and compulsory education to all children<br />
of the ages five to sixteen years. With more resources awarded to the provinces under the 7th National<br />
Finance Commission (NFC) Award 2010, provincial education budgets are now expected to cater to a<br />
variety of additional dimensions. These are expected to address advocacy for appropriate legislation,<br />
enhancement of institutional capacity, curriculum development, increased coverage of service delivery,<br />
etc. Lessons learnt from this study would, indeed, provide invaluable guidance for improved budgeting<br />
procedures and practices.<br />
<strong>UNESCO</strong> is grateful to all individuals involved in the preparation of this study, including Provincial and<br />
District Government officials, CPDI team, UN staff and the civil society at large.<br />
Dr. Kozue Kay Nagata<br />
Director/Representative<br />
<strong>UNESCO</strong> <strong>Islamabad</strong>
Table of Contents<br />
Acronyms.......................................................................................................................................................................vii<br />
Executive Summary......................................................................................................................................................1<br />
1. Introduction................................................................................................................................................................2<br />
1.1 Objectives of the Study ........................................................................................................................................................2<br />
1.2 Method ...........................................................................................................................................................................................2<br />
2. The Budget Making Process and District Management.............................................................................2<br />
2.1 The Budget Making Process ..............................................................................................................................................2<br />
2.2. Analysis of the Budget Making Process......................................................................................................................4<br />
2.3. District Responsibility and Management..................................................................................................................5<br />
3. Comparative Analysis of District <strong>Education</strong> <strong>Budgets</strong> .................................................................................9<br />
3.1 District <strong>Education</strong> <strong>Budgets</strong>..................................................................................................................................................9<br />
3.2 Current <strong>Education</strong> <strong>Budgets</strong>.............................................................................................................................................. 10<br />
3.3 Non-salary Allocations......................................................................................................................................................... 11<br />
4. <strong>Islamabad</strong> Capital Territory.................................................................................................................................12<br />
4.1. Profile of the District............................................................................................................................................................ 12<br />
4.2. <strong>Education</strong> Sector in <strong>Islamabad</strong>..................................................................................................................................... 13<br />
4.3. <strong>Education</strong> Budget Analysis.............................................................................................................................................. 14<br />
4.4. Major Issues and Concerns ............................................................................................................................................ 19<br />
4.5. Recommendations............................................................................................................................................................... 20<br />
5. Abbottabad District...............................................................................................................................................21<br />
5.1. Profile of the District............................................................................................................................................................ 21<br />
5.2. <strong>Education</strong> Sector in Abbottabad................................................................................................................................. 23<br />
5.3. <strong>Education</strong> Budget Analysis.............................................................................................................................................. 24<br />
5.4. Major Issues and Concerns ............................................................................................................................................ 27<br />
5.5. Recommendations............................................................................................................................................................... 28<br />
6. Nowshera District...................................................................................................................................................29<br />
6.1. Profile of the District............................................................................................................................................................ 29<br />
6.2. <strong>Education</strong> Sector in Nowshera...................................................................................................................................... 30<br />
6.3. <strong>Education</strong> Budget Analysis.............................................................................................................................................. 31<br />
6.4. Major Issues and Concerns ............................................................................................................................................ 35<br />
6.5. Recommendations............................................................................................................................................................... 35<br />
7. City District Faisalabad..........................................................................................................................................36<br />
7.1. Profile of the District............................................................................................................................................................ 36<br />
7.2. <strong>Education</strong> Sector in Faisalabad..................................................................................................................................... 37<br />
7.3. <strong>Education</strong> Budget Analysis.............................................................................................................................................. 38<br />
7.4. Major Issues and Concerns ............................................................................................................................................ 43<br />
7.5. Recommendations .............................................................................................................................................................. 43<br />
8. Jhelum District.........................................................................................................................................................44<br />
8.1. Profile of the district ............................................................................................................................................................ 44<br />
8.2. <strong>Education</strong> Sector in Jhelum............................................................................................................................................ 45<br />
8.3. <strong>Education</strong> Budget Analysis.............................................................................................................................................. 48
8.4. Major Issues and Concerns.............................................................................................................................................. 52<br />
8.5. Recommendations............................................................................................................................................................... 52<br />
9. Multan City District................................................................................................................................................53<br />
9.1. Profile of the District............................................................................................................................................................ 53<br />
9.2. <strong>Education</strong> sector in Multan............................................................................................................................................. 54<br />
9.3. <strong>Education</strong> Budget Analysis.............................................................................................................................................. 55<br />
9.4. Major Issues and Concerns ............................................................................................................................................ 58<br />
9.5. Recommendations............................................................................................................................................................... 58<br />
10. Recommendations...............................................................................................................................................59<br />
References......................................................................................................................................................................61<br />
List of Figures<br />
Figure 1: Administrative Hierarchy at the District Level . . . . . . . . . . . . . . . . . . . . . . . . . . . . 6<br />
Figure 2: Organization Chart of City District Governments . . . . . . . . . . . . . . . . . . . . . . . . . . 7<br />
Figure 3: Organization Chart, District <strong>Education</strong> Department . . . . . . . . . . . . . . . . . . . . . . . . 8<br />
Figure 4: Map of Pakistan . . . . . . . . . . . . . . . . . . . . . . . . . . . . . . . . . . . . . . . . . . . . . . 12<br />
Figure 5: Map of Khyber Pakhtunkhwa and Northern Areas . . . . . . . . . . . . . . . . . . . . . . . . 21<br />
Figure 6: Map of Abbottabad District . . . . . . . . . . . . . . . . . . . . . . . . . . . . . . . . . . . . . . 22<br />
Figure 7: Map of Nowshera District. . . . . . . . . . . . . . . . . . . . . . . . . . . . . . . . . . . . . . . . 29<br />
Figure 8: Staff Positions in the <strong>Education</strong> Sector, Faisalabad City District, 2009. . . . . . . . . . . . . 38<br />
Figure 9: The Faisalabad City District Budget, 2008/09. . . . . . . . . . . . . . . . . . . . . . . . . . . . 39<br />
Figure 10: Non-development Budget of Faisalabad City District, 2008/09 . . . . . . . . . . . . . . . . 39<br />
Figure 11: Salary and Non-salary Allocations, <strong>Education</strong> Sector, Faisalabad City District 2006-2009 40<br />
Figure 12: Map of Jhelum District. . . . . . . . . . . . . . . . . . . . . . . . . . . . . . . . . . . . . . . . . . 44<br />
Figure 13: Vacant Posts in the <strong>Education</strong> Department of Jhelum District, 2009/10 . . . . . . . . . . . 46<br />
Figure 14: School Budget for the Government Comprehensive High School, 2009/10 . . . . . . . . 50<br />
Figure 15: School Budget for the Government Comprehensive High School, 2008/09 . . . . . . . . 50<br />
Figure 16: Total Annual Budget of Multan City District, 2009/10. . . . . . . . . . . . . . . . . . . . . . . 55
vii<br />
List of Tables<br />
Table 1: District Annual Budget Cycle . . . . . . . . . . . . . . . . . . . . . . . . . . . . . . . . . . . . . . 3<br />
Table 2: Current <strong>Education</strong> <strong>Budgets</strong> as a Percentage of Total Current <strong>Budgets</strong>, 2009/10 . . . . . . . 9<br />
Table 3:<br />
<strong>Education</strong> Budget as a Percentage of the District Annual Development Programme,<br />
2009/10 . . . . . . . . . . . . . . . . . . . . . . . . . . . . . . . . . . . . . . . . . . . . . . . . . . 10<br />
Table 4: Population and Current <strong>Education</strong> <strong>Budgets</strong> . . . . . . . . . . . . . . . . . . . . . . . . . . . . 10<br />
Table 5: Non-salary Allocations, 2008/09 and 2009/10 . . . . . . . . . . . . . . . . . . . . . . . . . . . 11<br />
Table 6: Rural and Urban Population of <strong>Islamabad</strong> District, 1998 and 2009 (millions) . . . . . . . . 12<br />
Table 7: <strong>Islamabad</strong> City Population, 1998 and 1981 . . . . . . . . . . . . . . . . . . . . . . . . . . . . . 13<br />
Table 8: Government schools in <strong>Islamabad</strong> Capital Territory . . . . . . . . . . . . . . . . . . . . . . . 13<br />
Table 9: Yearly Allocations, 2004/05 to 2009/10 . . . . . . . . . . . . . . . . . . . . . . . . . . . . . . . 14<br />
Table 10: Allocations within the <strong>Education</strong> Sector . . . . . . . . . . . . . . . . . . . . . . . . . . . . . . 15<br />
Table 11: Sub-sector Allocations for Primary, Secondary and Tertiary <strong>Education</strong>. . . . . . . . . . . . 15<br />
Table 12: Pre-primary and Primary <strong>Education</strong> Budget Allocations, 2005-2010 (in PKR) . . . . . . . . 16<br />
Table 13: Secondary <strong>Education</strong> (Middle Schools) Budget Allocations, 2005-2010 (in PKR). . . . . . 17<br />
Table 14: Secondary <strong>Education</strong> (High Schools) Budget Allocations, 2005 – 2010 (in PKR) . . . . . . 18<br />
Table 15: Population of Abbottabad District, 1951-2009 (in Millions) . . . . . . . . . . . . . . . . . . . 22<br />
Table 16: Literacy Ratio by Sex and Location, 1981 and 1998. . . . . . . . . . . . . . . . . . . . . . . . 23<br />
Table 17: Number and Types of Schools in Abbottabad, 1998 and 2009. . . . . . . . . . . . . . . . . 23<br />
Table 18: Total <strong>Education</strong> Budget of Abbottabad District (Estimates and Revised Estimates), 2006 -<br />
2010 . . . . . . . . . . . . . . . . . . . . . . . . . . . . . . . . . . . . . . . . . . . . . . . . . . . . . 25<br />
Table 19: Salary Component of the <strong>Education</strong> Department Budget, Abbottabad District . . . . . . 25<br />
Table 20: Non-salary Budget Compared with the Total <strong>Education</strong> Budget, 2006-2010 . . . . . . . . 26<br />
Table 21: Development Projects, Abbottabad, 2005-2009. . . . . . . . . . . . . . . . . . . . . . . . . . 27<br />
Table 22: Population and Annual increase, 1951-2009 (in Millions) . . . . . . . . . . . . . . . . . . . . 29<br />
Table 23: Literacy Ratio by Sex and Location – 1981 and 1998 – Nowshera District. . . . . . . . . . 30<br />
Table 24: Numbers of Primary Schools, Students and Teachers in Nowshera District . . . . . . . . . 30<br />
Table 25: Numbers of Secondary Schools, Students and Teachers, Nowshera District . . . . . . . . 31<br />
Table 26: Nowshera District Budget (in Millions PKR) . . . . . . . . . . . . . . . . . . . . . . . . . . . . . 32<br />
Table 27: Salary Budget of Primary Schools, 2008-2010 (PKR). . . . . . . . . . . . . . . . . . . . . . . . 32<br />
Table 28: Salary Budget of Middle Schools in Nowshera District, 2008-2010 . . . . . . . . . . . . . . 33<br />
Table 29: Salary Budget of Higher Secondary Schools in Nowshera District, 2008-2010 . . . . . . . 33<br />
Table 30: Salary Budget of High Schools in Nowshera District, 2008-2010 . . . . . . . . . . . . . . . 33<br />
Table 31: Non-Salary Budget Vis-à-Vis the Total <strong>Education</strong> Budget . . . . . . . . . . . . . . . . . . . . 34<br />
Table 32: Annual Development Programme, 2005/06 to 2008/09 . . . . . . . . . . . . . . . . . . . . 34<br />
Table 33: Population of Faisalabad City, 1981 and 1998 . . . . . . . . . . . . . . . . . . . . . . . . . . . 36<br />
Table 34: Population and Percentage Increase 1951-1998 . . . . . . . . . . . . . . . . . . . . . . . . . 36<br />
Table 35: Literacy Ratio by Sex and Location – 1981 and 1998 . . . . . . . . . . . . . . . . . . . . . . . 37<br />
Table 36: Public Sector Schools in Faisalabad District. . . . . . . . . . . . . . . . . . . . . . . . . . . . . 37<br />
Table 37: Salary and Non-salary <strong>Budgets</strong>, <strong>Education</strong> Sector, 2006/07 – 2008/09 . . . . . . . . . . . . 40<br />
Table 38: Operating Expenses in the <strong>Education</strong> Sector – Selected Categories, 2008/09 . . . . . . . 41<br />
Table 39: Non-salary <strong>Budgets</strong> of Selected Schools, Faisalabad City District, 2008/09 . . . . . . . . . 41<br />
Table 40: New Sevelopment Projects in the <strong>Education</strong> Sector 2008/09 . . . . . . . . . . . . . . . . . 42<br />
Executive<br />
Summary<br />
1. Introduction 2. The Budget Making Process and<br />
District Management<br />
3. Comparative Analysis of 4. <strong>Islamabad</strong> Capital<br />
District <strong>Education</strong> <strong>Budgets</strong> Territory<br />
5. Abbottabad District 6. Nowshera District 7. City District<br />
Faisalabad<br />
8. Jhelum District 9. Multan City<br />
District<br />
10. Recommendations References
viii<br />
<strong>Education</strong> <strong>Budgets</strong>: A Study of Selected Districts of Pakistan<br />
Table 41: Key Points in the Faisalabad City District <strong>Education</strong> Development Budget, 2008/09 . . . 42<br />
Table 42: Rural and Urban Populations of Jhelum District, 1998 and 2009 . . . . . . . . . . . . . . . 45<br />
Table 43: Numbers of Boys’ and Girls’ Schools in Jhelum District. . . . . . . . . . . . . . . . . . . . . . 45<br />
Table 44: Number of Posts in the <strong>Education</strong> Sector, Jhelum District . . . . . . . . . . . . . . . . . . . 46<br />
Table 45: Numbers and Types of Private Schools in Jhelum District. . . . . . . . . . . . . . . . . . . . 46<br />
Table 46: Student Numbers in Private Schools in Jhelum District . . . . . . . . . . . . . . . . . . . . . 47<br />
Table 47: Number of Teachers in Private Schools in Jhelum District. . . . . . . . . . . . . . . . . . . . 47<br />
Table 48: School to Teacher, School to Student, and Student to Teacher Ratios in Private Schools,<br />
Jhelum District . . . . . . . . . . . . . . . . . . . . . . . . . . . . . . . . . . . . . . . . . . . . . . 47<br />
Table 49: <strong>Education</strong> Sector Budget, Jhelum District . . . . . . . . . . . . . . . . . . . . . . . . . . . . . 48<br />
Table 50: Original and Revised Budget Estimates, <strong>Education</strong> Sector, Jehlum District . . . . . . . . . 48<br />
Table 51: Salary Budget as Percentage of Total Budget . . . . . . . . . . . . . . . . . . . . . . . . . . . 49<br />
Table 52: Jhelum District Development Schemes 2008/09 - <strong>Education</strong> Sector . . . . . . . . . . . . 51<br />
Table 53: Provincial Grants in the <strong>Education</strong> sector in Jhelum District, 2008/09 . . . . . . . . . . . . 52<br />
Table 54: Population and Percentage Change, 1951-2009 . . . . . . . . . . . . . . . . . . . . . . . . . 53<br />
Table 55: Literacy by Sex and Location – 1981 and 1998 . . . . . . . . . . . . . . . . . . . . . . . . . . 53<br />
Table 56: Public Schools in Multan District . . . . . . . . . . . . . . . . . . . . . . . . . . . . . . . . . . . 54<br />
Table 57: Enrolment Numbers in Multan District . . . . . . . . . . . . . . . . . . . . . . . . . . . . . . . 54<br />
Table 58: Salary and Non-salary <strong>Budgets</strong> for EDO (<strong>Education</strong> Group) in Multan District . . . . . . . 56<br />
Table 59: Salary and Non-salary <strong>Budgets</strong> of Selected High Schools, 2009/10 . . . . . . . . . . . . . . 57<br />
Table 60: Share of <strong>Education</strong> in the Annual Development Plan, Multan City District, 2008/09 . . . 57<br />
Table 61: Top Three Development Priorities of Multan City District, 2007-2009 . . . . . . . . . . . . 58<br />
Acronyms<br />
ADP<br />
CCB<br />
DCO<br />
DDO<br />
DMO<br />
EDO<br />
ESR<br />
F & P<br />
FDE<br />
HEC<br />
ICT<br />
LGO<br />
MRC<br />
OSR<br />
PKR<br />
PTC<br />
PFC<br />
SMC<br />
Annual Development Programme<br />
Citizens Community Board<br />
District Coordination Officer<br />
Drawing and Disbursing Officer<br />
District Monitoring Officer<br />
Executive District Officer<br />
<strong>Education</strong> Sector Reform<br />
Finance and Planning<br />
Federal Directorate of <strong>Education</strong><br />
Higher <strong>Education</strong> Commission<br />
<strong>Islamabad</strong> Capital Territory<br />
Local Government Ordinance<br />
Medical Reimbursement Charges<br />
Own Source Revenue<br />
Pakistan, Rupees<br />
Parents and Teachers Council<br />
Provincial Finance Commission<br />
School Management Committee
Executive Summary<br />
This report presents the findings of a study of the education budgets of selected districts of Pakistan.<br />
The purpose of the study was to probe into the practices of budget allocation, priorities, utilization and<br />
people’s participation in the preparation of education budgets. This was the first study of its kind, and<br />
was carried out by the Centre for Peace and Development Initiatives (CPDI) with the support of <strong>UNESCO</strong>.<br />
This report furnishes details of the annual education budget making process, and its implementation<br />
and effectiveness in selected districts. The report also provides individual and comparative analyses of<br />
the education budgets in selected districts, in view of their total population and their developmental<br />
requirements.<br />
The study examined six districts: <strong>Islamabad</strong> Capital Territory (ICT); Abbottabad District and Nowshera<br />
District in Khyber-Pakhtunkhwa Province; and Faisalabad City District, Jhelum District and Multan City<br />
District in Punjab Province.<br />
Information for the study was collected through interviews and from secondary sources, including<br />
relevant documents for budget making and annual budget books.<br />
The study found that many flaws occur in the budget making process and the process is neither open<br />
nor participatory. Local Government Ordinance (LGO) of 2001 and the Budget Rules of 2003 provide for<br />
public consultations, presentation of the draft budget in the Council and effective input by stakeholders,<br />
but such provisions are not followed in most of the districts studied. The process is dominated almost<br />
exclusively by government staff (Deputy District Officers for <strong>Education</strong>), and the views of teachers,<br />
parents, students and communities regarding needs and priorities are not taken into consideration<br />
at any stage of the process. Civil society is not consulted and the budget making process is treated<br />
as a confidential process. Furthermore, development priorities are not determined in an informed,<br />
transparent or fair manner. The Budget Calendar, as provided in the Budget Rules of 2003, is not followed<br />
and therefore does not ensure efficiency and public participation in the budgeting process. The budget<br />
making process starts very late and the process is not completed in time.<br />
Across the districts, the budget allocations for the education sector are uneven and inadequate. Although<br />
there has been an increase every year in the education budget in some districts, the budget increase<br />
is minimal in real terms when Pakistan’s double digit inflation rate is taken into consideration. Given<br />
the importance of teachers’ salaries, salary related expenses make up the majority of the education<br />
budget. This leaves few funds for non-salary expenses (e.g. maintenance utilities, etc), however, which<br />
are important for the smooth functioning of educational institutions. Furthermore, access to non-salary<br />
funds is complicated.<br />
In addition, spending on education tends to be biased in favour of education of males. In general, there<br />
are more boys’ schools than girls’ schools in the surveyed districts, and boys’ schools consume more of<br />
the education budget than girls’ schools.<br />
Other major challenges identified include limited education staff and low capacity, premature transfers<br />
of concerned staff, political pressure on the budgeting process and over-dependence on provincial<br />
governments.<br />
This report recommends fair, equitable and needs-based allocation of education budgets. The Budget<br />
Calendar should be strictly followed by the district governments. In particular, the provisions relating<br />
to stakeholder consultations, timely completion of proposals, technical sanctions and presentations of<br />
draft budgets should be adhered to. The overall budget for the education sector should be increased<br />
and it is recommended that efforts be made to improve the condition of schools by providing adequate<br />
facilities and support. Furthermore, non-salary allocations need to be increased significantly so that the<br />
schools can cover their operating expenses. It is also necessary to make access to the funds for schools<br />
simpler and transparent. In addition, it is recommended that greater provisions be made for girls’ schools<br />
and that the disparity in the numbers of educational institutions for boys and girls be reduced.<br />
1Executive<br />
Summary<br />
1. Introduction 2. The Budget Making Process and<br />
District Management<br />
3. Comparative Analysis of 4. <strong>Islamabad</strong> Capital<br />
District <strong>Education</strong> <strong>Budgets</strong> Territory<br />
5. Abbottabad District 6. Nowshera District 7. City District<br />
Faisalabad<br />
8. Jhelum District 9. Multan City<br />
District<br />
10. Recommendations References
2<br />
<strong>Education</strong> <strong>Budgets</strong>: A Study of Selected Districts of Pakistan<br />
1. Introduction<br />
Effective education sector budgeting is crucial for ensuring a high quality of education and for<br />
improving the literacy rate. This study examines the education budgets in six districts of Pakistan:<br />
<strong>Islamabad</strong> Capital Territory, Abbottabad District, Nowshera District, Faisalabad City District, Jhelum<br />
District and Multan City District. This report provides a comparison and analysis of district education<br />
budgets vis-à-vis the total budget allocation for the education sector and examines compliance with<br />
the budget rules and calendar, gender and regional perspectives and implementation of the allocated<br />
budget.<br />
1.1 Objectives of the Study<br />
The study aimed to understand various trends in terms of education budget allocations, priorities,<br />
utilization and stakeholder participation in the budgeting process. It was expected that this study<br />
would provide useful data and would highlight the trends related to resource allocation for the<br />
education sector.<br />
The specific objectives of the study were as follows:<br />
yy<br />
To review the budget making process for the education sector and assess whether it is effective and<br />
how it can be improved.<br />
yy<br />
To analyze the budget documents relating to the education sector, especially in terms of allocations<br />
and priorities, and gender and regional perspectives.<br />
yy<br />
To examine the implementation of education sector budget, especially the problem of low utilization,<br />
and to analyze the roles of relevant institutions.<br />
yy<br />
To identify weaknesses and gaps at various stages of the budget cycle in relation to relevant procedures<br />
or responsible organizations, and to make appropriate recommendations for improvement.<br />
1.2 Method<br />
The study utilized both primary and secondary sources of information. The primary sources of<br />
information were interviews with key stakeholders. Interviewees included district education and<br />
finance officers, teachers and head teachers of public schools and parents. The secondary sources<br />
consisted of district budget books, budget-related laws and rules for the districts, and other related<br />
documents.<br />
2. The Budget Making Process and District Management<br />
2.1 The Budget Making Process<br />
The management of financial resources available to the district governments and their further<br />
allocation and re-allocation is the responsibility of the Finance and Planning Department. For the<br />
education sector, budget preparation and related activities are jointly administered by the Elementary<br />
and Secondary <strong>Education</strong> Department and the Finance and Planning Department.<br />
The budget making process generally involves steps for preparing estimates for revenue generation<br />
as well as for preparing expected expenditures.
Definition: A Budget<br />
Conventionally, a budget is a financial report containing estimates of income and expenses or<br />
a plan for coordinating resource generation and utilization. In other words, it is a financial plan<br />
incorporating receipts (cash in-flow) and outlays (cash out-flow) in a fiscal period (two years, one<br />
year, six months or three months).<br />
The budget rules of the provinces of Punjab and Khyber-Pakhtunkhwa provinces provide a detailed<br />
procedure and calendar for preparing annual budgets. According to the rules, the district governments<br />
must prepare the draft budget by the end of March, and should then discuss and debate the draft<br />
in the District Council and refine it in the light of feedback received from various stakeholders. The<br />
budget must be approved before the end of the month of June. 1<br />
The budget-making process for all districts in Punjab Province is governed by the Punjab District<br />
Government and Tehsil Municipal Administration Budget Rules 2003. Under these Rules, Budget<br />
Call Letters should be issued by the EDO Finance and Planning in September. All department heads,<br />
including the education department, are required to submit the first draft of their department budget<br />
till the end of December, including estimates for both current and development expenditures.<br />
Subsequently, the proposed development projects should then be referred to the District Development<br />
Committee for consideration. In the meantime, Citizen Community Boards (CCBs) are expected to<br />
develop proposals for development projects in their respective communities. These proposals should<br />
then be submitted to the district government through the relevant department heads, who evaluate<br />
the technical feasibility of the proposal. In March, the EDO Finance and Planning should compile the<br />
full departmental budgets, request justifications for any increase in spending, and obtain approval<br />
from the Development Committee for the proposed projects. The district nazim should then submit<br />
the draft budget to the council in April. The council is expected to enact the annual budget before the<br />
end of June. The process is very similar in Khyber-Pakhtunkhwa Province.<br />
The Calendar shown in the table below should be followed for preparing the annual budget.<br />
Table 1: District Annual Budget Cycle<br />
July-September:<br />
September:<br />
October:<br />
September-February:<br />
December:<br />
Consultation with stakeholders and priorities identified by the council.<br />
Budget call letter issued.<br />
Forms for estimation of receipts and expenditures also issued with call letter.<br />
Guidelines identifying priority areas for CCBs issued by district government<br />
Consolidation of estimates of revenue and expenditure.<br />
Identification of development projects and preparation of project outlines.<br />
CCB project proposals submitted to CCB Official.<br />
1 March: All the estimates, development project outlines and CCB proposals submitted to Budget and Development<br />
Committee.<br />
March:<br />
1 April: Draft budget submitted to council.<br />
April:<br />
Finalization by Budget and Development Committee (including revised estimates for the current year).<br />
Approval of Annual Development Programme by the Budget and Development Committee.<br />
Review of draft budget by the council including taxation proposals.<br />
1 May: Public opinion sought on taxation proposals.<br />
1 June: Public opinion and government vetting received.<br />
May-June:<br />
Revision and changes by Head of Offices and finalization by the Budget and Development Committee.<br />
1 The budget for <strong>Islamabad</strong> is prepared in a slightly different manner, as the Federal Government Rules apply and a local<br />
government system does not exist in <strong>Islamabad</strong>.<br />
3Executive<br />
Summary<br />
1. Introduction 2. The Budget Making Process and<br />
District Management<br />
3. Comparative Analysis of 4. <strong>Islamabad</strong> Capital<br />
District <strong>Education</strong> <strong>Budgets</strong> Territory<br />
5. Abbottabad District 6. Nowshera District 7. City District<br />
Faisalabad<br />
8. Jhelum District 9. Multan City<br />
District<br />
10. Recommendations References
4<br />
<strong>Education</strong> <strong>Budgets</strong>: A Study of Selected Districts of Pakistan<br />
June:<br />
Before 30 June:<br />
July:<br />
October:<br />
Submission of final budget to the Council.<br />
Approval of final budget by the Council.<br />
Communication of grants to concerned offices and accounts offices.<br />
Intimation of project approval or non-approval.<br />
Final Accounts for previous year.<br />
Source: Punjab Government, District Government and TMA Budget Rules 2003, Lahore<br />
For the federal government, in <strong>Islamabad</strong>, the annual budget-making process effectively starts in<br />
October each year, when the Ministry of Finance issues the Budget Call Circular. In response, all suboffices,<br />
institutions, departments and divisions are expected to provide estimates for expenditures<br />
and development requirements. Hence, requirements are collected from nearly all levels within<br />
the education sector. The concerned ministries, divisions and departments are expected to submit<br />
detailed estimates of expenditures in a specified period i.e. between November and February. In<br />
March and April, the estimates of expenditures should be scrutinized. After this, the Ministry of Finance<br />
formulates the budgetary proposals, which should be presented in parliament in June for approval.<br />
The same procedure is applied to prepare the annual development plan. In this case, however, the<br />
development requirements submitted by ministries or divisions, in compliance with the Budget Call<br />
Circular, are scrutinized by the Planning and Development Division. This should occur in March. Later,<br />
these requirements are prioritized and approved through a process involving the Priorities Committee<br />
in the Ministry of Finance, the Annual Coordination Committee and the National Economic Council.<br />
Ultimately, the selected schemes are included in the annual development plan and are made a part<br />
of budgetary proposals that should be submitted to parliament in June for approval.<br />
2.2. Analysis of the Budget Making Process<br />
In Multan and Faisalabad city districts of Punjab Province, the budget rules are followed in terms of<br />
seeking public views, consulting stakeholders and presenting and discussing the draft budgets in the<br />
councils. The Multan City District Government has been striving to ensure compliance with Budget<br />
Rules. Since 2007, the government has prepared the annual budgets after holding consultative<br />
dialogues with various stakeholders. The government has also presented draft budgets in the Council,<br />
as required under Rule 57 of the District Government and TMA Budget Rules 2003. 2 These steps have<br />
helped to improve the quality of planning. Likewise, in Faisalabad City District, the government<br />
has made efforts to improve the budget-making process and has tried to prepare budgets for<br />
each educational institution, instead of following the usual practice of making block allocations.<br />
Furthermore, the government has published detailed budget books.<br />
But in most districts the budget rules are not fully followed, particularly the budget calendar. What<br />
usually happens is that the budget making process is initiated in May and must be completed in hasty<br />
manner before the end of June. The budget rules are not fully implemented because of a range of<br />
political constraints, capacity issues and bureaucratic inefficiencies. As a result, several problems are<br />
reported, including those listed below.<br />
yy<br />
The deadlines set in the Budget Calendar are often ignored, which results in long delays in<br />
identification of development projects, preparation of estimates or proposals, and obtaining timely<br />
technical sanctions or finalization of draft budgets. These delays subsequently slow down the entire<br />
development process.<br />
yy<br />
Draft budgets are usually not ready in time and are not presented in the Council. These draft budgets<br />
are not easily accessible to the general public, which limits opportunities for public participation.<br />
This is partly because of the technical nature of budget documents and the fact that these are<br />
prepared and presented in English.<br />
2 City District Government, Budget 2009/10 (Part-I), Multan.
yy<br />
Stakeholders are not fully and effectively consulted in the process of identifying and prioritizing new<br />
development projects. Usually councillors submit the development schemes, which may be based<br />
on unjust favour or prejudice for a community, thus highlighting the priorities of one community<br />
and neglecting the other.<br />
yy<br />
Development funds are distributed among various Union Councils and, since the available funds are<br />
limited, very small projects can be implemented that sometimes require several years to complete.<br />
This impedes the smooth flow of Planning and Developments projects and prevents projects being<br />
accomplished within the defined time frame.<br />
The process in <strong>Islamabad</strong> also has a number of drawbacks that require the attention of relevant<br />
authorities. The drawbacks are described below.<br />
yy<br />
The Budget Call Circular does not necessarily reach the lowest levels (i.e. primary and middle schools)<br />
and, hence, the lowest level bodies do not always get an opportunity to identify their needs.<br />
As per the procedure, the Budget Call Circular is only sent to relevant drawing and disbursing officers,<br />
who are senior level officers and responsible for several sub-offices or schools. Usually the Budget<br />
Call Circulars are not taken seriously and are dispatched quickly. The officers rarely consult the suboffices<br />
or schools under their jurisdiction before sending up information about the needs.<br />
yy<br />
Non-official stakeholders are not consulted at all.<br />
Although parents, teachers, students and members of the communities are direct stakeholders,<br />
and their views must be heard and weighed in the course of assessing problems and needs for<br />
the annual budget, the formal procedure for budget making does not include any provision for<br />
consulting with non-official stakeholders, nor do the relevant authorities consult these stakeholders<br />
informally.<br />
yy<br />
The parliament and its committees are not involved in the process of identifying or prioritizing the<br />
needs and developing budgetary proposals. The parliament has very short time (10 to 15 days), for<br />
examining, analyzing and approving the whole annual budget.<br />
The steps from the issuance of the Budget Call Circular to the formulation of budgetary proposals<br />
exclude the elected leaders and members of the Parliament. It is only in June that the budgetary<br />
proposals are presented before the parliament for formal approval, when changes are unlikely.<br />
The role of elected representatives in budget making and approval is nominal, leaving too much<br />
discretion with the executive branch, which has little or no appreciation of the needs and demands<br />
expressed by communities.<br />
2.3. District Responsibility and Management<br />
In Khyber-Pakhtunkhwa Province, Local Government Ordinance 2001 assigned the responsibility for<br />
elementary and secondary education to the district governments. Likewise, in Punjab Province, the<br />
management and development planning of primary and secondary education has been assigned to<br />
the districts (under the Punjab Local Government Ordinance 2001).<br />
Each district government is headed by an elected district nazim, who is responsible for overseeing<br />
and managing the administrative, planning and service delivery functions.<br />
The figure below illustrates the administrative structure of the education department at the district<br />
level.<br />
5Executive<br />
Summary<br />
1. Introduction 2. The Budget Making Process and<br />
District Management<br />
3. Comparative Analysis of 4. <strong>Islamabad</strong> Capital<br />
District <strong>Education</strong> <strong>Budgets</strong> Territory<br />
5. Abbottabad District 6. Nowshera District 7. City District<br />
Faisalabad<br />
8. Jhelum District 9. Multan City<br />
District<br />
10. Recommendations References
6<br />
<strong>Education</strong> <strong>Budgets</strong>: A Study of Selected Districts of Pakistan<br />
Figure 1: Administrative Hierarchy at the District Level<br />
Executive Distric Offier (E & S E)<br />
Ministerial Staff<br />
District Officer Male (E & S E) District Officer Female (E & S E)<br />
Dy. District Officer Male (E & S E) Dy. District Officer Female (E & S E)<br />
Ministerial Staff<br />
Ministerial Staff<br />
Asstt. District Officers Male (E & S E) Asstt. District Officers Female (E & S E)<br />
The authority for approving development plans and annual budgets, as well as exercising executive<br />
power, lies with an elected council. In each district, the District Coordination Officer (DCO) supports the<br />
nazim and serves as the head of administration and is responsible for various coordinating functions.<br />
Under him/her are the departments for various functions such as health, revenue and education.<br />
At the district level, the Executive District Officer (EDO) is responsible for all types of pre-primary,<br />
primary, middle, high and higher secondary schools in the district. The EDO is responsible to the<br />
DCO and then to the district nazim. It is the EDO who is responsible for day to day functioning of<br />
the education department. The functions of this office include, among others, transfers and postings<br />
of teachers and other staff, monitoring, general administration, identification of new development<br />
needs and overseeing of programmes aimed at improving the quality of services delivered by the<br />
education department.<br />
Intermediate education (grades 11 and 12) is mainly the responsibility of the Department of Higher<br />
<strong>Education</strong> in the provincial government. This department manages the intermediate or degree<br />
colleges that offer arts and science courses. The higher secondary schools, which also cater to the<br />
needs of students in grades 11 and 12) are managed by the Elementary and Secondary <strong>Education</strong><br />
Department of the District. The district budget, including the components related to education<br />
sector, is prepared by the district government and approved by the district council.<br />
The administration in the districts is headed by the city district nazim, who is elected by the people<br />
through their directly elected representatives. The administrative hierarchy below describes the<br />
management system, which clearly puts the nazim on the top, whereas the District Coordination<br />
Officer serves as the head of administration.
Figure 2: Organization Chart of City District Governments<br />
Coordination HRM<br />
& Civil Defense<br />
EDO Finance &<br />
Planning<br />
City District Nazim<br />
DCO<br />
EDO Law EDO Revenue EDO Work &<br />
Services<br />
DPO<br />
EDO <strong>Education</strong> EDO Health EDO IT<br />
EDO Community<br />
Development<br />
EDO Literacy<br />
In the districts, the Executive District Officer for <strong>Education</strong> and the EDO for Literacy are responsible for<br />
matters related to education and literacy in the city district. The EDO/ E and EDO/ L report to District<br />
Coordination Officer (DCO). A number of district and deputy district officers work under the EDO/E<br />
and look after the various levels of education i.e. primary, middle and higher education.<br />
While administration and management is the responsibility of district government, the district council<br />
has the authority to approve development plans and the annual budget of the district. It can also<br />
setup monitoring committees for various sectors, including education, to oversee the performance<br />
of the district government. The district councils have so far not been active enough to question the<br />
performance of the sectors falling under their jurisdiction. This lack of action is due to the general<br />
culture that puts little emphasis on accountability, and is also a result of the lack of participation of civil<br />
society and lack of interest by the media in terms of tracking annual development plans and budgets.<br />
In <strong>Islamabad</strong> Capital Territory the federal government is responsible for providing education services,<br />
and the services are delivered through the Federal Directorate of <strong>Education</strong> (FDE), which is a<br />
department of the Federal Ministry of <strong>Education</strong>. Since the district does not have an elected district<br />
government, the participation of the population in decision making or oversight is limited, as it can<br />
only be exercised through the parliament or its committees on education, which have many other<br />
responsibilities related to the whole country. Even the processes related to development planning<br />
and identification of priorities have little input from the people living in <strong>Islamabad</strong>.<br />
The FDE is responsible for the administrative and professional management of various types of<br />
educational institutions including primary, middle and high schools and higher secondary schools and<br />
colleges. The Directorate is also responsible for the provision of infrastructural facilities, recruitment of<br />
staff, monitoring and implementation of government policies. For the purposes of the FDE, <strong>Islamabad</strong><br />
Capital Territory is divided into five sectors: one urban and four rural sectors (Bhara Kahu, Nilore, Sihala<br />
and Tarnol).<br />
7Executive<br />
Summary<br />
1. Introduction 2. The Budget Making Process and<br />
District Management<br />
3. Comparative Analysis of 4. <strong>Islamabad</strong> Capital<br />
District <strong>Education</strong> <strong>Budgets</strong> Territory<br />
5. Abbottabad District 6. Nowshera District 7. City District<br />
Faisalabad<br />
8. Jhelum District 9. Multan City<br />
District<br />
10. Recommendations References
8<br />
<strong>Education</strong> <strong>Budgets</strong>: A Study of Selected Districts of Pakistan<br />
Figure 3: Organization Chart, District <strong>Education</strong> Department<br />
Deputy DEO M-EE<br />
Faisalabad BS – 18(1)<br />
AEO<br />
Head Quarter<br />
Executive <strong>Education</strong> Officer Male<br />
Elementary <strong>Education</strong> (DEO M-EE)<br />
BS – 19(1)<br />
Deputy DEO M-EE<br />
Jaranwala BS – 18(1)<br />
AEO<br />
Jaranwala - I<br />
District <strong>Education</strong> Officer<br />
Secondary<br />
BS – 19(1)<br />
Deputy DEO M-EE<br />
Samundari BS – 18(1)<br />
AEO<br />
Bahlak<br />
Executive District Officer<br />
<strong>Education</strong><br />
BS – 19(1)<br />
Deputy DEO Secondary<br />
Administration<br />
BS – 18(1)<br />
Deputy DEO Secondary<br />
General BS – 18(1)<br />
District Officer<br />
Sports<br />
BS – 18(1)<br />
Deputy DO<br />
Sports BS – 16(1)<br />
Tehsil Officer<br />
City<br />
District <strong>Education</strong> Officer Women<br />
Elementary <strong>Education</strong> (DEO W-EE)<br />
BS – 19(1)<br />
Deputy DEO W-EE<br />
Faisalabad BS – 18(1)<br />
AEO<br />
Head Quarter<br />
Deputy DEO W-EE<br />
Jaranwala BS – 18(1)<br />
AEO<br />
Jaranwala - I<br />
Deputy DEO W-EE<br />
Samundari BS – 18(1)<br />
AEO<br />
Bahlak<br />
AEO<br />
Physical <strong>Education</strong><br />
AEO<br />
Jaranwala - II<br />
AEO<br />
Garh - I<br />
Principal<br />
BS – 19/20(33)<br />
Tehsil Officer<br />
Sadar<br />
AEO<br />
Physical <strong>Education</strong><br />
AEO<br />
Jaranwala - II<br />
AEO<br />
Garh<br />
AEO<br />
Development<br />
AEO<br />
Khurrianwala - I<br />
AEO<br />
Garh - II<br />
Senior HM<br />
HS – 18/19(108)<br />
Tehsil Officer<br />
Jhumra<br />
AEO<br />
Development<br />
AEO<br />
Khurrianwala<br />
AEO<br />
Manukanjan - I<br />
AEO<br />
Chak Jhumra Town - I<br />
AEO<br />
Khurrianwala - II<br />
AEO<br />
Manukanjan - I<br />
HM<br />
BS – 17/18(225)<br />
Tehsil Officer<br />
Jaranwala<br />
AEO<br />
Chak Jhumra Town<br />
AEO<br />
Lundianwala<br />
AEO<br />
Manukanjan - II<br />
AEO<br />
Chak Jhumra Town - II<br />
AEO<br />
Lundianwala<br />
AEO<br />
Manukanjan - II<br />
Tehsil Officer<br />
Samundari<br />
AEO<br />
Iqbal Town - I<br />
AEO<br />
Satiana - I<br />
AEO<br />
Samundari - I<br />
AEO<br />
Iqbal Town - I<br />
AEO<br />
Satiana<br />
AEO<br />
Samundari - I<br />
Tehsil Officer<br />
Tandlianwala<br />
AEO<br />
Iqbal Town - II<br />
AEO<br />
Satiana - II<br />
AEO<br />
Samundari - II<br />
AEO<br />
Iqbal Town - II<br />
AEO<br />
Samundari - II<br />
AEO<br />
Jinnah Town - I<br />
AEO<br />
Tandlianwala<br />
AEO<br />
Jinnah Town - I<br />
AEO<br />
Tandlianwala<br />
AEO<br />
Jinnah Town - II<br />
AEO<br />
Jinnah Town - II<br />
AEO<br />
Lyallpur Town - I<br />
AEO<br />
Lyallpur Town - I<br />
AEO<br />
Lyallpur Town - II<br />
AEO<br />
Lyallpur Town - II<br />
AEO<br />
Madina Town - I<br />
AEO<br />
Madina Town - I<br />
AEO<br />
Madina Town - II<br />
AEO<br />
Madina Town - II<br />
Source: Office of EDO/E, Faisalabad available at http://www.faisalabad.gov.pk/DepartmentsInfo.aspx?id=<strong>Education</strong>#orgn
3. Comparative Analysis of District <strong>Education</strong> <strong>Budgets</strong><br />
3.1 District <strong>Education</strong> <strong>Budgets</strong><br />
The education department is the largest in the districts in terms of the number of staff and the<br />
allocation and utilization of funds. Overall, between 61 percent and 75 percent of the total current<br />
budget is allocated to the education sector. For example, Faisalabad City District Government allocated<br />
62.6 percent of its total non-development budget to the education sector in 2008/09, and the current<br />
district budget for the education sector in Abbottabad in 2009/10 was 75 percent of the total current<br />
budget of the district. The table below presents the data for all six districts in 2009/10.<br />
Table 2: Current <strong>Education</strong> <strong>Budgets</strong> as a Percentage of Total Current <strong>Budgets</strong>, 2009/10<br />
District<br />
Total Current Budget<br />
(millions, PKR)<br />
Total Current Budget for <strong>Education</strong> Sector<br />
(millions, PKR)<br />
<strong>Education</strong> Budget as Percentage<br />
of Total<br />
Abbottabad 1797.00 1349.00 75.00<br />
Faisalabad 6763.60* 4219.40* 62.60*<br />
<strong>Islamabad</strong>** - - -<br />
Jhelum 1895.00 1337.00 70.50<br />
Multan 4514.00 2755.00 61.00<br />
Nowshera 1494.50 984.80 66.00<br />
Source: Annual Budget Books of the Districts, 2008 - 2010<br />
Note: * In 2008/09<br />
** The education budget of <strong>Islamabad</strong> is a part of the overall Federal budget and, therefore, the relevant data in<br />
percentage terms would not be comparable with other selected districts. For this reason, the data for <strong>Islamabad</strong> is<br />
not presented in this table.<br />
Districts usually have few funds available for development projects, except when extra allocations<br />
are made to the districts through special instruments. But only a small percentage of funds allocated<br />
for Annual Development Programmes (ADPs) of the districts are used for education-related projects.<br />
In the district-level ADPs, priority is usually given to roads, electricity or parks. District ADPs make few or<br />
no allocations for education. The table below presents data about the funds allocated for educationrelated<br />
projects in the ADPs of the selected districts. As indicated in the table, two districts of Khyber-<br />
Pakhtunkhwa Province (i.e. Abbottabad district and Nowshera district) did not allocate anything at all<br />
for development projects related to education sector in recent years. If any education related projects<br />
were implemented in these districts, these were through the provincial ADP.<br />
In Punjab province (Jhelum District, Multan City District and Faisalabad City District), district<br />
governments have allocated funds for education-related projects but mostly for smaller projects,<br />
leaving the responsibility of larger projects, such as revamping or building new schools, to the<br />
provincial governments. Only Faisalabad City District allocated a significant percentage (36.4 percent)<br />
for education-related development projects (in 2008/09), although it actually represents a small<br />
amount in view of the small size of the total ADP of the district.<br />
9Executive<br />
Summary<br />
1. Introduction 2. The Budget Making Process and<br />
District Management<br />
3. Comparative Analysis of 4. <strong>Islamabad</strong> Capital<br />
District <strong>Education</strong> <strong>Budgets</strong> Territory<br />
5. Abbottabad District 6. Nowshera District 7. City District<br />
Faisalabad<br />
8. Jhelum District 9. Multan City<br />
District<br />
10. Recommendations References
10<br />
<strong>Education</strong> <strong>Budgets</strong>: A Study of Selected Districts of Pakistan<br />
Table 3: <strong>Education</strong> Budget as a Percentage of the District Annual Development Programme,<br />
2009/10<br />
District<br />
Total Development Budget (millions,<br />
PKR)<br />
Development Budget for <strong>Education</strong> Sector<br />
(millions, PKR)<br />
<strong>Education</strong> Budget<br />
as Percentage of Total<br />
Abbottabad 33.60 0.0 0.00<br />
Faisalabad 166.70* 60.70* 36.40<br />
<strong>Islamabad</strong>** - - -<br />
Jhelum 219.80* 6.00* 2.70<br />
Multan 1300.00* 141.00* 10.80*<br />
Nowshera 52.50 0.00 0.00<br />
Source: Annual Budget Books of the Districts, 2008 - 2010<br />
Note: * In 2008/09<br />
** The education budget of <strong>Islamabad</strong> is a part of the overall Federal budget and, therefore, the relevant data in<br />
percentage terms would not be comparable with other selected districts. For this reason, the data for <strong>Islamabad</strong> is<br />
not presented in this table.<br />
3.2 Current <strong>Education</strong> <strong>Budgets</strong><br />
The selected districts differ substantially in terms of per capita current allocations to the education<br />
sector. As the figures in the table below indicate, the per capita allocation is highest in <strong>Islamabad</strong>, with<br />
an allocation of 1,808 PKR in 2009/10. The per capita allocation is the lowest in Faisalabad, which is a<br />
city district but allocated only 777 PKR per capita for current expenditures in 2008/09. 3<br />
After <strong>Islamabad</strong>, per capita allocation is the highest in the district of Jhelum, in Punjab Province,<br />
which allocated 1,422 PKR per capita to the education sector. But the per capita allocations in the two<br />
districts of Khyber-Pakhtunkhwa Province (i.e. Nowshera and Abbottabad) are higher than those of<br />
Faisalabad and Multan, the city districts in Punjab Province.<br />
Table 4: Population and Current <strong>Education</strong> <strong>Budgets</strong><br />
District<br />
Population<br />
(in millions) 1998 Census<br />
Allocation<br />
(millions, PKR) 2009/10<br />
Per Capita Allocation<br />
(PKR) 2009/10<br />
Abbottabad 0.88 1349.00 1533.00<br />
Faisalabad 5.43 4219.40* 777.00*<br />
<strong>Islamabad</strong> 0.80 1446.20** 1808.00**<br />
Jhelum 0.94 1337.00 1422.00<br />
Multan 3.12 2755.00 883.00<br />
Nowshera 0.87 984.80 1132.00<br />
Source: Annual Budget Books of the Districts, 2008 – 2010; Census Report 1998<br />
Note: * In 2008/09<br />
** Excluding relevant allocations for the Ministry, Federal Directorate of <strong>Education</strong> (FDE) or schools run by ministries or<br />
departments other than Ministry of <strong>Education</strong>.<br />
3 The per capita allocations were calculated on the basis of population figures gathered from the 1998 census report. It<br />
is likely that the populations of districts such as Faisalabad, Multan and <strong>Islamabad</strong> have increased at a higher rate than<br />
other districts as a result of migration. If this fact is taken into consideration, the per capita allocations of these districts<br />
would be lower than the ones presented in this table.
11<br />
3.3 Non-salary Allocations<br />
The selected districts also differ in terms of the allocation of non-salary budgets. In 2008/09, both<br />
<strong>Islamabad</strong> and Faisalabad allocated about 7 percent of the districts’ total current budgets for nonsalary<br />
expenditures, as against 5.9 percent by Nowshera, 4.1 percent by Abbottabad, 4 percent by<br />
Multan and only 0.53 percent by Jhelum. A similar trend was evident in 2009/10, with <strong>Islamabad</strong><br />
allocating the highest percentage and Jhelum the lowest.<br />
Without adequate non-salary allocations, schools cannot maintain a good quality of service provision,<br />
because non-salary allocations are the only source of funds to meet the needs related to utilities,<br />
travel, stationery, communications and repair and maintenance.<br />
Table 5: Non-salary Allocations, 2008/09 and 2009/10<br />
District<br />
Non-salary allocation 2008/09 Non-salary allocation 2009/10<br />
Allocation<br />
(in millions PKR)<br />
As % of<br />
Current Budget<br />
Allocation<br />
(in millions PKR)<br />
As % of<br />
Current Budget<br />
Abbottabad 47.80 4.10 53.20 4.00<br />
Faisalabad 295.70 7.00 n/a n/a<br />
<strong>Islamabad</strong>* 91.30 7.00 93.40 6.50<br />
Jhelum 6.00 0.53 8.00 0.60<br />
Multan 87.20 4.00 144.40 5.40<br />
Nowshera 57.60 5.90 42.90 4.40<br />
Source: Annual Budget Books of the Districts, 2008-2010<br />
Note: * Excluding relevant allocations for the Ministry and Federal Directorate of <strong>Education</strong> (FDE)<br />
Executive<br />
Summary<br />
1. Introduction 2. The Budget Making Process and<br />
District Management<br />
3. Comparative Analysis of 4. <strong>Islamabad</strong> Capital<br />
District <strong>Education</strong> <strong>Budgets</strong> Territory<br />
5. Abbottabad District 6. Nowshera District 7. City District<br />
Faisalabad<br />
8. Jhelum District 9. Multan City<br />
District<br />
10. Recommendations References
12<br />
<strong>Education</strong> <strong>Budgets</strong>: A Study of Selected Districts of Pakistan<br />
4. <strong>Islamabad</strong> Capital Territory<br />
4.1. Profile of the District<br />
<strong>Islamabad</strong> is capital of Pakistan, and is the tenth largest city in the country. The Rawalpindi-<strong>Islamabad</strong><br />
metropolitan area is the third largest in Pakistan with a population of over 4.5 million inhabitants.<br />
Figure 4: Map of Pakistan<br />
Source: Ministry of Foreign Afairs available at http://www.mofa.gov.pk/Maps/PAK_Administrative.jpg<br />
According to census data, the total population of <strong>Islamabad</strong> Capital District (ICT) was 0.8 million in<br />
1998, including 0.43 million males and 0.37 million females. Data from the Institute of Population<br />
Studies indicates that in 2009, the total population of <strong>Islamabad</strong> had grown to 12.1 million including<br />
0.64 million males and 0.57 million females. 4 <strong>Islamabad</strong> is predominantly an urban district. In 2009,<br />
71.9 percent of the district’s population lived in urban areas.<br />
Table 6: Rural and Urban Population of <strong>Islamabad</strong> District, 1998 and 2009 (millions)<br />
Year Urban Rural Total<br />
1998 0.53 0.28 0.80<br />
2009 0.87 0.34 1.21<br />
Source: National Institute of Population Studies (NIPS), <strong>Islamabad</strong><br />
4 National Institute of Population Studies (NIPS), <strong>Islamabad</strong>.
13<br />
Table 7: <strong>Islamabad</strong> City Population, 1998 and 1981<br />
1998 Population 1981 Population<br />
Both Sexes Male Female Average Household<br />
Size<br />
Both Sexes<br />
1981-98 Avg. Annual Growth<br />
Rate<br />
529,180 290,717 238,463 6.11 204,364 5.76%<br />
Source: Population Census Organization, Government of Pakistan<br />
<strong>Islamabad</strong> is one of the districts in Pakistan in which the female population is lower than that of males.<br />
According to estimates for the year 2009, males make up 53.7 percent of the population and females<br />
make up 46.3 percent.<br />
<strong>Islamabad</strong> boasts one of the highest literacy rates in Pakistan: 72.38 percent for the group aged 10 and<br />
above. There are a large number of education institutes in <strong>Islamabad</strong>. The higher education institutes<br />
in the capital are either federally funded or administered by private organizations and almost all of<br />
them are recognized by the Higher <strong>Education</strong> Commission (HEC) of Pakistan. Being the capital city,<br />
<strong>Islamabad</strong> provides its citizens with better infrastructure in nearly all sectors.<br />
<strong>Islamabad</strong> is managed differently as, unlike in the provinces, the city district doesn’t have an elected<br />
district government. Instead, the federal government is directly responsible for development and<br />
service delivery functions in <strong>Islamabad</strong>. There is a widespread perception that per capita resource<br />
allocation for development and service delivery in <strong>Islamabad</strong> is very high compared to other districts<br />
or regions in the country.<br />
4.2. <strong>Education</strong> Sector in <strong>Islamabad</strong><br />
4.2.1 <strong>Education</strong>al Facilities in <strong>Islamabad</strong><br />
There are 401 government schools in <strong>Islamabad</strong>. Of these, 227 are primary schools, 54 are middle<br />
schools, 91 are high schools and 29 are higher secondary schools.<br />
In the urban areas of <strong>Islamabad</strong> Capital Territory there are 121 government schools, while in the rural<br />
areas there are 280 schools. Although 72 percent of the population live in urban areas, most of the<br />
schools are located in the rural areas. This is because the rural population is dispersed over a large area<br />
and there has been a need for more schools in order to provide easy access. In the urban areas, where<br />
the population is concentrated, there are fewer schools but they are bigger and better equipped.<br />
There are also many private schools and colleges in the urban areas, which significantly reduces the<br />
demand for government schools. Private schools are unaffordable for people in the low and middle<br />
income groups, however.<br />
Table 8: Government schools in <strong>Islamabad</strong> Capital Territory<br />
Primary Middle High Higher Secondary Total<br />
Rural 165 45 59 11 280<br />
Urban 62 9 32 18 121<br />
Total 227 54 91 29 401<br />
Source: Ministry of <strong>Education</strong>, <strong>Islamabad</strong><br />
<strong>Islamabad</strong> has 160 government schools for girls and 152 government schools for boys. In addition,<br />
there are 89 co-educational government schools.<br />
Executive<br />
Summary<br />
1. Introduction 2. The Budget Making Process and<br />
District Management<br />
3. Comparative Analysis of 4. <strong>Islamabad</strong> Capital<br />
District <strong>Education</strong> <strong>Budgets</strong> Territory<br />
5. Abbottabad District 6. Nowshera District 7. City District<br />
Faisalabad<br />
8. Jhelum District 9. Multan City<br />
District<br />
10. Recommendations References
14<br />
<strong>Education</strong> <strong>Budgets</strong>: A Study of Selected Districts of Pakistan<br />
4.2.2. Quality of <strong>Education</strong><br />
Although government schools and colleges are built on sizable plots with good physical infrastructure<br />
and have facilities such as playgrounds, these educational institutions have few funds available for<br />
maintaining facilities or improving the classroom environment. In addition, government schools<br />
have inadequate and ineffective monitoring, little incentive for good performance and a lack of<br />
accountability. Hence, the quality of the education provided at government schools is low.<br />
The quality of education in the government schools and colleges of <strong>Islamabad</strong> has deteriorated over<br />
recent years. This deterioration has led to greater demand for private schools, which have grown<br />
significantly, especially in urban parts of <strong>Islamabad</strong>. Private schools provide a higher quality of<br />
education, in spite of being located in residential areas, in hired buildings without proper classrooms<br />
or playgrounds.<br />
4.3. <strong>Education</strong> Budget Analysis<br />
4.3.1. Budget Overview<br />
In the year 2009/10, the total annual budget for the government-run education institutions in the<br />
capital and federal areas was 2,281 million PKR, as against 2,059 million PKR (revised budget) for the<br />
year 2008/09.<br />
In per capita terms, in 2009/10 the government spent 1,886 PKR for pre-primary to college education<br />
in <strong>Islamabad</strong>. In 2000-01, the government allocated only 743 PKR per capita for education. Hence,<br />
over the past decade, the per capita allocation increased by 154 percent.<br />
As shown in the table below, allocations to the education sector increased from 1.245 billion PKR in<br />
2004/05 to 2.281 billion PKR in 2009/10. This represents an average increase of about 15.3 percent per<br />
year in nominal terms. As the inflation rate has been lower than the average increase, this indicates<br />
an increase in allocations for the education sector in real terms. Over the past two years however, the<br />
average nominal increase was lower, at 14.3 percent in 2008/09 and 10.9 percent in 2009/10. Given<br />
the higher inflation rates in this period, this is also a reduction in real terms.<br />
Table 9: Yearly Allocations, 2004/05 to 2009/10<br />
Year<br />
Total Allocation<br />
(PKR)<br />
Increase over the previous<br />
year (%)<br />
Allocation for Employees Related<br />
Expenses (%)<br />
Operating Expenses and<br />
Others (%)<br />
2009/10 2,281,967,000 10.90 88.90 11.10<br />
2008/09 2,058,105,000 14.30 87.70 12.30<br />
2007/08 1,800,248,000 - 6.00 87.40 12.60<br />
2006/07 1,917,731,000 31.20 87.60 12.40<br />
2005/06 1,462,178,000 17.40 91.90 8.10<br />
2004/05 1,245,168,000 23.90 91.30 8.70<br />
Source: Annual <strong>Budgets</strong> 2004/05 to 2009/10<br />
As shown in the table above, in recent years at least 87 percent of funds have been allocated to<br />
employee related (salary) expenses, with a relatively small percentage of the funds allocated to<br />
operating and other expenses, which is insufficient. In the years 2004/05 and 2005/06, only 8.7 percent<br />
and 8.1 percent of the total allocated budget was allocated for non-salary expenses. In 2007/08, as the<br />
non-salary allocations went up to 12.6 percent of the total allocated budget but since then the nonsalary<br />
allocations have declined again, down to 11.1 percent the total budget in 2009/10.
15<br />
4.3.2. Allocations for Various Levels of <strong>Education</strong><br />
The annual budget for government educational institutions in <strong>Islamabad</strong> includes allocations for the<br />
following sub-sectors:<br />
yy<br />
yy<br />
yy<br />
yy<br />
Pre-primary and primary education affairs and services<br />
Secondary education affairs and services<br />
Tertiary education affairs and services<br />
Administration<br />
The table below shows the allocations within the education sector in <strong>Islamabad</strong>. It shows that the<br />
highest percentage of funds is allocated for secondary education (i.e. from grade 6 to 10), followed by<br />
tertiary education (including college education up to masters level).<br />
Table 10: Allocations within the <strong>Education</strong> Sector<br />
Pre-primary and primary education affairs<br />
and services<br />
Secondary education affairs and<br />
services<br />
Budget Estimate<br />
2006-2007<br />
Budget Estimate<br />
2007-2008<br />
Budget Estimate<br />
2008-2009<br />
Budget Estimate<br />
2009-2010<br />
474,114,000 363,403,000 449,900,000 519,400,000<br />
785,216,000 723,353,000 851,001,000 926,830,000<br />
Tertiary education affairs and services 655,613,000 708,944,000 752,005,000 830,058,000<br />
Administration 4,788,000 4,548,000 5,199,000 5,679,000<br />
Total 1,917,731,000 1,800,248,000 2,058,105,000 2,281,967,000<br />
Source: Annual <strong>Budgets</strong> 2006/07 to 2009/10<br />
The pre-primary and primary education sub-sector is allocated a significantly lower amount of funding.<br />
In 2009/10, 22.8 percent of the total education sector budget was allocated for pre-primary and<br />
primary education compared to 40.6 percent and 36.4 percent for secondary and tertiary education<br />
respectively.<br />
The condition of primary schools, especially in rural areas, is poor, reflecting the fact that the amount<br />
of funding allocated to pre-primary and primary education is low. It is clear that additional funding<br />
is required for this sub-sector. The overall allocation for the education sector should be increased, so<br />
that funding for the pre-primary and primary sub-sector can be increased without reducing the funds<br />
available for secondary or tertiary education.<br />
Table 11: Sub-sector Allocations for Primary, Secondary and Tertiary <strong>Education</strong><br />
Pre-Primary and Primary <strong>Education</strong> Affairs<br />
and Services<br />
Secondary <strong>Education</strong> Affairs and<br />
Services<br />
2003-2004<br />
(%)<br />
2004-2005<br />
(%)<br />
2005-2006<br />
(%)<br />
2006-2007<br />
(%)<br />
2007-2008<br />
(%)<br />
2008-2009<br />
(%)<br />
2009-2010<br />
(%)<br />
25.00 23.70 26.10 24.70 20.20 21.90 22.80<br />
39.30 39.40 39.80 40.90 40.20 41.30 40.60<br />
Tertiary <strong>Education</strong> Affairs and Services 35.70 36.90 34.20 34.20 39.40 36.50 36.40<br />
Administration - - - 0.20 0.30 0.30 0.20<br />
Total 100 100 100 100 100 100 100<br />
Source: Annual <strong>Budgets</strong> 2003/04 to 2009/10<br />
Executive<br />
Summary<br />
1. Introduction 2. The Budget Making Process and<br />
District Management<br />
3. Comparative Analysis of 4. <strong>Islamabad</strong> Capital<br />
District <strong>Education</strong> <strong>Budgets</strong> Territory<br />
5. Abbottabad District 6. Nowshera District 7. City District<br />
Faisalabad<br />
8. Jhelum District 9. Multan City<br />
District<br />
10. Recommendations References
16<br />
<strong>Education</strong> <strong>Budgets</strong>: A Study of Selected Districts of Pakistan<br />
4.3.3. Allocations to Primary <strong>Education</strong> in <strong>Islamabad</strong><br />
In 2009/10, the total allocation for pre-primary and primary education in <strong>Islamabad</strong> Capital Territory was<br />
519,400,000 PKR. This allocation was 15.5 percent higher than that for the previous year (449,900,000<br />
PKR). An examination of the previous five years indicates, however, that the average annual increase<br />
was only 7.3 percent. Although the allocation went up significantly in 2006/07 it decreased again in<br />
the following year. In view of high inflation rates over the years, overall, there has been a reduction in<br />
the allocation of funds in real terms.<br />
In 2009/10, 92.4 percent of the total funds were allocated to salaries (employee related expenses),<br />
leaving only 7.6 percent of the total funds to cover the costs of communication, utilities, travel, physical<br />
assets and repair and maintenance. A similar allocation was made in previous years, with 91.6 percent<br />
of total funds allocated to salaries in 2008/09, 89.8 percent in 2007/08, and 89.9 percent in 2006/07.<br />
The figures indicate that a declining percentage of funds are being allocated to non-salary expenses.<br />
On average, in 2009/10, each primary school in <strong>Islamabad</strong> was allocated 697 PKR per month for<br />
communications, 3,070 PKR per month for utilities, 6,021 PKR per month for repair and maintenance<br />
and 875 PKR for travel and transportation. These allocations are inadequate for providing quality<br />
services, but it can be acknowledged that these amounts are higher than the amounts allocated to<br />
schools in other districts in the country.<br />
Budget allocations are not determined on the basis of actual assessment of the needs. Few funds<br />
are allocated for communication because it is assumed that the schools only need to communicate<br />
with their staff and with education department officials. As there is no recognition of the need for<br />
communication between teachers and parents of the students, allocations for such communication<br />
expenses are not made. Likewise, it is assumed that the costs of utilities remain the same; any increases<br />
are ignored. Thus the allocations are inadequate.<br />
Table 12: Pre-primary and Primary <strong>Education</strong> Budget Allocations, 2005-2010 (in PKR)<br />
Budget Estimate<br />
2005/06<br />
Budget Estimate<br />
2006/07<br />
Budget Estimate<br />
2007/08<br />
Budget Estimate<br />
2008/09<br />
Budget Estimate<br />
2009/10<br />
Employee related expenses 365,786,000 426,416,000 326,381,000 412,000,000 480,000,000<br />
Operating expenses 11,410,000 14,705,000 15,304,000 16,000,000 17,000,000<br />
Communication 1,978,000 2,380,000 2,373,000 1,872,000 1,900,000<br />
Utilities 4,263,000 5,157,000 6,304,000 7,433,000 8,362,000<br />
Occupancy costs 175,000 220,000 149,000 325,000 308,000<br />
Travel and transportation 1,645,000 2,044,000 2,198,000 2,170,000 2,383,000<br />
General 3,349,000 4,904,000 4,280,000 4,200,000 4,047,000<br />
Physical assets/ purchase<br />
of durable goods<br />
500,000 14,305,000 5,356,000 5,500,000 6,000,000<br />
Repair and maintenance 3,500,000 16,688,000 16,362,000 16,400,000 16,400,000<br />
Machinery and equipment 828,000 93,000 1,712,000 1,050,000 1,230,000<br />
Furniture and fixture 1,035,000 4,290,000 4,280,000 4,200,000 4,500,000<br />
Buildings and structure 1,637,000 10,700,000 9,938,000 9,785,000 7,280,000<br />
Computer equipment 122,000 1,050,000 2,050,000<br />
General 620,000 310,000 315,000 1,340,000<br />
TOTAL 381,196,000 472,114,000 363,403,000 449,900,000 519,400,000<br />
Source: Annual <strong>Budgets</strong> 2005/06 – 2009/10
17<br />
4.3.4. Middle Schools in <strong>Islamabad</strong><br />
In 2009/10, the total annual budget for middle schools in <strong>Islamabad</strong> Capital Territory was 187,400,000<br />
PKR. This was 15.5 percent higher than for the previous year. Since 2005/06, the total allocation for<br />
middle schools has increased by about 16 percent per year. In comparison, the allocation for preprimary<br />
and primary schools increased by only 7.3 percent on average.<br />
As in the case of primary schools, most of the funds allocated for middle schools are consumed by<br />
salaries and allowances. In 2009/10, employee related allocations accounted for 94.6 percent of the<br />
total budget, with similar allocations in the previous four years. Between 2005 and 2010, non-salary<br />
allocations ranged between 4.5 percent and 7.5 percent.<br />
In 2009/10, each middle school was allocated, on average, 1,267 PKR per month for communication<br />
costs, 3,315 PKR per month for utilities, 1,281 per month for travel and transportation and 6,173 per<br />
month for repair and maintenance.<br />
Table 13: Secondary <strong>Education</strong> (Middle Schools) Budget Allocations, 2005-2010 (in PKR)<br />
Budget Estimate<br />
2005/06<br />
Budget Estimate<br />
2006/07<br />
Budget Estimate<br />
2007/08<br />
Budget Estimate<br />
2008/09<br />
Budget Estimate<br />
2009/10<br />
Employee related expenses 100,650,000 132,927,000 147,493,000 152,502,000 177,200,000<br />
Operating expenses 2,400,000 3,175,000 3,609,000 4,200,000 5,200,000<br />
Communication 521,000 561,000 705,000 721,000 821,000<br />
Utilities 813,000 999,000 1,152,000 1,652,000 2,148,000<br />
Occupancy Costs 111,000 111,000 - - -<br />
Travel and Transportation 380,000 605,000 653,000 653,000 830,000<br />
General 575,000 899,000 1,099,000 1,174,000 1,401,000<br />
Physical assets 400,000 3,568,000 689,000 1,000,000 1,000,000<br />
Computer equipment - 2,200,000 - - -<br />
Purchase of plant and<br />
machinery<br />
Purchase of furniture<br />
and fixture<br />
300,000 732,000 274,000 300,000 -<br />
100,000 636,000 415,000 700,000 1,000,000<br />
Repair and maintenance 800,000 3,992,000 4,364,000 4,500,000 4,000,000<br />
Machinery and<br />
equipment<br />
168,000 207,000 432,000 440,000 360,000<br />
Furniture and fixture 280,000 149,000 1,088,000 825,000 1,200,000<br />
Buildings and structure 352,000 3,575,000 2,754,000 2,795,000 1,795,000<br />
Computer and<br />
equipment<br />
61,000 90,000 440,000 600,000<br />
General - - - - 45,000<br />
Total 104,250,000 143,662,000 156,155,000 162,202,000 187,400,000<br />
Source: Annual <strong>Budgets</strong> 2005/06 – 2009/10<br />
4.3.5. High Schools in <strong>Islamabad</strong><br />
In the year 2009/10, high schools in <strong>Islamabad</strong> were allocated 739,430,000 PKR. This allocation was<br />
only 7.35 percent higher than the previous year while, on average, inflation has been around 13.8<br />
percent.<br />
Executive<br />
Summary<br />
1. Introduction 2. The Budget Making Process and<br />
District Management<br />
3. Comparative Analysis of 4. <strong>Islamabad</strong> Capital<br />
District <strong>Education</strong> <strong>Budgets</strong> Territory<br />
5. Abbottabad District 6. Nowshera District 7. City District<br />
Faisalabad<br />
8. Jhelum District 9. Multan City<br />
District<br />
10. Recommendations References
18<br />
<strong>Education</strong> <strong>Budgets</strong>: A Study of Selected Districts of Pakistan<br />
In high schools, as in other schools, most of the funds are allocated to employee related expenditures<br />
such as salaries and allowances. During the past five years, between 3.5 percent and 8.2 percent of<br />
the total funds were allocated to operating and other expenses. The employee related allocations<br />
amounted to 94.1 percent of the total high school budget in 2009/10, with similar figures in the<br />
previous five years.<br />
In 2009/10, employee related allocations covered the salaries and allowances for 4,395 employees<br />
working in the high schools in <strong>Islamabad</strong>. Out of these employees, 656 belonged to officer grades,<br />
while the remaining 3,739 were lower grade staff. The average number of employees working in each<br />
high school was about 48.<br />
Each high school receives, on average, about 25,536 per month for operating expenses, including<br />
communications, utilities, travel and transportation and general items like stationery. More specifically,<br />
for each month, only 3,531 PKR is made available for communication costs, 11,568 PKR for utilities,<br />
7,383 PKR for travel and transportation and 3,053 PKR for general expenses.<br />
It was observed that, on average, 8,767 PKR is allocated to each high school per month, for repair<br />
and maintenance. This category includes repairs and maintenance of transport, machinery and<br />
equipment, furniture and fixtures, computer equipment and buildings and structures.<br />
Table 14: Secondary <strong>Education</strong> (High Schools) Budget Allocations, 2005 – 2010 (in PKR)<br />
Budget Estimate<br />
2005/06<br />
Budget Estimate<br />
2006/07<br />
Budget Estimate<br />
2007/08<br />
Budget Estimate<br />
2008/09<br />
Budget Estimate<br />
2009-/10<br />
Employee related expenses 460,777,000 588,870,000 523,399,000 645,000,000 695,553,000<br />
Operating expenses 13,000,000 20,138,000 21,884,000 21,884,000 27,885,000<br />
Communication 3,000,000 3,459,000 3,800,000 3,851,000 3,856,000<br />
Utilities 6,008,000 7,374,000 8,623,000 9,753,000 12,633,000<br />
Travel and<br />
transportation<br />
2,565,000 4,696,000 5,088,000 5,112,000 8,062,000<br />
General 1,427,000 4,609,000 4,373,000 3,168,000 3,334,000<br />
Transfers 85,000 85,000 85,000 94,000<br />
Physical assets 1,800,000 15,992,000 7,789,000 7,789,000 6,324,000<br />
Computer equipment - 4,400,000 175,000 - 0<br />
Other stores and stock 535,000 1,100,000 1,150,000 1,180,000 1,180,000<br />
Purchase of transport - 880,000 - - 0<br />
Purchase of plant and<br />
machinery<br />
Purchase of furniture<br />
and fixture<br />
1,000,000 2,779,000 2,002,000 1,697,000 1,544,000<br />
265,000 6,833,000 4,462,000 4,912,000 3,600,000<br />
Repair and maintenance 1,700,000 16,469,000 14,041,000 14,041,000 9,574,000<br />
Transport 951,000 1,301,000 1,448,000 1,448,000 2,500,000<br />
Machinery and<br />
equipment<br />
428,000 1,108,000 1,150,000 944,000 944,000<br />
Furniture and fixture 321,000 2,720,000 2,576,000 2,360,000 2,360,000<br />
Buildings and structures - - 8,050,000 8,109,000 2,000,000<br />
Computer equipment - - 242,000 590,000 1,180,000<br />
General - - 575,000 590,000 590,000<br />
Total 477,277,000 641,554,000 567,198,000 688,799,000 739,430,000<br />
Source: Annual <strong>Budgets</strong> 2005/06 – 2009/10
19<br />
4.3.6 Development Budget<br />
<strong>Islamabad</strong>, being the Capital Territory, falls within the jurisdiction of the federal government; it is not<br />
treated as a separate entity when making allocations. Its development needs, including the ones<br />
relating to the education sector, are made as part of the Annual Development Plan (ADP) of the<br />
federal government. Thus, the education-related development projects for <strong>Islamabad</strong> are presented<br />
in the development budget of the Ministry of <strong>Education</strong>.<br />
In the budget for 2009/10, the federal government allocated 209 million PKR for building 11 new<br />
schools in <strong>Islamabad</strong>. Furthermore, 556.8 million PKR was allocated for upgrading existing institutions,<br />
introducing new classes, building new blocks or providing additional facilities. These are significant<br />
allocations and are very high if compared to other districts where allocations for education-related<br />
development projects are very low.<br />
Implementation of development projects in <strong>Islamabad</strong> has encountered some serious problems,<br />
however, resulting in long delays and poor quality of work. The reasons for this include the following:<br />
yy<br />
yy<br />
yy<br />
yy<br />
yy<br />
yy<br />
yy<br />
yy<br />
The tendering process is slow as a result of bureaucratic red tape<br />
The staff responsible for implementing development projects are overburdened<br />
Delays in acquiring land or preparing feasibility reports<br />
Limited availability of competent contractors<br />
Delays in the procurement of funds<br />
Late submission of progress reports<br />
Frequent transfers and postings of responsible staff<br />
Reduction in funds or downward revisions in allocations in the budget<br />
4.4. Major Issues and Concerns<br />
From a review of budget documents and discussions with stakeholders, including teaching staff, a<br />
range of concerns have been identified that should be addressed by the concerned authorities. These<br />
concerns are summarized below.<br />
yy<br />
The salaries of teaching and other staff in government schools are low, which makes it difficult for<br />
the education sector to attract high quality staff. The living expenses in <strong>Islamabad</strong> are very high, so<br />
staff must take additional jobs, such as offering tuition services in private academies or at homes.<br />
This situation makes it difficult for the staff to focus exclusively on their own profession.<br />
yy<br />
As few funds are available to cover operating expenses, equipment, repair and maintenance, the<br />
facilities in government schools cannot be mobilized or kept in working condition. So, while toilets<br />
exist, funds are not sufficient to keep them in a hygienic and working condition. Likewise, science<br />
laboratories and playgrounds are not maintained.<br />
yy<br />
Schools face problems in accessing the funds allocated for them. The directors of primary and<br />
middle schools do not have the power of drawing and disbursing and, therefore, they must seek<br />
approval from the concerned authorized officers i.e. drawing and disbursing officers. The process is<br />
inefficient and can facilitate corruption.<br />
yy<br />
The budget making process is not open, transparent or participatory. It is dominated almost<br />
exclusively by the bureaucrats, while the views of parents, students and communities regarding the<br />
needs and priorities are neglected.<br />
yy<br />
Elected representatives exercise few or no rights, as there is no elected body for <strong>Islamabad</strong>. On the<br />
other hand, the federal parliament, which has the authority to exercise this privilege, does not have<br />
the time to discuss these matters.<br />
Executive<br />
Summary<br />
1. Introduction 2. The Budget Making Process and<br />
District Management<br />
3. Comparative Analysis of 4. <strong>Islamabad</strong> Capital<br />
District <strong>Education</strong> <strong>Budgets</strong> Territory<br />
5. Abbottabad District 6. Nowshera District 7. City District<br />
Faisalabad<br />
8. Jhelum District 9. Multan City<br />
District<br />
10. Recommendations References
20<br />
<strong>Education</strong> <strong>Budgets</strong>: A Study of Selected Districts of Pakistan<br />
yy<br />
The procedure relating to utilization of funds is not transparent and lacks effective public oversight<br />
and accountability. As a result, there are complaints regarding inefficient utilization and delays in<br />
implementation of projects.<br />
yy<br />
Insufficient funds are allocated to meet special or additional needs of schools or teachers in rural<br />
areas. For instance, teachers serving in rural schools, especially in girls’ schools, are not provided with<br />
transport, which makes it difficult for them to get to work and affects their morale. The teachers<br />
working in rural areas should be encouraged through providing incentives to overcome the<br />
hardships involved in working in those areas.<br />
4.5. Recommendations<br />
On the basis of the findings of the study, the following recommendations are suggested for the<br />
attention of policy makers, relevant authorities and stakeholders.<br />
yy<br />
The overall allocation for education in <strong>Islamabad</strong> Capital Territory should be increased.<br />
yy<br />
The condition of primary schools should be improved by providing adequate resources, facilities<br />
and technical support.<br />
yy<br />
Needs for operating expenses should be determined through an open consultation process,<br />
involving all the stakeholders. When determining needs, it is important to take into account the<br />
necessity of more frequent communications and interactions among teachers and parents as well<br />
as improving the classroom environment for higher quality learning.<br />
yy<br />
An appropriate and relatively easy mechanism should be established, by which the directors (heads)<br />
of primary and middle schools can claim and utilize the funds allocated for them.<br />
yy<br />
In the absence of a local government system in <strong>Islamabad</strong>, a citizens’ consultative forum should<br />
be established to discuss education-related matters pertaining to <strong>Islamabad</strong> Capital Territory<br />
and advise the federal government on important issues and needs. The elected members of the<br />
National Assembly from <strong>Islamabad</strong>, eminent citizens, civil society representatives, heads of selected<br />
educational institutions and representatives of the FDE and Ministry of <strong>Education</strong> could constitute<br />
this forum.<br />
yy<br />
The special needs of girls’ schools and rural schools should be carefully identified and emphasized.<br />
yy<br />
Annual budgets must make necessary provisions with the primary objective of providing high<br />
quality education services to all.
21<br />
5. Abbottabad District<br />
5.1. Profile of the District<br />
Abbottabad is a district in Khyber-Pakhtunkhwa Province. The district is predominantly mountainous<br />
and rugged, and experiences high levels of rain and humidity. Abbottabad District has an area of<br />
1,967 square kilometres and, according to the latest estimate, it has a population of about one million<br />
people.<br />
Figure 5: Map of Khyber Pakhtunkhwa and Northern Areas<br />
Executive<br />
Summary<br />
1. Introduction 2. The Budget Making Process and<br />
District Management<br />
3. Comparative Analysis of 4. <strong>Islamabad</strong> Capital<br />
District <strong>Education</strong> <strong>Budgets</strong> Territory<br />
5. Abbottabad District 6. Nowshera District 7. City District<br />
Faisalabad<br />
8. Jhelum District 9. Multan City<br />
District<br />
Source: Survey of Pakistan available at http://www.khyber.org/maps.shtml<br />
Abbottabad is the largest city in the Hazara region. The district is divided in 2 tehsils: Abbottabad and<br />
Havelian. There are 51 Union Councils in the district.<br />
10. Recommendations References
22<br />
<strong>Education</strong> <strong>Budgets</strong>: A Study of Selected Districts of Pakistan<br />
Figure 6: Map of Abbottabad District<br />
Source: Hazara Division Map IST Ed. 1987. Published by Survey of Pakistan<br />
According to official estimates, Abbottabad is essentially a rural district, with 81.4 percent of the<br />
population living in rural areas and 18.6 percent in urban areas. In 1951, the population of the district<br />
was only 0.32 million, and reached one million by 2009.<br />
Table 15: Population of Abbottabad District, 1951-2009 (in Millions)<br />
1951 1961 1972 1981 1998 2009 (Estimated)<br />
Population 0.32 0.35 0.53 0.65 0.88 1.00<br />
Average annual growth rate - 1.05 3.43 2.52 1.82 -<br />
Source: Population Census Organization, Government of Pakistan, District Census Report of Abbottabad, 1999
23<br />
In general, the primary school enrolment rates in Abbottabad are impressive but enrolment rates<br />
decline gradually towards the higher levels of education.<br />
According to the 1998 census figures, the literacy rate in the district was 56.6 percent. In the rural areas<br />
it was 51.85 percent and in the urban areas it was 76.73 percent. These literacy rates are significantly<br />
higher than the rates reported during the previous census, in 1981. In 1981, the overall literacy rate in<br />
the district was only 27.97 percent, with only 23.32 percent of the population in the rural areas being<br />
literate. By 2009, the literacy rate in Abbottabad district had improved further. It is estimated that the<br />
overall literacy rate of those aged over 10 years has increased to 65 percent.<br />
There is a large gap in literacy rates between males and females. According to the 2009 census, the<br />
literacy rate of males in Abbottabad was 79 percent while for females it was only 52 percent. The gap<br />
has diminished over the past decade, however. In 1998, the literacy rate among males stood at 74.52<br />
percent and at 39.11 percent among females. In rural areas the female literacy rate was even lower, at<br />
only 34.18 percent. But when these literacy rates are compared to districts of Punjab Province or other<br />
districts of the Khyber- Pakhtunkhwa region, they are impressive.<br />
Table 16: Literacy Ratio by Sex and Location, 1981 and 1998<br />
1981 1998<br />
Both Male Female Both Male Female<br />
All Areas 27.97 43.48 11.23 56.61 74.52 39.11<br />
Rural 23.32 39.16 7.34 51.85 71.33 34.18<br />
Urban 53.87 63.32 39.02 76.73 85.69 64.71<br />
Source: Population Census Organization, Government of Pakistan, District Census Report of Abbottabad, 1999<br />
5.2. <strong>Education</strong> Sector in Abbottabad<br />
5.2.1. <strong>Education</strong> Facilities in Abbottabad<br />
There are 1,867 public schools in Abbottabad District. Out of these, 1,214 are for boys and 653 are<br />
for girls. This indicates a huge gender gap in terms of government-run educational facilities. The<br />
table below shows that little progress was made between 1998 and 2009. The number of schools<br />
increased by only 615, from 1,252 in 1998 to 1,867 in 2009. There was even less progress in terms of<br />
girls’ educational institutions, with girls’ schools increasing by only 131; from 522 in 1998 to 653 in<br />
2009.<br />
Table 17: Number and Types of Schools in Abbottabad, 1998 and 2009<br />
1998 2009<br />
Male Female Total Male Female Total<br />
Primary Schools 523 455 978 1 050 540 1590<br />
Middle Schools 68 40 108 90 77 167<br />
High Schools 62 24 86 62 29 91<br />
Higher Secondary Schools 7 3 10 12 7 19<br />
Total 730 522 1 252 1 214 653 1 867<br />
Source: Bureau of Statistics, Government of Khyber-Pakhtunkhwa, E&S <strong>Education</strong> Department, Finance & Planning<br />
Department and the <strong>Education</strong> Management Information System (EMIS); and Population Census Organization, Government<br />
of Pakistan.<br />
Executive<br />
Summary<br />
1. Introduction 2. The Budget Making Process and<br />
District Management<br />
3. Comparative Analysis of 4. <strong>Islamabad</strong> Capital<br />
District <strong>Education</strong> <strong>Budgets</strong> Territory<br />
5. Abbottabad District 6. Nowshera District 7. City District<br />
Faisalabad<br />
8. Jhelum District 9. Multan City<br />
District<br />
10. Recommendations References
24<br />
<strong>Education</strong> <strong>Budgets</strong>: A Study of Selected Districts of Pakistan<br />
5.2.2. Financing of <strong>Education</strong><br />
Public education in Abbottabad district is predominantly financed through funds provided by the<br />
federal and provincial governments. The main channel for this financing is the Provincial Finance<br />
Commission (PFC) award, through which the provincial government distributes funds among the<br />
districts falling within its jurisdiction. The criteria for allocations include: population size and level of<br />
development. The needs for development and non-development requirements of the districts are<br />
evaluated periodically through official channels by the provincial government.<br />
The district is dependent on provincial or federal funding because it mobilizes very limited resources<br />
on its own. In Abbottabad the federally funded <strong>Education</strong> Sector Reforms Programme and <strong>Education</strong><br />
for All (EFA) projects are significant sources of funds. In addition, a number of foreign-aid programmes<br />
provide funding for various components of education through grants, loans and technical assistance.<br />
5.2.3. <strong>Education</strong> Quality<br />
The district is among a few districts known for their good results in the education sector, particularly<br />
because of good private education facilities but also because of some well-known government-run<br />
institutions. Interestingly, the institutions offering the highest quality of schooling mostly serve the<br />
settlers and boarders rather than the local population. Local people are often not able to send their<br />
children to the good schools and higher education institutions located within the district, as they<br />
tend to have lower incomes.<br />
In general, the quality of education in government schools is below expectations and of minimum<br />
standards. It is particularly so in schools in rural and remote areas. The poor quality of infrastructure<br />
and instruction in government schools is responsible for low enrolments, high drop-out rates and<br />
high failure rates. Enrolment is especially low in secondary schools. This is because only a small<br />
proportion of students progress to these levels. Of those enrolled at this stage, about two thirds are<br />
male students.<br />
5.3. <strong>Education</strong> Budget Analysis<br />
5.3.1. Budget Overview<br />
In 2009/10, the total education budget of the district was 1,349 million PKR; higher than the allocation<br />
of 1,165 million PKR in 2008/09 but slightly lower than the revised allocation in 2008/09 (about 1,394.5<br />
million PKR). In 2006-07, the total district education budget was only RS 941.6 million, which means<br />
that the budget increased by about 43 percent between 2006 and 2010. On average, this amounts<br />
to an increase of about 10 percent per year, which is very low given the high inflation in Pakistan over<br />
this period.<br />
In addition, funds have also been spent in the district through the provincial <strong>Education</strong> Sector Reform<br />
(ESR) programme. In 2009/10, the total education budget for the district, inclusive of ESR funds, was<br />
1,352 million PKR. In per capita terms, Abbottabad District had an allocation of 1,352 PKR in 2009/10.<br />
The table below provides data about the district education budget as well as for the ESR. As shown<br />
in the table, the allocation for ESR has decreased significantly since 2006/07. The table also shows the<br />
percentage change in the total education budget of the district compared to the previous year.
25<br />
Table 18: Total <strong>Education</strong> Budget of Abbottabad District (Estimates and Revised Estimates),<br />
2006 - 2010<br />
Year Total District Budget (PKR) ESR (PKR) TOTAL (PKR) Change from the previous year (%)<br />
Budget Estimate 2006/07 941,560,880 16,757,000 958,317,880 -<br />
Revised Estimate 2006/07 960,215,000 16,287,000 976,502,000 1.9<br />
Budget Estimate 2007/08 1,084,754,630 4,193,000 1,088,947,630 11.5<br />
Revised Estimate 2007/08 1,139,703,430 4,405,000 1,144,108,430 5.1<br />
Budget Estimate 2008/09 1,165,264,800 2,936,000 1,168,200,800 2.1<br />
Revised Estimate 2008/09 1,394,486,500 3,041,000 1,397,527,500 19.6<br />
Budget Estimate 2009/10 1,349,231,520 2,961,000 1,352,192,520 -3.2<br />
Source: District Government, Abbottabad<br />
5.3.2. Salary Budget<br />
The Elementary and Secondary <strong>Education</strong> Department is the largest among the departments of<br />
Abbottabad district. The salary component of the department budget constitutes the largest financial<br />
allocation of the budget. Over the past four years, the salary component of the education department<br />
budget was around 78 percent of the total budget each year.<br />
In 2006/07 the salary allocation was 933,082,710 PKR and rose to 1,296,021,810 PKR by 2009/10, an<br />
increase of 39 percent. In this department, the number of posts increased from 9,931 in 2006/07 to<br />
10,160 in 2009/10.<br />
Table 19: Salary Component of the <strong>Education</strong> Department Budget, Abbottabad District<br />
Year Salary Budget (PKR) Total Budget (PKR) ESR (PKR)<br />
Budget Estimate 2006/07 933,082,710 941,560,880 16,757,000<br />
Revised Estimate 2006/07 940,360,580 960,215,000 16,287,000<br />
Budget Estimate 2007/08 1,036,305,930 1,084,754,630 4,193,000<br />
Revised Estimate 2007/08 1,082,354,950 1,139,703,430 4,405,000<br />
Budget Estimate 2008/09 1,117,427,600 1,165,264,800 2,936,000<br />
Revised Estimate 2008/09 1,331,949,020 1,394,486,500 3,041,000<br />
Budget Estimate 2009/10 1,296,021,810 1,349,231,520 2,961,000<br />
Source: District Government, Abbottabad<br />
A review of the financial releases made monthly by the provincial government to the district<br />
government indicates that, in general, the funds released by the provincial government to the district<br />
government for salary purposes have never matched the related district estimates. The funds issued<br />
under the heading of salaries have usually been 45 percent less than the district estimates. In this<br />
way, the district has consistently been deprived of the financial benefit it could have secured by reallocating<br />
the savings under the salary head for new vacancies occurring during any financial year.<br />
Furthermore, the practice of releasing funds on monthly basis creates hindrances in the effective<br />
management of the salary budget.<br />
In addition, employees of the department often face delays in the approval and release of the Revised<br />
Estimates. The Medical Reimbursement Charges (MRCs) and Leave Salary, including Leave Encashment<br />
admissible at the time of retirement, are the worst-hit subheadings of the salary budget. Being directly<br />
related to the employees’ service benefits and to the motivation of employees, any negative effect has<br />
a significant impact on the professional performance of the staff of this department. This is reportedly<br />
one of the reasons for teachers’ unauthorized leave and for highly inflated and fake MRCs.<br />
Executive<br />
Summary<br />
1. Introduction 2. The Budget Making Process and<br />
District Management<br />
3. Comparative Analysis of 4. <strong>Islamabad</strong> Capital<br />
District <strong>Education</strong> <strong>Budgets</strong> Territory<br />
5. Abbottabad District 6. Nowshera District 7. City District<br />
Faisalabad<br />
8. Jhelum District 9. Multan City<br />
District<br />
10. Recommendations References
26<br />
<strong>Education</strong> <strong>Budgets</strong>: A Study of Selected Districts of Pakistan<br />
Although the provincial government regains the salary shortfall on the basis of actual expenditure<br />
incurred during a financial year, the set procedure and the channels create problems beyond the<br />
control of the district government, especially the <strong>Education</strong> Department. There exist serious capacity<br />
constraints among the Drawing and Disbursing Officers and their support staff in relation to<br />
understanding the various sub-headings of the salary budget and the prescribed budget forms. As a<br />
result, instead of being needs based, the salary budget is often a repetition of the previous financial<br />
year with no possibility of rectification before the Revised Estimates is produced.<br />
5.3.3. Non-salary Budget<br />
The non-salary budget of the department includes various subheadings that provide the funds that<br />
are essential for operation and maintenance and for the routine activities of the administrative offices<br />
and subordinate offices. Besides the vital utilities like electricity, gas, telephone, the non-salary budget<br />
covers costs such as transportation, travelling allowances, repair and maintenance, and purchase<br />
of equipment and furniture. The most important amongst them are Petty Repairs and Classroom<br />
Consumables, which are based on the number of classrooms in a given institution. These funds are<br />
part of the PFC award and their present rate is 5,000 PKR and 2,000 PKR per classroom per annum,<br />
respectively. The mode of utilization is specified and governed under the Parent Teacher Council<br />
(PTC) guidelines issued by the provincial government and amended from time to time. Special funds<br />
amounting 6.7 million PKR were provided to the district under the Terms of Partnership in 2007/08.<br />
These funds were utilized through PTCs for provision of various basic facilities in 2008/09.<br />
The non-salary revised budget estimates rose from 19,854,420 PKR in 2006/07 to 53,209,710 PKR in<br />
2009/10. The grants mentioned under headings of Petty Repairs and Classroom Consumables have<br />
been provided for the last three financial years.<br />
The table below shows that in Abbottabad more than 95 percent of the total education budget is<br />
allocated for salaries, while less than 5 percent is allocated for the non-salary requirements of the<br />
education department and related institutions. In 2006/07, the original allocation for non-salary<br />
expenses was less than 1 percent, but was later increased to 2.1 percent in the revised budget for the<br />
same year.<br />
Table 20: Non-salary Budget Compared with the Total <strong>Education</strong> Budget, 2006-2010<br />
Year Non-salary budget (PKR) Total budget (PKR) Non-salary budget as % of total<br />
Budget Estimate 2006/07 8,478,150 941,560,880 0.90<br />
Revised Estimate 2006/07 19,854,420 960,215,000 2.10<br />
Budget Estimate 2007/08 48,448,700 1,084,754,630 4.50<br />
Revised Estimate 2007/08 57,348,480 1,139,703,430 5.00<br />
Budget Estimate 2008/09 47,837,200 1,165,264,800 4.10<br />
Revised Estimate 2008/09 62,537,480 1,394,486,500 4.50<br />
Budget Estimate 2009/10 53,209,710 1,349,231,520 4.00<br />
Source: District Government, Abbottabad<br />
All non-salary funds are released to the concerned DDOs in time each year but the mechanism of their<br />
utilization and verification is not simple because of various issues. The amount of funds is very small<br />
and even this meagre allocation is not being utilized efficiently.
27<br />
5.3.4 Development Budget<br />
The development needs of the education department are identified and prioritized by the political<br />
leaders representing the constituencies of the district. Most often, the development priorities identified<br />
by political leaders focus on establishing new schools or upgrading existing ones (from primary level<br />
to middle-school level, or from middle to high-school level). But such development needs have been<br />
met by the provincial government or through including them in umbrella schemes of the provincial<br />
ADP. No such project could be funded through the district ADP as the cost of even the smallest school<br />
or upgrade is usually beyond the scope of the union councils’ programme supported by the district<br />
government.<br />
During the past four financial years, 41 new primary schools were established in the district and five<br />
new middle schools. But in these four years, not a single new high school was established (except<br />
for high schools that have been converted from middle schools). This is said to be because primary<br />
schools fit well in the wish lists of the priority-setters. Instead of building one high school comprising<br />
at least 10 classrooms, five primary schools of two classrooms each can be built for the same price.<br />
Table 21: Development Projects, Abbottabad, 2005-2009<br />
2005/06<br />
Number of boys’ schools<br />
Number of girls’ schools<br />
06/07 07/08 08/09 2005/06 06/07 07/08 08/09<br />
New schools Primary 6 3 7 5 2 7 6 5 41<br />
Upgrading from primary to<br />
middle-school level<br />
Upgrading from middle to highschool<br />
level<br />
Source: District Government, Abbottabad<br />
Middle 2 3 5<br />
High 0<br />
4 3 5 1 2 15<br />
2 4 3 3 1 13<br />
The data regarding the upgrading of existing schools, shows that a total of 15 primary schools have<br />
been upgraded to the level of middle schools during the past four years. In the same period, a total of<br />
13 schools were upgraded from middle to high schools.<br />
When examined from gender perspective, it is clear that there has not been any special effort to<br />
reduce the vast disparity in the number of education facilities for boys and for girls. In the past four<br />
years, 20 out of the 41 new primary schools were built for girls and three out of the five middle schools<br />
were built for girls. While almost an equal number of girls’ and boys’ schools were built, there should<br />
be a greater number of girls’ schools being built in order to redress the existing imbalance and to<br />
ensure all girls can access schools easily.<br />
5.4. Major Issues and Concerns<br />
This study has identified several concerns that require the attention of policy makers and other<br />
stakeholders. These concerns are summarized below.<br />
yy<br />
Most of the education sector budget is consumed by employee-related expenses. As a result,<br />
little remains for non-salary expenses. Without adequate provisions for non-salary costs such as<br />
communication, consumables, utilities and transport, it is not possible to expect improvement in<br />
enrolments or in the quality of education delivered in government schools.<br />
yy<br />
The district has very limited resources available for the implementation of development projects.<br />
The district government has not been able to build any new schools from due to the scarcity of the<br />
funds and it has to depend solely on the provincial ADP.<br />
Total<br />
Executive<br />
Summary<br />
1. Introduction 2. The Budget Making Process and<br />
District Management<br />
3. Comparative Analysis of 4. <strong>Islamabad</strong> Capital<br />
District <strong>Education</strong> <strong>Budgets</strong> Territory<br />
5. Abbottabad District 6. Nowshera District 7. City District<br />
Faisalabad<br />
8. Jhelum District 9. Multan City<br />
District<br />
10. Recommendations References
28<br />
<strong>Education</strong> <strong>Budgets</strong>: A Study of Selected Districts of Pakistan<br />
yy<br />
The budget calendar, as provided in the Budget Rules of the Khyber Pakhtunkhwa Government, is<br />
not strictly followed. As a result, the process of budget making, from preparation to implementation,<br />
cannot be executed satisfactorily, and stakeholders are deprived of their right to participation.<br />
yy<br />
There is a vast disparity in the numbers of boys’ and girls’ educational facilities in Abbottabad but<br />
little is being done to address this gap. Girls need more schools (than boys) to be able to have easy<br />
access to education.<br />
yy<br />
Female teachers face difficulties when posted away from their places of residence. It is important<br />
that they are adequately compensated and that they are able to easily get to work (e.g. through<br />
providing transport to female teachers) and perform their duties.<br />
5.5. Recommendations<br />
In view of the findings of this study, the following recommendations are suggested.<br />
yy<br />
An increase is needed in the resources allocated through the PFC award and it is necessary that the<br />
districts also improve their own resource generation capacity and efforts.<br />
yy<br />
It is necessary to increase the non-salary allocations considerably so that schools can operate<br />
effectively.<br />
yy<br />
Efforts should be made to improve the procedures and the capacity of the staff to ensure that<br />
schools can access and utilize the funds efficiently.<br />
yy<br />
The budgetary allocations should be subject to the performance of the relevant institutions. Such<br />
Performance Based Budgeting, with a well defined monitoring policy, can help improve the quality<br />
of education.<br />
yy<br />
All stakeholders, including the students, teachers and communities, should be consulted in the<br />
process of identifying the budgetary needs of schools. Schools should highlight the priorities of the<br />
students, teachers and parents at the time when they submit their proposals.<br />
yy<br />
The Budget Calendar should be followed to ensure public participation in the process.<br />
yy<br />
Adequate provisions should be made for existing girls’ schools and to build new girls’ schools in<br />
order to overcome the disparity in the numbers of educational institutions for boys and girls in the<br />
district.
29<br />
6. Nowshera District<br />
6.1. Profile of the District<br />
Nowshera District is located in Khyber-Pakhtunkhwa Province along the bank of Kabul River. It lies<br />
to the west of Attock District of Punjab province and to the east and south-east of the districts of<br />
Peshawar and Charsada. On its northern border are the districts of Mardan and Swabi and in the<br />
south is the district of Kohat. Nowshera District consists of one tehsil and 48 union councils. In 1998,<br />
Nowshera District had four Municipal Committees, three Cantonments and one Town Committee.<br />
Figure 7: Map of Nowshera District<br />
Executive<br />
Summary<br />
1. Introduction 2. The Budget Making Process and<br />
District Management<br />
3. Comparative Analysis of 4. <strong>Islamabad</strong> Capital<br />
District <strong>Education</strong> <strong>Budgets</strong> Territory<br />
The total area of the district is 1,748 square kilometres. According to the 1998 census figures, its total<br />
population is 0.87 million, including 0.46 million males and 0.42 million females. Census data indicates<br />
that the population growth rate of the district is 2.9 percent per annum and it was estimated that by<br />
2009 the population would be around 1.3 million.<br />
Table 22: Population and Annual increase, 1951-2009 (in Millions)<br />
1951 1961 1972 1981 1998 2009 (Estimated)<br />
Population 0.223 0.227 0.411 0.538 0.874 1.300<br />
Average annual growth - 2.20 3.40 3.20 2.90 -<br />
Source: Population Census Organization, Government of Pakistan, Census Report of Nowshera, 1999<br />
5. Abbottabad District 6. Nowshera District 7. City District<br />
Faisalabad<br />
8. Jhelum District 9. Multan City<br />
District<br />
10. Recommendations References
30<br />
<strong>Education</strong> <strong>Budgets</strong>: A Study of Selected Districts of Pakistan<br />
According to 1998 census data, Nowshera is a predominantly rural district, with only about one<br />
quarter (26 percent) of the population living in urban areas. But in view of current trends, which show<br />
a tendency for migration to urban areas, it is likely that the urban population has increased since 1998.<br />
In 1981, the literacy rate of the district was 23.8 percent. The overall literacy rate increased significantly<br />
between 1981 and 1998. In 1998, the overall literacy rate of the district was 42.5 percent. For females, it<br />
was 22.7 percent, while for males it was 60.6 percent. The improvement in literacy rates was especially<br />
significant for females, as it increased from 8.7 percent in 1981 to 22.7 percent in 1998.<br />
There is a significant rural-urban difference in terms of literacy rates. In 1998, only 37.6 percent of the<br />
population in rural areas was literate, as against 55.6 percent in urban areas. In the years between 1981<br />
and 1998, the literacy rate of rural women increased from 4.9 percent to 18.1 percent, whereas in the<br />
case of rural men it increased from 27.1 percent to 56.5 percent.<br />
Table 23: Literacy Ratio by Sex and Location – 1981 and 1998 – Nowshera District<br />
Area 1981 1998<br />
Both Male Female Both Male Female<br />
All Areas 23.80 36.80 8.70 42.50 60.60 22.70<br />
Rural 16.20 27.10 4.90 37.60 56.50 18.10<br />
Urban 43.50 58.10 21.20 55.60 70.40 36.60<br />
Source: Population Census Organization, Government of Pakistan, District Census Report of Nowshera, 1999<br />
6.2. <strong>Education</strong> Sector in Nowshera<br />
6.2.1. <strong>Education</strong> Facilities<br />
There are 736 functional government-run primary schools in Nowshera District, out of which 425<br />
schools are for boys and 311 are for girls. In 2009, the total number of students enrolled in primary<br />
schools was 113,796 (63,782 boys and 50,014 girls). The number of teachers in the government-run<br />
primary schools is 2,990 (1,832 male teachers and 1,158 female teachers). The average number of<br />
students in government primary schools is 155, and the average teacher-student ratio is 1:38.<br />
Table 24: Numbers of Primary Schools, Students and Teachers in Nowshera District<br />
Number of schools Number of students enrolled Number of teachers<br />
Male 425 63 782 1 832<br />
Female 311 50 014 1 158<br />
Total 736 113 796 2 990<br />
Source: District Government Nowshera<br />
The overall gross enrolment ratio for all schools in the district (including government schools, nongovernment<br />
schools and deeni madaris) is 96 percent. Out of the total, the gross enrolment ratio in<br />
government-run primary schools is 60 percent and in non-government primary schools is 34 percent.<br />
The district has 176 secondary schools (i.e. middle, high and higher secondary schools), out of which<br />
115 are for boys and 61 for girls. A significant gender disparity exists, with 28,570 boys enrolled but<br />
only 15,340 girls enrolled (43,910 students in total). The average number of students enrolled in<br />
government-run secondary schools is 249.
31<br />
Table 25: Numbers of Secondary Schools, Students and Teachers, Nowshera District<br />
Middle schools High schools Higher secondary schools<br />
Schools Students Teachers Schools Students Teachers Schools Students Teachers<br />
Male 50 5175 307 56 18187 809 9 5208 242<br />
Female 37 3345 170 17 7530 183 7 4465 135<br />
Total 87 8520 477 73 25717 992 16 9673 377<br />
Source: District Government Nowshera<br />
The total number of teachers employed in secondary schools in Nowshera District is 1,846 (1,358 male<br />
and 488 female). The average teacher-student ratio in government-run secondary schools is 1:24.<br />
The gross enrolment ratio in government-run secondary schools is 26 percent and in non-government<br />
secondary schools is 11 percent. Altogether, the gross enrolment ratio is 37 percent at secondary<br />
level. In other words, about 63 percent of children of secondary level age are either out of school or<br />
in deeni madaris.<br />
6.2.2. Financing of <strong>Education</strong><br />
The district depends primarily on grants received from the provincial government under the PFC<br />
award. The district’s income sources include local taxes, license fees, investment fees, tender fees,<br />
building rents and donations. A very high percentage of the district budget is spent on recurrent<br />
expenses, such as salaries.<br />
6.2.3. Quality of <strong>Education</strong><br />
As in other districts, the public sector education system in Nowshera suffers from serious weaknesses<br />
in terms of providing high quality education. As a result, parents who can afford to do so send their<br />
children to private schools. The poor quality of education in government schools is a result of a<br />
range of factors including inadequate facilities (e.g. lack of drinking water and shortage of toilets),<br />
lack of well-trained and motivated teachers, limited availability of subject specialists, lack of science<br />
laboratory equipment and weak monitoring and accountability.<br />
6.3. <strong>Education</strong> Budget Analysis<br />
6.3.1. Budget Overview<br />
In 2009/10, the total annual budget of Nowshera District was 1,547 million PKR, slightly lower than the<br />
revised budget of 1,599.5 million PKR for the previous year (2008/09). About 80 percent of the total<br />
annual budget was allocated to salaries, with the remaining 20 percent allocated to non-salary and<br />
development expenditures.<br />
In 2009/10, the district budget for the education sector was 984.8 million PKR, which amounted to<br />
63.7 percent of the total budget of the district. The education budget allocated 941.9 million PKR<br />
for salaries and 42.9 million PKR for non-salary expenditures. Accordingly, only 4.4 percent of the<br />
education budget was allocated for non-salary expenditures. In per capita terms, Nowshera District<br />
allocated about 757.5 PKR per person for education in 2009/10.<br />
Executive<br />
Summary<br />
1. Introduction 2. The Budget Making Process and<br />
District Management<br />
3. Comparative Analysis of 4. <strong>Islamabad</strong> Capital<br />
District <strong>Education</strong> <strong>Budgets</strong> Territory<br />
5. Abbottabad District 6. Nowshera District 7. City District<br />
Faisalabad<br />
8. Jhelum District 9. Multan City<br />
District<br />
10. Recommendations References
32<br />
<strong>Education</strong> <strong>Budgets</strong>: A Study of Selected Districts of Pakistan<br />
Table 26: Nowshera District Budget (in Millions PKR)<br />
Year Salaries Non-salary expenses Total<br />
2009/10 Estimate 941.90 42.90 984.80<br />
2008/09 Revised 917.80 57.60 975.40<br />
2008/09 Estimate 786.80 40.70 827.50<br />
2007/08 Revised 788.60 46.00 834.60<br />
2007/08 Estimate 789.30 39.50 828.80<br />
Source: Annual <strong>Budgets</strong>, Nowshera District Government<br />
6.3.2. Salary Budget<br />
In 2009/10, the total salary budget for the primary schools in the district was 449.7 million PKR, 26.7<br />
percent higher than the original allocation of 355 million PKR in 2008/09. This increase in the salary<br />
budget is primarily because of the government’s decision to increase the staff salaries.<br />
In 2009/10, only 35 percent of the total salary budget for the education sector was allocated for the<br />
salaries of the staff of girls’ primary schools. This reflects gender discrimination in the provision of<br />
school facilities in the district, with fewer schools for girls and therefore fewer teachers.<br />
Table 27: Salary Budget of Primary Schools, 2008-2010 (PKR)<br />
Salary Budget 2008/09 Salary Budget 2008/09 Revised Salary Budget 2009/10<br />
Boys’ primary schools 233,008,700 271,742,480 292,540,680<br />
Girls’ primary schools 121,998,400 149,602,020 157,159,870<br />
Total (all primary schools) 355,007,100 421,344,500 449,700,550<br />
Salary budget of boys’ primary schools (%) 65.6 64.5 65<br />
Salary budget of girls’ primary schools (%) 34.4 35.5 35<br />
Source: Annual <strong>Budgets</strong>, Nowshera District Government<br />
Between 2008/09 and 2009/10, the number of staff decreased in both girls’ and boys’ schools. For girls’<br />
primary schools, there were 1,574 posts in 2009/10, as against 1,747 in 2008-09. While in boys’ schools<br />
there were 2,144 posts in 2009/10, as against 2,284 in 2008/09.<br />
In 2009/10, the total salary budget for middle schools was 107 million, which is less than the revised<br />
salary budget of 132 million PKR for the previous year. There was, however, an increase of 40.8 percent<br />
over the original allocation of 76 million PKR for the year 2008/09.<br />
It is evident from the salary allocations that in middle schools, as in primary schools, there is a huge<br />
disparity between the numbers of boys’ and girls’ schools. In 2009/10, only 34.4 percent of the total<br />
salary allocation for middle schools was allocated for employees of girls’ schools. In both boys’ and<br />
girls’ schools there has been a decrease in the number of employees in recent years. In 2009/10, there<br />
were 1,574 posts at boys’ schools, as against 1,747 in 2008/09. At girls’ middle schools, there were 352<br />
posts, as against 321 in 2008/09.
33<br />
Table 28: Salary Budget of Middle Schools in Nowshera District, 2008-2010<br />
Salary Budget 2008/09 (PKR) Salary Budget 2008/09 Revised (PKR) Salary Budget 2009/10 (PKR)<br />
Boys’ middle schools 47,567,800 104,284,090 70,274,250<br />
Girls’ middle schools 28,544,100 27,697,480 36,877,380<br />
Total (all middle schools) 76,111,900 131,981,570 107,151,630<br />
Salary budget of boys’ middle schools (%) 62.5 79 65.6<br />
Salary budget of girls’ middle schools (%) 37.5 21 34.4<br />
Source: Annual <strong>Budgets</strong>, Nowshera District Government<br />
The allocations of the salary budget depend on the numbers of employees working in each school. In<br />
Nowshera District this number ranges between 34 and 46 at higher secondary schools. In spite of the<br />
decline in the number of staff in recent years, the salary budget has been increasing. This is because<br />
of the annual increase in the staff salaries.<br />
Table 29: Salary Budget of Higher Secondary Schools in Nowshera District, 2008-2010<br />
Number of Staff Salary Budget 2008/09<br />
(PKR)<br />
Salary Budget 2008/09<br />
Revised (PKR)<br />
Salary Budget 2009/10<br />
(PKR)<br />
Govt. Higher Secondary School, Pirpiai 43 7,057,400 7,763,510 8,340,840<br />
Govt. Higher Secondary School, Risalpur 46 7,761,000 8,606,590 11,945,590<br />
Govt. Girls Higher Secondary School, Dak<br />
Ismaiel<br />
Govt. Girls Higher Secondary School,<br />
Rashakai<br />
Source: Annual <strong>Budgets</strong>, Nowshera District Government<br />
34 3,976,900 3,997,460 4,792,090<br />
35 2,849,400 3,502,250 4,636,200<br />
High schools in Nowshera District normally have a staff of between 17 and 37 persons, though there<br />
are some schools with fewer or more staff. Annual salary allocations of high schools generally range<br />
between 2.2 million and 6.8 million PKR.<br />
The table below shows the salary budgets from a randomly selected group of high schools (three<br />
boys’ and three girls’ high schools).<br />
Table 30: Salary Budget of High Schools in Nowshera District, 2008-2010<br />
Number of Staff Salary Budget 2008/09<br />
(PKR)<br />
Salary Budget 2008/09<br />
Revised (PKR)<br />
Salary Budget 2009/10<br />
(PKR)<br />
Govt. High School, Makhulkay 17 2,246,600 2,192,900 2,252,380<br />
Govt. High School, Gandheri Payan 18 2,189,500 2,253,300 2,513,630<br />
Govt. High School, Pahari Kati Khel 18 2,444,700 2,391,520 2,680,320<br />
Govt. Girls High School, Shaidu 33 4,229,200 4,823,230 5,180,920<br />
Govt. Girls High School, Kheshgi 19 2,187,100 2,358,570 2,665,390<br />
Govt. Girls High School, Pirpiai 37 6,159,600 6,497,060 6,788,150<br />
Source: Annual <strong>Budgets</strong>, Nowshera District Government<br />
Executive<br />
Summary<br />
1. Introduction 2. The Budget Making Process and<br />
District Management<br />
3. Comparative Analysis of 4. <strong>Islamabad</strong> Capital<br />
District <strong>Education</strong> <strong>Budgets</strong> Territory<br />
5. Abbottabad District 6. Nowshera District 7. City District<br />
Faisalabad<br />
8. Jhelum District 9. Multan City<br />
District<br />
10. Recommendations References
34<br />
<strong>Education</strong> <strong>Budgets</strong>: A Study of Selected Districts of Pakistan<br />
6.4.3. Non-salary Budget<br />
As in other districts, very limited funds, ranging from between 2.62 percent to 5.84 percent, have been<br />
made available for non-salary expenditures in recent years. Though there have been some increases<br />
in the non-salary allocation it remains a very small percentage of the total budget.<br />
Table 31: Non-Salary Budget Vis-à-Vis the Total <strong>Education</strong> Budget<br />
Year Non-salary budget (PKR) Total budget (PKR) Non-salary budget as % of total<br />
Budget Estimate 2006/07 19,583,500 748,818,000 2.62<br />
Revised Estimate 2006/07 22,456,403 725,546,738 3.10<br />
Budget Estimate 2007/08 3,9464,050 789,260,694 5.00<br />
Revised Estimate 2007/08 46,029,098 788,580,100 5.84<br />
Budget Estimate 2008/09 40,680,603 786,821,800 5.17<br />
Source: Annual <strong>Budgets</strong>, Nowshera District Government<br />
The funds allocated for non-salary expenses are usually insufficient to cover the requirements of each<br />
school. In 2008/09, for example, only 0.105 million PKR was allocated for science equipment needs in<br />
the whole district. This amount could only meet the equipment needs of two schools.<br />
6.4.4 Development Budget<br />
Since most of the district budget is consumed by salaries and allowances, few funds are available for<br />
non-salary or developmental needs. In the Annual Development Programme in 2009/10 few funds<br />
were allocated for development projects in the education sector. Three ongoing projects (under the<br />
Special Programme) received RS 1.6 million PKR in 2009/10.<br />
Development projects for education sector are usually implemented by the provincial government<br />
through the provincial ADP and there is little participation of the district government in the decisionmaking<br />
at the provincial level.<br />
The table below lists 15 education-related development projects implemented by the Khyber-<br />
Pakhtunkhwa provincial authorities in Nowshera District between 2005/06 and 2008/09. Of the 195<br />
schools affected by the projects, 120 were boys’ schools and 75 were girls’ schools. It is clear from these<br />
figures that the provincial government has not made it a priority to build or upgrade girls’ schools<br />
despite the relative lack of education facilities for girls.<br />
Table 32: Annual Development Programme, 2005/06 to 2008/09<br />
S# Name of scheme with year<br />
Girls’ schools<br />
(No.)<br />
Boys’ schools<br />
(No.)<br />
Total allocation<br />
(Million PkR)<br />
Total cost<br />
(Million PkR)<br />
1 Upgrade of five middle schools to high schools ( 2006/07) 2 3 2.900 26.240<br />
2 Provision of basic facilities in primary schools in Nowshera<br />
(2006/07)<br />
30 45 4.000 48.499<br />
3 Establishment of 10 primary schools in Nowshera (2006/07) 4 6 9.174 16.080<br />
4 Establishment of seven girls’ primary schools in District Nowshera<br />
(2007/08)<br />
5 Establishment of eight boys’ primary schools in Nowshera<br />
(2007/08)<br />
7 0 5.000 11.788<br />
0 8 4.500 13.472<br />
6 Establishment of nine primary schools in Nowshera (2008/09) 3 6 0.000 23.814<br />
7 Reconstruction of building of GHS No.2 Nowshera (2005/06) - 2 26.870 26.870
35<br />
S# Name of scheme with year<br />
8 Construction/Reconstruction of three secondary schools in<br />
Nowshera (i.e. GGHS Pabbi; GHS Saleh Khana; GHS Khaisari)<br />
(2006/07)<br />
Girls’ schools<br />
(No.)<br />
Boys’ schools<br />
(No.)<br />
Total allocation<br />
(Million PkR)<br />
Total cost<br />
(Million PkR)<br />
1 2 7.500 40.722<br />
9 Establishment of Nowshera public school (2006/07) - 1 0.000 100.000<br />
10 Construction of 50 additional classrooms in schools in Nowshera<br />
(2007/08)<br />
18 32 13.268 31.744<br />
11 Upgrade of seven primary schools in Nowshera (2007/08) 3 4 4.080 28.737<br />
12 Upgrade of seven middle schools to high schools in Nowshera<br />
(Year 2007/08)<br />
2 5 6.000 43.796<br />
13 Reconstruction of building of GHS No.1 Nowshera (2007/08) - 1 7.704 11.407<br />
14 Upgrade of five primary schools to middle schools in Nowshera<br />
(2008/09)<br />
3 2 0.000 26.530<br />
15 Upgrade of five middle schools to high schools (2008/09) 2 3 0.000 38.960<br />
Total 75 120 90.996 488.659<br />
Source: Annual <strong>Budgets</strong> of the Khyber-Pakhtunkhwa Province Government, 2005/06 to 2008/09<br />
6.4. Major Issues and Concerns<br />
A number of issues and concerns were identified relating to the education budget in Nowshera, as<br />
listed below.<br />
yy<br />
The overall education budget of the district is very low and is not adequate to meet its education<br />
needs.<br />
yy<br />
The non-salary budget of schools in Nowshera is very low and needs to be substantially increased.<br />
Currently, the schools cannot meet their basic needs during the year and, as a result, the quality of<br />
education suffers.<br />
yy<br />
The district government has the capacity to develop new projects in the education sector but the<br />
scarcity of the funds and the lack of resources make it reliant on the provincial government for the<br />
execution of such projects.<br />
yy<br />
There is a huge disparity in terms of available educational facilities for boys compared to girls.<br />
yy<br />
Stakeholders, such as teachers, students and communities, currently have little input in assessing<br />
needs and determining priorities with regard to the budget preparation process.<br />
6.5. Recommendations<br />
The related recommendations are presented below.<br />
yy<br />
It is recommended that the size of the education budget be increased. The district government is<br />
advised to take steps to increase its own revenues and also seek an increase in the funds provided<br />
by the provincial government under the PFC award.<br />
yy<br />
It is recommended that the provincial government provide additional resources to the district<br />
instead of implementing development projects in the elementary and secondary education sector<br />
on its own.<br />
yy<br />
The relative lack of education facilities for girls needs to be addressed, especially at the secondary<br />
level where there are far fewer girls’ high schools than boys’ high schools. It is recommended that<br />
each annual development programme should accord priority to female education until the disparity<br />
is removed.<br />
Executive<br />
Summary<br />
1. Introduction 2. The Budget Making Process and<br />
District Management<br />
3. Comparative Analysis of 4. <strong>Islamabad</strong> Capital<br />
District <strong>Education</strong> <strong>Budgets</strong> Territory<br />
5. Abbottabad District 6. Nowshera District 7. City District<br />
Faisalabad<br />
8. Jhelum District 9. Multan City<br />
District<br />
10. Recommendations References
36<br />
<strong>Education</strong> <strong>Budgets</strong>: A Study of Selected Districts of Pakistan<br />
yy<br />
The budget making process should be improved and made consistent with the budget rules.<br />
The annual budget for the education sector should be need-based and should be prepared and<br />
approved through a transparent and open process.<br />
yy<br />
The district government should be given the authority and responsibility for planning and<br />
implementing development projects.<br />
7. City District Faisalabad<br />
7.1. Profile of the District<br />
Faisalabad is one of the major cities in Pakistan, the largest after Karachi and Lahore. It is widely<br />
known for its textile industry. The total area of the district is 5,856 square kilometres. It is bounded by<br />
Hafizabad and Sheikhupura to the north and northeast, by Sheikhupura, Okara and Sahiwal to the<br />
east and southeast, and by Jhang and Toba Tek Singh to the west and southwest.<br />
Under Local Government Ordinance 2001, Faisalabad was declared as a City District. Until 2001, it had<br />
the status of divisional headquarters within the overall administrative arrangement of the provincial<br />
government. The City District consists of eight towns: Lyallpur, Madina, Jinnah, Iqbal, Samundri,<br />
Tandianwala, Jaranwala and Chak Jhumra.<br />
In 1901, Faisalabad was a small town, with a total population of only 9,171. Its population increased<br />
rapidly, reaching 179,000 in 1951 and 2,009,000 in 1998. 5<br />
Table 33: Population of Faisalabad City, 1981 and 1998<br />
Total Population in 1981 Total Population in 1998 Male Population in 1998 Female Population in 1998 Total Population in 2010 (estimated)<br />
1,104,209 2,008,861 1,053,085 955,776 2,480,878<br />
Source: Population Census Organization, Government of Pakistan, District Census Report of Faisalabad<br />
Between 1951 and 1998, the population has increased at a rate of between 1.4 percent and 4.10<br />
percent.<br />
Table 34: Population and Percentage Increase 1951-1998<br />
1951 1961 1972 1981 1998<br />
Population (in millions) 1.549 1.990 3.164 3.562 5.430<br />
Average growth rate 2.50 4.10 1.40 2.50<br />
Source: Population Census Organization, Government of Pakistan, District Census Report of Faisalabad<br />
According to census data, in 1998 42.7 percent of the population of Faisalabad lived in urban areas.<br />
At that time, Faisalabad district included one municipal corporation, three municipal committees and<br />
four town committees. In view of the broader trend of rural-urban migration, it is expected that the<br />
urban population has further increased since 1998.<br />
In 1998 the literacy rate of the district was 51 percent. This represented a significant increase in literacy<br />
since 1981 when the literacy rate was 31.8 percent. For women the literacy rate in 1998 was 42.2<br />
percent while for men it was 60.9 percent. In 1981 the literacy rate for women was 20.7 percent.<br />
5 These figures are for the Faisalabad city only, not for the whole district.
37<br />
There is a significant disparity in literacy rates between rural and urban areas. In 1998, only 42.5 percent<br />
of the population in rural areas were literate, as against 64.2 percent in urban areas. The disparity was<br />
particularly large for women. In rural areas only 30.3 percent of women were literate, while in urban<br />
areas the literacy rate for women was 57.9 percent. Rural literacy rates have improved over the years,<br />
however. Between 1981 and 1998, the literacy rate of rural women increased from 14.1 percent to<br />
30.3 percent.<br />
Table 35: Literacy Ratio by Sex and Location – 1981 and 1998<br />
1981 1998<br />
Both Male Female Both Male Female<br />
All Areas 31.8 41.6 20.7 51.9 60.9 42.2<br />
Rural 25.6 36 14.1 42.5 53.9 30.3<br />
Urban 46.2 54.6 36.5 64.2 69.8 57.9<br />
Source: Population Census Organization, Government of Pakistan, District Census Report of Faisalabad<br />
7.2. <strong>Education</strong> Sector in Faisalabad<br />
7.2.1. <strong>Education</strong> Facilities<br />
In Faisalabad City District, the total number of schools is 2,838, including 1,522 schools for boys and<br />
1,316 schools for girls. Thus, there is a significant disparity in the numbers of girls’ and boys’ schools.<br />
Table 36: Public Sector Schools in Faisalabad District<br />
Boys’ schools Girls’ schools Total<br />
Mosque Schools 135 4 139<br />
Primary Schools 1,053 858 1,911<br />
Middle Schools 126 300 426<br />
Secondary Schools 198 138 336<br />
Higher Secondary Schools 10 16 26<br />
Total 1,522 1,316 2,838<br />
Source: District <strong>Education</strong> Department<br />
About 4,858 education posts (17 percent of the total employment posts) are vacant in the district.<br />
This is a significant percentage, especially given that the total number of posts is believed to be less<br />
than the required number. As a result of the large number of vacancies, many schools have insufficient<br />
numbers of teachers. This is particularly the case in relation to subject specialists, such as English<br />
teachers, in almost all types of schools.<br />
Executive<br />
Summary<br />
1. Introduction 2. The Budget Making Process and<br />
District Management<br />
3. Comparative Analysis of 4. <strong>Islamabad</strong> Capital<br />
District <strong>Education</strong> <strong>Budgets</strong> Territory<br />
5. Abbottabad District 6. Nowshera District 7. City District<br />
Faisalabad<br />
8. Jhelum District 9. Multan City<br />
District<br />
10. Recommendations References
38<br />
<strong>Education</strong> <strong>Budgets</strong>: A Study of Selected Districts of Pakistan<br />
Figure 8: Staff Positions in the <strong>Education</strong> Sector, Faisalabad City District, 2009<br />
30000<br />
25000<br />
20000<br />
15000<br />
10000<br />
5000<br />
0<br />
Sanctioned Posts Filled Posts Vacant Posts<br />
Source: District Budget Books<br />
7.2.2. Financing of <strong>Education</strong><br />
In City District Faisalabad, government-run education up to the secondary level is predominantly<br />
financed through funds provided by the federal and provincial governments. As in other districts,<br />
the main channel for this financing is the PFC award, whereby the provincial government distributes<br />
funds among the districts falling within its jurisdiction. The City District mobilizes very few resources<br />
on its own. In the 2008/09 budget, the Own Source Revenue (OSR) of the district amounted to only<br />
280 million PKR, which was a very small amount in relation to the size of the district and its population.<br />
Under the local government system, the provincial government issues the funds to the district<br />
governments, which are empowered to decide how to spend the funds. This is decided through<br />
voting in the district council. But as most of the budget must be spent on staff salaries, the district<br />
government can only decide the allocation of a small amount of the funds.<br />
7.2.3. The quality of <strong>Education</strong><br />
As is the case in other districts, the quality of education in Faisalabad government-run schools is<br />
generally perceived as being poor, although there are some notable exceptions. Drop-out rates in<br />
government-run schools are high. This is partly due to general societal problems such as the need<br />
for children to work to support their families, but also because of the lack of good facilities and lack<br />
of well-trained and motivated teaching staff, which lead to poor learning outcomes among students.<br />
Given the low quality of many government-run schools, a large number of private schools have been<br />
established, which charge high fees and thereby can afford to provide better facilities as well as welltrained<br />
and motivated teachers and, therefore, provide a higher quality of education.<br />
7.3. <strong>Education</strong> Budget Analysis<br />
7.3.1. Budget Overview<br />
In 2008/09, the total budget of Faisalabad City District was 6,763.6 million PKR. Out of this amount,<br />
5,549.4 million PKR was allocated to salaries and 1,214.2 million PKR (around 18 percent of the total)<br />
was allocated to non-salary expenses.
39<br />
Figure 9: The Faisalabad City District Budget, 2008/09<br />
Non-salary Budget,<br />
1,214.16, 18%<br />
Salary Budget,<br />
5,549.43, 82%<br />
Out of the total budget of 6,763.6 million PKR, the city district government allocated 4,219.4 million<br />
PKR (62.6 percent) to the education sector. While this appears impressive, the amount of funds is<br />
insufficient to meet the education needs of the population.<br />
7.3.2. Salary and non-salary budget<br />
The education budget of the district is divided into two parts: the non-development budget and<br />
the development budget. In general, the government aims to increase both parts of the education<br />
budget each year, irrespective of the actual needs and requirements.<br />
The non-development budget of the education sector can be divided into salary and non-salary<br />
budgets. The salary budget includes the expected expenditures on salaries and allowances to<br />
employees, whereas the non-salary budget covers expenditures such as communications, utilities,<br />
travel and transportation and maintenance. In 2008/09, out of the total non-development budget<br />
of 4,219.4 million PKR, 3,923.7 million PKR was allocated for salaries and only 295.7 million PKR was<br />
allocated for non-salary expenses.<br />
The non-development budget of the education department is normally not fully utilized due to the<br />
large number of vacant posts, a lack of understanding of disbursement and procurement procedures,<br />
complex audit rules and fear of audit objections. An analysis of the non-development budget for the<br />
year 2007/08, for example, indicates that the education department of Faisalabad City District spent<br />
only 85 percent of the total salary allocation.<br />
Figure 10: Non-development Budget of Faisalabad City District, 2008/09<br />
Non-salary Budget,<br />
295.689, 7%<br />
Salary Budget,<br />
3923.661, 93%<br />
Executive<br />
Summary<br />
1. Introduction 2. The Budget Making Process and<br />
District Management<br />
3. Comparative Analysis of 4. <strong>Islamabad</strong> Capital<br />
District <strong>Education</strong> <strong>Budgets</strong> Territory<br />
5. Abbottabad District 6. Nowshera District 7. City District<br />
Faisalabad<br />
8. Jhelum District 9. Multan City<br />
District<br />
10. Recommendations References
40<br />
<strong>Education</strong> <strong>Budgets</strong>: A Study of Selected Districts of Pakistan<br />
An examination of the figures for the years between 2006/07 and 2008/09 indicates that there has<br />
been only a small increase in the amount of funds allocated to the education sector over this threeyear<br />
period. Although the allocation to the education sector in 2007/08 increased by 24 percent over<br />
the previous year, and the allocation in 2008/09 increased by 14 percent, the actual increase was low<br />
in view of the high inflation rate over this period.<br />
In general, about 93 percent of the non-development budget is allocated for salaries. Only a small<br />
amount remains for expenditures such as operating costs, communications, utilities, travel and<br />
transportation, occupancy costs (rents, etc), stationery, employees’ retirement benefits, grants,<br />
subsidies, transfer allowances, purchases of physical assets and repair and maintenance.<br />
Table 37: Salary and Non-salary <strong>Budgets</strong>, <strong>Education</strong> Sector, 2006/07 – 2008/09<br />
Year<br />
Total non-development budget<br />
(millions, PKR)<br />
Salary budget<br />
(millions, PKR)<br />
Non-salary budget<br />
(millions, PKR)<br />
Percentage of non-salary<br />
expenses in total budget<br />
2006/07 2971.201 2786.253 184.948 6<br />
2007/08 3694.110 3421.341 272.769 7<br />
2008/09 4219.350 3923.661 295.689 7<br />
Source: City District Faisalabad <strong>Budgets</strong><br />
The figure below illustrates the large difference in the amount allocated to salaries compared to the<br />
amount allocated to non-salary expenses.<br />
Figure 11: Salary and Non-salary Allocations, <strong>Education</strong> Sector, Faisalabad City District 2006-<br />
2009<br />
4500<br />
4000<br />
3500<br />
3000<br />
Million Rs.<br />
2500<br />
2000<br />
1500<br />
1000<br />
500<br />
0<br />
2006-7 2007-8 2008-9<br />
Salary budget (PKR in million)<br />
Non-salary budget (PKR in Million)<br />
The salary budget is usually allocated against the number of employment positions in the education<br />
sector of the district. Because many of the posts are vacant, a certain percentage of the salary budget<br />
is not consumed and these funds either lapse or are re-allocated during the year.<br />
In general, schools receive few funds to cover operating expenses. As shown in the table below, very<br />
small amounts are allocated for some expenses. For example, schools receive 119 PKR per month,<br />
on average, for telephone expenses. This amount is not sufficient to even cover the monthly rent for<br />
one telephone line. Similarly, the average amount budgeted for electricity per school per month is
41<br />
464 PKR. This amount is hardly sufficient to run two fans for a month. But even this meagre budget<br />
is higher than what the schools actually receive. The administration of the EDO and DEOs are also<br />
dependent on the same budget, leaving very little for the operating expenses of the schools.<br />
Table 38: Operating Expenses in the <strong>Education</strong> Sector – Selected Categories, 2008/09<br />
Operating expenses Total amount in budget for 2008/09 (PKR) Amount per school, per year (PKR) Amount per school, per month (PKR)<br />
Telephone and trunk calls 4,080,013 1,437 119<br />
Gas 1,493,000 525 44<br />
Electricity 15,806,304 5,568 464<br />
Water 4,581,838 1,614 134<br />
Stationery 7,903,475 2,784 231<br />
Source: City District Faisalabad Budget, 2008/09<br />
Looking at the amounts of the non-salary allocations for several randomly selected schools in<br />
Faisalabad City District, it is clear that no uniform criterion is adopted for making allocations. While<br />
two primary schools have not been allocated any funds at all for operating expenses, physical assets<br />
and repair and maintenance, another primary school has been allocated small amounts for those<br />
expenses.<br />
Table 39: Non-salary <strong>Budgets</strong> of Selected Schools, Faisalabad City District, 2008/09<br />
School name<br />
School level<br />
Salary-related<br />
expenses (PKR)<br />
Operating expenses<br />
(PKR)<br />
Physical assets<br />
(PKR)<br />
Repair and<br />
maintenance (PKR)<br />
GGMMS Chak 240 GB Jaranwala Primary 457 999 0 0 0<br />
GGPS Chak 26 GB Satiana Primary 505 892 20 500 15 000 1 000<br />
GPS Chak 115 GB I Primary 597 351 0 0 0<br />
PRI G. Technical High School,<br />
Faisalabad<br />
High 13 553 894 347 374 300 000 100 000<br />
H.M.G.H.S 164 RB, Faisalabad – 74 High 1 045 720 27 500 100 000 0<br />
PRI G.H.S.S(B)72/GB Jaranwala-2 High 10 891 769 179 609 110 000 60 000<br />
H.M.G.D.P.H.S N. Wala Bangla,<br />
Faisalabad<br />
Source: City District Faisalabad Government<br />
High 2 726 730 49 089 110 000 5 000<br />
A closer examination of the figures reveals that budgets are prepared in an arbitrary manner, without<br />
taking into account the actual needs, as identified by schools themselves, and without considering<br />
where there have been changes in prices. <strong>Budgets</strong> are often prepared by looking at the amount<br />
budgeted the previous year.<br />
It should be noted, however, that in addition to funds allocated in the district budget, primary<br />
and middle schools receive some funding from the provincial government, through the school<br />
management committees (SMCs). Each primary school receives a grant of 25,000 PKR per year, and<br />
each middle school receives 50,000 PKR per year. But these allocations are meagre, amounting to<br />
only around 2,000 PKR per month for primary schools and around 4,000 PKR per month for middle<br />
schools. High Schools do not receive any additional funds from the provincial government. But the<br />
SMCs also manage the Faroogh-e-Taaleem Fund, which is sustained through monthly contributions<br />
by the students.<br />
Executive<br />
Summary<br />
1. Introduction 2. The Budget Making Process and<br />
District Management<br />
3. Comparative Analysis of 4. <strong>Islamabad</strong> Capital<br />
District <strong>Education</strong> <strong>Budgets</strong> Territory<br />
5. Abbottabad District 6. Nowshera District 7. City District<br />
Faisalabad<br />
8. Jhelum District 9. Multan City<br />
District<br />
10. Recommendations References
42<br />
<strong>Education</strong> <strong>Budgets</strong>: A Study of Selected Districts of Pakistan<br />
7.3.3. Development Budget<br />
The development budget is meant for new buildings or for upgrading and expansion of existing<br />
facilities. In 2008/09, the government implemented 98 projects relating to education development,<br />
at an estimated cost of 75.9 million PKR. The average cost of each project is about 0.74 million PKR. But<br />
only 60.7 million PKR was allocated for the development projects in 2008/09; the remaining amount<br />
will be allocated in future years.<br />
The Annual Development Programme of 2008/09 included only three projects regarding building<br />
of new institutions, all the others were projects relating to upgrading facilities. Out of the three new<br />
construction projects, only one was planned to start in 2008/09, the other two projects were ongoing.<br />
The three projects and their budget allocations are presented in the table below.<br />
Table 40: New Sevelopment Projects in the <strong>Education</strong> Sector 2008/09<br />
Project<br />
Construction of Institute of Learning EDO (<strong>Education</strong>)<br />
Faisalabad.<br />
Total cost<br />
(PKR, millions)<br />
Amount spent in<br />
previous years<br />
Budget allocation for 2008/09<br />
(PKR, millions)<br />
17.700 0 17.700<br />
Establishment of Govt. Girls College at Chak Jhumra. 17.633 15.077 1.253<br />
Establishment of Boys College at Chak Jhumra. 18.590 15.967 0.733<br />
Source: Annual Development Plan, City district Government, Faisalabad, 2008/09<br />
It is not clear why only a small amount (1.253 million PKR) was allocated for the establishment of the<br />
Girls Degree College at Chak Jhumra. The total estimated cost of the project is 17.633 million PKR,<br />
and an amount of 15.077 million has already been spent. Given that the remaining amount required<br />
to complete the project is 2.556 million PKR, the allocation of only 1.253 million PKR appears to be<br />
a deliberate attempt to prolong the length of the project. Unfortunately, this is a common practice<br />
in district budget allocations, as the district authorities try to inflate the number of development<br />
projects, causing long delays in the completion of existing projects. Such delays usually result in<br />
increases in the cost of the projects.<br />
In 2008/09, out of the 98 projects for the education sector, only 65 projects were funded. The remaining<br />
ongoing projects, on which some work had already been performed, were not allocated any funds. 6<br />
This indicates that there are long delays in the implementation of projects already approved and<br />
begun. The table below presents some facts about the district’s education development activities<br />
Table 41: Key Points in the Faisalabad City District <strong>Education</strong> Development Budget, 2008/09<br />
The total number of development projects in 2008/09 98<br />
The number of projects started in previous years (ongoing projects) 37<br />
Ongoing projects that will not get funding in 2008/09 33<br />
Amount required to complete ongoing projects<br />
Amount allocated to ongoing projects<br />
New projects begun in 2008/09 61<br />
Budget allocation to new projects starting in 2008/09<br />
Projects that were to be started and completed in 2008/09 54<br />
Source: Annual Development Plan, City district Government, Faisalabad, 2008/09<br />
Amount / Number<br />
22.742 million PKR<br />
2.310 million PKR<br />
58.347 million PKR<br />
6 Annual Development Programme, City District Faisalabad, 2008/09
43<br />
7.4. Major Issues and Concerns<br />
The issues and concerns identified in relation to the education budget of Faisalabad City District are<br />
presented below.<br />
yy<br />
The total number of official posts in the education department of Faisalabad City District is 28,351.<br />
This includes both teachers and support staff. Out of the total, 17 percent of the posts are vacant,<br />
including over 3,000 teaching staff positions.<br />
yy<br />
Even though the districts have responsibility for the education sector, the district authorities have<br />
little autonomy over recruiting new staff or rationalizing staff requirements according to changing<br />
needs.<br />
yy<br />
The district government does not undertake needs based budgeting in the education sector. The<br />
budget for non-salary items is distributed on the basis of the number of classrooms. This approach<br />
benefits only the schools that have proper buildings and not the schools without adequate buildings<br />
(about 15 percent of the schools).<br />
yy<br />
The ad-hoc nature of education planning is particularly visible in the education development<br />
budgets. There is a tendency to ignore ongoing development projects and initiate new projects.<br />
This wastes the money that has been spent on ongoing projects in previous years.<br />
yy<br />
The funds provided to SMCs by the provincial government are not in line with the needs of the<br />
associated schools.<br />
7.5. Recommendations<br />
The related recommendations are presented below.<br />
yy<br />
Vacant posts should be filled immediately to ensure that schools have adequate staff numbers.<br />
yy<br />
District education authorities should be given more powers for local decision making, so that they<br />
can perform their responsibilities more effectively and efficiently.<br />
yy<br />
The education department should initiate needs based budgeting at the school level, so that budget<br />
allocations more realistic and responsive to actual needs.<br />
yy<br />
As few funds are available for development projects, careful plans should be made for spending<br />
these funds and ongoing projects should be completed within a set timeframe.<br />
yy<br />
Non-salary allocations should be increased significantly so that schools can meet their operational<br />
needs. At the same time, a mechanism should be devised to ensure that the procedure for receiving<br />
the allocations is easy and transparent so that the schools can put their plans into practice effectively.<br />
yy<br />
The procedure of providing grants should be improved and made needs-based. There is also room<br />
for improving the capacity of SMCs for utilizing transfers in a transparent and judicious manner.<br />
yy<br />
The budgetary allocations should be subject to the performance of the institutions. Such<br />
performance based budgeting, with a well defined monitoring policy, would help improve the<br />
quality of education.<br />
yy<br />
All stakeholders, including the students and communities, should be able to participate in the<br />
process of identifying the budgetary needs of the schools. This should be made possible at the time<br />
when schools must submit their requirements in response to the Budget Call Letter.<br />
yy<br />
Adequate provisions should be made for the existing girls’ schools and efforts should be made to<br />
reduce the difference in the numbers of educational institutions for boys and girls in the district.<br />
Executive<br />
Summary<br />
1. Introduction 2. The Budget Making Process and<br />
District Management<br />
3. Comparative Analysis of 4. <strong>Islamabad</strong> Capital<br />
District <strong>Education</strong> <strong>Budgets</strong> Territory<br />
5. Abbottabad District 6. Nowshera District 7. City District<br />
Faisalabad<br />
8. Jhelum District 9. Multan City<br />
District<br />
10. Recommendations References
44<br />
<strong>Education</strong> <strong>Budgets</strong>: A Study of Selected Districts of Pakistan<br />
8. Jhelum District<br />
8.1. Profile of the district<br />
Jehlum District is situated in the north-east of Punjab province. It is bounded in the north by<br />
Rawalpindi District, in the south by Mandi Baha-ud-Din, Gujrat and Sargodha, in the east by Azad<br />
Jammu and Kashmir and in the west by Chakwal and Khushab, from which it is separated by the<br />
Kohistan-e-Namak mountain range.<br />
Figure 12: Map of Jhelum District<br />
According to census figures, the total population of Jhelum district was 936,957 in 1998, with a<br />
population density of 261 per square kilometre. The population is largely rural, as shown in the table<br />
below.<br />
It is estimated that in 2009 the population of Jhelum District was 1,103,000, a 15 percent increase<br />
since 1998. In 2009, the rural population was about 73 percent of the total.
45<br />
Table 42: Rural and Urban Populations of Jhelum District, 1998 and 2009<br />
Year Urban Rural Total<br />
1998 252 978 683 979 936 957<br />
2009 (estimated) 297 810 805 190 1 103 000<br />
Source: Population Census Organization, Government of Pakistan<br />
According to the Punjab Provincial <strong>Education</strong> Department’s annual literacy statistics for 2006, Jhelum<br />
District has a literacy rate of 74 percent, which is the highest in Punjab province. The district’s education<br />
department claims that the literacy rate for those aged under 15 years old is as high as 90 percent.<br />
8.2. <strong>Education</strong> Sector in Jhelum<br />
8.2.1. <strong>Education</strong> Facilities<br />
In Jhelum the numbers of boys’ schools and girls’ schools are almost equal. There are 502 government<br />
boys’ schools and 515 government girls’ schools. In these 1,071 schools, 161,726 students are enrolled.<br />
High schools have 562 students per school on average (most of the high schools have 10 classrooms)<br />
and primary schools have 83 students per school on average.<br />
Table 43: Numbers of Boys’ and Girls’ Schools in Jhelum District<br />
Category of school Boys’ Girls’ Total Enrolment<br />
Higher secondary schools 5 6 11 14 364<br />
High schools 55 43 98 55 084<br />
High schools (MC) 0 01 01 436<br />
Elementary schools 61 68 129 26 407<br />
Primary schools 377 376 753 62 353<br />
Community model schools 0 15 15 1 831<br />
Primary schools (MC) 04 06 10 1 251<br />
Total 502 515 1017 161 726<br />
Source: Office of Executive District Officer/ <strong>Education</strong>, DJhelum District<br />
In the 1,017 schools, there are 6,375 teaching posts. But more than 20 percent of these posts are<br />
vacant. There should be 3,552 male teachers but according to the figures collected from the EDO<br />
office in Jhelum, 817 posts (23 percent) are vacant. Similarly, out of 2,823 female teacher posts, 561 (20<br />
percent) are vacant. Among subject specialists, 73 percent of male posts are vacant while 87 percent<br />
of female posts are vacant. This lack of subject specialists directly affects the quality of education in<br />
Jhelum District.<br />
Executive<br />
Summary<br />
1. Introduction 2. The Budget Making Process and<br />
District Management<br />
3. Comparative Analysis of 4. <strong>Islamabad</strong> Capital<br />
District <strong>Education</strong> <strong>Budgets</strong> Territory<br />
5. Abbottabad District 6. Nowshera District 7. City District<br />
Faisalabad<br />
8. Jhelum District 9. Multan City<br />
District<br />
10. Recommendations References
46<br />
<strong>Education</strong> <strong>Budgets</strong>: A Study of Selected Districts of Pakistan<br />
Table 44: Number of Posts in the <strong>Education</strong> Sector, Jhelum District<br />
Name of post<br />
Official posts<br />
Vacant posts<br />
Male Female Total Male Female Total<br />
Principal 9 4 13 6 2 8<br />
Senior headmaster/headmistress 35 20 55 21 13 34<br />
Headmaster/headmistress 17 18 35 0 0 0<br />
Subject specialists 109 60 169 80 52 132<br />
SST 427 294 721 109 86 195<br />
EST 1,145 867 2,012 308 236 544<br />
PST 1,810 1,560 3,370 293 172 465<br />
3,552 2,823 6,375 817 561 1,378<br />
Source: Office of Executive District Officer for <strong>Education</strong>, Jhelum District<br />
Figure 13: Vacant Posts in the <strong>Education</strong> Department of Jhelum District, 2009/10<br />
Percentage<br />
67<br />
60<br />
65<br />
73<br />
87<br />
50<br />
26<br />
29<br />
27<br />
27<br />
16<br />
11<br />
0<br />
0<br />
Principal<br />
Senior headmaster/<br />
headmistress<br />
Headmaster/<br />
headministress<br />
Subject<br />
specialists<br />
SST EST PST<br />
Male<br />
Female<br />
Source: Office of Executive District Officer for <strong>Education</strong>, Jhelum District<br />
Apart from public schools, Jhelum District also has private schools (primary, middle and secondary<br />
levels). The table below indicates the numbers and types of private schools in the district.<br />
Table 45: Numbers and Types of Private Schools in Jhelum District<br />
Boys’ schools Girls’ schools Co-educational schools Total<br />
Primary 2 4 249 255<br />
Middle 2 0 71 73<br />
Secondary 5 1 69 75<br />
Total 9 5 389 403<br />
Source: Census of Private <strong>Education</strong>al Institutions in Pakistan, 1999-2000<br />
About 57,000 children are enrolled in these private schools, including over 26,000 girls. The numbers<br />
of students enrolled in private education in Jhelum are presented in the table below.
47<br />
Table 46: Student Numbers in Private Schools in Jhelum District<br />
Boys’ schools Girls’ schools Total<br />
Primary 26 302 21 117 47 419<br />
Middle 3 735 3 578 7 313<br />
Secondary 1 232 1 653 2 885<br />
Source: Census of Private <strong>Education</strong>al Institutions in Pakistan, 1999-2000<br />
According to the Census of Private <strong>Education</strong>al Institutions in Pakistan in 1999/00, 2,980 teachers were<br />
associated with the private education institutions of Jhelum District. In primary schools 86 percent of<br />
teachers are female, with 1,103 female teachers and 180 male teachers. Female teachers also make up<br />
the majority of teachers in middle and high schools (84 percent and 81 percent respectively).<br />
Table 47: Number of Teachers in Private Schools in Jhelum District<br />
Male teachers Female teachers Total<br />
Primary 180 1103 1283<br />
Middle 106 550 656<br />
Secondary 199 842 1041<br />
Total 485 2495 2580<br />
Source: Census of Private <strong>Education</strong>al Institutions in Pakistan, 1999-2000<br />
The school to teacher ratio in private primary schools is 1:5. The student to teacher ratio in private<br />
primary schools is 1:37.<br />
Table 48: School to Teacher, School to Student, and Student to Teacher Ratios in Private<br />
Schools, Jhelum District<br />
School to Teacher ratio Student to School ratio Student to Teacher ratio<br />
Primary 5 186 37<br />
Middle 9 100 11<br />
Secondary 13 34 3<br />
Source: Census of Private <strong>Education</strong>al Institutions in Pakistan, 1999-2000<br />
8.2.2. Financing of <strong>Education</strong><br />
As in other districts, in Jhelum the public sector education (up to the secondary level) is mainly<br />
financed by the federal and provincial governments through the PFC award. Accordingly, the provincial<br />
government distributes funds among the districts falling within its jurisdiction. Jhelum District faces a<br />
scarcity of resources. In the budget, from 2007/08 for instance, the district’s own revenues amounted<br />
to only 26.3 million PKR, 11 percent of the total annual estimated receipts of 2,444.2 million PKR.<br />
Executive<br />
Summary<br />
1. Introduction 2. The Budget Making Process and<br />
District Management<br />
3. Comparative Analysis of 4. <strong>Islamabad</strong> Capital<br />
District <strong>Education</strong> <strong>Budgets</strong> Territory<br />
5. Abbottabad District 6. Nowshera District 7. City District<br />
Faisalabad<br />
8. Jhelum District 9. Multan City<br />
District<br />
10. Recommendations References
48<br />
<strong>Education</strong> <strong>Budgets</strong>: A Study of Selected Districts of Pakistan<br />
8.3. <strong>Education</strong> Budget Analysis<br />
8.3.1. Budget Overview<br />
In 2009/10, the total education budget of Jhelum District was 1,337 million PKR, which represented<br />
a 19 percent increase from the original allocation of 1,122 million PKR in 2008/09. But the original<br />
allocation of RS 1,122 million was revised down to 1,065 million, so the actual increase was greater.<br />
In 2007/08, the total district education budget was only 1,011 million PKR. Between 2007 and 2010,<br />
the budget has increased by about 32 percent. This amounts to an increase of about 10 percent per<br />
year on average, which is very low given the high inflation in the country.<br />
Table 49: <strong>Education</strong> Sector Budget, Jhelum District<br />
Year Budget (millions, PKR) Change from previous year (millions, PKR) Change from previous year (%)<br />
2007/08 1 011 - -<br />
2008/09 1 065 54 5<br />
2009/10 1 337 272 25.5<br />
Source: Office of EDO Jhelum District Government <strong>Budgets</strong>, 2007 - 2010<br />
In 2008/09, the budget allocation for education increased by 5 percent in nominal terms compared<br />
to the previous year. In real terms this was actually a decrease, as the inflation rate far exceeded the<br />
nominal increase of 5 percent.<br />
In 2009/10 there was a 25 percent increase in the budget compared to the revised budget of 2008/09.<br />
This indicates there may have been some real increase over this year, but only if no subsequent<br />
downward revisions were made during the year. The table below shows that downward revisions are<br />
common.<br />
Table 50: Original and Revised Budget Estimates, <strong>Education</strong> Sector, Jehlum District<br />
Year Original budget (millions, PKR) Revised estimates (millions, PKR) Change (millions, PKR) Change (%)<br />
2007/08 1 046 1 011 (-)35 (-)3<br />
2008/09 1 122 1 065 (-)57 (-)5<br />
2009/10 1 337<br />
Source: District Government <strong>Budgets</strong> 2007-2010, Jhelum District<br />
In per capita terms, the Jhelum District Government spent 8,267 PKR per student per year and 688<br />
PKR per student per month in 2009/10 (provided that the full amount of 1,337 million PKR was spent<br />
during the year).<br />
8.3.2. Salary Budget<br />
The salary component of the district budget for Elementary and Secondary <strong>Education</strong> constitutes<br />
the largest allocation for the education department. This allocation raised from 1,116 million PKR in<br />
2008/09, to 1,330 million PKR in 2009/10, an increase of 13 percent.
49<br />
Table 51: Salary Budget as Percentage of Total Budget<br />
Year Current budget (millions, PKR) Salary budget (millions, PKR) Salary budget compared to total budget (%)<br />
2008/09 1 122 1 116 99.47<br />
2009/10 1 337 1 329 99.40<br />
Source: District Government <strong>Budgets</strong> 2007-2010, Jhelum District<br />
The <strong>Education</strong> Department is the largest of the departments in the district. In this department, the<br />
number of posts is 8,745. Of these, teaching staff consist of 6,375 personnel. The remaining 2,370<br />
either belong to support staff or general administration. The percentage of general and support staff<br />
in the education department is 27, which is very high.<br />
About 1378 positions are vacant in the Jhelum District education department. But it is the practice in<br />
many departments to calculate the budget based on all the existing posts. Thus, at the end of the year,<br />
the budgeted amounts are not fully consumed.<br />
8.3.3. Non-salary Budget<br />
An examination of the education budget of the Jhelum District Government indicates that the salary<br />
component of the education department budget is around 99.5 percent of the total. Only 0.5 percent<br />
of the education budget is allocated to non-salary expenditures. As in other districts, these non-salary<br />
allocations are supposed to cover the costs of utilities, communications, travelling expenses and<br />
maintenance of buildings.<br />
In 2009/10, the district government allocated 4,863,000 PKR for non-salary expenses. The total number<br />
of schools in Jhelum District is 1,017 and, thus, each school received about 4,781 PKR on average.<br />
Accordingly, each school received only 398 PKR per month, on average, for operating expenses. This<br />
amount excludes the administrative expenditures of the EDO and its subordinate offices. This lack<br />
of funds explains the pathetic condition of the public sector schools, in which no water is available<br />
for drinking, no electricity is available for running the fans and no furniture or other facilities can be<br />
maintained. The school administrations either accept these facts or charge the students fees for the<br />
upkeep of school facilities.<br />
More disturbing is the fact that the 0.5 percent allocation for non-salary expenses rarely reaches the<br />
schools. The funds for day-to-day operating expenses are placed at the disposal of administrative<br />
offices and schools find it extremely difficult to access these funds.<br />
School budgets have very few funds allocated to non-salary expenses. Looking at Government<br />
Comprehensive High School, Jhelum, for example, in 2008-09, an amount of 45,000 was allocated<br />
to operating expenses, including 30,000 PKR as utilities charges and 15,000 PKR as communication<br />
expenses. But even this meagre amount was removed from the school budget the following year. In<br />
2009/10, the total allocation of was 7,340,000 PKR and out of this amount, nothing was allocated to<br />
cover operating expenses. It is not known how the school will cover these expenses.<br />
Executive<br />
Summary<br />
1. Introduction 2. The Budget Making Process and<br />
District Management<br />
3. Comparative Analysis of 4. <strong>Islamabad</strong> Capital<br />
District <strong>Education</strong> <strong>Budgets</strong> Territory<br />
5. Abbottabad District 6. Nowshera District 7. City District<br />
Faisalabad<br />
8. Jhelum District 9. Multan City<br />
District<br />
10. Recommendations References
50<br />
<strong>Education</strong> <strong>Budgets</strong>: A Study of Selected Districts of Pakistan<br />
Figure 14: School Budget for the Government Comprehensive High School, 2009/10<br />
Operating Expenses<br />
0 PKR<br />
Pay of officers (BS 16<br />
and above) 365,800 PKR<br />
Employee related expenses<br />
7,340,000 PKR<br />
Total Pay<br />
4,902,000 PKR<br />
Pay of other staff<br />
124,4000 PKR<br />
Regular allowances<br />
2,434,000 PKR<br />
Total allowance<br />
2,438,000 PKR<br />
Other allowances<br />
4,000 PKR<br />
Pay of teaching staff<br />
780,000 PKR<br />
Pay of support staff<br />
464,000 PKR<br />
Figure 15: School Budget for the Government Comprehensive High School, 2008/09<br />
Employee related expenses<br />
6,666,000 PKR<br />
Operating expenses<br />
45,000 PKR<br />
Total pay<br />
4,464,000<br />
Total alowances<br />
2,202,000<br />
Communication<br />
15,000 PKR<br />
Utilities<br />
30,000 PKR<br />
Pay of officers<br />
(BS 16 and above)<br />
3,517,000 PKR<br />
Pay of other staff<br />
947,000 PKR<br />
Regular allowances<br />
2,193,000 PKR<br />
Other allowances<br />
4,000 PKR<br />
Primary and middle schools get some funding support, however, from the provincial government.<br />
As in other districts, these funds are managed by the <strong>Education</strong> EDO in collaboration with the DMO,<br />
and the funds are utilized by the SMCs. Through this mechanism, each primary school gets a grant of<br />
25,000 PKR per year and each middle school receives 50,000 PKR per year. As the non-salary allocation<br />
in the Jhelum district budget is only 0.5 percent of the total education budget, schools have to rely<br />
almost solely on the funds provided through SMCs to cover non-salary expenditures. But these<br />
allocations amount to only around 2,000 PKR per month for primary schools and around 4,000 PKR per<br />
month for middle schools, so are not adequate. This situation is even worse for high schools, which<br />
do not receive any additional funds and have to depend solely on the funds collected through the<br />
Faroogh-e-Taaleem. This fund is maintained through students’ monthly contributions.<br />
8.3.4 Development Budget<br />
In Jhelum District, the local government system is being debated and development schemes of the<br />
district have become victims of the consequent uncertainty. As of August 2010, the development<br />
budget for 2009/10 had not been presented in the district council. When asked, the Finance and<br />
Planning EDO reported that the development budget had been sent to the Punjab Provincial<br />
Government for approval but had not yet been approved.
51<br />
An examination of the previous years’ development budgets indicates that there are two main kinds<br />
of development programmes being implemented in the education sector in Jhelum: one kind is<br />
implemented by the district government through its own ADP and the other kind is implemented<br />
through the grants received from the provincial government.<br />
The total allocation for the development programme in the education sector in 2008/09 was 6.019<br />
million PKR. This amount was allocated to six schemes related to building boundary walls or additional<br />
class rooms. No new schools was planned to be built during the year, nor was there any allocation<br />
for upgrading any schools. The six development schemes require a short time for completion but<br />
they are planned over a period two or three years. This is largely due to local politics whereby local<br />
political leaders insist on the inclusion of schemes for their areas and more development schemes<br />
are approved but, since the overall funding is limited, with small allocations for each. This means they<br />
must be completed over several years. Moreover, the higher number of development schemes makes<br />
the district development plans look more robust. The table below lists the development schemes in<br />
the education sector in Jhelum in 2008/09.<br />
Table 52: Jhelum District Development Schemes 2008/09 - <strong>Education</strong> Sector<br />
Development Schemes<br />
Const./Raising of B/Wall, Gate and Gate Pillars and<br />
Restoration of TMA Building for GGHS No.2 Jhelum<br />
Construction of Boundary Wall GGHS, Kala Gujran,<br />
Tehsil Jhelum<br />
Construction of Boundary Wall MC Girls Primary<br />
School, Machine Mohallah, Tehsil Jhelum<br />
Construction of 4 Classrooms in GGES, Khalas Pur,<br />
Tehsil Jhelum<br />
Construction of 4 Classrooms in GGES, Nagial, Tehsil<br />
Sohawa<br />
Construction of Boundary Wall and Earth Filling in<br />
GBES, Pinanwal, Tehsil PD Khan<br />
Total Cost (millions, PKR)<br />
Expenditure up to 30 June<br />
2008 (millions, PKR)<br />
0.537 0.308 0.229<br />
0.927 0.010 0.917<br />
0.684 0.336 0.348<br />
1.836 0.010 1.826<br />
1.836 0.010 1.826<br />
1.873 1.000 0.873<br />
Total 7.693 1.674 6.019<br />
Source: District Government, Annual Development Plan 2008/09, Jhelum<br />
Allocation for 2008/09 (millions,<br />
PKR)<br />
The Annual Development Plan of Jhelum District indicates that there were no requests for upgradating<br />
and building of new schools in 2008/09. There were 16 Citizen Community Board (CCB)<br />
projects on board in 2008/09 but nothing was allocated to education projects, instead the funds went<br />
towards health, irrigation and road projects.<br />
In 2008/09 the provincial government allocated 251 million PKR for development projects in Jhelum<br />
Districts. These projects included upgrading of existing schools and education sector reform. Here<br />
too, the projects were planned over several years, regardless of their size. The table below lists the<br />
schemes planned by the provincial government.<br />
Executive<br />
Summary<br />
1. Introduction 2. The Budget Making Process and<br />
District Management<br />
3. Comparative Analysis of 4. <strong>Islamabad</strong> Capital<br />
District <strong>Education</strong> <strong>Budgets</strong> Territory<br />
5. Abbottabad District 6. Nowshera District 7. City District<br />
Faisalabad<br />
8. Jhelum District 9. Multan City<br />
District<br />
10. Recommendations References
52<br />
<strong>Education</strong> <strong>Budgets</strong>: A Study of Selected Districts of Pakistan<br />
Table 53: Provincial Grants in the <strong>Education</strong> sector in Jhelum District, 2008/09<br />
Development schemes<br />
Total cost<br />
(millions, PKR)<br />
Expenditure up to 30 June<br />
2008 (millions, PKR)<br />
Allocation for 2008/09<br />
(millions, PKR)<br />
<strong>Education</strong> Sector Reform 64.151 30.812 17.470<br />
Upgrading of schools 72.500 0.000 72.500<br />
Construction of library rooms in 38 elementary<br />
schools<br />
Punjab <strong>Education</strong> Sector Reform Programme<br />
(I, II, III, IV)<br />
9.006 0.000 9.006<br />
428.378 276.319 152.059<br />
Total 468.196 307.131 251.035<br />
Source: District Government, Annual Development Plan 2008/09, Jhelum<br />
In 2008/09 the total development budget for the district, including the grants provided by the<br />
provincial government, amounted to 257.054 million PKR. Of this amount, the share of the district<br />
government was only 2.4 percent. This indicates that the districts have few resources available to plan<br />
and implement the development projects on their own.<br />
8.4. Major Issues and Concerns<br />
The major issues and concerns related to the education sector and its budget in Jhelum district are<br />
as listed below.<br />
yy<br />
Schools have very few funds to cover their operating expenses as no allocations were made in<br />
the budget for this purpose. As a result, the school administrations have to depend upon the<br />
contributions made by the students.<br />
y y More than 25 percent of the in teaching staff positions are vacant in Jhelum District.<br />
yy<br />
The development portion of the education budget is very low and it is not possible for the district<br />
government to start new projects with this small amount.<br />
yy<br />
Funds provided to SMCs by the provincial government are not based on any assessment of needs<br />
of the schools.<br />
8.5. Recommendations<br />
The related recommendations are listed below.<br />
yy<br />
The annual budget should be needs-based and provide for all necessary expenditures. It is necessary<br />
to revisit the education requirements of Jhelum District and set new priorities in the education<br />
sector.<br />
yy<br />
More resources are required for the smooth running of the education system. The district government<br />
should increase the amount of resources allocated to the education sector. An increase in the overall<br />
budget for the education sector in the district will only be possible, however, if the resources of the<br />
district, along with the resources allocated through the PFC award, witness a significant increase.<br />
yy<br />
The mechanism of providing SMC grants needs to be improved and made needs-based. There is<br />
also a need to improve the capacity of SMCs for utilizing such transfers in a transparent and judicious<br />
manner.<br />
yy<br />
It is imperative to fill the vacant teaching positions immediately. In the absence of teaching staff in<br />
the schools, the quality of the education provided in the district will suffer.<br />
yy<br />
The Budget Calendar should be followed strictly to ensure efficiency and public participation in
53<br />
the budget making process. All stakeholders, including the students and communities, should be<br />
consulted and their views must be weighed and incorporated at the time when schools are required<br />
to submit their requirements in response to the Budget Call Letter.<br />
yy<br />
The budget making process needs to ensure adequate provisions for existing girls’ schools.<br />
9. Multan City District<br />
9.1. Profile of the District<br />
Multan, one of the oldest cities in South Asia, is located in the centre of Pakistan, in the southern part<br />
of Punjab Province. It is situated on the east bank of the Chenab River and is bounded in the east by<br />
Lodhran and Khanewal Districts, in the north by Khanewal District, in the south by Bahawalpur District<br />
and in the west by Muzaffargarh District.<br />
Multan City District covers an area of 3,721 square kilometres. In 2005, it was designated as a City<br />
District, which consists of 6 towns: Boson, Shah Rukan-e-Alam, Mumtazabad, Shershah, Shujabad and<br />
Jalalpur. According to 1998 census, Multan district had a population of over 3.8 million. In 1951, the<br />
total population of Multan district was 0.7 million, and it is estimated to have increased to about 5<br />
million by 2009. In terms of population, Multan city is the sixth largest city in Pakistan.<br />
Table 54: Population and Percentage Change, 1951-2009<br />
1951 1961 1972 1981 1998 2009 (Estimated)<br />
Population (millions) 0.725 0.984 1.506 1.970 3.117 5.000<br />
Average annual change (%) - 3.10 3.70 3.20 2.70 -<br />
Source: Population Census Organization, Government of Pakistan, District Census Report of Multan<br />
According to the census data, in 1998 42.2 percent of the total population of Multan lived in urban<br />
areas. At that time Multan district included one Municipal Corporation, one Municipal Committee, one<br />
Cantonment and three Town Committees. In view of the rural-urban migration trend, it is expected<br />
that the urban population had increased by 2009, but reliable statistics are not available.<br />
According to the 1998 census, the overall literacy rate of the district was 43.4 percent. For women it<br />
was 32.3 percent and for men it was 53.3 percent. In 1998, the overall literacy rate had nearly doubled<br />
since the 1981 census, when it had been reported as only 23.5 percent. For women, the literacy rate<br />
had increased from 12.9 percent in 1981 to 32.3 percent in 1998.<br />
The 1998 census had shown a significant rural-urban difference in terms of literacy rates. In 1998,<br />
only 29.5 percent of the population in rural areas were literate, as against 60.9 percent in urban areas.<br />
Likewise, only 16.2 percent of women were literate in rural areas, whereas the literacy rate of women<br />
in urban areas was 53.2 percent. The literacy rate of men is increasing faster compared to that of<br />
women. In the years between 1981 and 1998, the literacy rate of rural women increased from 6.2<br />
percent to 16.2 percent, while for rural males it increased from 25.8 percent to 41.6 percent.<br />
Table 55: Literacy by Sex and Location – 1981 and 1998<br />
1981 (%) 1998 (%)<br />
Both Male Female Both Male Female<br />
All Areas 23.50 32.60 12.90 43.40 53.30 32.30<br />
Rural 16.70 25.80 6.20 29.50 41.60 16.20<br />
Urban 41.30 50.30 30.70 60.90 67.50 53.20<br />
Source: Population Census Organization, Government of Pakistan, District Census Report of Multan, 1999<br />
Executive<br />
Summary<br />
1. Introduction 2. The Budget Making Process and<br />
District Management<br />
3. Comparative Analysis of 4. <strong>Islamabad</strong> Capital<br />
District <strong>Education</strong> <strong>Budgets</strong> Territory<br />
5. Abbottabad District 6. Nowshera District 7. City District<br />
Faisalabad<br />
8. Jhelum District 9. Multan City<br />
District<br />
10. Recommendations References
54<br />
<strong>Education</strong> <strong>Budgets</strong>: A Study of Selected Districts of Pakistan<br />
9.2. <strong>Education</strong> sector in Multan<br />
9.2.1. <strong>Education</strong> Facilities<br />
In Multan City District the total number of schools is 1,857, including 922 schools for boys and 935<br />
schools for girls. It is one of the few districts in the country where the number of girls’ schools is higher<br />
than that of boys’. But when it comes to secondary and higher secondary schools, the number of<br />
boys’ schools is higher than the number of girls’ schools. For example, the total number of secondary<br />
schools in the district is 132, but only 31 are for girls.<br />
Table 56: Public Schools in Multan District<br />
Boys’ schools Girls’ schools Total<br />
Mosque Schools 244 9 253<br />
Primary Schools 484 783 1 267<br />
Middle Schools 85 107 192<br />
Secondary Schools 101 31 132<br />
Higher Secondary Schools 8 5 13<br />
Total 922 935 1 857<br />
Source: City District Government, Multan<br />
The total number of students enrolled in public schools in Multan district is 1,384,236. Out of these,<br />
almost 15 percent (205,084) are enrolled in primary schools. Although the number of girls’ secondary<br />
schools is far lower than the number for boys, more girls than boys are enrolled in secondary schools.<br />
Table 57: Enrolment Numbers in Multan District<br />
Girls enrolled Boys enrolled Total<br />
Pre Primary 45 505 39 761 85 266<br />
Primary 113 382 91 702 205 084<br />
Middle 39 840 23 419 63 259<br />
Secondary 17 467 11 568 29 035<br />
H.Sec. 615 977 1 592<br />
Total 216 809 167 427 384 236<br />
Source: City District Government, Multan<br />
9.2.2. Financing of <strong>Education</strong><br />
Government-run education in Multan, up to secondary level, is supported by the federal and<br />
provincial governments through funds from the Provincial Finance Commission (PFC) award whereby<br />
the provincial government distributes funds among the districts falling within its jurisdiction. Multan<br />
City District has limited resources to bring into use on its own. In the 2009/10 budget, the Own Source<br />
Revenue of the district amounted to only 204 million PKR, which included 58.5 million PKR in arrears.<br />
Hence, the OSR share in the total district budget was only 2.8 percent.<br />
9.2.3. Quality of <strong>Education</strong><br />
As in other districts, the government-run schools are not up to the mark in terms of performance and<br />
productivity. This has created room for the growth of private schools. These schools mostly existed in<br />
urban areas but are now also being established in rural areas.
55<br />
The lack of facilities, inadequate teaching staff and lack of motivation among teachers, means that<br />
the government-run schools usually fail to properly manage children and keep them interested in<br />
continuing their schooling. As a result, enrolment remains low, particularly at secondary levels.<br />
9.3. <strong>Education</strong> Budget Analysis<br />
9.3.1. Budget Overview<br />
In 2009/10, the total annual budget of Multan City District was 7,264.6 million PKR. Of this, 4,514<br />
million PKR were for non-development expenditures and 2750.5 million PKR were for development<br />
projects. Hence, the development budget is over 37 percent of the total budget of the district.<br />
Figure 16: Total Annual Budget of Multan City District, 2009/10<br />
Development<br />
28%<br />
Development<br />
(Grant in Aid) 9%<br />
Current expenditure<br />
63%<br />
Of the total non-development budget of 4,514 million PKR, the allocation for the education sector<br />
amounts to 2,755 million PKR. Thus, about 61 percent of the total non-developmental budget for the<br />
district is allocated to the education sector. This looks impressive but the amounts allocated fall short<br />
of the needs of the people in the district.<br />
The percentage of funding allocated to education has decreased over the past five years. In<br />
2004/05, the total allocation for the education sector was 1,403,646,000 PKR out of the total nondevelopmental<br />
budget of 2,062,938,000 PKR for the whole district. 7 Thus, about 68 percent of the total<br />
non-developmental budget was being spent on education.<br />
9.3.2. Salary Budget<br />
In Multan City District, each year about 95 percent of the total non-developmental education budget<br />
is allocated for the payment of salaries of teaching and other staff, with only about 5 percent allocated<br />
for non-salary expenditures.<br />
7 City District Government, District Budget (Part-I) – 2005-06, Multan<br />
Executive<br />
Summary<br />
1. Introduction 2. The Budget Making Process and<br />
District Management<br />
3. Comparative Analysis of 4. <strong>Islamabad</strong> Capital<br />
District <strong>Education</strong> <strong>Budgets</strong> Territory<br />
5. Abbottabad District 6. Nowshera District 7. City District<br />
Faisalabad<br />
8. Jhelum District 9. Multan City<br />
District<br />
10. Recommendations References
56<br />
<strong>Education</strong> <strong>Budgets</strong>: A Study of Selected Districts of Pakistan<br />
Table 58: Salary and Non-salary <strong>Budgets</strong> for EDO (<strong>Education</strong> Group) in Multan District<br />
Type Budget Estimate 2008/09 (PKR) Revised Estimate 2008/09 (PKR) Budget Estimate 2009/10 (PKR)<br />
Salary expenses 2,059,611,000 2,380,070,600 2,539,248,000<br />
Non-Salary expenses 87,217,000 105,953,580 144,403,000<br />
Total 2,146,828,000 2,486,024,180 2,683,651,000<br />
Non-Salary expenses as<br />
percentage of Total<br />
Source: City District Government, Budget 2009/10 (Part-I), Multan<br />
4 % 4.30 % 5.40 %<br />
The allocation for salaries is usually planned in accordance with the number of posts in the district. As<br />
in other districts, however, many of the teaching positions are vacant and a certain percentage of the<br />
salary budget is not consumed and, as a result, it either lapses or is re-allocated.<br />
9.3.3. Non-salary Budget<br />
In 2004/05, the non-salary expenditures for education were only 3.9 percent of the total nondevelopment<br />
expenditures. Since then, the percentage has increased. In 2008/09, the funds allocated<br />
for non-salary expenditures for education sector amounted to 4 percent of total non-developmental<br />
allocations and increased to 5.4 percent in 2009/10.<br />
In 2009/10, the non-salary allocations for all departments in the total non-development budget<br />
amounted to 585 million PKR. Thus, in overall terms, Multan City District allocated about 13 percent<br />
of the total non-developmental budget for non-salary expenses. Hence, the non-salary allocation of<br />
only 5.4 percent for the education sector is far less than the 13 percent in the overall district budget.<br />
As in other districts, the non-salary allocations for schools are drastically inadequate. In 2007/08, the<br />
boys’ primary schools under Markaz Sher Shah were allocated only 82,000 PKR for non-salary expenses<br />
for the whole year. The number of staff positions at these schools was 198. In the budget for 2009/10,<br />
the non-salary allocation was zero for these schools, so for non-salary expenditures the schools must<br />
rely on SMCs. Likewise, the boys’ primary schools under Markaz Shujabad were allocated only 105,000<br />
PKR for non-salary expenses for the whole year. The number of staff at these schools was 298. Here<br />
too, the non-salary allocations were reduced to zero in 2009/10, as separate allocations were made<br />
through SMCs. Girls’ schools also have inadequate allocations for non-salary expenses. In 2007/08,<br />
the girls’ primary schools under Markaz Qadir Pur Ran were allocated only 70,000 PKR for non-salary<br />
expenses. The total number of staff at these schools was 201. No allocation was made for non-salary<br />
expenses in 2009/10.<br />
A similar situation is observed in high schools. For instance, in 2009/10 the total budget of<br />
Government Girls Higher Secondary School Piran Ghaib was 10,635,000 PKR, including only 186,000<br />
PKR for non-salary expenses. Most of the non-salary allocation was directed to utilities, communication,<br />
travel and repair and maintenance. Likewise, Government Girls High School Kabootar Mandi had a<br />
total annual budget of 8,415,000, including only 210,000 PKR for non-salary expenses.
57<br />
Table 59: Salary and Non-salary <strong>Budgets</strong> of Selected High Schools, 2009/10<br />
School<br />
Govt. Bukhari Public High<br />
School Multan<br />
Govt. High School Piran<br />
Ghaib Multan<br />
Govt. High School Bohar<br />
Multan<br />
Govt. High School Allah<br />
Abad Shujabad<br />
Govt. Girls High School No.<br />
2 Shamasabad, Multan<br />
Govt. Girls High School<br />
Kabootar Mandi Multan<br />
Govt. Girls High School<br />
Matotli Shujabad<br />
Salary Expenses<br />
Communication Utilities Travel &<br />
Transport<br />
Non-Salary Expenses<br />
General<br />
Repair and<br />
Maintenance<br />
10,487,000 12,000 105,000 5000 32,000 8000 162,000<br />
7,040,000 1,000 25,000 5,000 32,000 8,000 71,000<br />
4,696,000 13,000 24,000 5,000 31,000 10,000 83,000<br />
3,970,000 1,000 35,000 10,000 35,000 14,000 95,000<br />
24,194,000 11,000 165,000 7,000 33,000 10,000 226,000<br />
8,205,000 10,000 90,000 5,000 75,000 30,000 210,000<br />
3,638,000 1,000 19,000 5,000 31,000 10,000 71,000<br />
Source: City District Government, Budget 2009/10 (Part-II), Multan<br />
In addition to funds allocated in the district budget, primary and middle schools are partly supported<br />
by funds from the provincial government. In Multan district, these funds are managed jointly by<br />
the EDO <strong>Education</strong> and District Monitoring Officer, and are utilized by the school management<br />
committees. Through this mechanism, each primary school receives 25,000 PKR per year, and each<br />
middle school receives 50,000 PKR per year. As in other districts, high schools do not receive funds<br />
from the provincial government. These schools must rely on the monthly contributions made by the<br />
students to the Faroogh-e-Taaleem Fund.<br />
9.3.4. Development Budget<br />
In 2009/10, the Multan City District Government allocated about 28 percent of its total annual budget<br />
for development projects. Another 10 percent of the total amount was provided to the district by the<br />
provincial government. The total allocation for development projects amounted to 2,750.5 million<br />
PKR.<br />
The table below lists the development projects that were planned or implemented between 2007<br />
and 2009. It shows that in 2007/08 only 14 percent of the total funds allocated for development in the<br />
district were directed to education or literacy projects. This percentage further shrank to 11 percent<br />
during the year following revisions of the budget.<br />
Table 60: Share of <strong>Education</strong> in the Annual Development Plan, Multan City District, 2008/09<br />
Budget estimate 2007/08<br />
(millions, PKR)<br />
Revised budget estimate 2007/08<br />
(millions, PKR)<br />
Allocation 2008/09 (millions, PKR)<br />
Total<br />
Ongoing New Total<br />
<strong>Education</strong> 249.70 129.70 67.40 70.00 137.00<br />
Literacy 1.00 0.00 0.00 4.00 4.00<br />
Total (<strong>Education</strong>+ Literacy) 250.70 129.70 67.40 74.00 141.00<br />
Total all sectors (Excluding CCB) 1772 1183 558 742 1300<br />
<strong>Education</strong> and Literacy allocations<br />
as percentage of total<br />
14 % 11 % 12 % 10 % 10.80 %<br />
Source: City District Government, Annual Development Programme 2008/09, Multan<br />
Executive<br />
Summary<br />
1. Introduction 2. The Budget Making Process and<br />
District Management<br />
3. Comparative Analysis of 4. <strong>Islamabad</strong> Capital<br />
District <strong>Education</strong> <strong>Budgets</strong> Territory<br />
5. Abbottabad District 6. Nowshera District 7. City District<br />
Faisalabad<br />
8. Jhelum District 9. Multan City<br />
District<br />
10. Recommendations References
58<br />
<strong>Education</strong> <strong>Budgets</strong>: A Study of Selected Districts of Pakistan<br />
In 2008/09, the share of literacy and education in the overall allocations for development projects was<br />
10.8 percent. In this year, the total development budget of the district, excluding CCBs, was about<br />
1,300 million PKR, but only 141 million PKR was allocated for development projects in the education<br />
sector.<br />
An analysis of the development budget of the district for the years 2007/08 and 2008/09 indicates<br />
that in these years education was among the top three development priorities of the government in<br />
terms of allocated funds. The top three priorities were: agricultural extension and farm to urban link<br />
roads; roads; bridges and widening / improvement of chowks (cross roads); and education.<br />
Table 61: Top Three Development Priorities of Multan City District, 2007-2009<br />
Agricultural extension and farm to urban<br />
link roads<br />
Roads, bridges and widening / improvement<br />
of chowks<br />
Budget Estimate 2007/08<br />
(millions, PKR)<br />
Revised Budget Estimate 2007/08<br />
(millions, PKR)<br />
Budget Estimate 2008/09<br />
(millions, PKR)<br />
591.90 608.70 499.80<br />
277.50 180.40 241.90<br />
<strong>Education</strong> 249.70 129.70 137.40<br />
Source: City District Government, Annual Development Programme 2008/09, Multan<br />
9.4. Major Issues and Concerns<br />
The study of the education sector budgeting in Multan has identified several concerns that require<br />
the attention of policy makers and other stakeholders. These are as listed below.<br />
yy<br />
The overall size of the education budget is inadequate.<br />
yy<br />
Relatively few funds are allocated for non-salary expenses, e.g. communications, transport,<br />
consumables and utilities. This hampers the management of the school and adversely impacts on<br />
the quality of the education provided.<br />
yy<br />
Funds provided to SMCs by the provincial government are not based on any assessment of needs<br />
of the schools.<br />
yy<br />
Few resources are available for implementing development projects. Development of the education<br />
sector is among the top three priorities but it is ranked below road and bridge construction in terms<br />
of importance.<br />
yy<br />
The district government has not followed the timeframe outlined in the Budget Rules. In general,<br />
there has been a lack of consultations with stakeholders, and completion of proposals and<br />
presentation of the draft budget has not been on time. It is encouraging, however, that the Multan<br />
City District Government has already taken some steps to improve this.<br />
9.5. Recommendations<br />
In view of the findings of this study, the following recommendations are made:<br />
yy<br />
The overall budget should be increased through allocating more resources through the PFC award<br />
and by improving the efforts for generating more resources by the district government itself.<br />
yy<br />
The non-salary allocations should be increased significantly so that schools can adequately cover<br />
their operating costs. Simultaneously, efforts should be made to improve the procedures and human<br />
resource capacities in order to ensure that schools can efficiently access and utilize funds allocated<br />
for operating expenses.<br />
yy<br />
The funds provided to the school SMCs should be based on an assessment of the schools’ needs.<br />
The budgetary allocations should be linked with the performance of the institutions.
59<br />
yy<br />
The capacity of the SMCs for effective and transparent utilization of the funds should be improved.<br />
yy<br />
Higher priority should be given to education development, as education of the population is as<br />
important as roads and bridges.<br />
yy<br />
Consultations with the stakeholders, including the students, teachers and communities, must be<br />
ensured at the time when schools are required to submit their requirements in response to the<br />
Budget Call Letter.<br />
10. Recommendations<br />
This study of the education budgets of six districts in Pakistan has identified common issues across<br />
districts in terms of allocations of resources for education. On the basis of such findings, the following<br />
recommendations are presented for the attention of decision-makers.<br />
yy<br />
Currently, the budget allocations for the education sector are uneven, in per capita terms, across the<br />
districts. Budget allocations for <strong>Islamabad</strong>, Abbottabad and Jhelum districts are significantly higher<br />
in per capita terms than those for Multan, Nowshera and Faisalabad districts. It is recommended<br />
that budget allocations for education be made fair, equitable and needs-based and that the lessdeveloped<br />
districts are given priority and additional resources, so as to bring all the districts to a<br />
relatively equal level.<br />
yy<br />
The overall budget for the education sector should be increased. This requires that the resources<br />
allocated through the PFC award and the district’s own resources witness a significant increase.<br />
yy<br />
The poor condition of the primary schools in the districts requires concerted efforts for the provision<br />
of better resources, facilities and technical support.<br />
yy<br />
The amounts allocated to non-salary expenses should be increased significantly so that schools can<br />
cover their operating expenses. Simultaneously, efforts should be made to improve procedures and<br />
human resource capacities in order to ensure that schools can efficiently access and utilize funds<br />
allocated for operating expenses. Sufficient funds should also be provided to schools for sports and<br />
annual tournaments.<br />
yy<br />
An appropriate mechanism should be devised whereby primary and middle schools can easily<br />
access and utilize the funds that are allocated for them. Currently, the primary and middle schools do<br />
not have any staff to maintain accounts, nor do the head teachers of these schools have the powers<br />
of drawing and disbursing officers. As a result, the schools find it difficult to access or utilize the funds<br />
that are allocated for them, as the head teachers have to get approval from relevant drawing and<br />
disbursing officers, who are often not accessible. It may be more practical to link primary and middle<br />
schools with the nearby high or higher secondary schools, whose headmasters have the powers of<br />
drawing and disbursing officers.<br />
yy<br />
Budgetary allocations should be proportional to the performance of the institutions. Such<br />
Performance Based Budgeting, with a well defined monitoring policy, can help improve the quality<br />
of education.<br />
yy<br />
All stakeholders, including the students and communities, should be consulted in the process of<br />
identifying the budgetary needs of the schools. For example, needs for operating expenses should<br />
be determined through an open and a consultative process involving all stakeholders. In particular,<br />
the budget making process must take into account the need for more frequent communications<br />
and interactions with teachers and parents as well as improving the classroom environment so as<br />
to enhance learning.<br />
yy<br />
Consultation with stakeholders should be made possible at the time when schools are required<br />
to submit their requirements in response to the Budget Call Letter. Transparency and effective<br />
inputs and oversight by public representatives in the annual budget need to be strengthened and<br />
implemented in letter and spirit.<br />
Executive<br />
Summary<br />
1. Introduction 2. The Budget Making Process and<br />
District Management<br />
3. Comparative Analysis of 4. <strong>Islamabad</strong> Capital<br />
District <strong>Education</strong> <strong>Budgets</strong> Territory<br />
5. Abbottabad District 6. Nowshera District 7. City District<br />
Faisalabad<br />
8. Jhelum District 9. Multan City<br />
District<br />
10. Recommendations References
60<br />
<strong>Education</strong> <strong>Budgets</strong>: A Study of Selected Districts of Pakistan<br />
yy<br />
In <strong>Islamabad</strong> Capital Territory, until the government decides to introduce the local government<br />
system in <strong>Islamabad</strong>, the citizens should be able to convey their views and suggestions to the<br />
government through a consultative forum. The elected members of the National Assembly from<br />
<strong>Islamabad</strong>, eminent citizens, civil society representatives, heads of selected educational institutions<br />
and representatives of Federal Directorate of <strong>Education</strong> and Ministry of <strong>Education</strong> could constitute<br />
this forum.<br />
yy<br />
<strong>Education</strong> departments should make it a priority to reduce the disparity between the numbers of<br />
educational institutions for boys and girls and make schools more accessible for girls.<br />
yy<br />
Annual budgets must make necessary provisions to meet the special needs of girls’ schools and<br />
rural schools. For example, budgets should include provisions for transport, annual study tours or<br />
additional allowances for teachers to keep them motivated to serve in these schools.<br />
yy<br />
It is recommended that urgent steps are taken to fill the vacant posts for both teaching and nonteaching<br />
staff, so as to improve the quality of instruction.<br />
yy<br />
Though the districts have been assigned the responsibility for educational matters, they have<br />
little authority to hire new staff or adjust positions according to their needs. It is recommended<br />
that district authorities be given more powers for this kind of decision making, so that the district<br />
governments can perform its tasks more efficiently.<br />
yy<br />
The funds available for development projects are usually inadequate. A few districts get a<br />
disproportionately higher amount of funds, but it generally happens only when a senior political<br />
leader uses his or her political influence. It is recommended that adequate development funds be<br />
provided to all districts, and that these funds be provided on the basis of clear and fair criteria, thus<br />
minimizing the chance of any influence on allocations in favour of, or against, some districts.<br />
yy<br />
As little money is available for development projects, it is recommended that development funds be<br />
utilized rationally, based on proper planning. The current approach emphasizes the initiation of new<br />
projects while ignoring ongoing ones. This can lead to wasting of the money that has been spent<br />
on ongoing projects in previous years.<br />
yy<br />
The mechanism of providing grants to schools needs to be improved and made needs-based.<br />
Currently, funds provided to SMCs by the provincial government are not based on an assessment of<br />
the needs of the schools.<br />
yy<br />
It is recommended that steps be taken to improve the capacity of SMCs for utilizing funds in a<br />
transparent and judicious manner.
61<br />
References<br />
Abbottabad District Government, <strong>Budgets</strong> 2004/05 – 2009/10<br />
Faisalabad City District Government, Annual Development Programme 2008/09<br />
Faisalabad City District Government Website: www.faisalabad.gov.pk<br />
Faisalabad City District Government, <strong>Budgets</strong> 2004/05 – 2009/10<br />
Government of Khyber-Pakhtunkhwa. 2003. Budget Rules 2003, Local Government and Rural<br />
Development Department, Peshawar<br />
Government of Pakistan, <strong>Budgets</strong> 2000/01 – 2009/10<br />
Government of Pakistan. Census of Private <strong>Education</strong>al Institutions in Pakistan. 1999-2000 http://www.<br />
statpak.gov.pk/depts/fbs/publications/yearbook2008/yearbook2008.html<br />
Government of Pakistan. Ministry of <strong>Education</strong> Website: www.moe.gov.pk<br />
Government of Pakistan. Ministry of Finance Website: www.finance.gov.pk<br />
Government of Pakistan. Population Census Organization, Website: http://www.statpak.gov.pk<br />
Government of Punjab. 2003. District Government and TMA Budget Rules 2003, Lahore<br />
Jhelum District Government, <strong>Budgets</strong> 2005/06 – 2009/10<br />
Multan City District Government, Annual Development Programme 2008/09<br />
Multan City District Government Website: www.multan.gov.pk<br />
Multan City District Government, <strong>Budgets</strong> 2004/05 – 2009/10<br />
National Institute of Population Studies (NIPS), <strong>Islamabad</strong>. Website: www.nips.org.pk<br />
Nowshera District Government, <strong>Budgets</strong> 2004/05 – 2009/10<br />
Executive<br />
Summary<br />
1. Introduction 2. The Budget Making Process and<br />
District Management<br />
3. Comparative Analysis of 4. <strong>Islamabad</strong> Capital<br />
District <strong>Education</strong> <strong>Budgets</strong> Territory<br />
5. Abbottabad District 6. Nowshera District 7. City District<br />
Faisalabad<br />
8. Jhelum District 9. Multan City<br />
District<br />
10. Recommendations References
<strong>UNESCO</strong> <strong>Islamabad</strong><br />
United Nations<br />
<strong>Education</strong>al, Scientific and<br />
Cultural Organization<br />
<strong>UNESCO</strong> Office, Serena Business Complex,<br />
7th Floor, Sector G-5, <strong>Islamabad</strong>, Pakistan<br />
Email: islamabad@unesco.org<br />
Website: www.unesco.org.pk<br />
UAN: +92-51-111-710-745<br />
FAX: +92-51-2600250