Education Budgets - UNESCO Islamabad
Education Budgets - UNESCO Islamabad
Education Budgets - UNESCO Islamabad

Create successful ePaper yourself
Turn your PDF publications into a flip-book with our unique Google optimized e-Paper software.
vii<br />
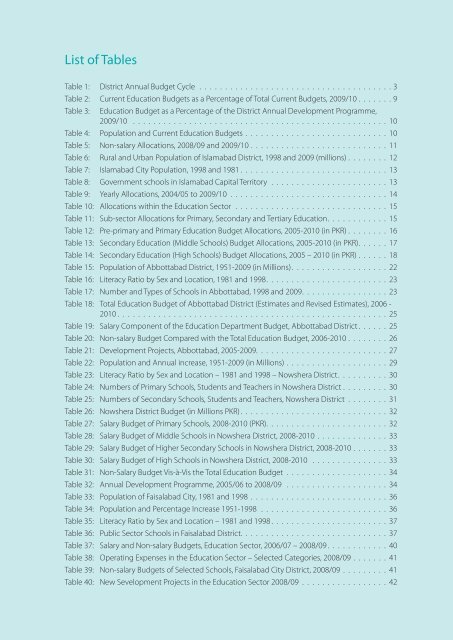
List of Tables<br />
Table 1: District Annual Budget Cycle . . . . . . . . . . . . . . . . . . . . . . . . . . . . . . . . . . . . . . 3<br />
Table 2: Current <strong>Education</strong> <strong>Budgets</strong> as a Percentage of Total Current <strong>Budgets</strong>, 2009/10 . . . . . . . 9<br />
Table 3:<br />
<strong>Education</strong> Budget as a Percentage of the District Annual Development Programme,<br />
2009/10 . . . . . . . . . . . . . . . . . . . . . . . . . . . . . . . . . . . . . . . . . . . . . . . . . . 10<br />
Table 4: Population and Current <strong>Education</strong> <strong>Budgets</strong> . . . . . . . . . . . . . . . . . . . . . . . . . . . . 10<br />
Table 5: Non-salary Allocations, 2008/09 and 2009/10 . . . . . . . . . . . . . . . . . . . . . . . . . . . 11<br />
Table 6: Rural and Urban Population of <strong>Islamabad</strong> District, 1998 and 2009 (millions) . . . . . . . . 12<br />
Table 7: <strong>Islamabad</strong> City Population, 1998 and 1981 . . . . . . . . . . . . . . . . . . . . . . . . . . . . . 13<br />
Table 8: Government schools in <strong>Islamabad</strong> Capital Territory . . . . . . . . . . . . . . . . . . . . . . . 13<br />
Table 9: Yearly Allocations, 2004/05 to 2009/10 . . . . . . . . . . . . . . . . . . . . . . . . . . . . . . . 14<br />
Table 10: Allocations within the <strong>Education</strong> Sector . . . . . . . . . . . . . . . . . . . . . . . . . . . . . . 15<br />
Table 11: Sub-sector Allocations for Primary, Secondary and Tertiary <strong>Education</strong>. . . . . . . . . . . . 15<br />
Table 12: Pre-primary and Primary <strong>Education</strong> Budget Allocations, 2005-2010 (in PKR) . . . . . . . . 16<br />
Table 13: Secondary <strong>Education</strong> (Middle Schools) Budget Allocations, 2005-2010 (in PKR). . . . . . 17<br />
Table 14: Secondary <strong>Education</strong> (High Schools) Budget Allocations, 2005 – 2010 (in PKR) . . . . . . 18<br />
Table 15: Population of Abbottabad District, 1951-2009 (in Millions) . . . . . . . . . . . . . . . . . . . 22<br />
Table 16: Literacy Ratio by Sex and Location, 1981 and 1998. . . . . . . . . . . . . . . . . . . . . . . . 23<br />
Table 17: Number and Types of Schools in Abbottabad, 1998 and 2009. . . . . . . . . . . . . . . . . 23<br />
Table 18: Total <strong>Education</strong> Budget of Abbottabad District (Estimates and Revised Estimates), 2006 -<br />
2010 . . . . . . . . . . . . . . . . . . . . . . . . . . . . . . . . . . . . . . . . . . . . . . . . . . . . . 25<br />
Table 19: Salary Component of the <strong>Education</strong> Department Budget, Abbottabad District . . . . . . 25<br />
Table 20: Non-salary Budget Compared with the Total <strong>Education</strong> Budget, 2006-2010 . . . . . . . . 26<br />
Table 21: Development Projects, Abbottabad, 2005-2009. . . . . . . . . . . . . . . . . . . . . . . . . . 27<br />
Table 22: Population and Annual increase, 1951-2009 (in Millions) . . . . . . . . . . . . . . . . . . . . 29<br />
Table 23: Literacy Ratio by Sex and Location – 1981 and 1998 – Nowshera District. . . . . . . . . . 30<br />
Table 24: Numbers of Primary Schools, Students and Teachers in Nowshera District . . . . . . . . . 30<br />
Table 25: Numbers of Secondary Schools, Students and Teachers, Nowshera District . . . . . . . . 31<br />
Table 26: Nowshera District Budget (in Millions PKR) . . . . . . . . . . . . . . . . . . . . . . . . . . . . . 32<br />
Table 27: Salary Budget of Primary Schools, 2008-2010 (PKR). . . . . . . . . . . . . . . . . . . . . . . . 32<br />
Table 28: Salary Budget of Middle Schools in Nowshera District, 2008-2010 . . . . . . . . . . . . . . 33<br />
Table 29: Salary Budget of Higher Secondary Schools in Nowshera District, 2008-2010 . . . . . . . 33<br />
Table 30: Salary Budget of High Schools in Nowshera District, 2008-2010 . . . . . . . . . . . . . . . 33<br />
Table 31: Non-Salary Budget Vis-à-Vis the Total <strong>Education</strong> Budget . . . . . . . . . . . . . . . . . . . . 34<br />
Table 32: Annual Development Programme, 2005/06 to 2008/09 . . . . . . . . . . . . . . . . . . . . 34<br />
Table 33: Population of Faisalabad City, 1981 and 1998 . . . . . . . . . . . . . . . . . . . . . . . . . . . 36<br />
Table 34: Population and Percentage Increase 1951-1998 . . . . . . . . . . . . . . . . . . . . . . . . . 36<br />
Table 35: Literacy Ratio by Sex and Location – 1981 and 1998 . . . . . . . . . . . . . . . . . . . . . . . 37<br />
Table 36: Public Sector Schools in Faisalabad District. . . . . . . . . . . . . . . . . . . . . . . . . . . . . 37<br />
Table 37: Salary and Non-salary <strong>Budgets</strong>, <strong>Education</strong> Sector, 2006/07 – 2008/09 . . . . . . . . . . . . 40<br />
Table 38: Operating Expenses in the <strong>Education</strong> Sector – Selected Categories, 2008/09 . . . . . . . 41<br />
Table 39: Non-salary <strong>Budgets</strong> of Selected Schools, Faisalabad City District, 2008/09 . . . . . . . . . 41<br />
Table 40: New Sevelopment Projects in the <strong>Education</strong> Sector 2008/09 . . . . . . . . . . . . . . . . . 42<br />
Executive<br />
Summary<br />
1. Introduction 2. The Budget Making Process and<br />
District Management<br />
3. Comparative Analysis of 4. <strong>Islamabad</strong> Capital<br />
District <strong>Education</strong> <strong>Budgets</strong> Territory<br />
5. Abbottabad District 6. Nowshera District 7. City District<br />
Faisalabad<br />
8. Jhelum District 9. Multan City<br />
District<br />
10. Recommendations References