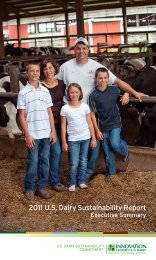
2011 U.S. Dairy Sustainability Report - Innovation Center for US Dairy
2011 U.S. Dairy Sustainability Report - Innovation Center for US Dairy
2011 U.S. Dairy Sustainability Report - Innovation Center for US Dairy
You also want an ePaper? Increase the reach of your titles
YUMPU automatically turns print PDFs into web optimized ePapers that Google loves.
Endnotes<br />
1. “The World Factbook,” Central Intelligence Agency, last modified Jan. 26, 2012, accessed Feb. 7,<br />
2012, https://www.cia.gov/library/publications/the-world-factbook/geos/xx.html. The population<br />
projection is based on an estimated 252 worldwide births per minute times an estimated 32<br />
minutes to read this report.<br />
2. National Milk Producers Federation, “2012 <strong>Dairy</strong> Producer Highlights” (2012): 42.<br />
3. R.A. Hoppe and D.E. Banker, “Structure and Finances of U.S. Farms: Family Farm <strong>Report</strong>, 2010<br />
Edition,” <strong>US</strong>DA Economic Research Service, Economic In<strong>for</strong>mation Bulletin No. 66 (July 2010): i.<br />
4. <strong>US</strong>DA Economic Research Service, “Livestock, <strong>Dairy</strong>, and Poultry Outlook: Tables” (Dec. 8, <strong>2011</strong>):<br />
U.S. milk production and related data, http://www.ers.usda.gov/publications/ldp/LDPTables.htm,<br />
accessed Feb. 7, 2012.<br />
5. Ibid.<br />
6. <strong>US</strong>DA Economic Research Service, “Livestock, <strong>Dairy</strong>, and Poultry Outlook: Tables” (Oct. 31, <strong>2011</strong>):<br />
Milk cows and production by State and region, http://www.ers.usda.gov/publications/ldp/LDPTables.<br />
htm, accessed Feb. 7, 2012.<br />
7. <strong>US</strong>DA Rural Development, “Cooperative In<strong>for</strong>mation <strong>Report</strong> 1 Section 16: Cooperatives in the <strong>Dairy</strong><br />
Industry” (September 2005). The dairy cooperative percentage is based on 2002 data.<br />
8. U.S. Census Bureau, “Statistical Abstract of the United States: 2012. Table 875, Milk Production and<br />
Manufactured <strong>Dairy</strong> Products 1990 to 2010” (April 27, <strong>2011</strong>): 557.<br />
9. NMPF, “2012 <strong>Dairy</strong> Producer Highlights,” Table 25: Annual Commercial Disappearance of <strong>Dairy</strong><br />
Products, Milk Equivalent, Total Solids Basis.<br />
10. U.S. Department of Labor, Bureau of Labor Statistics, “Consumer Expenditures in 2009,” <strong>Report</strong><br />
1029 (May <strong>2011</strong>): 2. Percentage calculation is based on average annual food expenditures of $6,372<br />
on food purchases; of this amount, $406, or 6.3 percent, was spent on dairy products.<br />
11. Calcium percent is based on S. Gerrior, L. Bente and H. Hiza, “Nutrient Content of the U.S. Food<br />
Supply, 1909-2000,” U.S. Department of Agriculture, <strong>Center</strong> <strong>for</strong> Nutrition Policy and Promotion,<br />
Home Economics Research <strong>Report</strong> No. 56 (2004). Protein percent is based on <strong>Dairy</strong> Research<br />
Institute, NHANES (2003–2006), Ages 2+ years. Data Source: <strong>Center</strong>s <strong>for</strong> Disease Control and<br />
Prevention, National <strong>Center</strong> <strong>for</strong> Health Statistics, National Health and Nutrition Examination<br />
Survey. Hyattsville, Md. U.S. Department of Health and Human Services, <strong>Center</strong>s <strong>for</strong> Disease<br />
Control and Prevention, 2003-2004; 2005-2006, www.cdc.gov/nchs/nhanes.htm.<br />
12. J. L. Capper, R. A. Cady and D. E. Bauman, “The environmental impact of dairy production: 1944<br />
compared with 2007,” Journal of Animal Science 87 (March 13, 2009): 2160-2167.<br />
13. <strong>Innovation</strong> <strong>Center</strong> <strong>for</strong> U.S. <strong>Dairy</strong>, “U.S. <strong>Dairy</strong> <strong>Sustainability</strong> Initiative: A Roadmap to Reduce<br />
Greenhouse Gas Emissions and Increase Business Value” (2008).<br />
14. P. Con<strong>for</strong>ti, Ed., “Looking Ahead in World Food and Agriculture. Perspectives to 2050” Food and<br />
Agriculture Organization of the United Nations, (<strong>2011</strong>), accessed Oct. 17, <strong>2011</strong>, http://www.fao.org/<br />
docrep/014/i2280e/i2280e00.htm.<br />
15. <strong>Innovation</strong> <strong>Center</strong> <strong>for</strong> U.S. <strong>Dairy</strong>, “The Impact of Globalization on the U.S. <strong>Dairy</strong> Industry: Threats,<br />
Opportunities, and Implications” (October 2009). Support and assistance <strong>for</strong> developing food<br />
projections provided by Bain & Company.<br />
16. “World Milk Production,” <strong>Dairy</strong>Co. Datum, accessed Feb. 3, 2012, http://www.dairyco.net/datum/<br />
milk-supply/milk-production/world-milk-production.aspx.<br />
17. Food and Agriculture Organization of the United Nations, (Data from: FAO n,d. Livestock Primary.<br />
Production. FAOSTAT), accessed Aug. 18, <strong>2011</strong>, http://faostat.fao.org/site/569/default.aspx#ancor.<br />
18. <strong>US</strong>DA National Agricultural Statistics Service, “Quick Stats,” query of dairy milk price received<br />
measured in $/cwt national average, annual time periods, http://quickstats.nass.usda.<br />
gov/#5B8AFA38-3C66-3B39-9330-19DBAA042A54, accessed Feb. 7, 2012.<br />
19. Ibid.<br />
20. Food and Agriculture Organization of the United Nations, Global Perspective Studies Unit,<br />
“World agriculture: towards 2030/2050” (2006).<br />
21. Organization <strong>for</strong> Economic Co-Operation and Development, and Food and Agriculture<br />
Organization of the United Nations, “Agricultural Outlook 2009-2018, 15th Edition” (June 2009),<br />
http://www.agri-outlook.org/document/56/0,3343,en_36774715_36775671_45421112_1_1_1_1,00.<br />
html.<br />
22. T. Lang, D. Barling, M. Caraher, “Food Policy: Integrating Health, Environment and Society,” Ox<strong>for</strong>d<br />
University Press, 2009.<br />
23. White House Task Force on Childhood Obesity, “Solving the Problem of Childhood Obesity Within a<br />
Generation” (May 2010): 61.<br />
24. Food and Agriculture Organization of the United Nations, “Biodiversity and Sustainable Diets:<br />
United Against Hunger” (2010): iii.<br />
25. J. L. Capper, et al., “The environmental impact of dairy production.”<br />
26. School Nutrition Association and National <strong>Dairy</strong> Council, “School Milk: Fat Content Has Declined<br />
Dramatically Since the Early 1990s” (December, 2008): 5.<br />
27. <strong>Dairy</strong> Research Institute, NHANES (2003-2006), Ages 2+ years.<br />
28. A. Drewnowski, “The contribution of milk and milk products to micronutrient density and<br />
af<strong>for</strong>dability of the U.S. diet,” Journal of the American College of Nutrition 30, No. 5 Supplement 1<br />
(October <strong>2011</strong>): 422S-428S.<br />
29. U.S. Department of Agriculture and U.S. Department of Health and Human Services, “Dietary<br />
Guidelines <strong>for</strong> Americans, 2010. 7th Edition” (January <strong>2011</strong>): ii.<br />
30. D. A. McCarron and R. P. Heaney, “Estimated Healthcare Savings Associated With Adequate <strong>Dairy</strong><br />
Food Intake,” American Journal of Hypertension 17 (2004): 88-97.<br />
31. Estimated <strong>2011</strong> hours reflect stakeholder participation in <strong>Innovation</strong> <strong>Center</strong> sustainability initiatives.<br />
Business value is based on a $115 hourly rate to reflect the value of volunteer stakeholder<br />
expertise, participation and work product. Stakeholder hours are tracked in an internal database.<br />
32. Natural Marketing Institute, “<strong>2011</strong> U.S. LOHAS Custom <strong>Report</strong>, Abridged Presentation,” proprietary<br />
consumer research study findings presented to <strong>Dairy</strong> Management, Inc., Dec. 15, <strong>2011</strong>.<br />
33. Food and Agriculture Organization of the United Nations, Animal Production and Health Division,<br />
“Greenhouse Gas Emissions from the <strong>Dairy</strong> Sector: A Life Cycle Assessment” (2010): 10.<br />
34. LCA studies follow ISO 14040:2006 and 14044:2006 standards.<br />
35. <strong>Innovation</strong> <strong>Center</strong> <strong>for</strong> U.S. <strong>Dairy</strong>, “Fluid Milk Carbon Footprint Study Frequently Asked Questions”<br />
(Aug. 16, 2010): 2.<br />
36. Ibid.<br />
37. Cheese results are preliminary estimates; final results are expected to be published in 2012.<br />
Average cheese calculations are based on the assumption that natural cheese can be represented<br />
as 65 percent cheddar and 35 percent mozzarella. Average cheese was reported as natural cheese<br />
in the <strong>2011</strong> U.S. <strong>Dairy</strong> <strong>Sustainability</strong> <strong>Report</strong> Executive Summary, which was published in March 2012.<br />
38. <strong>US</strong>DA NRCS staff email correspondence dated Nov. 14, <strong>2011</strong>, provided Environmental Quality<br />
Incentives Program funding data. <strong>US</strong>DA Conservation <strong>Innovation</strong> Grants program funding was<br />
determined from Strategic Conservation Services calculations.<br />
39. Results consolidate two data sources: audit data tracked in proprietary Farm Energy Audit Tool<br />
(FEAT) developed and managed by EnSave, Inc., and results by other audit program participants.<br />
40. <strong>Innovation</strong> <strong>Center</strong> <strong>for</strong> U.S. <strong>Dairy</strong>, “Oregon dairy finds ways to balance initial costs and long-term<br />
savings” (2009). Dollar savings are based on a reduction of 214,850 kWh of electricity use at a cost<br />
of $0.057 per kWh and a savings of 874 therms of natural gas at $1.248 per therm.<br />
41. U.S. EPA AgSTAR, “U.S. Farm Anaerobic Digestion Systems: A <strong>2011</strong> Snapshot” (2012): 1.<br />
57


