Download PDF - Severstal
Download PDF - Severstal
Download PDF - Severstal

Create successful ePaper yourself
Turn your PDF publications into a flip-book with our unique Google optimized e-Paper software.
The right<br />
strategy<br />
in the right<br />
markets<br />
Annual Report 2012
company Overview Strategy Performance Sustainability Governance Financial statements Additional information<br />
2<br />
Page Introduction Title<br />
<strong>Severstal</strong>:<br />
strong<br />
money on<br />
good<br />
markets,<br />
good<br />
money on<br />
weak<br />
markets<br />
Experienced top<br />
management<br />
Senior management team and Board<br />
of Directors, including five<br />
independent non-executive directors,<br />
combine extensive steel and resources<br />
industry knowledge with international<br />
management and financial expertise.<br />
Unique business<br />
model<br />
Low-cost production platform with full<br />
integration in iron ore and coking coal,<br />
a balanced product mix with strong<br />
share of high value added products,<br />
and a focus on concentrated and<br />
growing markets.<br />
Target of being<br />
a global efficiency<br />
leader<br />
Aim to be a leading steel and mining<br />
company globally by ROCE and<br />
EBITDA. Capex focused on<br />
modernisation, efficiency, margin<br />
enhancement and added value<br />
services rather than volume growth.<br />
Ranked world’s third most competitive<br />
steelmaker in 2012.<br />
Well-invested<br />
assets<br />
High quality, modern, technologicallyadvanced<br />
assets with low capex<br />
requirements, delivering increased<br />
productivity and energy efficiency.<br />
Focus on<br />
operational<br />
improvements<br />
Business System of <strong>Severstal</strong> targets<br />
operational efficiencies, downtime<br />
reduction and cost savings, with<br />
$1.3bn expected contribution to<br />
EBITDA from 2010-2015. Also focuses<br />
on improving health, safety and<br />
environmental performance.<br />
Prudent and flexible<br />
financial policy<br />
Capex adjusted to the steel cycle<br />
to preserve positive free cash flow.<br />
Strong balance sheet, low cost of debt,<br />
long-term maturities. Upgraded rating<br />
in 2012 from all major international<br />
credit ratings agencies.
company Overview Strategy Performance Sustainability Governance Financial statements Additional information<br />
What’s inside<br />
3<br />
2 Introduction<br />
4 Company overview<br />
6 <strong>Severstal</strong> at a glance<br />
8 <strong>Severstal</strong>’s business model<br />
10 Business System of <strong>Severstal</strong><br />
12 Chairman statement<br />
14 CEO Statement<br />
16 Strategy<br />
18 Strategy<br />
20 Management Q&A<br />
22 Case 1 – Presence in growing markets<br />
24 Case 2 – Efficiency, low cost of production<br />
26 Case 3 – Product mix, premium margins<br />
28 Performance<br />
30 CFO statement<br />
32 Business overview<br />
38 <strong>Severstal</strong> Resources<br />
50 <strong>Severstal</strong> Russian Steel<br />
62 <strong>Severstal</strong> International<br />
70 Sustainability<br />
72 Our approach<br />
74 Health and Safety<br />
76 Environment<br />
78 Employees<br />
80 Social Commitment<br />
82 Governance<br />
84 Board composition<br />
94 Corporate governance statement<br />
108 Risk report<br />
116 Financial Statements<br />
118 Auditors’ Report<br />
120 Consolidated income statements<br />
121 Consolidated statements of<br />
comprehensive income<br />
122 Consolidated statements of financial position<br />
123 Consolidated statements of cash flows<br />
124 Consolidated statements of changes in equity<br />
125 Notes to the consolidated financial statements<br />
183 Additional information<br />
185 Shareholder Information<br />
187 Terms and abbreviations<br />
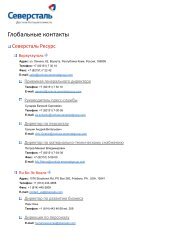
188 Contacts<br />
For more information visit our<br />
website: www.severstal.com<br />
<strong>Severstal</strong> Annual Report and accounts 2012
company Overview Strategy Performance Sustainability Governance Financial statements Additional information<br />
4<br />
Page Title
company Overview Strategy Performance Sustainability Governance Financial statements Additional information<br />
5<br />
Company<br />
overview<br />
What’s inside<br />
6 <strong>Severstal</strong> at a glance<br />
8 <strong>Severstal</strong>’s business model<br />
10 Business System of <strong>Severstal</strong><br />
12 Chairman statement<br />
14 CEO Statement
company Overview Strategy Performance Sustainability Governance Financial statements Additional information<br />
6<br />
<strong>Severstal</strong> at a glance<br />
OAO <strong>Severstal</strong> (“<strong>Severstal</strong>”, “the<br />
Company”, or “the Group”) is a verticallyintegrated<br />
steel and steel-related mining<br />
company with major assets in Russia and<br />
the USA, as well as investments in other<br />
locations. Operations began in 1955 at<br />
Cherepovets Steel Mill in Russia. Since<br />
becoming a private company in 1993,<br />
<strong>Severstal</strong> has been growing and<br />
expanding internationally. The company<br />
is listed on the Moscow Exchange<br />
(MICEX) and its GDRs are traded on the<br />
London Stock Exchange (LSE). <strong>Severstal</strong>’s<br />
strategic aim is to achieve a leading<br />
industry position by EBITDA. <strong>Severstal</strong><br />
comprises three business divisions:<br />
<strong>Severstal</strong> Resources, <strong>Severstal</strong> Russian<br />
Steel and <strong>Severstal</strong> International.<br />
<strong>Severstal</strong> Resources<br />
<strong>Severstal</strong> Resources manages all of <strong>Severstal</strong>’s mining assets, forming the<br />
basis of <strong>Severstal</strong>’s vertically integrated business model.<br />
It satisfies almost all the iron ore and hard coking coal requirements of <strong>Severstal</strong><br />
Russian Steel and, partially, of <strong>Severstal</strong> International divisions’ steel operations,<br />
while also selling increasing volumes to external customers. The coal businesses<br />
are among Russia’s top five coking coal producers, while the iron ore businesses<br />
are leaders by extraction volume in their respective markets.<br />
For more information see p. 38<br />
<strong>Severstal</strong> Russian Steel<br />
<strong>Severstal</strong> Russian Steel is a leading Russian steel producer, offering a broad<br />
product mix, with a high proportion of high value-added flat steel products,<br />
and increased production of long products for construction and downstream<br />
sales.<br />
Its flagship Cherepovets steel mill is one of the lowest-cost steel mills in the<br />
world, and is conveniently located for access from the company’s mining<br />
operations, and to the Baltic ports and Russia’s industrial heartland.<br />
For more information see p. 50<br />
<strong>Severstal</strong> International<br />
<strong>Severstal</strong> International is a modern steel producer with two of the most<br />
advanced facilities in North America, in Dearborn and Columbus.<br />
Modern facilities allow capital expenditure and maintenance levels to remain<br />
low, and production can focus on high value-added products. <strong>Severstal</strong><br />
International enjoys partial upstream integration through the PBS Coals coking<br />
coal producer, a part of <strong>Severstal</strong> Resources. Iron ore is supplied through<br />
long-term contracts with a local US producer. The division has long-standing,<br />
solid relationships with leading customers in the automotive, construction, pipe<br />
and tube, and other sectors, and is well-positioned for these markets.<br />
For more information see p. 62<br />
<strong>Severstal</strong> Annual Report and accounts 2012
company Overview Strategy Performance Sustainability Governance Financial statements Additional information<br />
7<br />
Olenegorsk<br />
Iron ore sales volumes<br />
at <strong>Severstal</strong> Resources (tonnes)<br />
Coal sales volumes<br />
at <strong>Severstal</strong> Resources (tonnes)<br />
Kostomuksha<br />
Vorkuta<br />
14.8<br />
15.2<br />
15.2m<br />
10.6 10.5 10.5m<br />
Friedens<br />
2011<br />
2012<br />
2011<br />
2012<br />
Liberia<br />
St Petersburg<br />
Sheksna<br />
Cherepovets<br />
Kolpino<br />
Moscow<br />
Kaluga<br />
Orel<br />
Volgograd<br />
<strong>Severstal</strong> Russian Steel<br />
sales breakdown<br />
(as a percentage of revenue, FY12)<br />
Domestic<br />
market<br />
Exports<br />
35%<br />
65%<br />
The highest share of high<br />
value-added steel in Russia<br />
(sales volumes, FY12)<br />
Other steel<br />
products<br />
56%<br />
44%<br />
High valueadded<br />
Dnepropetrovsk<br />
Milan<br />
Sales Breakdown by Industry<br />
(as a percentage of revenue, FY12)<br />
Growing sales volume (tonnes)<br />
Columbus<br />
Dearborn<br />
Friedens<br />
39%<br />
Other 13%<br />
20%<br />
Pipe and Tube<br />
28%<br />
Automotive<br />
Service<br />
centers<br />
4.5m<br />
3.8m 4.5 m<br />
2.5m<br />
2.1m +18.4%<br />
0.5m<br />
1.2m<br />
2011<br />
0.5m<br />
1.5m<br />
2012<br />
■ Hot-rolled strip and plate<br />
■ Cold-rolled sheet<br />
■ Galvanised and coated sheet<br />
<strong>Severstal</strong> Annual Report and accounts 2012
company Overview Strategy Performance Sustainability Governance Financial statements Additional information<br />
8<br />
<strong>Severstal</strong>’s business model<br />
The <strong>Severstal</strong>’s business model shows the component strengths<br />
which differentiate the company from its competitors. The<br />
model forms the foundation of how the company generates<br />
and creates value in the longer term. The company’s strategic<br />
priorities are then set to aim to develop the strength of the<br />
business model, and to move towards achieving the company’s<br />
goals.<br />
Vertical integration<br />
<strong>Severstal</strong> is uniquely positioned in the steel<br />
industry with almost full self-sufficiency in iron ore<br />
and more than self-sufficiency in coking coal.<br />
Values<br />
Cost advantage<br />
Russia is one of the lowest cost regions in the<br />
world for steel production.<br />
Vertical<br />
integration<br />
Strategic<br />
market focus<br />
Strategic market focus<br />
Cost advantage<br />
<strong>Severstal</strong>’s main operating assets are located in<br />
Russia and the USA where it focuses on supplying<br />
an increasing proportion of high value-added<br />
(HVA) steel products to mature, growing and<br />
highly concentrated markets.<br />
Business system<br />
Business System of <strong>Severstal</strong><br />
Business System of <strong>Severstal</strong> (BSS) is a series of<br />
projects and initiatives aimed at achieving<br />
long-term competitive advantage through<br />
operational and organisational excellence, and a<br />
service culture.<br />
For more information on our<br />
Business System see p. 10<br />
Values<br />
<strong>Severstal</strong> strives to create a culture where every<br />
employee shares similar values and works towards<br />
achieving similar goals.<br />
<strong>Severstal</strong> Annual Report and accounts 2012
company Overview Strategy Performance Sustainability Governance Financial statements Additional information<br />
9<br />
It is one of the few international steel companies with a strong position in both,<br />
and has significant reserves of both. <strong>Severstal</strong> also has its own scrap collection<br />
facilities. Vertical integration provides cost advantages, reduces exposure to raw<br />
material price fluctuations and market disruptions, and ensures a reliable supply<br />
chain. It also provides market flexibility, allowing <strong>Severstal</strong> to move quickly for<br />
market opportunities, while adjusting to falling demand and economic downturn.<br />
Vertical integration provides one of the key elements of cost-competitiveness.<br />
Additionally, with its largest production facilities located in north-west Russia,<br />
<strong>Severstal</strong> benefits from relatively low-cost supplies of electricity and natural gas<br />
and, in addition, generates a growing proportion of its own electricity. As one of<br />
the largest producers of steel in Russia, it also benefits from economies of scale.<br />
To maintain its cost competitiveness, <strong>Severstal</strong> makes capital investments and<br />
operational efficiency initiatives to improve productivity and cost-efficiency. As<br />
such, it now operates some of the world’s most advanced and cost-efficient steel<br />
production facilities.<br />
A 44 per cent portfolio share of HVA products in Russia supports the growing<br />
automotive, manufacturing, machinery sectors as well as providing ready<br />
solutions for the construction and pipeline industries. <strong>Severstal</strong>’s main Russian<br />
production facilities offer easy access to the major steel-consuming markets in<br />
the central European part of Russia and the ports of the St. Petersburg region,<br />
and in the USA, <strong>Severstal</strong> is well positioned for the major steel markets of the<br />
world’s largest economy.<br />
BSS comprises five key pillars: Safety, Continuous improvement, Customer care,<br />
People of <strong>Severstal</strong>, and Business standard. Since its launch in 2010, <strong>Severstal</strong><br />
has realised significant improvements in lean production, overall operational<br />
efficiency and safety, and has delivered more than US$650 million of cumulative<br />
contribution to <strong>Severstal</strong>’s EBITDA, as per Company’s estimates. In 2012, the<br />
Business System contributed around US$400.7 million, including US $277 million<br />
in <strong>Severstal</strong> Russian Steel, US$115.7 million in <strong>Severstal</strong> Resources, and US$8<br />
million in <strong>Severstal</strong> International, as per Company’s estimates.<br />
Uniform standards are communicated through a Code of Business Conduct,<br />
while an Ethics Committee ensures effective feedback mechanisms. These<br />
uniform standards and corporate values form the basis of the Business System of<br />
<strong>Severstal</strong> and are crucial to achieving the company’s strategic goals:<br />
• Customer care<br />
• Efficiency and agility<br />
• Respect for people<br />
• Teamwork<br />
• Safety<br />
<strong>Severstal</strong> Annual Report and accounts 2012
company Overview Strategy Performance Sustainability Governance Financial statements Additional information<br />
10<br />
Business System of <strong>Severstal</strong><br />
The Business System of <strong>Severstal</strong> (BSS) is the<br />
logical development of more than ten years of<br />
ongoing efforts to optimise production and<br />
standardise internal processes, through many<br />
projects striving to achieve maximum efficiency of<br />
labour, equipment and energy. In 2010 we<br />
integrated and formalised these into a uniform<br />
improvement system across the company, which<br />
also includes a set of projects for cultural change –<br />
The Business System of <strong>Severstal</strong>.<br />
We believe this gives us a key competitive<br />
advantage, and is crucial for success in the steel<br />
and mining industry. Among industry players, the<br />
system is unrivalled in the extent of its integration<br />
and EBITDA contribution potential. Its aim is to<br />
achieve operational and organisational excellence<br />
throughout the value chain, improve customer<br />
service, and foster a culture of health and safety<br />
across the company. Ultimately, its intention is to<br />
make <strong>Severstal</strong> a global leader in the steel industry.<br />
We are expecting approximately US$1.3 billion<br />
contribution to EBITDA from 2010 to 2015 via the<br />
Business System initiatives.<br />
There are five main lines of development in the<br />
Business System:<br />
• Continuous improvement<br />
• Safety<br />
• Customer care<br />
• People of <strong>Severstal</strong><br />
• Business standard<br />
Continuous Improvement<br />
We wish to become an industry leader by efficiency, and intend to<br />
achieve this through sustained improvements in operational<br />
facilities and lean production. This means eliminating production<br />
losses and waste, optimising procurement and delivery processes,<br />
and making improvements in technology and our production line.<br />
For example, in our <strong>Severstal</strong> Russian Steel division, BSS continuous<br />
improvement projects have created efficiencies as follows in 2012:<br />
• Purchasing and logistics efficiency, a US$63.2 million gain –<br />
more efficient purchase practices include:<br />
• optimising sinter and coal charges by closer monitoring of<br />
process requirements and storage<br />
• improved transport logistics including delivery times, mode of<br />
delivery, and reduction of rail car turnover time<br />
• commercial work, such as a category-based approach to<br />
purchase, and promoting competition among suppliers to<br />
obtain better terms<br />
• Administrative cost optimisation, a US$11.7 million gain –<br />
examples include organisational restructuring, with restricted<br />
hiring after natural attrition in personnel numbers, and shared<br />
services within <strong>Severstal</strong> Group.<br />
• Continuous improvement, a US$117 million gain – projects in<br />
2012 have included:<br />
• selecting the optimal composition of charges<br />
• reducing external coke and pellet consumption<br />
• substituting expensive types of scrap with cheaper ones<br />
• actions to save on ferroalloys<br />
• actions to save on metallic materials in the charge<br />
• efficiencies from increasing production volumes
company Overview Strategy Performance Sustainability Governance Financial statements Additional information<br />
11<br />
People of <strong>Severstal</strong><br />
We aim to foster a collaborative, respectful and highly-professional<br />
working environment, with fair and clear HR practices that reflect<br />
our values and guarantee professional development opportunities<br />
for all employees. The <strong>Severstal</strong> People project is designed to<br />
improve employee well-being, motivation and performance in four<br />
key areas: development, engagement, working environment and<br />
motivation.<br />
In 2012, 43% of employees passed through training courses, and<br />
100% for the top three management levels. Average training time<br />
was about 54 hours per employee across the three divisions.<br />
We continued our management development programme Achieve<br />
More Together. By the end of the year the programme had around<br />
900 graduates, and more than 450 new participants had started<br />
the programme. It aims to support change at <strong>Severstal</strong>, by building<br />
a team of associates capable of initiating change and achieving<br />
outstanding results.<br />
On the communications front we trained shop supervisors and<br />
managers in internal communications standards and launched a<br />
hotline for handling employee enquiries. Improvements to the<br />
working environment in Cherepovets include 350 new parking<br />
spaces, extensive improvements to showers, and also a renovated<br />
cafeteria.<br />
Safety<br />
We want to achieve one of the lowest injury rates in the industry<br />
and reduce the number of fatalities at our facilities to zero.<br />
Involving employees in safety policies is crucial to this, and each<br />
employee must be aware of health and safety standards, and take<br />
responsibility for adhering to them. Therefore we run our Efficient<br />
Occupational Safety Management System, to provide the<br />
necessary training, establish clear responsibilities and ensure<br />
two-way communication. Under the system, we continuously<br />
monitor, measure and report process and behavioural safety. We<br />
identify and mitigate hazardous situations, conduct incident<br />
investigations, assess and control overall risk levels, and create a<br />
goal management programme.<br />
Within <strong>Severstal</strong> Russian Steel, we have identified and introduced<br />
65 new health and safety best practices. In addition, 1,700<br />
managers from 61 business units were briefed on workplace safety<br />
methods. We have also made corrections to the Workplace Safety<br />
manual based on feedback from employees, which will increase its<br />
effectiveness. We commissioned a software application in 2012 so<br />
the registering of hazardous incidents is now automated rather<br />
than in hard copy, as is the analysis safety effectiveness. The<br />
application is now being used by more than 3,000 employees. All<br />
in all, <strong>Severstal</strong> Russian Steel business units and companies<br />
reduced occupational injuries from 71 cases in 2011 to 49 in 2012.<br />
Customer Care<br />
Building a customer-oriented organisation is important for<br />
achieving our growth and high margin goals. We conduct customer<br />
surveys to improve product quality and delivery, and customer<br />
service. These surveys can identify specific customer requirements<br />
and opportunities to improve product quality, as well as ways to<br />
improve overall customer satisfaction.<br />
In the <strong>Severstal</strong> Russian Steel division, we have been developing a<br />
Service Level Agreement (SLA) tool and are in the process of<br />
introducing it, which will help focus on meeting the shipment time<br />
terms. In addition to improving the quality of products and<br />
gaining higher control over the quality of what we ship, special<br />
working groups have been looking into this.<br />
A working group established with OAO Kamaz, has introduced ‘pull’<br />
production aimed at increasing delivery discipline – and delivery<br />
volume increased from 14,685 tonnes in 2011 to 61,727 tonnes in<br />
2012. Another working group has assessed reducing production<br />
volatility and prompt order delivery support, and identified<br />
concrete measures for monthly monitoring.<br />
Internal communication programmes also help to increase<br />
employee awareness of a customer-focused culture, and we have<br />
used display stands, brochures and information sheets to this<br />
purpose. Overall, in the Russian Steel division, we estimate the<br />
EBITDA contribution of customer care projects to have been<br />
US$41million in 2012.<br />
Business Standard<br />
We continued to develop IT projects across all our divisions, of<br />
which the most important is the implementation of SAP. We<br />
launched SAP at <strong>Severstal</strong> Resources in 2009 and across almost all<br />
the <strong>Severstal</strong> Russian Steel division. The implementation will be<br />
complete in 2013. The project allows us to increase the efficiency<br />
of our business processes, the processing of administrative<br />
information and general management.<br />
<strong>Severstal</strong> Annual Report and accounts 2012
company Overview Strategy Performance Sustainability Governance Financial statements Additional information<br />
12<br />
Chairman statement<br />
Full vertical integration in<br />
both iron ore and coking<br />
coal production in Russia<br />
remains a key competitive<br />
advantage. To ensure this<br />
delivers the maximum<br />
benefit, <strong>Severstal</strong> Resources<br />
has consistently achieved its<br />
cost management targets to<br />
reinforce our strong position<br />
on the cost curve. In March<br />
2012 we completed the<br />
separation of Nordgold, so<br />
our mining operations are<br />
now totally concentrated on<br />
steel related mining.
company Overview Strategy Performance Sustainability Governance Financial statements Additional information<br />
13<br />
Dear Shareholders,<br />
2012 was a year of global economic uncertainty that led to more<br />
challenging trading conditions across the markets we address.<br />
Nevertheless, <strong>Severstal</strong>’s performance was resilient, producing a<br />
solid set of results. We were able to maintain good operating<br />
margins, pay down debt, and reward our shareholders through<br />
dividends.<br />
Health and safety is management’s top priority across all our<br />
operations and is overseen by the Board. In 2012, this included<br />
investing over US $304.3 million on initiatives designed to<br />
eliminate all fatal accidents by 2015. Against this background, we<br />
were devastated by the tragic accident at our Vorkutinskaya mine<br />
on 11 February this year, which resulted in nineteen fatalities. We<br />
extend our deepest condolences to the families and friends of<br />
those who died, and are working vigorously, along with the<br />
authorities, to understand the causes of this tragic accident.<br />
Our capital investment programme was cautious, and lower than<br />
originally predicted at the start of the year. Major projects included<br />
the construction of the Balakovo mini-mill, refurbishment of the<br />
coke battery #7 at Cherepovets Steel Mill and a coalmine methane<br />
power station at Vorkuta. We enter 2013 with well invested assets<br />
that are positioned to further enhance our focus on high valueadded<br />
products, and achieve additional efficiency and cost<br />
advantages. We do not currently plan to add capacity after the<br />
commissioning of these projects.<br />
This prudent approach enabled us to maintain strong liquidity,<br />
with US$1,726 million in cash and cash equivalents at the year<br />
end with committed unused credit lines of US$922 million. In<br />
September 2012 <strong>Severstal</strong> successfully placed US$475 million<br />
senior unsecured convertible bonds maturing in 2017 and in<br />
October 2012 we successfully placed US$750 million 10-year<br />
Eurobonds with an interest rate of 5.9%. We will maintain a strong<br />
balance sheet and target to be around net debt/EBITDA multiple<br />
of under 1.5x through the cycle.<br />
Full vertical integration in both iron ore and coking coal production<br />
in Russia remains a key competitive advantage. To ensure this<br />
delivers the maximum benefit, <strong>Severstal</strong> Resources has consistently<br />
achieved its cost management targets to reinforce our strong<br />
position on the cost curve. In March 2012 we completed the<br />
separation of Nordgold, so our mining operations are now totally<br />
concentrated on steel related mining.<br />
Launched in 2010, our Business System of <strong>Severstal</strong> projects are<br />
increasingly embedded in all elements of our activities and are<br />
leading to measurable enhancements to EBITDA. These companywide<br />
initiatives range from cost reduction and quality<br />
improvement initiatives to customer care and product<br />
development projects.<br />
Our sustainable development programmes are focused on<br />
environmental protection and energy efficiency. We made<br />
significant investments in both areas in 2012, to ensure we<br />
continue to make progress. As a result we reduced emissions and<br />
water consumption, and the amount of gas and electricity we use<br />
to produce a tonne of steel. Transparency is an important feature<br />
of our approach, with regular reporting based on best practice<br />
Global Reporting Initiative guidelines.<br />
We are committed to the highest standards of corporate<br />
governance, including regular external evaluation of how the<br />
Board is functioning. As the Independent Chairman, I lead a Board<br />
that is well balanced between executive and non-executive<br />
Directors and scrutinises management’s performance against<br />
agreed goals. I would like to thank my Board colleagues for all<br />
their help and wise counsel over another important year of<br />
development for the company.<br />
Communications with all our stakeholders remain a priority. In<br />
2012 this included hosting another Capital Markets Day for buy<br />
and sell side audiences in London, at which we brought together<br />
our senior management team. This year, the management team<br />
set out our strengths to meet the challenges in the steel and<br />
commodities markets including the progress we are making in the<br />
execution of our stated strategy.<br />
We are cautious about the outlook in our markets for the current<br />
year. Whilst we see some improvement in pricing and volumes in<br />
the first quarter of 2013, continued economic uncertainty and the<br />
commissioning of additional industry capacity will ensure the<br />
trading environment remains competitive.<br />
However, the long term fundamentals of the markets in which we<br />
operate remain attractive. According to some analyst reports, in<br />
Russia, the economy is expected to grow from US$2 trillion in 2011<br />
to more than US$3.2 trillion in 2017. Market experts say that in<br />
the United States, new vehicle registrations are set to rise by over<br />
6% in 2013 and forecasts for economic growth into the medium<br />
term have recently risen. <strong>Severstal</strong> has well invested operations<br />
that are strongly placed on the cost curve, combined with high<br />
exposure to more attractive high value-added product sectors. So<br />
the Board is confident of the outlook for the business.<br />
Christopher Clark<br />
Non-Executive Chairman of the Board of Directors<br />
<strong>Severstal</strong> Annual Report and accounts 2012
company Overview Strategy Performance Sustainability Governance Financial statements Additional information<br />
14<br />
CEO Statement<br />
Dear Shareholders, Colleagues, Partners,<br />
In 2012, <strong>Severstal</strong> demonstrated its fundamental strengths,<br />
performing resiliently in what were very challenging global<br />
economic conditions. Despite deteriorating markets and lower<br />
selling prices affecting the world steel industry, our focused<br />
strategy and integrated model, coupled with a continued<br />
contribution from our Business System of <strong>Severstal</strong> initiatives,<br />
enabled us to achieve a solid set of financial results.<br />
Our focus throughout the year was on efficiency and low cost<br />
production, while modernising our assets at <strong>Severstal</strong> Russian Steel<br />
and <strong>Severstal</strong> Resources, and ramping up additional capacities at<br />
<strong>Severstal</strong> International. Our long-term goal remains to become<br />
one of the world’s most efficient steel and steel-related mining<br />
companies.<br />
Revenue for the year was affected by overall lower realised selling<br />
prices and slightly lower sales at our <strong>Severstal</strong> Russian Steel<br />
division, and was 10.8% below the previous year. EBITDA in 2012<br />
was US$2,119 million and our continued focus on efficiency and<br />
cost control enabled us to achieve an EBITDA margin of 15.0%.<br />
<strong>Severstal</strong>’s balance sheet continues to be one of our major<br />
strengths, and we ended the year with US$1,726 million in cash<br />
and cash equivalents, and a lower net debt position.<br />
This resilient performance would not have been possible without<br />
the continued hard work and commitment of our outstanding<br />
people, whose dedication and skills are fundamental to <strong>Severstal</strong><br />
achieving its long term goals. I thank them for their efforts.<br />
On behalf of all management at <strong>Severstal</strong>, I would like to express<br />
my deepest condolences to the families, friends and colleagues of<br />
the miners who tragically died in an accident at the Vorkutinskaya<br />
mine on 11 February 2013. The health and safety of all employees<br />
across the group will always be our key priority.<br />
Strategy<br />
Our long term financial targets include becoming one of the top<br />
steelmakers globally by EBITDA, and one of the top steelmakers<br />
globally by return on capital employed. In effect, <strong>Severstal</strong> is driven<br />
to deliver profitability and not to pursue volume growth. Key to<br />
achieving these goals is a robust business model focused on low<br />
costs through vertical integration, with steel-related mining assets<br />
providing full self-sufficiency in iron ore and coking coal. Where we<br />
have investment programmes, they are designed to improve<br />
efficiency and enhance our margins, and I will address this in more<br />
detail below. Our strategic focus is on steel production, and<br />
particularly in developing our product portfolio. This is not only to<br />
meet the evolving demands of our customers, but to increase the<br />
ratio of our product mix in favour of high value-added products<br />
and added-value services. This, combined with our presence in<br />
fast-growing emerging markets as well as established markets with<br />
attractive growth dynamics, means we are well positioned to<br />
provide market-leading returns for our shareholders.<br />
Investment and Efficiency<br />
We continue to invest selectively across all our operations, to<br />
support our strategy by expanding production volumes in steel and<br />
mining, increasing output of high value-added products and<br />
improving our operational efficiency and reducing costs.<br />
The Group has a flexible investment programme which we are able<br />
to adjust to market conditions, lowering our cash capex during the<br />
year, finally investing US$1,448 million in 2012 across the whole<br />
company. In 2013, we plan to invest even less: US$1,336 million,<br />
while at the same time continuing and completing major projects<br />
to support our growth and long-term competitive strategy, with<br />
major focus on <strong>Severstal</strong> Russian Steel and <strong>Severstal</strong> Resources.<br />
Since we completed large-scale modernisation and expansion at<br />
our North American assets in 2012, 2013’s capex in this division<br />
will be relatively small, of US$107 million only.<br />
As well as investing for the future, we constantly strive to improve<br />
the efficiency and cost-effectiveness of our operations, and our<br />
Business System of <strong>Severstal</strong> programme, implemented in 2010,<br />
continues to make excellent progress. It remains on track to make<br />
a cumulative contribution of approximately US$1,300 million to<br />
our EBITDA from 2010 to 2015.<br />
<strong>Severstal</strong> Russian Steel<br />
<strong>Severstal</strong> Russian Steel is a world-class, low-cost steel producer, but<br />
it inevitably felt the slower market conditions with its performance<br />
reflecting a weaker pricing environment and lower sales volumes,<br />
including a contraction in large-diameter pipe sales. Revenue for<br />
the year decreased by 18.3% to US$8,617 million and EBITDA was<br />
US$939 1 million. In line with our strategy, the share of high<br />
value-added products in the sales portfolio remained the highest<br />
among our Russian peers at 44% and domestic sales increased<br />
their proportion of the total selling volumes to 60%.<br />
Major investment projects during the year included the continuing<br />
construction of the Balakovo mini-mill, supporting our diversification<br />
into long products, and the refurbishment of Coke Battery #7 at<br />
Cherepovets reinforcing our complete self-sufficiency in coke. In 2013<br />
we will complete construction of the mini-mill and other projects will<br />
include development of specialised steel service centres offering<br />
solutions to the construction, automotive and machinery sectors.<br />
<strong>Severstal</strong> Resources<br />
While overall realised volumes remained broadly flat, lower coking<br />
coal and iron ore prices during the year had an impact on revenue,<br />
down 19% to US$3,005 million, and EBITDA, 38.6% lower at<br />
US$985 2 million. However, <strong>Severstal</strong> Resources achieved strong<br />
reductions in cost during the year, and we will continue to keep<br />
production costs under control.<br />
Investments during the year included the construction of two<br />
inclined shafts and modernisation of the Pechorskaya preparation<br />
plant at Vorkutaugol and the construction of a steeply inclined<br />
shaft at Olkon. These operational improvements all contribute to<br />
steady reduction of costs. In 2013 we will invest US$525 million in<br />
<strong>Severstal</strong> Resources, to realise similar development projects,<br />
including construction of inclined shafts at the Zapolyarnaya and<br />
Vorgashoskaya mines. Developing the Usinskoye deposit and<br />
expanding our iron ore mining operations both strengthen our<br />
self-sufficiency advantage.<br />
1,2 Excluding intercompany dividend income.
company Overview Strategy Performance Sustainability Governance Financial statements Additional information<br />
15<br />
<strong>Severstal</strong> International<br />
In North America we have invested to create some of the most<br />
modern and efficient plants in the region. In 2012 <strong>Severstal</strong><br />
International’s revenue rose by 13.3% to US$3,878 million, due to<br />
newly commissioned facilities at Columbus, which helped offset<br />
lower realised prices in the USA. It also helped underpin EBITDA<br />
performance, which was broadly similar to 2011, with EBITDA of<br />
US$166 3 million in 2012, compared to US$181 4 million in the<br />
previous year.<br />
In line with our strategy, sales of high value-added products made<br />
up 44% of the portfolio last year, and this proportion is growing<br />
due to demand from our automotive customers. Following a high<br />
level of investment in our <strong>Severstal</strong> International operations in<br />
previous years, leading to growing production and sales, the bulk<br />
of this year’s programme will be invested in maintenance and to<br />
improve operational efficiency.<br />
Outlook<br />
Global economic conditions remain uncertain for the steel industry,<br />
but I am confident <strong>Severstal</strong> has the right strategy to address our<br />
marketplace in 2013, which we believe could see some<br />
improvement in steel, iron ore and coking coal demand. <strong>Severstal</strong>’s<br />
well invested operations, and the continued hard work and<br />
flexibility of our people, give me great confidence in the mediumterm<br />
outlook for the business.<br />
Alexey Mordashov<br />
Chief Executive Officer<br />
Global economic conditions remain<br />
uncertain for the steel industry, but I<br />
am confident <strong>Severstal</strong> has the right<br />
strategy to address our marketplace<br />
in 2013, which we believe could see<br />
some improvement in steel, iron ore<br />
and coking coal demand.<br />
3,4 Excluding intercompany dividend income.
company Overview Strategy Performance Sustainability Governance Financial statements Additional information<br />
16<br />
Page Title
company Overview Strategy Performance Sustainability Governance Financial statements Additional information<br />
17<br />
Strategy<br />
What’s inside<br />
18 Strategy<br />
20 Management Q&A<br />
22 Case 1 – Presence in growing markets<br />
24 Case 2 – Efficiency, low cost of production<br />
26 Case 3 – Product mix, premium margins
company Overview Strategy Performance Sustainability Governance Financial statements Additional information<br />
18<br />
Strategy<br />
We are striving to build a resilient company making good money<br />
on weak markets and strong money on good markets.<br />
1. <strong>Severstal</strong> is a global company focused on steel and<br />
mining<br />
<strong>Severstal</strong> has firmly set and communicated its development<br />
strategy to the market. The company’s core competence is in<br />
making steel and in mining steel-related raw materials. <strong>Severstal</strong><br />
strives to keep its global leadership in low-cost production through<br />
efficient vertical integration, presence on structurally attractive<br />
markets and customer focus. This helps <strong>Severstal</strong> to lead globally<br />
in return on capital and EBITDA margin. Operating in a cyclical<br />
industry we also prioritise having a strong balance sheet. At the<br />
end of 2012, <strong>Severstal</strong> has one of the lowest net debt/EBITDA<br />
ratios in the sector.<br />
2. <strong>Severstal</strong> is a vertically integrated company<br />
<strong>Severstal</strong> is a vertically integrated business, covering the whole<br />
production cycle from mining raw materials to making and<br />
distributing high value-added (HVA) steel products. This affords us<br />
higher resilience in the cyclical steel industry. Early in 2013, <strong>Severstal</strong><br />
was ranked as the third most competitive global steelmaker in a<br />
report by World Steel Dynamics (WSD). Full vertical integration helps<br />
us maintain high profitability at group level, as buying most of the<br />
raw materials from our own <strong>Severstal</strong> Resources division means we<br />
are economically hedged from commodity price fluctuations.<br />
<strong>Severstal</strong>’s Russian steel operations are almost all self-sufficient in<br />
iron ore and coking coal, respectively. As we are increasing volumes<br />
at our mining assets, <strong>Severstal</strong> Resources is becoming a sizable<br />
supplier to third parties. In 2012, our shipments to third parties of<br />
iron ore pellets and coking coal reached 60% and 35% of total<br />
volumes produced, respectively. Although in the tough 2012 year,<br />
our EBITDA margin declined to 15%, compared to 23% in 2011, it<br />
still remains one of the best in the global steel industry in 2012.<br />
3. <strong>Severstal</strong> is a low-cost producer, focused on internal<br />
improvements<br />
One of our priorities is to be a low-cost producer in every region we<br />
are present. Our competitive position relies on vertical integration<br />
with a sizeable steel-related mining business, and having a large<br />
share of HVA products in the steel portfolio. To retain that low-cost<br />
position in a cost inflation environment, we are implementing a set<br />
of projects for internal improvement, called <strong>Severstal</strong> Business<br />
System. We expect it to achieve approximately US$1.3 billion of<br />
savings contributing to the company EBITDA from 2010 to 2015.<br />
4. <strong>Severstal</strong> is presented in the right markets and with<br />
the right assets<br />
<strong>Severstal</strong>’s key markets are demonstrating high growth rates for<br />
steel demand.<br />
Russia<br />
Russia remains <strong>Severstal</strong>’s most attractive market mostly due to its<br />
prospects for high growth in steel consumption. Growing personal<br />
incomes, increasing demand from the real estate and automotive<br />
industries, and underinvested infrastructure will drive further steel<br />
consumption. We expect domestic steel demand to grow at the<br />
current pace for the next five years. Our share of HVA products in<br />
the portfolio in Russia was 44% (sales volume) at the end of 2012<br />
which is the highest to date among Russian peers. Our investment<br />
in the production of HVA products includes construction of two<br />
additional service centres in Russia in 2013 for auto and ‘white<br />
goods’ producers, and further expansion of the Steel Solutions<br />
projects for the maturing real estate market. In line with our<br />
strategy of expanding into promising market niches, this year we<br />
are completing construction of a 1 mmt/y mini-mill Balakovo in<br />
Volga region, to produce rebar and construction sections.<br />
USA<br />
As the US economy continues its recovery from the recessionary<br />
effects of the global financial crisis, US steel demand is expected<br />
to grow steadily, driven by the oil and gas industry (including<br />
non-conventional drilling), automotive and manufacturing<br />
industries, emerging growth in the construction sector and long<br />
term population growth, in addition to the need to build up<br />
previously underinvested infrastructure. In 2011-2012 we<br />
completed a modernisation programme, including commissioning<br />
of new cold-rolling mill and new HDGL at <strong>Severstal</strong> Dearborn. This<br />
has improved product quality while lowering manufacturing costs.<br />
5. <strong>Severstal</strong> is offering growth opportunities in steelrelated<br />
mining business<br />
<strong>Severstal</strong>’s strategy envisages further efficient mining expansion.<br />
While the top priority is low-cost mining, we intend to grow our<br />
volumes at our current assets in Russia and the USA, as well as to<br />
develop low-cost mining greenfields. For instance, our coking coal<br />
concentrate production volumes in Russia are expected to increase<br />
by around 45% by 2015, compared to 2012. Key greenfields<br />
include Usinskoe and Tyva coking coal deposits in Russia, and the<br />
Putu Range iron ore project in Liberia. <strong>Severstal</strong> Resources achieved<br />
an EBITDA margin of 32.8% in 2012.<br />
<strong>Severstal</strong> Annual Report and accounts 2012
company Overview Strategy Performance Sustainability Governance Financial statements Additional information<br />
19<br />
6. <strong>Severstal</strong> focuses on shareholders<br />
<strong>Severstal</strong>’s Board comprises ten members, with a strong<br />
independent element. Its current structure represents a balance<br />
between Chairman, five Independent Non-Executive Directors<br />
including the Chairman (who met the independence criteria on his<br />
appointment as required by the UK Corporate Governance Code<br />
2012), one Non-Executive Director and four Executives. <strong>Severstal</strong><br />
strongly believes that maintaining such a balance on the Board is<br />
a prerequisite for continued correct decision-making and<br />
governance. <strong>Severstal</strong> sticks to its dividend policy, with quarterly<br />
payments of not less than 25% of net profit, provided the company<br />
meets certain financial criteria. In 2012 our dividend pay-out was<br />
around 36% 5 . Following suggestions from investors, in 2012 we<br />
completed the separation of Nordgold – the gold division inside<br />
the company, launched in 2011. That left <strong>Severstal</strong>’s production<br />
portfolio with steel and steel-related raw materials only. Nordgold<br />
became independent and was listed on London Stock Exchange in<br />
January 2012. In July 2012 we cancelled 170 million treasury<br />
shares, which were used in the Nordgold separation process. Most<br />
of the remaining treasury shares were used for the convertible<br />
bond issue later in 2012.<br />
7. <strong>Severstal</strong> has a comfortable debt level<br />
<strong>Severstal</strong> pursues a conservative borrowing policy. Our long-term<br />
and strong relations with banks, and access to both domestic and<br />
international external financing, allow us to have a well-diversified<br />
financial structure.<br />
The company’s strategy relies on attracting long-term financing<br />
with a convenient payment schedule. In 2012, we raised around<br />
US$1.2 billion in convertible and Eurobonds. The convertible bonds<br />
brought us an interest rate of 1% per annum, which is payable<br />
semi-annually in March and September each year, beginning in<br />
March 2013, and a yield-to-maturity of 2% per annum, the lowest<br />
in the company’s public history, thus lowering the cost of capital.<br />
We used most of the proceeds for refinancing the current debt, as<br />
well as general corporate purposes.<br />
<strong>Severstal</strong>’s credit portfolio is well-balanced by both maturities and<br />
currencies. Most of our debt is either mid- or long-term with<br />
minimal sizeable consecutive payments. At the end of 2012, 83%<br />
of our debt was in USD, and is naturally partially covered due to<br />
the currency structure of our revenue. In 2012 our net debt<br />
declined by 3.2%. Though our net debt/EBITDA ratio increased by<br />
the end of the year to 1.9x, which is above the internal target of<br />
1.5x, we will monitor our debt level closely in 2013 to return it to<br />
the targeted net debt/EBITDA of 1.5x. Meanwhile we have reduced<br />
our capex year on year.<br />
<strong>Severstal</strong> has a reputation as a reliable borrower. Since 2010,<br />
international rating agencies have raised our credit rating two<br />
times with a stable outlook.<br />
5 Includes recommended dividend payment of 1.89 Roubles per share (approximately<br />
US$0.06) for the 12 months ended 31 December 2012. The dividend is to be<br />
approved at the AGM on 13 June 2013.<br />
<strong>Severstal</strong> Annual Report and accounts 2012
company Overview Strategy Performance Sustainability Governance Financial statements Additional information<br />
20<br />
Management Q&A<br />
In addition to the strategy outlined above, shareholders and prospective investors often pose questions<br />
relating to specific situations and strategies. Here our management team answers questions on some of<br />
the issues we are most often asked about.<br />
?<br />
How has the global financial crisis of 2007-2008<br />
affected the Russian steel industry, and how has<br />
<strong>Severstal</strong> responded to this challenging time?<br />
“Many companies were poorly prepared when the economic crisis hit<br />
Russia in late 2008. Steel sales dropped dramatically. Russian<br />
steelmakers had a sizable debt in USD/EURO, and as large employers<br />
they had sizeable fixed costs. With EBITDA shrinking rapidly, many<br />
companies were in trouble. In <strong>Severstal</strong>’s case, our 2008 US<br />
acquisition became a negative in the face of the crisis. Fortunately,<br />
our debt level was affordable. Our financial responses included cutting<br />
administrative costs, selling on a pre-payment basis and adjusting<br />
capex to the steel cycle (the steel industry is cyclical). We were able to<br />
decrease debt level and improve cash balance. The 2008 crisis<br />
prompted us to revise our strategy and business processes. We<br />
divested underperforming assets and gave priority status to our set of<br />
initiatives for internal improvements (The Business System of<br />
<strong>Severstal</strong>). In addition, we now have a cautious financial policy, with<br />
potential investments in new geographies subject to rigorous KPIs.<br />
So, today we are in a much better shape for any market development<br />
scenario.”<br />
?<br />
What differentiates <strong>Severstal</strong><br />
amongst steel producers?<br />
“The Russian steel industry is one of the most competitive globally.<br />
So, like some of our local peers, we are naturally a low-cost producer.<br />
But in the steel industry, costs are around 70% related to raw<br />
materials, so our efficient vertical integration in steel-related raw<br />
materials is an additional advantage compared to the domestic and<br />
international competition. In addition, we stick to our strategy –<br />
presence on growing and consolidated markets and focus on our<br />
customers’ needs. Also, one of our priorities is the production of HVA<br />
products, which allows us to be one of the global leaders in EBITDA<br />
margin. Our assets are well-invested, modern and reliable, with<br />
reasonably moderate annual maintenance capex. Hence, depending<br />
on the market environment, we can afford adjusting our annual<br />
investment needs. For instance, we cut our 2012 total target capex<br />
during the year in light of the slowing market conditions, from<br />
US$1.7 billion to US$1.4 billion. As a result, our 2012 operating cash<br />
flow of US$1.8 billion more than covered the 2012 capex, and free<br />
cash flow was positive US$431 million. Last but not least, our<br />
well-established set of projects for internal improvements is already<br />
bearing fruit. All this allowed <strong>Severstal</strong> to achieve a 15% EBITDA<br />
margin in 2012 in challenging market conditions.”<br />
?<br />
How do you maintain<br />
financial stability?<br />
“We adjust our capital expenditure to the steel cycle, and it is capped,<br />
as with M&A and dividends, by a leverage target. We maintain strong<br />
liquidity, with a cash cushion in reliable banks of US$1.7 billion as at<br />
the end of 2012, and committed unused credit lines of US$922<br />
million covering 2013 upcoming short-term debt maturities of<br />
US$1.3 billion 6 . As a credible bond issuer and borrower, we have easy<br />
access to a diverse range of funding sources at any time. In 2012<br />
alone we made two bonds issues for the total amount of around US$<br />
$1.2 billion. Dividends are subject to prevailing market conditions and<br />
strategic financial targets. In 2012 our dividend pay-out was around<br />
36% 7 . ROCE 8 was above 11% with constant monitoring of all projects’<br />
return.”<br />
?<br />
What are your capital expenditure<br />
plans for 2013?<br />
“Our 2013 target capex is US$1.3 billion and it will be again fully<br />
financed through our operating cash flow. Hence, for 2013 we target<br />
positive free cash flow. More than a half our capex will be invested in<br />
further development.”`<br />
?<br />
How do you view 2013<br />
and what will be your focus?<br />
“Though the fragile economic environment will be restraining steel<br />
prices from further growth throughout 2013, we are seeing slight<br />
signs of recovery. However, since steelmakers globally will remain<br />
squeezed from two ends – relatively expensive raw materials and<br />
steel over-capacity – our strategy will be to further reduce costs,<br />
minimise capex and support only projects with the highest return,<br />
prioritising customer care initiatives. In addition, we maintain a<br />
prudent financial policy with restrictions on cash-based M&A in the<br />
current environment.”<br />
<strong>Severstal</strong> Annual Report and accounts 2012<br />
6 Represents principal amount of debt.<br />
7 Includes recommended dividend payment of 1.89 Roubles per share (approximately<br />
US$0.06) for the 12 months ended 31 December 2012. The dividend is to be<br />
approved at the AGM on 13 June 2013.<br />
8 ROCE is calculated by the following formula: profit from operations / (total assets<br />
minus current liabilities average for the period), as reported in 2012 FS.
company Overview Strategy Performance Sustainability Governance Financial statements Additional information<br />
21<br />
?<br />
How importantly do you view<br />
volume growth?<br />
“We are managing <strong>Severstal</strong> to achieve profitability, maintain<br />
low-cost production on the global scale, and not to pursue volume<br />
growth. Our well-invested assets have low capex requirements and we<br />
have major programmes designed to improve efficiency, as well as<br />
projects enhancing our margins through expansion in production of<br />
HVA products. Thus we are prudent, and do not produce<br />
unnecessarily. We are increasing volumes in mining, as our low-cost<br />
production allows us to sell substantial amounts of both iron ore<br />
pellets and coking coal to third parties in Russia and beyond. By 2015<br />
we intend to growth our sales of coking coal concentrate in Russia by<br />
45%, compared to the level of 2012.”<br />
?<br />
What is your view<br />
of greenfield projects at present?<br />
“While we retain a portfolio of attractive greenfield licenses, our policy<br />
is to minimise future cash exposure through partnerships and JVs,<br />
and a staged approach in development of such projects. Current<br />
investments in the greenfields are relatively small; in 2013 they will<br />
not exceed US$46 million for all the projects. We intend to minimise<br />
our capex exposure and preserve our financial flexibility. Balance<br />
sheet strength is our top priority.”
company Overview Strategy Performance Sustainability Governance Financial statements Additional information<br />
22<br />
Case 1 – Presence in growing markets<br />
Global steel demand is expected to exceed 2 billion tonnes by<br />
2023, driven by construction demand and middle class<br />
consumption in emerging economies, according to some experts.<br />
<strong>Severstal</strong> is principally based in Russia, a leading emerging market<br />
economy expected to grow from US$2 trillion in 2011 to more<br />
than US$3.2 trillion in 2017, according to market research, with<br />
significant increases in demand for infrastructure projects,<br />
consumer goods and automobiles. In the US, our other major<br />
sphere of operations, the economy is poised for recovery and<br />
growth, with new vehicle registrations expected to climb 6.6% in<br />
2013, say local experts.<br />
A focus on mature, consolidated markets and regions with<br />
strong domestic steel consumption<br />
Our main operating assets are located in Russia and the USA, at the<br />
heart of the major consuming regions with favourable logistics for<br />
serving both domestic and international customers. In Russia, our<br />
main production facilities at Cherepovets offer easy access to the<br />
major steel-consuming markets in the central European part of<br />
Russia, and to the CIS and Eastern European steel markets, as well<br />
as low cost freight access to the ports of the St. Petersburg region. In<br />
the USA, Dearborn is well positioned for the major steel markets of<br />
the world’s largest economy, in close proximity to the major auto<br />
manufacturers with whom we have long-term contracts, and<br />
Columbus is well located for these, and for the Mexican market also.<br />
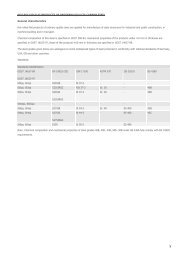
The most attractive locations for steel production<br />
<strong>Severstal</strong> is present in the fastest-growing global steel<br />
consumption locations. The chart “The global map of average steel<br />
usage per capita” shows steel use per capita, and the factors<br />
combining to create a favourable steel industry business model:<br />
expanding consumer power, urbanisation, considerable<br />
infrastructure development and abundant domestic raw materials.<br />
<strong>Severstal</strong>’s locations fit the bill on every count.
company Overview Strategy Performance Sustainability Governance Financial statements Additional information<br />
23<br />
The global map of average steel usage per capita<br />
Russia, US and Brazil are the Most Attractive Places for Steel Production based on a Proper Business Model<br />
291kg +27%<br />
Russia<br />
USA<br />
288kg +23%<br />
Brazil<br />
58kg Apparent Steel Use Per Capita, 2011<br />
+8% Apparent Finished Steel Use CAGR in 2009–2011, %<br />
Self-sufficiency Iron ore Coking coal<br />
123kg +16%<br />
Full<br />
Lacking<br />
• Growing population, expanding consumer power and urbanization<br />
• Considerable infrastructure development<br />
• Abundant raw materials<br />
<strong>Severstal</strong> Annual Report and accounts 2012
company Overview Strategy Performance Sustainability Governance Financial statements Additional information<br />
24<br />
Case 2 – Efficiency, low cost of production<br />
<strong>Severstal</strong> is one of the few international steel companies with a<br />
strong position in both iron ore and coking coal. This provides cost<br />
advantages and reduces exposure to raw material price<br />
fluctuations. In addition, <strong>Severstal</strong> also benefits from relatively lowcost<br />
supplies of electricity and natural gas. Historically, Russia is a<br />
low-cost steel producer, and as one of the largest producers of<br />
steel in Russia, <strong>Severstal</strong> benefits from economies of scale. To<br />
maintain its cost competitiveness, <strong>Severstal</strong> makes capital<br />
investments to improve productivity and efficiency.<br />
Principally, it is vertical integration which help us keep costs lower<br />
than our peers, even in a raw materials market downturn, as shown<br />
by the graph “Cost control at <strong>Severstal</strong> Russian Steel”. Quality iron<br />
ore deposits are hard to find and quality hard coking coal is scarce,<br />
but we are able to supply our own needs with premium grades of<br />
primary raw materials, and also sell significant amounts of iron ore<br />
and coking coal to external parties.<br />
However, only the right vertical integration helps – it must be<br />
efficient. Several years in a row we have been able to keep our cash<br />
costs at Vorkuta, Karelky Okatysh and Olkon at the same level,<br />
while for competitors, costs have been escalating. As a result, our<br />
mining assets are improving on the cost curve. For instance, on the<br />
graph “Cost control at <strong>Severstal</strong> Resources” below, cash costs are<br />
stable despite inflation in Russia being around 8% in 2012, and<br />
with a strong rouble.<br />
We have achieved this through more efficient use of existing<br />
infrastructure and equipment, a sharp improvement in labour<br />
productivity, operational improvements such as the inclined shafts,<br />
and volume growth through plant expansion. The opportunity we<br />
are exploring for brownfield expansion through the adjacent<br />
Usinskoye coal deposit, would achieve costs at least 20-30% less<br />
than at Vorkuta today, by using the latest coal mining<br />
technologies, sharing the infrastructure and our world-leading<br />
labour productivity. In addition, the launch of a methane gas<br />
power plant at Vorkutaugol will secure 80% self-sufficiency in<br />
electricity at the Severnaya mine.<br />
Even in North America, where only one of our assets is partially<br />
integrated in coking coal we also manage to reduce costs. Since we<br />
cannot affect the cost of raw materials we buy from the market, in<br />
the US we are focusing on improving our conversion costs through<br />
replacing older equipment with modern – graph “Cost control at<br />
<strong>Severstal</strong> International”.<br />
Cost control at <strong>Severstal</strong> Russian Steel.<br />
Vertical integration helps us to benefit from mining margins regardless of the market environment<br />
Cherepovets Steel Mill production cash cost of slab, $/t<br />
600<br />
$559<br />
$537<br />
500<br />
400<br />
$484<br />
$472<br />
$457 $457<br />
$432<br />
$401<br />
300<br />
200<br />
$358<br />
$389 $378<br />
$329 $337 $344 $336 $348<br />
100<br />
0<br />
1Q11 2Q11 3Q11 4Q11 1Q12 2Q12 3Q12 4Q12<br />
Cash cost of slab on an integrated basis* Contribution of the Resources division to the integrated costs<br />
* Cash costs per tonne represent difference between price/t and EBITDA/t<br />
<strong>Severstal</strong> Annual Report and accounts 2012
company Overview Strategy Performance Sustainability Governance Financial statements Additional information<br />
25<br />
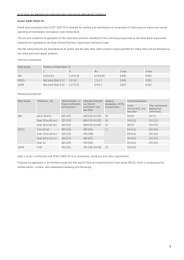
Cost control at <strong>Severstal</strong> Resources.<br />
Vorkuta coking coal<br />
concentrate total cash costs*<br />
Cost control at <strong>Severstal</strong> International.<br />
Dearborn HRC conversion costs<br />
from total cash costs, $/t<br />
$92/t<br />
$90/t<br />
$659/t<br />
$659/t<br />
$199/t<br />
$187/t<br />
2011<br />
2012<br />
2011<br />
2012<br />
Karelskiy Okatysh pellet<br />
total cash costs*<br />
Dearborn CRC conversion costs<br />
from total cash costs, $/t<br />
$62/t<br />
$59/t<br />
$761/t<br />
$90/t<br />
$722/t<br />
$45/t<br />
2011<br />
2012<br />
2011<br />
2012<br />
PBS coking coal concentrate<br />
total cash costs*<br />
Columbus HRC conversion costs<br />
from total cash costs, $/t<br />
$112/t<br />
$107/t<br />
$686/t<br />
$124/t<br />
$657/t<br />
$115/t<br />
2011<br />
2012<br />
2011<br />
2012<br />
Olkon iron ore concentrate<br />
total cash costs*<br />
$48/t<br />
$50/t<br />
2011<br />
2012<br />
* Cash costs per tonne represent difference between price/t and EBITDA/t<br />
<strong>Severstal</strong> Annual Report and accounts 2012
company Overview Strategy Performance Sustainability Governance Financial statements Additional information<br />
26<br />
Case 3 – Product mix, premium margins<br />
<strong>Severstal</strong> is the Russian leader in high-value-added (HVA) steel<br />
production with product mix including 44 per cent HVA products in<br />
2012. So in recent years we have invested strategically in the<br />
production facilities needed to support the growing number of<br />
contracts for these higher margin products.<br />
Automotive<br />
We aim to increase our share of the growing Russian autosheet<br />
market, currently about 20 per cent. Our focus is on growing our<br />
sales to foreign car brands manufacturing in Russia, and on higher<br />
sales of lucrative galvanized sheet. At Cherepovets we have now<br />
commissioned a second colour-coating line (CCL-2) to double our<br />
output of coated hot-dip rolled products. We have also developed<br />
several service centres near St. Petersburg and Vsevolozhsk, a joint<br />
venture with Gestamp, and are launching a joint venture with<br />
Mitsui – to supply stampings for the auto and machinery<br />
industries – the latter operating a fully automated line for<br />
assembly of vehicle units. Similarly, in the USA, our new hot-dip<br />
galvanizing line (HDGL) at Dearborn strengthens our presence in<br />
the recovering automotive industry, by meeting the high demand<br />
for galvanized and galvanneal products for automobiles.<br />
Large diameter pipes<br />
We also focus on providing value-added solutions for the pipeline<br />
industry, and in position to benefit from the planned construction<br />
of the South Stream and Chayanda pipelines. We serve two<br />
distinct markets: Selling increasing amounts of plate from Rolling<br />
Plate Mill 5,000 to Russian pipe producers, and selling specialist<br />
large-diameter pipes from Izhora Pipe Plant to oil and gas<br />
companies.
company Overview Strategy Performance Sustainability Governance Financial statements Additional information<br />
27
company Overview Strategy Performance Sustainability Governance Financial statements Additional information<br />
28<br />
Page Title
company Overview Strategy Performance Sustainability Governance Financial statements Additional information<br />
29<br />
PERFORMANCE<br />
What’s inside<br />
30 CFO statement<br />
32 Business overview<br />
38 <strong>Severstal</strong> Resources<br />
50 <strong>Severstal</strong> Russian Steel<br />
62 <strong>Severstal</strong> International
company Overview Strategy Performance Sustainability Governance Financial statements Additional information<br />
30<br />
CFO statement<br />
Our strong credit metrics<br />
enabled us to improve our<br />
debt profile and refinance part<br />
of our public debt instruments<br />
with more favourable<br />
issuances in 2012. In<br />
September 2012 <strong>Severstal</strong><br />
successfully placed US$475<br />
million senior unsecured<br />
convertible bonds maturing in<br />
2017 and in October 2012 we<br />
successfully placed US$750<br />
million 10-year Eurobonds<br />
with an interest rate of 5.9%.<br />
Lower interest rates help us to<br />
reduce interest payment<br />
adding to the company’s<br />
financial stability and keeping<br />
liquidity inside the company.
company Overview Strategy Performance Sustainability Governance Financial statements Additional information<br />
31<br />
Dear Shareholders,<br />
Despite worsening economic conditions, <strong>Severstal</strong> delivered a solid<br />
set of results in 2012, maintaining the Group’s EBITDA margin at<br />
15.0%, reflecting the resilience of the business. A deteriorating<br />
market backdrop and lower selling prices negatively affected our<br />
financial results. However, our position as a low-cost steel producer<br />
in Russia with full vertical integration allowed us to maintain<br />
almost full utilization rates during the year at our steel, iron ore<br />
and coking coal operations. In the US we successfully ramped-up<br />
the facilities, launched in 2011 and reached good levels of<br />
capacity utilization. Our business initiatives continued to yield<br />
efficiency and cost advantages.<br />
Despite negative impact coming from the global market, our<br />
financial position remained strong during the year. Our EBITDA for<br />
2012 came in at US$2.1 billion with the margin of 15.0%. Our debt<br />
metrics stays solid as well, although our net debt/EBITDA ratio<br />
increased by the end of the year to 1.9x, which is above the<br />
internal target of 1.5x. We will closely monitor our debt level in<br />
2013 to return it to the targeted net debt/EBITDA of 1.5x,<br />
meanwhile already reduced our capex year on year. As for the debt<br />
we reduced gross debt from US$5,976 million to US$5,710 million<br />
over the year, and net debt from US$4,112 million to $3,983<br />
million by the end of the year. Despite that our liquidity position<br />
remains strong with US$1,726 million in cash and cash<br />
equivalents, exceeding short-term debt of US$1,382 million 9 , and<br />
committed unused credit lines of US$922 million.<br />
Our strong credit metrics enabled us to improve our debt profile<br />
and refinance part of our public debt instruments with more<br />
favourable issuances in 2012. In September 2012 <strong>Severstal</strong><br />
successfully placed US$475 million senior unsecured convertible<br />
bonds maturing in 2017 and in October 2012 we successfully<br />
placed US$750 million 10-year Eurobonds with an interest rate of<br />
5.9%. Lower interest rates help us reduce interest payment adding<br />
to the company’s financial stability and keeping liquidity inside the<br />
company.<br />
As for our debt structure it remains stable dominated by US dollar<br />
(83% of total by the end of year) and public debt instruments<br />
(81% of total). Debt domination by US dollar is naturally hedged<br />
through our export inflows and cash and equivalents’ position, also<br />
led by US dollar (72% of total).<br />
Our focus throughout the year was on efficiency and low cost<br />
production whilst modernizing our assets at <strong>Severstal</strong> Russian Steel<br />
and <strong>Severstal</strong> Resources and ramping up the additional capacities<br />
at <strong>Severstal</strong> International. We continued to focus on delivering our<br />
long-term strategy to become one of the most efficient verticallyintegrated<br />
steelmakers globally.<br />
Our cash Capex for FY2012 amounted to $1,448 million. This was<br />
lower than initially planned. Capex was adjusted during the year in<br />
the light of slowing market conditions. Our major projects in 2012<br />
included continuing construction of the Balakovo mini-mill,<br />
refurbishment of Coke Battery #7 at Cherepovets and a coalmine<br />
methane power station at Vorkuta. As previously announced, our<br />
2013 capital expenditure program will be $1.3 billion including<br />
completion of the Balakovo mini-mill construction and its launch in<br />
mid-2013; development of specialised steel service centres,<br />
construction of two inclined shafts and modernization of the<br />
Pechorskaya preparation plant at Vorkutaugol, the construction of<br />
a steeply inclined conveyor and geological exploration at Olkon.<br />
Following 2012 results, the Board of Directors recommended<br />
dividend payment of 1.89 roubles per share (approximately<br />
US$0.06) for the 12 months ended 31 December 2012, reflecting<br />
the Board’s commitment to shareholder returns and confidence in<br />
the medium term outlook and the financial strength of the<br />
company. The dividend is to be approved at the AGM on 13 June<br />
2013. If approved, the dividend amount for all the quarters of<br />
2012 will total 10.66 roubles with the payout ratio of 36%.<br />
In 2012 we completed the separation of Nordgold – the gold<br />
division inside the company, launched in 2011. That left <strong>Severstal</strong>’s<br />
production portfolio with only steel and steel-related raw materials<br />
(iron ore and coking coal), which will be in focus of the corporate<br />
development going forward. Nordgold became independent and<br />
was listed on London Stock Exchange in January 2012. In July<br />
2012 we cancelled 170 million treasury shares, which were used in<br />
the Nordgold separation process.<br />
We held Capital Markets Day in London in September 2012 for the<br />
second year in a row, delivering on our promise made in 2011 to<br />
run Capital Markets Day on an annual basis. Investors from<br />
different investment organizations, both equity and debt, as well<br />
as sell-side analysts from the largest investment banks<br />
participated in the event. During this event we confirmed our<br />
long-term strategy, which was positively taken by the participants.<br />
Despite the challenging year for the industry <strong>Severstal</strong> managed to<br />
improve its credit rating profile by being upgraded to BB+ by<br />
Standard & Poor’s and Ba1 by Moody’s.<br />
We continued to develop IT projects across all our divisions, of<br />
which the most important is definitely the implementation of SAP.<br />
We launched SAP at <strong>Severstal</strong> Resources in 2009 and almost<br />
across the <strong>Severstal</strong> Russian Steel division. The implementation will<br />
be finalized in 2013. The launch of the project allows us to increase<br />
the efficiency of our business processes, the processing of<br />
administrative information and general management.<br />
The steel market remains volatile on the back of worldwide<br />
macroeconomic uncertainties, however we believe, that our<br />
efficient business model and focus on costs control will enable us<br />
to navigate successfully through the challenges in 2013.<br />
Alexey Kulichenko<br />
Chief Financial Officer<br />
9 Amount of debt as at 31/12/2012, where US$1,282 million<br />
represents only pricipal amount of debt.
company Overview Strategy Performance Sustainability Governance Financial statements Additional information<br />
32<br />
Business overview<br />
<strong>Severstal</strong> achieved a solid set of results in 2012,<br />
despite worsening economic conditions,<br />
maintaining the Group’s EBITDA margin at 15.0%,<br />
reflecting the resilience of the business. A<br />
deteriorating market backdrop and lower selling<br />
prices negatively affected our financial results.<br />
However, our position as a low-cost steel producer<br />
in Russia, with full vertical integration, allowed us<br />
to maintain almost full utilisation rates during the<br />
year at our steel, iron ore and coking coal<br />
operations. In the US we successfully ramped-up<br />
the facilities launched in 2011, and reached good<br />
levels of capacity utilisation. Our business<br />
initiatives continued to yield efficiency and cost<br />
advantages.<br />
Our Key Financial Policy KPIs throughout the cycle<br />
• 0.5–1.5x Net Debt/EBITDA<br />
• Cash on balance not less than US$1 bln<br />
• Dividend policy at 25% of net profit<br />
• ROCE of >20%<br />
• NWC of c.18% of revenues<br />
Status as at the end of 2012<br />
• Net Debt/EBITDA of 1.9x<br />
• Cash on balance in excess of US$1.7 billion<br />
• Dividend payout reached 36% for 2012 10<br />
• ROCE of 11.0% 11<br />
• NWC of 14.5% of revenues<br />
Revenue in 2012 (US$ million)<br />
15,812<br />
14,104<br />
14,104m<br />
-10.8%<br />
2011<br />
2012<br />
EBITDA in 2012 (US$ million)<br />
3,584<br />
2,119<br />
2,119 m<br />
-40.9%<br />
2011<br />
2012<br />
EBITDA margin in 2012 (ratio)<br />
22.7%<br />
15.0%<br />
15.0%<br />
2011<br />
2012<br />
10 Includes recommended dividend payment of 1.89 Roubles per share<br />
(approximately US$0.06) for the 12 months ended 31 December 2012. The<br />
dividend is to be approved at the AGM on 13 June 2013.<br />
11 ROCE is calculated by the following formula: profit from operations / (total assets<br />
minus current liabilities average for the period), as reported in 2012 FS.
company Overview Strategy Performance Sustainability Governance Financial statements Additional information<br />
33<br />
Revenue<br />
The global economic slowdown in 2012 led to a decrease in steel,<br />
iron ore and coking coal prices, affecting our results. Our full year<br />
revenue decreased by 10.8% to $14.1 billion, mostly due to slightly<br />
weaker sales volumes at <strong>Severstal</strong> Russian Steel and overall lower<br />
realised prices. <strong>Severstal</strong> International increased revenue after the<br />
ramp-up of new capacities.<br />
<strong>Severstal</strong> revenue<br />
US$ million<br />
2011 15,812<br />
2012 14,104<br />
<strong>Severstal</strong>’s revenue by segment<br />
Segments’ contribution to company revenue in 2012,<br />
US$ million<br />
$15,812 ($1,930)<br />
Revenue<br />
2011<br />
<strong>Severstal</strong><br />
Russian<br />
Steel<br />
$456 ($707) $473 $14,104<br />
<strong>Severstal</strong> <strong>Severstal</strong> Intersegment<br />
International Resources<br />
Revenue<br />
2012<br />
Our Russian steel business – commercial and market highlights for 2012:<br />
In 2012, the Russian steel consumption grew by an estimated 5%,<br />
according to industry experts, and a similar 3% growth is forecast<br />
for 2013. Domestic steel production reached 71 million tonnes,<br />
3.3% higher than in 2011. Average capacity utilisation was around<br />
85%, almost the 2011 level. The market suffered from<br />
overcapacity, and hence average steel prices and volumes were<br />
declining during the year.<br />
The Division continues to regard Russia as its most important<br />
market. Its main domestic customers include pipe mills and<br />
construction companies, machinery and automotive clients. In<br />
2012, <strong>Severstal</strong> Russian Steel sold 10.3 million tonnes of steel<br />
products (excluding scrap), including 6.2 million tonnes to the<br />
domestic market. The share of sales volume to the Russian market<br />
grew to 60% in 2012 from 58% in 2011. In 2013, <strong>Severstal</strong> Russian<br />
Steel aims to further increase its share of domestic sales, and we<br />
expect that future growth will be driven primarily by increased<br />
sales to the construction industry and auto.<br />
Against the decrease in volumes and prices due to the lower<br />
demand, <strong>Severstal</strong> Russian Steel managed to improve its sales<br />
portfolio by increasing the share of HVA, more profitable products<br />
like colour-coated steel.<br />
We also managed to keep our utilisation rate at around 95%,<br />
above the local industry average of 85%.<br />
Our mining business – commercial and market highlights for 2012:<br />
In 2012, the Russian coking coal market mostly followed the global<br />
trend of weakening prices. According to market experts, domestic<br />
coking coal production output reached 60.1 million tonnes, 5.8%<br />
higher than in 2011. <strong>Severstal</strong>’ s Vorkutaugol sold a total of 5.3<br />
million tonnes of coking coal concentrate in 2012, that is 3%<br />
above the level of 2011, on a weaker market, compared to the year<br />
of 2011. This was due to the fact that Vorkutaugol almost<br />
exclusively supplies to Russia for its high-quality coking coal (the<br />
‘Zh’ brand), and hence has stable demand. The geography of<br />
export sales expanded through Ukrainian and European contracts.<br />
In the USA, the local coking coal market contracted in 2012 due to<br />
low export prices. To preserve earnings, PBS Coals company had to<br />
idle some of its mines producing coal for export spot supply. As a<br />
result, PBS Coals coking coal production reached 2.2 million<br />
tonnes, 15.4% below the level of 2011. The geography of export<br />
sales expanded through Brazilian, European and Asian contracts.<br />
Prices for iron ore in Russia moved largely in line with Chinese spot<br />
prices, with the time lag of few months. Like coking coal, domestic<br />
iron ore prices demonstrate a certain degree of inertia compared<br />
to the international benchmarks. In 2012, the Russian iron ore<br />
production reached 96.2 million tonnes, 0.4% above the level of<br />
2011. Karelsky Okatysh and Olkon increased their sales of iron ore<br />
products by 3% to 15.2 million tonnes, to both domestic and<br />
international clients. The geography of export sales expanded<br />
through European and Asian contracts.<br />
Our US business – commercial and market highlights for 2012:<br />
In 2012, NAFTA (North American Free Trade Agreement) light flat<br />
rolled steel demand growth was moderate, at an estimated 5.3%<br />
from 65.7 million tonnes in 2012 to 69.2 million tonnes in 2012.<br />
According to industry experts, 2013 is expected to remain stable<br />
with an increase of 2.1% forecast.<br />
US capacity utilisation was 75.7% in 2012, slightly higher than the<br />
74.4% in 2011. The market suffered from overcapacity and<br />
imports, which had a negative impact on steel prices, and both<br />
volume and capacity utilisation declined throughout most of the<br />
year. Including preliminary census data, flat rolled imports finished<br />
the year 16.9% higher than 2011.<br />
<strong>Severstal</strong> shipped 4.5 million tonnes in 2012, or a market share of<br />
6.5% of NAFTA shipments. As a result of the ramp-up of <strong>Severstal</strong>’s<br />
new capacity, primarily in Columbus, we increased annual<br />
shipments by 17% compared to 2011. As we continue to ramp-up<br />
our new capacities, market share will continue to increase until we<br />
reach capacity. <strong>Severstal</strong>’s utilisation rate is approximately 80%,<br />
above the industry’s 2012 average of 75.7%.<br />
<strong>Severstal</strong>’s key market sectors are automotive, energy (oil & gas)<br />
and service centres. Dearborn shipments are heavily focused on<br />
automotive, and total <strong>Severstal</strong> shipments to the automotive<br />
segment reached 1.4 million tonnes in 2012.<br />
<strong>Severstal</strong> Annual Report and accounts 2012
company Overview Strategy Performance Sustainability Governance Financial statements Additional information<br />
34<br />
Business overview<br />
EBITDA<br />
On an annual basis, weaker global prices for steel and raw<br />
materials resulted in a drop at the EBITDA level with <strong>Severstal</strong><br />
International being more resilient due to the ramp-up of the new<br />
capacities. While <strong>Severstal</strong> Russian Steel and <strong>Severstal</strong> Resources<br />
contracted due to weaker pricing. EBITDA of <strong>Severstal</strong> Resources<br />
outpaced <strong>Severstal</strong> Russian Steel showing again the advantages of<br />
our vertically-integrated business model.<br />
<strong>Severstal</strong> EBITDA<br />
US$ million<br />
2011 3,584<br />
2012 2,119<br />
<strong>Severstal</strong>’s EBITDA by segment 12<br />
Segments’ input to Company EBITDA dynamics in 2012,<br />
US$m<br />
$3,584 ($845)<br />
EBITDA<br />
2011<br />
<strong>Severstal</strong><br />
Russian<br />
Steel<br />
($15) ($619)<br />
$14 $2,119<br />
<strong>Severstal</strong> <strong>Severstal</strong> Intersegment<br />
International Resources<br />
EBITDA<br />
2012<br />
We believe <strong>Severstal</strong> demonstrated a resilient performance in what<br />
was a very challenging year for the global steel industry. Whilst our<br />
revenue for the year, and EBITDA, were affected by softer realised<br />
prices and slightly lower sales volumes, our EBITDA margin held at<br />
15.0%, reflecting our position as one of the most efficient<br />
producers in the global steel industry.<br />
In February 2013, OAO <strong>Severstal</strong> was ranked as the third most<br />
competitive global steelmaker in 2012 in a report by World Steel<br />
Dynamics (WSD). <strong>Severstal</strong> was ranked ahead of other major<br />
international steelmakers including JSW Steel (India, 4th position),<br />
Nippon Sumitomo (Japan, 5th position), Gerdau (Brazil, 6th<br />
position) and Nucor (USA, 7th position).<br />
The report ranked 35 leading global steel companies according to<br />
25 parameters, including: profitability; cost efficiency; financial<br />
stability, health & safety and environmental performance.<br />
<strong>Severstal</strong> received its highest ratings in the commodity policy<br />
efficiency, high-growth markets and cost efficiency categories.<br />
“The consistent implementation of our core<br />
strategy means that <strong>Severstal</strong> is well placed to<br />
perform competitively throughout the market<br />
cycle. We are delighted that this WSD report<br />
recognises the core strengths of our business as<br />
well as the efforts of all our employees.”<br />
Thomas Veraszto,<br />
Senior Vice-President of <strong>Severstal</strong><br />
Cash flow<br />
<strong>Severstal</strong> has a strong cash position: US$1,726 million in cash and<br />
cash equivalents. Operating cash flow of US$1,750 million more<br />
than covered the 2012 cash capex of $1,448 million.<br />
US$ million<br />
2012 2011<br />
Cash and cash equivalents at the beginning<br />
of the period 1,864 2,013<br />
Operating CF 1,750 2,579<br />
Investing CF (1,102) (1,902)<br />
Financing CF* (828) (609)<br />
Less cash and cash equivalents of<br />
discontinued operations and assets held<br />
for sale at the end of the period - (217)<br />
Less change in cash and cash equivalents<br />
of discontinued operations 42 -<br />
Cash and cash equivalents at the end<br />
of the period 1,726 1,864<br />
* Cash used in financing activities plus effect of exchange rates on cash and cash<br />
equivalents.<br />
Capital expenditure<br />
Our 2012 cash capex amounted to US$1,448 million. This was<br />
lower than initially planned. Capex was adjusted during the year in<br />
light of slowing market conditions.<br />
FY12 capex development:<br />
adjusted on worsening market Conditions<br />
$1.7 bn<br />
Planed<br />
FY12<br />
CAPEX<br />
$1.4 bn<br />
($0.3bn)<br />
Final<br />
FY12<br />
CAPEX<br />
Our major projects in 2012 included continuing construction of the<br />
Balakovo mini-mill, refurbishment of Coke Battery #7 at<br />
Cherepovets for full coke self-sufficiency and a coalmine methane<br />
power station at Vorkuta.<br />
Group’s FY2012 cash capex, total $1,448m<br />
<strong>Severstal</strong><br />
Russian Steel<br />
$742m<br />
$555m<br />
$151m<br />
<strong>Severstal</strong> Resources<br />
<strong>Severstal</strong><br />
International<br />
12 Here and thereafter Divisions’ EBITDA excludes intercompany dividend income.<br />
<strong>Severstal</strong> Annual Report and accounts 2012
company Overview Strategy Performance Sustainability Governance Financial statements Additional information<br />
35<br />
Plans for 2013<br />
<strong>Severstal</strong> is driven to deliver profitability and not to pursue volume<br />
growth. Key to achieving these goals is a robust business model<br />
focused on low costs through vertical integration, with steel-related<br />
mining assets providing full self-sufficiency in iron ore and coking<br />
coal. Where we have investment programmes, they are designed<br />
to improve efficiency and enhance our margins.<br />
Our strategic focus is on steel production, and particularly in<br />
developing our product portfolio. This is not only to meet the<br />
evolving demands of our customers, but to increase the ratio of<br />
our product mix in favour of high value-added products and<br />
added-value services. This, combined with our presence in<br />
fast-growing markets as well as established markets with attractive<br />
growth dynamics, means we are well positioned to provide<br />
market-leading returns for our shareholders.<br />
Hence our 2013 target capital expenditure programme will be<br />
US$1.3 billion, including completion of the Balakovo mini-mill<br />
construction and its launch in mid-2013; development of<br />
specialised steel service centres, construction of two inclined shafts<br />
and modernisation of the Pechorskaya preparation plant at<br />
Vorkutaugol, the construction of a steeply inclined conveyor and<br />
geological exploration at Olkon.<br />
Group’s FY2013 target capex, total $1,336m<br />
<strong>Severstal</strong><br />
Russian Steel<br />
$704m<br />
$525m<br />
$107m<br />
<strong>Severstal</strong> Resources<br />
<strong>Severstal</strong><br />
International<br />
Selected 2013 Capex Projects<br />
Division Project Expected effect Launch<br />
<strong>Severstal</strong> Russian Steel Balakovo mini-mill +1 mtpa of long products capacity 2013<br />
<strong>Severstal</strong> Resources<br />
<strong>Severstal</strong> International<br />
Specialised steel service centres development Increase in high value-added steel products sales 2013<br />
Installation of brand-new converter filters at<br />
Cherepovets Mill Environment 2013-14<br />
Construction of incline shafts at the<br />
Vorgashorskaya and Zapolyarnaya mines<br />
Higher coal output, infrastructure costs decrease,<br />
efficiency gains 2013-15<br />
4 mtpa capacity expansion (to 11 mtpa) at<br />
Pechorskaya Preparation Plant Higher coking coal concentrate output, efficiency 2013-14<br />
Steeply inclined conveyor at Olkon<br />
Higher iron ore output, infrastructure costs<br />
decrease, efficiency 2013<br />
Environmental, health & safety, IT-infrastructure<br />
and customer care Efficiency gains 2013<br />
<strong>Severstal</strong> Annual Report and accounts 2012
company Overview Strategy Performance Sustainability Governance Financial statements Additional information<br />
36<br />
Business overview<br />
Liquidity and debt position<br />
<strong>Severstal</strong> adheres to a conservative treasury approach to debt<br />
portfolio management. Positive relationships with the banking<br />
community and proven access to domestic and international debt<br />
capital markets have enabled us to form a well-diversified<br />
financing structure that does not depend on a single market or<br />
source of financing.<br />
We reduced gross debt from US$5,976 million to US$5,710 million<br />
in 2012, and net debt from US$4,112 million to $3,983 million by<br />
the end of the year. Despite that, our liquidity position remains<br />
strong with US$1,726 million in cash and cash equivalents,<br />
exceeding short-term debt of US$1,382 million 13 , and committed<br />
unused credit lines of US$922 million.<br />
We still prefer public debt as a long-term source of capital on<br />
attractive terms. At 31 December 2012, 81% of our debt was<br />
represented by public debt, 83% of which was denominated in US<br />
dollars.<br />
Well-balanced, Manageable Debt structure as at 31 December 2012, %<br />
We have a well-managed debt maturity profile: the majority of our<br />
debt is mid and long-term and we have no large sequential<br />
repayments.<br />
Despite negative impact from the global market that decreased<br />
our FY2012 EBITDA compared to the level of FY2011, our financial<br />
position remained strong during the year. Though our net debt/<br />
EBITDA ratio increased by the end of the year to 1.9x, which is<br />
above the internal target of 1.5x, this is still one of the lowest levels<br />
of debt ratio in the Russian steel sector. We will monitor our debt<br />
level closely in 2013, to return it to the targeted net debt/EBITDA<br />
of 1.5x, meanwhile we have already reduced our capex programme<br />
for 2013.<br />
Debt and leverage dynamics 15<br />
1.5x<br />
1.1x<br />
1.9x<br />
Unsecured/<br />
Secured<br />
Fixed/<br />
Floating<br />
USD/EUR/<br />
RUB<br />
81% 19%<br />
83% 17%<br />
83% 8% 9%<br />
6,025<br />
5,976<br />
5,710<br />
4,212<br />
4,112<br />
3,983<br />
2010 2011 2012<br />
Total Debt, $m Net Debt, $m Net Debt/EBITDA, x<br />
Public/<br />
Private<br />
81% 19%<br />
Improvement of the debt maturity calendar and reduction in the cost<br />
of capital<br />
Our strong credit metrics enabled us to improve our debt profile<br />
and refinance part of our public debt instruments with more<br />
favourable issuances in 2012. In September 2012, <strong>Severstal</strong><br />
successfully placed US$475 million senior unsecured convertible<br />
bonds maturing in 2017, and in October 2012 we successfully<br />
placed US$750 million 10-year Eurobonds with an interest rate of<br />
5.9%. Lower interest rates help us reduce interest payment, adding<br />
to the company’s financial stability and keeping liquidity in the<br />
company.<br />
Liquidity and debt maturity schedule 14 , US$ million<br />
922<br />
475<br />
1,726<br />
Liquidity<br />
as of<br />
31.12.2012<br />
2,317<br />
555 84 563 80 633 51<br />
966<br />
1Q 2013 2Q 2013 3Q 2013 4Q 2013 2014 2015 2016 2017+<br />
Cash<br />
Unused Committed Lines<br />
Short-term Debt<br />
Long-term Debt<br />
Convertible bonds<br />
13 Amount of debt as at 31/12/2012, where US$1,282 million represents only<br />
principal amount of debt.<br />
14 Represents principal amount of debt.<br />
15 Total debt, net debt were adjusted by the amounts related to the Group’s entities<br />
presented as discontinued operations.<br />
<strong>Severstal</strong> Annual Report and accounts 2012
company Overview Strategy Performance Sustainability Governance Financial statements Additional information<br />
37<br />
Despite the challenging year for the industry, <strong>Severstal</strong> managed<br />
to improve its credit rating profile by being upgraded to BB+ by<br />
Standard & Poor’s and Ba1 by Moody’s.<br />
Growing Market Trust<br />
• Since 2010 <strong>Severstal</strong> has been regaining ratings agencies’<br />
confidence and seeing consistent upgrades<br />
• In 2012, S&P upgraded <strong>Severstal</strong>’s rating to BB+/Stable,<br />
Moody’s to Ba1/Stable, Fitch to BB/Stable<br />
BB+/Ba1<br />
BB/Ba2<br />
BB-/Ba3<br />
B+/B1<br />
Feb-04<br />
Dec-04<br />
Oct-05<br />
Aug-06<br />
Jun-07<br />
Apr-08<br />
Feb-09<br />
Dec-09<br />
Oct-10<br />
Aug-11<br />
Jan-12<br />
S&P Moody’s Fitch
company Overview Strategy Performance Sustainability Governance Financial statements Additional information<br />
38<br />
<strong>Severstal</strong> Resources<br />
<strong>Severstal</strong> Resources manages all of <strong>Severstal</strong>’s<br />
mining assets, forming the basis of <strong>Severstal</strong>’s<br />
vertically integrated business model. It satisfies<br />
economically almost all the iron ore and hard<br />
coking coal requirements of <strong>Severstal</strong> Russian Steel<br />
and <strong>Severstal</strong> International divisions’ steel<br />
operations, while also selling increasing volumes to<br />
third parties on the market.<br />
<strong>Severstal</strong> Resources mines iron ore and coking coal<br />
in Russia, and operates a coking coal complex in<br />
the USA. The coal businesses are among Russia’s<br />
top five coking coal producers, while the iron ore<br />
businesses are leaders by extraction volume in<br />
their respective markets.<br />
We also have a balanced portfolio of prospective<br />
mining greenfields in Russia and beyond. The key<br />
focus for <strong>Severstal</strong> Resources in 2013 is cost<br />
control and debottlenecking with parallel growth<br />
in volumes.<br />
Revenue in 2012 (US$ million)<br />
3,711.4<br />
3,004.6<br />
3,004.6 m<br />
-19.0%<br />
2011<br />
2012<br />
EBITDA in 2012 (US$ million)<br />
1,603.8<br />
985.0<br />
985.0 m<br />
-38.6%<br />
2011<br />
2012
company Overview Strategy Performance Sustainability Governance Financial statements Additional information<br />
39<br />
“Our strong asset base enables us to<br />
capture excellent margins and generate<br />
significant free cash flow in strong<br />
markets, but it is also resilient enough<br />
to provide positive results even in the<br />
current weak markets. We are constantly<br />
improving these assets through a<br />
prudent investment programme<br />
geared towards reduction of fixed costs,<br />
increased labour productivity and lowcost<br />
brownfield expansion. We are also<br />
making structural improvements that<br />
bring immediate cost savings.<br />
We believe safety is a priority, and feel<br />
responsible for the life and health of our<br />
workers.”<br />
Vadim Larin<br />
CEO of <strong>Severstal</strong> Resources
company Overview Strategy Performance Sustainability Governance Financial statements Additional information<br />
40<br />
<strong>Severstal</strong> Resources<br />
Key 2012 highlights:<br />
• Russian domestic prices of bulk commodities generally follow<br />
global trends, although there is also a local component to their<br />
dynamics. Domestic coking coal prices vary according to their<br />
quality. Russian hard coking coal (HCC) is priced largely in line<br />
with the Australian and US products (such as BMA’s Peak Downs<br />
and Gregory) adjusted for the cost of rail freight and port<br />
handling. Semi-hard coal usually sells at a 15-25% discount to<br />
the HCC brands. At the same time, the ‘2ZH’ brand of highquality<br />
coking coal, which is our premium product, is priced in<br />
line with the imported alternative from the USA, which allows us<br />
to sell 2ZH at a premium to the domestic market.<br />
• In 2012, the Russian coking coal market mostly followed the global<br />
trend of weakening prices. According to market experts, domestic<br />
coking coal production output reached 60.1 million tonnes, 5.8%<br />
higher than in 2011. <strong>Severstal</strong>’ s Vorkutaugol sold a total of 5.3<br />
million tonnes of coking coal concentrate in 2012, that is 3% above<br />
the level of 2011, on a weaker market, compared to the year of<br />
2011. This was due to the fact that Vorkutaugol almost exclusively<br />
supplies to Russia for its high-quality coking coal (the ‘Zh’ brand),<br />
and hence has stable demand. The geography of export sales<br />
expanded through Ukrainian and European contracts.<br />
• In the USA, the local coking coal market contracted in 2012 due<br />
to low export prices. To preserve earnings, PBS Coals had to idle<br />
some of its mines which produce coal for export spot supply. As<br />
a result, PBS Coals’ coking coal production reached 2.2 million<br />
tonnes, 15.4% below the level of 2011. The geography of export<br />
sales expanded through Brazilian, European and Asian contracts.<br />
• Prices for iron ore in Russia moved largely in line with the<br />
Chinese spot prices, with a few months’ time lag. Like coking<br />
coal, domestic iron ore prices demonstrate a certain degree of<br />
inertia compared to international benchmarks. In 2012, Russian<br />
iron ore production reached 96.2 million tonnes, 0.4% higher<br />
than in 2011. Karelsky Okatysh and Olkon increased their sales<br />
of iron ore products by 3% to 15.2 million tonnes, to both<br />
domestic and international clients. The geography of export<br />
sales expanded through European and Asian contracts.<br />
• In 2013, cost management continues to be one of our key<br />
priorities. In 2012 we managed to keep cash costs of production<br />
at all our mining assets almost flat.<br />
• From a strategic viewpoint, we started to develop the Usinskoe<br />
coking coal deposit in Komi region, Russia. The estimated<br />
resources of the coalfield are 620 million tonnes of coking coal,<br />
most of which is high-rank and similar in quality to the Vorkuta<br />
deposit. Usinskoe is only 40km away from the Vorkuta coal<br />
asset, and would provide additional mine life for our Vorkuta<br />
assets. Commissioning is scheduled for 2020, with operating<br />
capacity to be reached by 2023. The planned production volume<br />
is over 4 million tonnes of coal in a year. We expect the cost of<br />
production at Usinskoe to be half of current Vorkuta costs,<br />
mainly due to using new equipment and innovative construction<br />
methods.<br />
• In 2012, we completed a pre-feasibility study at the Putu Range<br />
iron ore project in Liberia, Africa, that allows us to better assess<br />
economic rationale for the project’s development. Also in 2012,<br />
an independent report provided increased estimates of iron ore<br />
resources at the Putu iron ore deposit to up to 4.4 billion tonnes<br />
within the optimised pit shell, with an average 34% iron grade.<br />
This represents a marked increase from the last year’s<br />
estimations of an independent report that measured Putu iron<br />
ore resources at 3.2 billion tonnes.<br />
Dynamics of <strong>Severstal</strong> Resources’ sales volumes in 2012<br />
Dynamics of <strong>Severstal</strong> Resources’ average prices in 2012<br />
2,549 2,563 2,701 2,626<br />
$161<br />
$138<br />
$128 $122<br />
1,796 1,816 1,927 1,974<br />
1,101<br />
1,255 1,262<br />
1,142<br />
$118<br />
$88<br />
$120<br />
$85<br />
$105<br />
$90<br />
$77<br />
$63<br />
Q1<br />
Q2<br />
Iron ore pellets, k’tonnes<br />
Coking coal concentrate, k’tonnes<br />
Iron ore concentrate, k’tonnes<br />
Q3<br />
Q4<br />
Q1<br />
Q2<br />
Iron ore pellets, US$/t<br />
Coking coal concentrate, US$/t<br />
Iron ore concentrate, US$/t<br />
Q3<br />
Q4<br />
<strong>Severstal</strong> Annual Report and accounts 2012
company Overview Strategy Performance Sustainability Governance Financial statements Additional information<br />
41
company Overview Strategy Performance Sustainability Governance Financial statements Additional information<br />
42<br />
<strong>Severstal</strong> Resources<br />
Key production facilities<br />
Iron ore production<br />
We operate two iron ore extracting complexes: Karelsky Okatysh,<br />
which produces iron ore pellets, and Olkon, which produces iron ore<br />
concentrate.<br />
Karelsky Okatysh, in Karelia, north-western Russia, is one of the<br />
country’s leading and most modern iron ore mining complexes,<br />
producing 20% of all Russian iron ore pellets. It mines magnetite<br />
quartzite ores and produces high-quality iron ore pellets with an iron<br />
concentration of between 63% and 65%. The two major deposits,<br />
Kostomuksha and Korpanga, have an estimated life of 33 years. The<br />
average iron concentration of reserves is approximately 28%. The<br />
complex has consistently increased its output in recent years. In 2012,<br />
the production volume of iron ore pellets exceeded 10.3 million tonnes<br />
and the extraction volume of mined rock reached 50.5 million m 3 .<br />
Olkon, in the Murmansk region, is Russia’s most northerly iron ore<br />
complex, and has been supplying Cherepovets Steel Mill since the<br />
1950s. It mines magnetite-hematite quartzite ores from five open<br />
pits, and produces high-quality iron ore concentrate, crushed<br />
stones and ferrite strontium powder. Olkon acquired an additional<br />
mining licence for the Anomalny deposit, which has estimated<br />
non-JORC reserves of 47 million tonnes. Olkon’s deposits have an<br />
estimated life of 18 years. In 2012, the complex achieved iron ore<br />
concentrate production volume of 4.8 million tonnes and mined<br />
rock extraction volume of 20.1 million m 3 .<br />
Coal production<br />
We mine coal at Vorkutaugol in Russia and at PBS Coals in<br />
Pennsylvania, United States. We also have a promising coal-mining<br />
project in the Komi republic of Russia as a brownfield expansion of<br />
our Vorkutaugol asset.<br />
Vorkutaugol is near Vorkuta in the Komi Republic in north-east<br />
European Russia. It mines coking and steam coal, and is one of<br />
Russia’s largest producers of hard coking coal. Coking coal<br />
produces coke, used for steel production. Steam coal is used in the<br />
energy and chemical industries. We operate the Vorkutskoye and<br />
Vorgashorskoye coal deposits here, with an estimated life of 44<br />
and 19 years respectively. The business comprises five longwall<br />
mines, an open-pit mine and three washing plants.<br />
PBS Coals produces coking and steam coal from several surface and<br />
underground mining complexes near Somerset, Pennsylvania.<br />
Estimated coal reserves are approximately 49 million tonnes and<br />
estimated resources are 223 million tonnes. Steam coal is sold for<br />
domestic electricity generation, and coking coal is shipped to the steel<br />
industry worldwide and to our own nearby steel-producing facilities.<br />
Operational and financial overview<br />
Safety<br />
Over the past five years we have reduced our LTIFR by 64%, but the<br />
improvement has been slowing. Last year we started a safety<br />
programme as an integral part of the Business System of <strong>Severstal</strong>.<br />
This takes a very systematic approach to every aspect of safe<br />
conditions and safe behaviour.<br />
Despite continued efforts to increase the safety of our operations,<br />
we were shocked on 11 February 2013, when an explosion at the<br />
Vorkutinskaya mine at Vortukaugol resulted in 19 fatalities and 3<br />
other casualties, and suspension of mining at the shaft. We will<br />
thoroughly assess the mine’s safety systems, maintenance and<br />
production supervision to prevent any incident of this kind<br />
occurring in the future.<br />
Financial overview<br />
Revenue received from <strong>Severstal</strong> Resources decreased by 19.0%, to<br />
US$3,004.6 million in 2012. This decrease was mostly due to lower<br />
coking coal concentrate and iron ore concentrate prices. However,<br />
coal products sales volumes increased only slightly and in some<br />
cases decreased (for details, see the Sales results sub-section).<br />
EBITDA decreased in 2012, ending at US$985.0 million, which is<br />
38.6% below 2011. The EBITDA margin decreased from 43.2% in<br />
2011, to 32.8% in 2012.<br />
Focusing on high-value-added products, such as export-quality iron<br />
ore pellets and hard coking coal concentrate, <strong>Severstal</strong> Resources<br />
sold 15.2 million tonnes of iron ore pellets and concentrate and<br />
10.5 million tonnes of coal in 2012.<br />
In 2012, the average headcount at <strong>Severstal</strong> Resources was 17,559.<br />
EBITDA drivers in 2012,<br />
US$m<br />
1,604 47<br />
42<br />
(633) (14)<br />
(27)<br />
(34)<br />
985<br />
EBITDA<br />
2011<br />
Sales<br />
Volume<br />
Sales<br />
Price<br />
Production<br />
Volumes<br />
Production<br />
Expenses<br />
G&A Other EBITDA<br />
2012<br />
<strong>Severstal</strong> Annual Report and accounts 2012
company Overview Strategy Performance Sustainability Governance Financial statements Additional information<br />
43<br />
Key performance indicators 2012 2011 Change %<br />
Revenue (US$ million) 3,004.6 3,711.4 (19.0%)<br />
Gross profit (US$ million) 1,279.7 1,965.9 (34.9%)<br />
Profit from operations (US$ million) 750.6 1,394.2 (46.2%)<br />
Operating margin (%) 25.0% 37.6% n/a<br />
EBITDA (US$ million) 985.0 1,603.8 (38.6%)<br />
EBITDA margin (%) 32.8% 43.2% n/a<br />
Average product prices (FCA) (US$/tonne)<br />
Coking coal concentrate 137 183 (25.1%)<br />
Steam coal 40 43 (7.0%)<br />
Iron ore concentrate 78 95 (17.9%)<br />
Pellets 108 134 (19.4%)<br />
EBITDA margin (%)<br />
Coking coal concentrate 30.2 46.4 (34.9%)<br />
Iron ore concentrate 35.9 49.9 (28.1%)<br />
Pellets 45.6 53.6 (14.9%)<br />
Costs<br />
<strong>Severstal</strong> Resources’ costs slightly decreased to US$1,724.9 million, or by 1.2%, in 2012. This decrease was primarily due to a decrease in<br />
service expenses which was partially offset by an increase in labour costs and related tax expenses, an increase in depreciation and<br />
amortization expenses and an increase in fuel materials and energy.<br />
2012 2011 Change, %<br />
Cost of sales structure US$ million % of total US$ million % of total<br />
Materials<br />
Grinding balls and rods 34.0 2.0% 38.4 2.2% (11.5%)<br />
Explosives 60.9 3.5% 55.7 3.2% 9.3%<br />
Metal – roll 1.5 0.1% 30.8 1.8% (95.1%)<br />
Technological coals 35.6 2.1% 68.0 3.9% (47.6%)<br />
Other materials 183.2 10.6% 148.4 8.5% 23.5%<br />
Integral implements and spares 123.4 7.1% 119.9 6.8% 2.9%<br />
Total materials 438.6 25.4% 461.2 26.4% (4.9%)<br />
Energy<br />
Electric power 175.8 10.2% 196.9 11.3% (10.7%)<br />
Gasoline 94.2 5.5% 63.9 3.7% 47.4%<br />
Other energy resources 92.3 5.3% 89.5 5.1% 3.1%<br />
Total energy 362.3 21.0% 350.3 20.1% 3.4%<br />
Staff costs 511.4 29.6% 481.1 27.6% 6.3%<br />
Depreciation and amortization 228.1 13.2% 181.1 10.4% 26.0%<br />
Services 244.6 14.2% 295.8 16.9% (17.3%)<br />
Change in inventories (15.0) (0.9%) (26.3) (1.5%) (43.0%)<br />
Other (45.1) (2.5%) 2.3 0.1% n/a<br />
Total 1,724.9 100.0% 1,745.5 100.0% (1.2%)<br />
<strong>Severstal</strong> Annual Report and accounts 2012
company Overview Strategy Performance Sustainability Governance Financial statements Additional information<br />
44<br />
<strong>Severstal</strong> Resources<br />
Sales volumes<br />
<strong>Severstal</strong> Resources’ businesses are among Russia’s top five coking<br />
coal producers and top three Russian iron ore producers. Our iron<br />
ore businesses are leaders in their respective markets by extraction<br />
volumes.<br />
Despite a weaker market in 2012, <strong>Severstal</strong> Resources sold 10.4<br />
million tonnes of iron ore pellets (+4% on 2011), 7.5 million tonnes<br />
of coking coal concentrate (-1% from 2011), and 4.8 million tonnes<br />
of iron ore concentrate (flat compared to 2011).<br />
Sales by product<br />
In 2012 <strong>Severstal</strong> Resources revenue decreased primarily due to a<br />
decrease in the average price per tonne, which was partially offset<br />
by an increase in revenue by volume.<br />
Raw coking coal sales increased by 114.5% in volume and<br />
increased by 3.5% in revenue in 2012, compared to 2011.<br />
Coking coal concentrate sales volumes decreased slightly by 1.0%<br />
and sales revenue decreased by 26.1%, owing to a price decrease.<br />
Pellet sales increased by 3.9% in volume while revenue decreased<br />
by 16.1% owing to a price decrease. Iron ore concentrate sales<br />
decreased slightly by 0.1% in volume and 18.2 % in revenue owing<br />
to a price decrease. Steam coal sales fell by 14.9% in volume and<br />
21.3% in revenue due to a shift from steam to coking grade coal<br />
and decreased Vorkutaugol production volumes.<br />
The weighted average selling prices for our main products became<br />
the main driver of revenue decrease in 2012. Iron ore concentrate<br />
prices decreased by 17.9%, coking coal concentrate by 25.1%, and<br />
pellets by 19.4% compared to 2011.<br />
Sales by products, 2012<br />
12.4%<br />
11.3%<br />
37.6%<br />
1.4%<br />
34.2%<br />
3.1%<br />
Coking coal - 1.4%<br />
Coking coal concentrate - 34.2%<br />
Steam coal - 3.1%<br />
Pellets - 37.6%<br />
Iron ore concentrate - 12.4%<br />
Other and shipping - 11.3%<br />
2012 2011 Change, %<br />
Sales by product Thousand tonnes US$ million Thousand tonnes US$ million Thousand tonnes US$ million<br />
Coking coal 622 41.7 290 40.3 114.5% 3.5%<br />
Coking coal concentrate 7,513 1,028.0 7,592 1,390.7 (1.0%) (26.1%)<br />
Steam coal 2,343 93.1 2,754 118.3 (14.9%) (21.3%)<br />
Pellets 10,439 1,130.7 10,051 1,347.3 3.9% (16.1%)<br />
Iron ore concentrate 4,760 372.1 4,764 454.8 (0.1%) (18.2%)<br />
Total sales by products 25,677 2,665.6 25,451 3,351.4 0.9% (20.5%)<br />
Other and shipping - 339.0 - 360.0 n/a (5.8%)<br />
Total sales revenue - 3,004.6 - 3,711.4 n/a (19.0%)<br />
Inter-segment transactions (12,449) (1,301.0) (13,017) (1,789.8) (4.4%) (27.3%)<br />
<strong>Severstal</strong> Annual Report and accounts 2012
company Overview Strategy Performance Sustainability Governance Financial statements Additional information<br />
45<br />
Sales by market<br />
<strong>Severstal</strong> Resources sells its products internally within <strong>Severstal</strong> as well as on the domestic and international markets. We aim to maintain our<br />
domestic market share and expand our international market share in high-quality pellets and coking coal concentrate sales.<br />
Russian market<br />
Russia is the principal market for our mining businesses. Our main customer is yield-to-maturity <strong>Severstal</strong> Russian Steel division.<br />
Our share of sales on the Russian market in 2012 was 71%. The bulk of our revenue on the Russian market came from pellets and coking<br />
coal concentrate sales.<br />
2012 2011 Change, %<br />
Domestic sales by products Thousand tonnes US$ million Thousand tonnes US$ million Thousand tonnes US$ million<br />
Coking coal 127 7.9 1 - n/a n/a<br />
Coking coal concentrate 4,847 649.0 4,685 893.4 3.5% (27.4%)<br />
Steam coal 2,191 84.0 2,028 76.0 8.0% 10.5%<br />
Pellets 7,904 866.4 6,953 947.3 13.7% (8.5%)<br />
Iron ore concentrate 4,760 372.1 4,693 449.4 1.4% (17.2%)<br />
Total sales by products 19,829 1,979.4 18,360 2,366.1 8.0% (16.3%)<br />
Other and shipping - 159.4 - 118.0 n/a 35.1%<br />
Total domestic sales revenue - 2,138.8 - 2,484.1 n/a (13.9%)<br />
Inter-segment transactions (12,436) (1,298.4) (12,788) (1,746.6) (2.8%) (25.7%)<br />
Export<br />
Exports accounted for 29% of our total revenue in 2012.<br />
2012 2011 Change, %<br />
Export sales by products Thousand tonnes US$ million Thousand tonnes US$ million Thousand tonnes US$ million<br />
Coking coal 495 33.8 289 40.3 71.3% (16.1%)<br />
Coking coal concentrate 2,666 379.0 2,907 497.3 (8.3%) (23.8%)<br />
Steam coal 152 9.1 726 42.3 (79.1%) (78.5%)<br />
Pellets 2,535 264.3 3,098 400.0 (18.2%) (33.9%)<br />
Iron ore concentrate - - 71 5.4 n/a n/a<br />
Total sales by products 5,848 686.2 7,091 985.3 (17.5%) (30.4%)<br />
Other and shipping - 179.6 - 242.0 n/a (25.8%)<br />
Total export sales revenue - 865.8 - 1,227.3 n/a (29.5%)<br />
Inter-segment transactions (13) (2.6) (229) (43.2) (94.3%) (94.0%)<br />
In 2012, our principal export products were pellets and coking coal concentrate. Our main shipping destinations were Europe and the CIS<br />
(Ukraine).<br />
Increasing third party sales<br />
We benefit from being a leading Russian supplier of premium quality coking coal and iron ore products. Being economically fully hedged<br />
for raw materials for our own steel business, and being close to European and CIS markets, we have been increasing our third party sales<br />
volumes in recent years. In 2012, third party shipments of iron ore pellets and coking coal was 52% of our total sales volumes.<br />
Taking a customer-oriented approach is among <strong>Severstal</strong>’s key values, and we intend to be a reliable supplier of quality products to our<br />
partners. In May 2012, Karelsky Okatysh and Vorkutaugol signed a sales contract to supply the production facilities of the Finnish steel<br />
company Rautaruukki with coking coal and iron ore pellets over the coming three years. Our deliveries will meet about 20% of the Finnish<br />
group’s demand for coking coal and iron ore pellets. The initial shipments of pellets to Rautaruukki took place in May, whereas first coal<br />
deliveries began in July 2012.<br />
<strong>Severstal</strong> Annual Report and accounts 2012
company Overview Strategy Performance Sustainability Governance Financial statements Additional information<br />
46<br />
<strong>Severstal</strong> Resources<br />
Overview of operational efficiencies in 2012<br />
In Vorkuta, the cost of our premium 2Zh grade has benefited from<br />
a return to our most productive seam after a one-year break, and<br />
there will be no similar break for the next five years.<br />
Another Vorkuta grade, Gzho, demonstrated a 8% cost decrease,<br />
mainly due to volume growth in a new longwall block.<br />
In Vorkuta, the maintenance shifts are now once every three days,<br />
compared to every day in most of the longwalls, which is good for<br />
both volume and costs.<br />
We have reduced the Vorkuta headcount to 8,800. With the same<br />
production levels, headcount was 12,000 in 2009 and 18,000 in<br />
2003.<br />
Examples of Business System improvements include a 5% increase<br />
of skip productivity in our Zapolyarnaya mine, a reduction in<br />
locomotives from 13 to 10 due to higher utilisation, and an<br />
increase in utility rates of open-pit dozers by 8%.<br />
Two incline shafts at the Zapolyarnaya and Vorgashorskaya mines<br />
will reduce costs substantially by removing three skip lifts and<br />
eliminating transport bottlenecks. They also add 4 million tonnes<br />
of processing capacity at a quarter of the cost required to build a<br />
new plant of the same capacity.<br />
At PBS Coals, volumes can be highly flexible, and adapt to the<br />
volatile export market, while maintaining domestic supply. We have<br />
idled the least efficient mines to reduce costs and preserve cash<br />
flow – one open mine and five deep mines remain in operation. We<br />
can re-open the idled mines when the market picks up.<br />
At Karelskiy Okatysh we are focusing efforts here on continuous<br />
improvement, and changing mine equipment to the most<br />
productive models. Truck productivity is up by 16% since 2010,<br />
which is equivalent to US$20 million a year, while train productivity<br />
is up 5% due to new shift coordination.<br />
At Karelskiy Okatysh, the ‘ideal shift’ improvement achieved by the<br />
Business System follows the best industry practice, with just 40<br />
minutes of scheduled downtime required each day for shift<br />
changeovers, diesel filling and technical checks. It has added<br />
0.4million tonnes of pellets annually without capex, and remains<br />
the lowest scheduled downtime in the industry.<br />
Olkon is learning from the good examples at Okatysh. This year it<br />
started ‘ideal shift’, GPS fleet management, fine screening and<br />
many more initiatives. Insourcing maintenance workers for<br />
domestic equipment, and insourcing drilling operators, has<br />
improved productivity by 5%, and costs by 10%. We have also seen<br />
a reduction in plant downtime from 10% to 5% due to switching to<br />
planned maintenance from ‘as required’.<br />
At Olkon, infrastructure projects include a new thermal dryer, and a<br />
high-angle conveyor that will reduce costs by dramatically reducing<br />
the haul length at the Olenegorskiy pit. These will be<br />
commissioned in 2015.<br />
Outlook and strategic priorities for 2013<br />
<strong>Severstal</strong> Resources plans to focus on increasing the efficiency of<br />
its operations and production volumes, reducing costs and<br />
maintaining high safety and quality standards.<br />
Cost control<br />
Cost management continues to be one of <strong>Severstal</strong> Resources’ key<br />
priorities. In the recent years the company has been quite<br />
successful in keeping the cash costs under control amid overall<br />
inflation in the mining industry globally.<br />
Our management initiatives range from volume growth and reduction<br />
of the administrative cost, to increasing self-sufficiency in key resources.<br />
For instance, in H1 2013, Vorkutaugol is launching a methane gas<br />
power plant at its Severnaya mine to secure 80% self-sufficiency in<br />
electricity. This is a pioneer project for the Russian coal industry. The<br />
company will consider construction of a power plant in 2015.<br />
Brownfield development<br />
Vorkutaugol has an extensive development programme designed<br />
to raise efficiencies and ensure further production growth. For<br />
instance, the ongoing modernisation of the main washing plant<br />
(currently considered as a bottleneck in the production cycle) not<br />
only brings its technology up to date, but is also expected to<br />
increase its capacity by 50%. The number of pieces of equipment<br />
at the plant will decrease by half, which will make maintenance<br />
much easier, hence increasing availability.<br />
Another large scale project is the incline shaft from Zapolarnaya mine<br />
to the main washing plant. The project will allow us to bypass the<br />
currently inefficient skip-hoisting shaft and deliver all coal from the<br />
Zapolarnaya and Vorkutinskaya mines when the two are combined.<br />
Usinskoe coal deposit<br />
In December 2011, <strong>Severstal</strong> was granted the exploration and extraction<br />
rights for the N1 coal field at the Usinskoe coal deposit in the Komi region,<br />
Russia. The coal field has estimated resources of 620 million tonnes of<br />
coking coal, most of which is high-rank (Russian classification – 2Zh) and<br />
is similar in quality to the resources of the Vorkuta deposit, which is also<br />
being developed by Vorkutaugol. The resources of the field include KZh<br />
and 1Zh grades coal (Russian classification).<br />
The N1 coal field is located in the centre of the Usinskoe deposit in<br />
Russia’s Komi region, and is close to key transport and<br />
infrastructure links. The Kotlas-Vorkuta railway line is 5 km from<br />
the southern boundary of the coal field, and the rail station at<br />
Khanovei is 30km from it. The development of the Usinskoe will be<br />
financed mostly by Vorkutaugol and hence the project is treated as<br />
a brownfield expansion rather than a greenfield one.<br />
<strong>Severstal</strong> and Vorkutaugol have decades of experience in<br />
developing coal mines at the Vorkuta coal basin, and an<br />
experienced and professional team of mining engineers and<br />
miners. This will help us develop the Usinskoye deposit successfully.<br />
The construction of the mine, preparation and infrastructure units<br />
will create 2,800 additional jobs in the region.<br />
According to the license agreement, construction must start no later<br />
than January 2017. Commissioning is scheduled for 2020, with<br />
operating capacity to be achieved by 2023. The coal field will be<br />
developed as an underground mining project, and will involve the<br />
construction of an underground mine and a coal-preparation plant.<br />
The planned production volume is over 4 million tonnes of coal a year.<br />
<strong>Severstal</strong> Annual Report and accounts 2012
company Overview Strategy Performance Sustainability Governance Financial statements Additional information<br />
47<br />
Usinskoye Deposit – Key Highlights<br />
RUSSIA<br />
Syktyvkar<br />
Komi<br />
Republic<br />
Vorkutaugol<br />
and Usinskoye<br />
deposit<br />
The project’s key parameters<br />
Location<br />
• Komi Republic, North Russia<br />
Coal properties<br />
• Hard mid-vol, grade 2Zh (Russian<br />
classification), regarded as a premium coal<br />
grade, similar to the Vorkuta coals. The coking<br />
coal is relatively high-ash, average sulphur<br />
Capacity<br />
• Resources under Russian classification – 621 mt<br />
Cost position<br />
Project’s development<br />
Infrastructure<br />
• Planned annual capacity 2.0-2.5 mtpa of hard<br />
coking coal concentrate<br />
• Production costs estimated at US$40-50/t exw<br />
• Overall CAPEX estimated at c. US$0.9bn<br />
• Production anticipated to start in 2018<br />
• As the deposit is located close to <strong>Severstal</strong>’s<br />
legacy Vorkuta mines, no significant<br />
infrastructure needs to be built<br />
• The existing railway passes c. 5 km from the<br />
deposit<br />
Ownership • <strong>Severstal</strong> (100%)<br />
<strong>Severstal</strong> Annual Report and accounts 2012
company Overview Strategy Performance Sustainability Governance Financial statements Additional information<br />
48<br />
<strong>Severstal</strong> Resources<br />
New mining licenses<br />
We retain our commitment to vertical integration as the most<br />
effective business model for the company’s long-term<br />
development, despite occasional price weakness on commodity<br />
markets.<br />
<strong>Severstal</strong> Resources has a portfolio of licenses for promising mining<br />
greenfield projects in Russia and beyond, with launch dates closer<br />
to 2020. In 2013, <strong>Severstal</strong>’s spending on these mining greenfields<br />
will be approximately US$46 million.<br />
That said, we may update our current project portfolio in the<br />
mining business based on macroeconomic factors and, more<br />
importantly, their impact on the company’s performance. Further<br />
investments in these projects will depend on how they meet our<br />
financial criteria: debt load below 1.5 x net debt/EBITDA, EBITDA<br />
profitability above 20%, IRR and ROCE also above 20%. Finally, our<br />
approach to investing in, and developing, such projects, remains<br />
flexible and depending on market conditions, may involve options<br />
such as establishing partnerships.<br />
<strong>Severstal</strong>’s key licenses for mining greenfield projects:<br />
Putu Range iron ore project<br />
In 2008, we signed a mineral development agreement with the<br />
Government of Liberia for a 61.5% interest in the Putu Range<br />
project, a 13km long iron rich ridge, 130km inland from the<br />
deep-water shoreline of eastern Liberia. Putu has estimated<br />
resources of 4.4 billion tonnes of iron ore in the existing pit, with an<br />
average estimated 34% iron content as well as a high grade DSO<br />
resource of approximately 100 million tonnes. The development<br />
agreement is valid for 25 years from 9 September 2010, and can<br />
be further extended. In 2012, we consolidated our stake in the<br />
project by acquiring an additional 38.5% interest from Afferro<br />
Mining, thus obtaining full control in the project. The feasibility<br />
study is currently underway and is to be completed in 2014. We<br />
expect production to start in 2017-2018, with potential output of<br />
20 million tonnes of concentrate.<br />
Tyva coking coal deposit<br />
In September 2010, we obtained a licence for further exploration<br />
and coal extraction at the Tsentralniy coalfield in the Tyva Republic,<br />
Russia. The Tyva project resources are estimated at 639 million<br />
tonnes of high-quality hard coking coal (C1+C2). Development of<br />
the coalfield depends on the construction of a 400km railway<br />
connecting Tyva with the existing rail network. We will not invest<br />
significantly in the project until the responsibilities of other industry<br />
players developing coal deposits in Tyva are clarified, nor those of<br />
Russian Railways regarding the construction of the rail access.<br />
New market segments<br />
In the first half of 2013, we are launching a project designed to<br />
provide access to the rapidly-growing global metallic iron products<br />
market. <strong>Severstal</strong> has a 33% stake in International Mineral<br />
Beneficiation Services (IMBS), a research and development<br />
company with headquarters in Johannesburg, South Africa. The<br />
company has developed the trade-marked Finesmelt technology,<br />
capable of transforming low-value fine and ultrafine iron ores, with<br />
the help of thermal coal, into a valuable metallic iron product.<br />
According to expert estimates, the global steel industry is annually<br />
consuming approximately 700 million tonnes of metallic iron<br />
products.<br />
Together with IMBS, <strong>Severstal</strong> is currently working on the<br />
construction of the first commercial full-size 50 ktpa iron ore<br />
reduction unit, and planning to launch it early in 2013. The site for<br />
the plant is at the Palabora copper deposit in the Republic of<br />
South African. The copper ore contains Fe as a by-product, which<br />
has been put to tailings for over 50 years. The Fe content of the<br />
tailings is quite high, at 58%. If successful, IMBS and <strong>Severstal</strong> will<br />
add another nine units to reach the capacity of 0.5 mtpa.<br />
Capex<br />
In recent years, <strong>Severstal</strong> Resources has replaced all its major<br />
equipment for both its underground operations and open pit<br />
mines. In 2012, its cash capital expenditure was US$555 million.<br />
Our 2013 capital expenditure target has been adjusted to the<br />
challenging market environment, to preserve positive free cash<br />
flow, while still ensuring we are progressing with company’s key<br />
development and optimisation projects.<br />
In 2013, total investments at <strong>Severstal</strong> Resources are planned at<br />
approximately US$525 million. Major initiatives will include: first<br />
stage modernisation of the Pechorskaya preparation plant at<br />
Vorkutaugol; further progress with the construction of two inclined<br />
shafts at the Zapolyarnaya and Vorgashorskaya mines; technical<br />
modernisation at Karelsky Okatysh and Olkon. Our greenfields are<br />
not requiring much capex at this stage – in 2013 our investments<br />
there will be approximately US$46 million.<br />
<strong>Severstal</strong> Annual Report and accounts 2012
company Overview Strategy Performance Sustainability Governance Financial statements Additional information<br />
49<br />
IMBS production flow<br />
1. Char production.<br />
The reductant for the process is produced by the devolatisation of thermal<br />
coal. The volatiles (off-gases) are recovered from this stage to fire the<br />
reduction process. The devolatised coal is then milled to sub 1mm.<br />
2. Recipe formulation and blending.<br />
The fine iron oxide and milled char are added according to the required blend<br />
recipe, the blend recipe is dependant on ore type and quality, and properties<br />
of the char (fixed carbon, reactivity).<br />
3. Reduction.<br />
The heart of the process, reduction proceeds in 2 stages pre-reduction and<br />
reduction in externally heated rotary kilns. The gaseous reduction products<br />
(primarily CO with C0 2<br />
) are recovered as a process fuel.<br />
4. Gas reticulation.<br />
Gases from the coal devolatisation and ore reduction processes are fed to<br />
Regen burners for ore drying, pre-heating and reduction. The amount of<br />
energy available from these gases is a function of the properties of the coal<br />
(volatile content, CV of volatiles), recipe (amount of carbon addition), quality<br />
of the feed ore (% Fe 2<br />
0 3<br />
or Fe 3<br />
O 4<br />
in the ore), the reduction efficiency, and<br />
thermal design efficiencies (maximising energy transfer to product &<br />
minimizing heat losses to atmosphere). Gas in excess of the process needs are<br />
combusted in the oxidiser.<br />
5. Cooler.<br />
The reduced Fe powder is cooled to approximately 80°C under reducing<br />
conditions to prevent re-oxidation, before further treatment.<br />
6. Magnetic separation.<br />
This beneficiation step of the reduced Fe powder removes excess carbon and<br />
ash and some gangue associated with the ore, giving a higher total and<br />
metallic Fe content in the product. Recovered carbon is recycled into the<br />
reductant feed.<br />
7. Final product options.<br />
The reduced iron powder can now be i) melted directly by feeding into a an<br />
appropriate melting unit and granulated or ii) briquetted, for use as a<br />
feedstock into traditional electric steelmaking processes.<br />
<strong>Severstal</strong> Annual Report and accounts 2012
company Overview Strategy Performance Sustainability Governance Financial statements Additional information<br />
50<br />
<strong>Severstal</strong> Russian Steel<br />
<strong>Severstal</strong> Russian Steel is a leading Russian steel<br />
producer, with a broad product mix, self-sufficiency<br />
in raw materials and an extensive distribution<br />
network. We focus on high value-added flat steel<br />
products and production of long products for<br />
construction and downstream sales.<br />
Our downstream assets include the production of<br />
large diameter pipes and metalware for<br />
machinery, as well as service centres and stamping<br />
facilities for exposed automotive parts. The<br />
division has the highest share of high value-added<br />
products among its domestic peers. Our flagship<br />
Cherepovets Steel Mill is one of the lowest-cost<br />
steel mills in the world.<br />
Located in north-west Russia, the division’s steel<br />
operations enjoy convenient rail access from the<br />
company’s mining operations and low-cost direct<br />
river access to the Baltic ports, as well as being well<br />
positioned to serve the industrial cluster of the<br />
Saint-Petersburg and Moscow region.<br />
Revenue in 2012 (US$ million)<br />
10,546.8<br />
8,617.1<br />
8,617.1 m<br />
-18.3%<br />
2011<br />
2012<br />
EBITDA in 2012 (US$ million)<br />
1,784.2<br />
938.7<br />
938.7 m<br />
-47.4%<br />
2011<br />
2012
company Overview Strategy Performance Sustainability Governance Financial statements Additional information<br />
51<br />
“Russian steel producers enjoy a unique<br />
advantage over their global peers,<br />
in that the country is strong in iron<br />
ore, coking coal and primary energy,<br />
making vertical integration, a low cost<br />
base, and market resilience all a reality.<br />
In addition, the Russian steel market<br />
has demonstrated strong growth<br />
in recent years, which we expect to<br />
continue, driven by rising construction,<br />
infrastructure and automotive demand.<br />
Our efforts are directed at preserving<br />
and developing these strategic<br />
advantages. We have continued to<br />
focus on cost efficiency and utilisation<br />
of equipment, further downstream<br />
expansion. And relative to our domestic<br />
competitors, we have one of the most<br />
developed sales and service centre<br />
networks across Russia and the highest<br />
share of high value-added products in<br />
our portfolio.”<br />
Alexander Grubman<br />
CEO of <strong>Severstal</strong> Russian Steel
company Overview Strategy Performance Sustainability Governance Financial statements Additional information<br />
52<br />
<strong>Severstal</strong> Russian Steel<br />
Key 2012 highlights:<br />
• In 2012, the Russian steel consumption grew by an estimated<br />
5%, according to industry experts, and a similar 3% growth is<br />
forecast for 2013. Domestic steel production reached 71 million<br />
tonnes, 3.3% higher than in 2011. Average capacity utilisation in<br />
the domestic steel industry was around 85%, almost the 2011<br />
level. The market suffered from overcapacity, and hence average<br />
steel prices and volumes were declining during the year. To view<br />
dynamics of our steel sales volume and prices in 2012, please<br />
see the charts below.<br />
• In 2012, <strong>Severstal</strong> Russian Steel sold 10.3 million tonnes of steel<br />
products (excluding scrap), including 6.2 million tonnes to the<br />
domestic market. With the launch of the Balakovo mini-mill and<br />
the ramp up of these new capacities, we plan to get a bigger<br />
market share on the local market. We also managed to keep our<br />
utilisation rate at around 95%, above the local industry average<br />
of 85%.<br />
• This year we expect further growth in the construction,<br />
automotive and machinery sectors. Though we are not<br />
expecting much change in the average steel price on the Russian<br />
market in 2013 compared to 2012, as long as our sales volumes<br />
increase, we hope to generate bigger revenue.<br />
• In 2013, our strategy in Russia is to continue the construction of<br />
the Balakovo mini-mill, further develop our downstream projects,<br />
and make operational improvements.<br />
• Our priority for 2013 is to focus on increasing the efficiency of<br />
our operations and gaining a bigger share of the local market.<br />
Dynamics of <strong>Severstal</strong> Russian Steel’s sales volumes<br />
in 2012 (excluding scrap), (in thousand tonnes)<br />
2,625<br />
Q1<br />
Q2<br />
2,589<br />
Q3<br />
2,731<br />
Q4<br />
2,350<br />
Dynamics of <strong>Severstal</strong> Russian Steel’s average steel prices in 2012,<br />
US$/t<br />
$764<br />
Q1<br />
Q2<br />
$760<br />
Q3<br />
$746<br />
Q4<br />
$732<br />
Key production facilities<br />
Steel production<br />
Cherepovets Steel Mill is one of the world’s largest stand-alone<br />
integrated steelworks by capacity, and is a low-cost steel producer<br />
with an excellent geographic location. It produces a wide range of<br />
flat and long-rolled products, including hot and cold-rolled flat<br />
products, galvanized and colour-coated products and long-steel<br />
applications. Rolling Mill 5000, located in Kolpino, near Saint-<br />
Petersburg, produces a thick plate for large diameter pipes, shipand<br />
bridge building and other industries.<br />
Mini Mill Balakovo is a new generation mini-mill focused on the<br />
production of long products for the construction industry. It has an<br />
expected capacity, upon completion in 2013, of one million tonnes<br />
of rolled products per year.<br />
<strong>Severstal</strong> SMZ-Kolpino applies the primer on shipbuilding plates,<br />
produces semi-finished products for machinery and large<br />
fabricated sections for the construction industry. The company was<br />
certified for compliance with international standards ISO 9001,<br />
ISO 14001 and OHAS 18001. SMZ-Kolpino has the following<br />
facilities and metal processing lines: an automated steel product<br />
preservation line, distinguished by its shotblasting and protective<br />
prime coating, which are sheet metal processing methods<br />
designed to prevent corrosion; an automated beam welding line,<br />
which produces welded structures such as T-bars and I-bars; and<br />
the automated plasma-beam cutting lines, which conduct sheet<br />
metal plasma cutting, including for manufacturing welded<br />
structures.<br />
<strong>Severstal</strong>-Gonvarri-Kaluga Steel Centre is designed to produce<br />
170,000 tonnes of rolled metal products per year for the<br />
automobile and electrical industries.<br />
Gestamp-<strong>Severstal</strong>-Kaluga Stamping Facility is equipped with a<br />
number of press lines and covers the entire chain of processing of<br />
rolled steel products, from coil to car components, for international<br />
car manufacturers. It has an annual output of 13 million stamped<br />
parts, with the potential for expanding production.<br />
We are on track in developing our own service centre in<br />
Vsevolozhsk, to prepare high-quality CRC and galvanized steel,<br />
which will be further stamped at our JV with Gestamp in<br />
Vsevolozhsk. The service centre’s capacity will be 170,000 tonnes.<br />
<strong>Severstal</strong>/Mitsui JV, a service centre in Vsevolozhsk, is expected to<br />
be launched in 2013.<br />
Severtar, a joint venture with Rutgers, based at Cherepovets Steel<br />
Mill plant, will produce vacuum pitch, technical oils and<br />
naphthalene.<br />
Pipe production<br />
The Izhora Pipe Mill in Kolpino specialises in manufacturing large<br />
diameter pipes from plate, produced at the nearby Kolpino<br />
Mill-5000. It has a production capacity of 600,000 tonnes of pipes<br />
per annum, which are used primarily for oil & gas pipeline projects.<br />
TPZ-Sheksna was launched in 2010, and is designed to produce up to<br />
250,000 tonnes of electric-welded pipes for the construction<br />
industry – of various diameters, thicknesses and lengths, as well as<br />
square and rectangular sections with different cross-sections. The<br />
plant uses semi-finished steel products made at Cherepovets Steel<br />
Mill.<br />
<strong>Severstal</strong> Annual Report and accounts 2012
company Overview Strategy Performance Sustainability Governance Financial statements Additional information<br />
53
company Overview Strategy Performance Sustainability Governance Financial statements Additional information<br />
54<br />
<strong>Severstal</strong> Russian Steel<br />
Metalware production<br />
<strong>Severstal</strong>-Metiz manufactures more than 55,000 types of<br />
products, including low-carbon and high-carbon wire rods, nails,<br />
cold-drawn steel, steel rope, netting and fastenings. It has a total<br />
maximum production capacity of more than 1.5 million tonnes per<br />
year. <strong>Severstal</strong>-Metiz comprises several subsidiaries: the<br />
Cherepovets site in north-west Russia, the Orel site in central<br />
Russia, the Volgograd site in the Povolzhie region, with subsidiaries<br />
in Italy (Redaelli) and Ukraine (Dneprometiz). All of these benefit<br />
from locations in developing markets with high concentrations of<br />
industrial and retail customers.<br />
Scrap collection and processing<br />
Our scrap-processing facilities allow us to use a wide range of steel<br />
scrap. They are located in several Russian regions, and include<br />
special cutting and packaging lines for processing scrap and<br />
preparing it for use in smelting.<br />
Trading companies<br />
<strong>Severstal</strong> Russian Steel’s domestic sales are made to regional and<br />
other distributors, directly to end-users, or through Trading House<br />
<strong>Severstal</strong> Invest. Trading House <strong>Severstal</strong> Invest has a wide<br />
network of metal centres throughout the country. We conduct<br />
export sales principally through the subsidiary <strong>Severstal</strong> Export<br />
GmbH, as well as through JSC <strong>Severstal</strong>lat, LLC <strong>Severstal</strong>-Ukraine<br />
and ZAO <strong>Severstal</strong>Bel. This distribution system minimises our<br />
reliance on intermediaries, and reduces our distribution costs.<br />
Service companies<br />
Our service companies maintain the production processes of<br />
Cherepovets Steel Mill via providing timely, high-quality equipment<br />
repair services. They are organised into four types of activity:<br />
equipment repair services, machine building, other repair projects,<br />
and design and development projects.<br />
<strong>Severstal</strong> Promservice is one of the largest repair companies<br />
within <strong>Severstal</strong> Russian Steel and providing services to <strong>Severstal</strong><br />
and 3rd party clients from different industries. <strong>Severstal</strong><br />
Promservice helps in construction and equipment assembly<br />
services, manufactures and repairs energy equipment, produces<br />
steel sections and automotive systems, carries out diagnostics and<br />
land-surveying.<br />
Operational and financial results<br />
<strong>Severstal</strong> Russian Steel is one of <strong>Severstal</strong>’s largest production<br />
units. In 2012, the division produced approximately 70% of<br />
<strong>Severstal</strong>’s total crude steel output, 82% of total hot metal<br />
production and accounted for 60% of total revenues (excluding<br />
inter-segment revenue).<br />
However, deteriorating market conditions significantly impacted<br />
the results of Russian Steel division in 2012. Output declined to<br />
10,552 thousand tonnes of crude steel in 2012 from 11,355<br />
thousand tonnes in 2011. Production of hot metal decreased to<br />
8,407 thousand tonnes in 2012, compared to 8,815 thousand<br />
tonnes in 2011. As a result, in 2012, the Division’s revenue<br />
decreased by 18.3% to US$8,617.1 million, and EBITDA declined<br />
by 47.4% to US$938.7 million.<br />
However, the Division still managed to set a number of records in<br />
2012:<br />
• In July, steel-melting producers achieved a record in converter<br />
steel melting – 91 melts a day<br />
• Cherepovets Steel Mill achieved the maximum yearly output of<br />
electric power – 3,279 m kilowatt-hour<br />
• During the shipping season of 2012, Cherepovets Steel Mill<br />
increased the volumes of steel shipped by water to Russian<br />
customers by three times, compared to 2011.<br />
<strong>Severstal</strong> Annual Report and accounts 2012
company Overview Strategy Performance Sustainability Governance Financial statements Additional information<br />
55<br />
Key performance indicators<br />
As mentioned above, 2012 was a challenging year for<br />
steelmakers. <strong>Severstal</strong> Russian Steel saw strong performance in<br />
the first nine months of 2012, while in the fourth quarter it was<br />
impacted by collapsing steel prices and sales volumes. Average<br />
sales price were decreasing faster than the cost of raw<br />
materials. In addition to that, the decrease of Division’s EBITDA<br />
for 2012 was due to US$95 million of an additional allowance<br />
in respect of inventories (primarily spare parts). All this caused<br />
a decrease in the 2012 annual EBITDA margin from 16.9% in<br />
2011 to 10.9% in 2012. However, <strong>Severstal</strong> Russian Steel<br />
maintained one of the highest EBITDA margins among its<br />
domestic peers in a challenging year. Worth noting that<br />
<strong>Severstal</strong>’s pipemaking business was a good contributor to the<br />
financial results.<br />
In 2012, <strong>Severstal</strong> Russian Steel’s headcount totalled 47,573.<br />
EBITDA drivers in 2012, US$m<br />
1,784<br />
502<br />
5 61<br />
(612)<br />
483<br />
(417)<br />
39 939<br />
(825)<br />
(81)<br />
EBITDA<br />
2011<br />
Sales<br />
Volume<br />
Sales<br />
Price<br />
Sales<br />
Structure<br />
COS<br />
Volume<br />
COS<br />
Price<br />
Consumption<br />
Rates<br />
COS<br />
Structure<br />
Other FX EBITDA<br />
2012<br />
Key performance indicators 2012 2011 Change %<br />
Revenue (US$ million) 8,617.1 10,546.8 (18.3%)<br />
Gross profit (US$ million) 1,905.7 2,798.2 (31.9%)<br />
Profit from operations (US$ million) 990.2 1,450.0 (31.7%)<br />
Operating margin (%) 11.5% 13.7% n/a<br />
EBITDA (US$ million) 938.7 1,784.2 (47.4%)<br />
EBITDA per tonne (US$/tonne) 91.2 161.8 (43.6%)<br />
EBITDA margin (%) 10.9% 16.9% n/a<br />
Average steel product price (US$/tonne) 751 867 (13.4%)<br />
Hot-rolled strip and plate (US$/tonne) 613 737 (16.8%)<br />
Large diameter pipes (US$ /tonne) 1,760 1,997 (11.9%)<br />
Cold-rolled flat products (US$ /tonne) 710 850 (16.5%)<br />
Galvanized and other metallic coated sheet (US$/tonne) 948 1,023 (7.3%)<br />
Colour-coated sheet (US$/tonne) 1,165 1,274 (8.6%)<br />
Metalware products (US$/tonne) 1,170 1,268 (7.7%)<br />
Long products (US$/tonne) 669 739 (9.5%)<br />
Semi-finished products (US$/tonne) 527 592 (11.0%)<br />
Other tubes and pipes, formed shapes (US$/tonne) 759 869 (12.7%)<br />
Average scrap price (US$/tonne) 304 369 (17.6%)<br />
<strong>Severstal</strong> Annual Report and accounts 2012
company Overview Strategy Performance Sustainability Governance Financial statements Additional information<br />
56<br />
<strong>Severstal</strong> Russian Steel<br />
Production results<br />
In 2012, the division produced 8.4 million tonnes of hot metal (5% less than in 2011), and 10.6 million tonnes of crude steel (7% less than in 2011).<br />
Production volumes, thousand tonnes 2012 2011 Change %<br />
Hot metal 8,407 8,815 (5%)<br />
Crude steel<br />
Basic oxygen furnaces 9,377 9,569 (2%)<br />
Electric arc furnaces 1,175 1,786 (34%)<br />
Total crude steel 10,552 11,355 (7%)<br />
Sales results<br />
On the back of the seasonal steel and raw materials inventories restocking, 2012 started with growing steel prices. But then global<br />
economic environment deteriorated leading to a drop in demand on our export markets, especially in Europe, and steel products sales<br />
volumes started declining. Though some European, American and Chinese producers tried to raise prices from time to time, domestic steel<br />
prices were declining during the whole year.<br />
Overall <strong>Severstal</strong> Russian Steel sales totalled 10,352 thousand tonnes of steel products in 2012 – 7.6% decrease year-on-year.<br />
Against the decrease in volumes and prices due to the lower demand, <strong>Severstal</strong> Russian Steel managed to improve its sales portfolio by<br />
increasing the share of HVA, more profitable products like colour-coated steel.<br />
Sales by product<br />
In 2012, sales of hot-rolled strip and plate accounted for 43.3% of<br />
overall sales volumes (31.9% of revenue), cold-rolled sheet – 12.5%<br />
(10.6% of revenue), semi-finished products – 9.0% (5.7% of<br />
revenue), long products – 8.0% (6.5% of revenue), metalware<br />
products – 8.0% (11.3% of revenue), and galvanized and other<br />
metallic coated sheet – 5.8% (6.6% of revenue). Other steel<br />
products (tubes, pipes, colour-coated sheet and scrap) accounted<br />
for 13.4% of overall sales volume (17.3% of revenue). Other<br />
revenues and shipping reached 10.1% of total revenues.<br />
Sales by product, %<br />
5.0%<br />
0.2%<br />
10.1%<br />
5.6%<br />
31.9%<br />
5.7%<br />
6.5%<br />
11.3%<br />
6.6%<br />
10.6% 6.5%<br />
Hot-rolled strip and plate - 31.9%<br />
Large diameter pipes - 6.5%<br />
Cold-rolled flat products - 10.6%<br />
Metalware products - 11.3%<br />
Galvanized and other metallic<br />
coated sheet - 6.6%<br />
Long products - 6.5%<br />
Semi-finished products - 5.7%<br />
Others tubes and pipes, formed<br />
shapes - 5.6%<br />
Colour-coated sheet - 5.0%<br />
Scrap - 0.2%<br />
Other revenues and shipping - 10.1%<br />
2012 2011 Change, %<br />
Sales by products Thousand tonnes US$ million Thousand tonnes US$ million Thousand tonnes US$ million<br />
Hot-rolled strip and plate 4,482 2,747.6 4,616 3,399.9 (2.9%) (19.2%)<br />
Large diameter pipes 321 564.9 504 1,006.7 (36.3%) (43.9%)<br />
Cold-rolled sheet 1,292 917.7 1,410 1,197.9 (8.4%) (23.4%)<br />
Metalware products 829 969.9 763 967.4 8.7% 0.3%<br />
Galvanized and other metallic coated sheet 604 572.6 761 778.2 (20.6%) (26.4%)<br />
Long products 831 556.0 820 605.6 1.3% (8.2%)<br />
Semi-finished products 932 491.6 1,298 769.0 (28.2%) (36.1%)<br />
Other tubes and pipes, formed shapes 636 483.0 589 511.8 8.0% (5.6%)<br />
Colour-coated sheet 368 428.6 240 305.8 53.3% 40.2%<br />
Scrap 57 17.3 208 76.8 (72.6%) (77.5%)<br />
Total steel products 10,352 7,749.2 11,209 9,619.1 (7.6%) (19.4%)<br />
Other and shipping - 867.9 - 927.7 n/a (6.4%)<br />
Total sales by products 10,352 8,617.1 11,209 10,546.8 (7.6%) (18.3%)<br />
Inter-segment transactions (155) (95.5) (23) (78.1) 573.9% 22.3%<br />
<strong>Severstal</strong> Annual Report and accounts 2012
company Overview Strategy Performance Sustainability Governance Financial statements Additional information<br />
57<br />
Sales by market<br />
<strong>Severstal</strong> Russian Steel sells its products on both the domestic and<br />
international markets, with an increasing focus on the Russian<br />
market.<br />
Sales by market, %<br />
Domestic<br />
Exports<br />
35%<br />
65%<br />
The Russian market<br />
The Division continues to regard Russia as its most important<br />
market. Its main domestic customers include pipe mills and<br />
construction companies, machinery and automotive clients. The<br />
share of sales volume to the Russian market grew to 60% in 2012<br />
from 58% in 2011. In 2013, <strong>Severstal</strong> Russian Steel aims to further<br />
increase its share of domestic sales, and we expect that future<br />
growth will be driven primarily by increased sales to the<br />
construction industry and auto.<br />
Comparing to 2011, average prices for the Division’s main products<br />
(excluding scrap), decreased by 14.4% in 2012.<br />
Consequently, prices for hot-rolled strip and plate decreased by<br />
16.7%, for cold-rolled sheet by 15.1%, for long products by 8.9%, for<br />
metalware products by 8.6%, for galvanized and other metallic<br />
coated sheet by 7.2%, and for other tubes and pipes, formed<br />
shapes, by 12.2%. And only prices for semi-finished products rose<br />
by 3.5%, mostly due to a change in the steel grade.<br />
2012 2011 Change, %<br />
Domestic sales by products Thousand tonnes US$ million Thousand tonnes US$ million Thousand tonnes US$ million<br />
Hot-rolled strip and plate 2,199 1,433.5 2,333 1,826.6 (5.7%) (21.5%)<br />
Large diameter pipes 298 541.0 499 1,002.3 (40.3%) (46.0%)<br />
Cold-rolled sheet 773 550.9 967 811.3 (20.1%) (32.1%)<br />
Metalware products 568 629.2 524 635.3 8.4% (1.0%)<br />
Galvanized and other metallic coated sheet 494 469.0 629 643.4 (21.5%) (27.1%)<br />
Long products 758 507.3 740 543.6 2.4% (6.7%)<br />
Semi-finished products 188 123.8 47 29.9 300.0% 314.0%<br />
Other tubes and pipes, formed shapes 504 380.2 474 407.1 6.3% (6.6%)<br />
Colour-coated sheet 337 392.4 219 275.8 53.9% 42.3%<br />
Scrap 55 16.6 78 26.1 (29.5%) (36.4%)<br />
Total steel products 6,174 5,043.9 6,510 6,201.4 (5.2%) (18.7%)<br />
Other and shipping - 551.4 - 608.6 n/a (9.4%)<br />
Total sales by products 6,174 5,595.3 6,510 6,810.0 (5.2%) (17.8%)<br />
Inter-segment transactions (19) (23.2) (16) (13.9) 18.8% 66.9%<br />
<strong>Severstal</strong> Annual Report and accounts 2012
company Overview Strategy Performance Sustainability Governance Financial statements Additional information<br />
58<br />
<strong>Severstal</strong> Russian Steel<br />
Export markets<br />
In 2012, export sales of steel products decreased by 11.1% in<br />
volume, and by 19.1% in revenue, compared to 2011.<br />
The biggest share of our export sales comprised hot-rolled strip and<br />
plate products (43.5% of total steel products), semi-finished products<br />
(12.2% of total steel products) and cold-rolled sheet (12.1% of total<br />
steel products). In 2012, export prices for almost all product groups<br />
decreased because of the decline in demand due to the global<br />
economic downturn. For the main product groups, prices decreased by<br />
16.5% for hot-rolled strip and plate products, by 16.3% for semifinished<br />
products and by 19% for cold-rolled sheet.<br />
2012 2011 Change, %<br />
Export sales by products Thousand tonnes US$ million Thousand tonnes US$ million Thousand tonnes US$ million<br />
Hot-rolled strip and plate 2,283 1,314.1 2,283 1,573.3 - (16.5%)<br />
Large diameter pipes 23 23.9 5 4.4 360.0% 443.2%<br />
Cold-rolled sheet 519 366.8 443 386.6 17.2% (5.1%)<br />
Metalware products 261 340.7 239 332.1 9.2% 2.6%<br />
Galvanized and other metallic coated sheet 110 103.6 132 134.8 (16.7%) (23.1%)<br />
Long products 73 48.7 80 62.0 (8.8%) (21.5%)<br />
Semi-finished products 744 367.8 1,251 739.1 (40.5%) (50.2%)<br />
Other tubes and pipes, formed shapes 132 102.8 115 104.7 14.8% (1.8%)<br />
Colour-coated sheet 31 36.2 21 30.0 47.6% 20.7%<br />
Scrap 2 0.7 130 50.7 (98.5%) (98.6%)<br />
Total steel products 4,178 2,705.3 4,699 3,417.7 (11.1%) (20.8%)<br />
Other and shipping - 316.5 - 319.1 n/a (0.8%)<br />
Total sales by products 4,178 3,021.8 4,699 3,736.8 (11.1%) (19.1%)<br />
Inter-segment transactions (136) (72.3) (7) (64.2) n/a 12.6%<br />
Sales by region<br />
Strategically, <strong>Severstal</strong> Russian Steel is building long-term relationships<br />
with customers in the CIS and EU. Considering our low-cost base, we<br />
can deliver to remote regions, while there we supply primarily on the<br />
spot basis, with the exception of sales to the tube and pipe markets,<br />
and automotive producers. Sales to customers in Russia are<br />
strategically important to us and hence we prioritize them.<br />
In 2012, the main export regions were Europe (50.9% of export<br />
revenue), Asia (20.0% of export revenue) and Central and South<br />
America (9.9% of export revenue). Sales to other regions amounted to<br />
19.2% of export sales. In 2012, the division’s primary focus was Europe<br />
and the CIS, which together accounted for 59.7% of export revenue.<br />
Revenues by regions, 2012<br />
2.7% 1.0%<br />
3.5%<br />
3.0% 1.0%<br />
6.1%<br />
17.8%<br />
64.9%<br />
Russian Federation - 64.9%<br />
Europe - 17.8%<br />
China and Central Asia - 6.1%<br />
Central and South America - 3.5%<br />
The Middle East - 3.0%<br />
North America - 2.7%<br />
Africa - 1.0%<br />
South-East Asia - 1.0%<br />
Sales by industry<br />
On the domestic market, <strong>Severstal</strong> Russian Steel focuses on selling<br />
its products to the construction, and oil and gas industries, pipe<br />
and automotive producers, machinery builders and steel service<br />
centres. On export, sales are primarily to the processing and<br />
construction industries, including re-rollers of slabs, hot-rolled and<br />
cold-rolled coils.<br />
In 2012, our revenue coming from the construction and<br />
processing industries accounted for 52.8% of total sales,<br />
while sales to the oil and gas sector accounted for 6.8%,<br />
machinery building – for 10.3%, and tube- and pipe making –<br />
for 12.3%.<br />
Revenues by industry, 2012<br />
7.9%<br />
12.3%<br />
10.3%<br />
9.9%<br />
52.8%<br />
Construction and progress - 52.8%<br />
Oil and Gas - 6.8%<br />
Machinery building - 10.3%<br />
Tube and pipemaking - 12.3%<br />
Automotive - 7.9%<br />
Others - 9.9%<br />
6.8%<br />
Revenues by regions, 2011<br />
2.8% 1.2%<br />
2.2% 3.9% 1.6%<br />
4.9%<br />
Revenues by industry, 2011<br />
18.8%<br />
64.6%<br />
Russian Federation - 64.6%<br />
Europe - 18.8%<br />
China and Central Asia - 4.9%<br />
Central and South America - 2.2%<br />
The Middle East - 3.9%<br />
North America - 2.8%<br />
Africa - 1.2%<br />
South-East Asia - 1.6%<br />
6.8%<br />
8.5%<br />
12.8%<br />
51.9%<br />
9.6%<br />
10.4%<br />
Construction and progress - 51.9%<br />
Oil and Gas - 10.4%<br />
Machinery building - 9.6%<br />
Tube and pipemaking - 12.8%<br />
Automotive - 6.8%<br />
Others - 8.5%
company Overview Strategy Performance Sustainability Governance Financial statements Additional information<br />
59<br />
Costs<br />
We consistently work to maintain our leading cost position<br />
through labour and energy productivity, and organisational<br />
improvements.<br />
In 2012, the Division’s cost of sales decreased by US$1,037.3<br />
million, compared to 2011, mainly due to the decrease in raw<br />
materials and energy prices (US$502 million), lower sales volume<br />
(US$461 million), and initiatives of the Business System of<br />
<strong>Severstal</strong> (US$277 million). The 2012 Business System’s key<br />
achievements in <strong>Severstal</strong> Russian Steel were as follows:<br />
• Purchasing and logistics efficiency, a US$63.2 million gain –<br />
more efficient purchase practices include:<br />
• optimising sinter and coal charges by closer monitoring of<br />
process requirements and storage<br />
• improved transport logistics including delivery times, mode of<br />
delivery, and reduction of rail car turnover time<br />
• commercial work, such as a category-based approach to<br />
purchase, and promoting competition among suppliers to<br />
obtain better terms<br />
• Administrative cost optimisation, a US$11.7 million gain –<br />
examples include organisational restructuring, with restricted<br />
hiring after natural attrition in personnel numbers, and shared<br />
services within <strong>Severstal</strong>.<br />
• Continuous improvement, a US$117 million gain – projects in<br />
2012 included:<br />
• selecting the optimal composition of charges<br />
• reducing external coke and pellet consumption<br />
• substituting expensive types of scrap with cheaper ones<br />
• actions to save on ferroalloys<br />
• actions to save on metallic materials in the charge<br />
• efficiencies from increasing production volumes<br />
2012 2011<br />
Cost of sales structure US$ million % of total US$ million % of total Change %<br />
Materials<br />
Scrap metal 866.3 12.9% 1,115.6 14.4% (22.3%)<br />
Coal 862.3 12.8% 1,161.7 15.0% (25.8%)<br />
Iron ore 817.9 12.2% 947.0 12.2% (13.6%)<br />
Ferroalloys and nonferrous metals 406.6 6.1% 562.8 7.3% (27.8%)<br />
Pellets 542.7 8.1% 713.3 9.2% (23.9%)<br />
Coke 96.0 1.4% 259.8 3.4% (63.0%)<br />
Other materials 874.5 13.0% 1,057.9 13.6% (17.3%)<br />
Total materials 4,466.3 66.5% 5,818.1 75.1% (23.2%)<br />
Energy<br />
Electric power 183.4 2.7% 227.3 2.9% (19.3%)<br />
Gas 297.7 4.4% 230.8 3.0% 29.0%<br />
Other energy resources 58.3 0.9% 105.0 1.4% (44.5%)<br />
Total energy 539.4 8.0% 563.1 7.3% (4.2%)<br />
Staff costs 826.1 12.3% 759.3 9.8% 8.8%<br />
Depreciation and amortization 294.2 4.4% 312.1 4.0% (5.7%)<br />
Services 324.4 4.8% 300.7 3.9% 7.9%<br />
Other 261.0 4.0% (4.6) (0.1%) n/a<br />
Total 6,711.4 100.0% 7,748.7 100.0% (13.4%)<br />
<strong>Severstal</strong> Annual Report and accounts 2012
company Overview Strategy Performance Sustainability Governance Financial statements Additional information<br />
60<br />
<strong>Severstal</strong> Russian Steel<br />
Operational development in 2012<br />
The <strong>Severstal</strong> Russian Steel capital expenditure programme is<br />
designed to increase productivity and efficiency, improve<br />
environmental protection, replace and refurbish major equipment,<br />
and develop the Division’s product mix further to produce higherquality,<br />
and value-added products, including galvanized steel and<br />
cold-rolled products. The programme focuses on customer care, cost<br />
optimisation, capacity utilisation growth and cutting edge expertise.<br />
In 2012 its cash capital expenditure was US$742 million.<br />
At the beginning of 2013 we launched, after reconstruction, Coke<br />
Battery #7, aiming for complete self-sufficiency in coke.<br />
Our key development projects<br />
For the construction industry:<br />
The Balakovo Mini-Mill<br />
With the launch of the Balakovo mini-mill in the Saratov region in<br />
2013, our total long products capacity in Russia will exceed 2.1<br />
million tonnes a year. To date, we have installed all technological<br />
equipment. The hot-end process and rolling lines assembly works<br />
are underway. Balakovo is close to clients, in a scrap-rich area, and<br />
close to the sources of cheap energy. It will expand our presence<br />
on a promising market and diversify our product mix. Total<br />
investments in the project are expected at c. US$700 million.<br />
The Second Colour-Coating Line<br />
In December 2011, Cherepovets Steel Mill commissioned its second<br />
colour-coating line (CCL-2), with total investment of around US$78<br />
million and nominal capacity of 200,000 tonnes of colour-coated<br />
hot dip steel. In April 2012, the CCL-2 reached its design capacity.<br />
Steel Solutions<br />
Steel Solutions takes us into a new business area – designing and<br />
constructing pre-engineered buildings from steel components.<br />
Compared to the traditional construction technology, this<br />
approach enables homes to be built 1.5 times quicker and 10%<br />
cheaper – and to be more energy-efficient. We have signed our first<br />
contract and shipments have started. In 2012, we acquired Orel<br />
Metal Plant, which after upgrades and modernisation, will produce<br />
steel products fully for the Steel Solutions’ projects.<br />
For the automotive sector:<br />
Growing shipments to the car industry<br />
During the year we increased shipments of rolled steel to Russian<br />
and CIS-based car manufacturers by 9.5% year-on-year. We began<br />
supplies of rolled metal products for Volkswagen and Skoda cars in<br />
Russia. In addition, we have signed a new long-term delivery<br />
contract with Hyundai’s St. Petersburg car assembly plant and<br />
renewed our agreement with Renault’s assembly plant in Moscow.<br />
We have also increased deliveries of hot dip galvanized rolled<br />
products to GAZ Group, Russia’s largest automotive engineering<br />
group.<br />
Development of Service Centres<br />
In March 2012, Gestamp <strong>Severstal</strong> Vsevolozhsk was awarded Q1,<br />
Ford’s highest production quality standard for manufacturing<br />
automotive metal components. The award covers production<br />
quality, streamlined logistics, clean production and compliance<br />
with international quality standards.<br />
<strong>Severstal</strong>/Mitsui JV, a service centre in Vsevolozhsk, is expected to<br />
be launched in 2013.<br />
We are on track in developing our own service centre in<br />
Vsevolozhsk, to prepare high-quality CRC and galvanized steel,<br />
which will be further stamped at our JV with Gestamp in<br />
Vsevolozhsk. The service centre’s capacity will be 170,000 tonnes.<br />
For the machinery sector:<br />
We are constantly developing new products to meet clients’ needs,<br />
enforcing quality control procedures and offering additional<br />
technical support services. In 2012, we expanded our cooperation<br />
with producers of household appliances, and now supply Beko and<br />
Vestel with cold-rolled products.<br />
In 2012, we doubled sales volumes of special steel to the<br />
shipbuilding industry year-on-year, and ramped up production<br />
rapidly in response to the market potential. Special, coldresistant<br />
steel grades АK and АB are used primarily for making<br />
navy vessels.
company Overview Strategy Performance Sustainability Governance Financial statements Additional information<br />
61<br />
For the oil & gas industry:<br />
<strong>Severstal</strong> and Gazprom signed a long-term scientific and technical<br />
cooperation agreement for 2012-2016. The programme aims to<br />
coordinate joint actions of both parties to develop new types of<br />
pipe products, in accordance with Gazprom’s needs, and to<br />
improve customer characteristics of pipes manufactured by Izhora<br />
Pipe Mill. Particularly, pipe products for deep-sea pipelines, pipes<br />
for transporting natural gas with a high hydrogen sulphide<br />
content, and tubes to be used in areas of active tectonic faults.<br />
Priority projects for 2013-2014 are ‘South Stream’ and ‘The Power<br />
of Siberia’.<br />
Sustainability<br />
In April 2012, Cherepovets Steel Mill announced its intention to<br />
increase investments in environmental activities in 2012 to 1.16<br />
billion roubles (more than US$38 million), 57% above 2011. The<br />
most important projects included the construction of a new system<br />
for capturing fugitive emissions from the steelmaking process. The<br />
investment, totalling more than 3 billion roubles (US$96 million), is<br />
scheduled to be completed by the end of 2014.<br />
Among major programmes to be launched this year is an upgrade<br />
of gas cleaning of shaft furnace No. 1 in the steelmaking process,<br />
installation of a system for cleaning aspiration air in the sintering<br />
process, and others – we will implement a total of 17 projects for<br />
minimising our impact on the environment at Cherepovets Steel Mill.<br />
Outlook and strategic priorities for 2013<br />
Major targets for 2013 include: launch of the Balakovo mini-mill,<br />
increase in sales of high value-added products, higher sales to the<br />
domestic market, LDP supplies to Gazprom’s South Stream project,<br />
development of service metal centres, further growth in auto steel<br />
supplies, commissioning the refurbished coke battery #7 and<br />
investments in emission reduction programmes at Cherepovets<br />
Steel Mill.
company Overview Strategy Performance Sustainability Governance Financial statements Additional information<br />
62<br />
<strong>Severstal</strong> International<br />
<strong>Severstal</strong> International is a modern steel producer<br />
with fully invested and cost-competitive assets in<br />
Dearborn Michigan and Columbus Mississippi,<br />
USA. Columbus is the most efficient mini-mill in<br />
North America, with a high quality of products and<br />
excellent market access. Dearborn is well<br />
positioned for the growing US automotive market,<br />
and has a favourable geographic and logistical<br />
advantage relative to peers.<br />
With the recently completed modernisation<br />
programme, the company is increasing high<br />
value-added product sales while at the same time<br />
benefiting from low capital spending. <strong>Severstal</strong>’s<br />
North American long-term contracts in iron ore<br />
and coke, combined with our integrated coke joint<br />
venture, allow for stability of raw material supply.<br />
We have long-standing, solid relationships with<br />
leading customers in the automotive, construction,<br />
pipe and tube, and other sectors.<br />
Revenues in 2012 (US$ million)<br />
3,422.1<br />
3,878.5<br />
3,878.5 m<br />
+13.3%<br />
2011<br />
2012<br />
EBITDA in 2012 (US$ million)<br />
180.9<br />
165.6<br />
165.6 m<br />
- 8.5%<br />
2011<br />
2012
company Overview Strategy Performance Sustainability Governance Financial statements Additional information<br />
63<br />
“<strong>Severstal</strong> is now strongly positioned<br />
in one of the world’s largest and most<br />
dynamic markets. We have invested<br />
heavily in our US operations since<br />
2004 and now this modernisation<br />
is complete, we are making good<br />
progress towards our production targets.<br />
Fundamentally, we believe the US<br />
market is very attractive, given the low<br />
inflation environment, growing local<br />
steel demand, availability of scrap and<br />
access to relatively cheap energy.<br />
Our strategic location assists us, with<br />
about three-quarters of US automotive<br />
stamping facilities located within<br />
720km of our assets, as well as many<br />
of the oil and gas companies who use<br />
our steel pipe products. In fact, we now<br />
have a high-margin product mix, firmly<br />
focused on the most attractive sectors<br />
in the market.”<br />
Sergei Kuznetsov<br />
CEO of <strong>Severstal</strong> International
company Overview Strategy Performance Sustainability Governance Financial statements Additional information<br />
64<br />
<strong>Severstal</strong> International<br />
Key 2012 commercial and market highlights<br />
• In 2012, NAFTA light flat rolled steel demand growth was<br />
moderate, at an estimated 5.3% from 65.7 million tonnes in<br />
2011 to 69.2 million tonnes in 2012. According to industry<br />
experts, 2013 is expected to remain stable with an increase of<br />
2.1% forecast.<br />
• US capacity utilisation was 75.7% in 2012, slightly higher than<br />
the 74.4% in 2011. The market suffered from overcapacity and<br />
imports, which had a negative impact on steel prices, and both<br />
volume and capacity utilisation declined throughout most of the<br />
year. Including preliminary census data, flat rolled imports<br />
finished the year 16.9% higher than 2011.<br />
• <strong>Severstal</strong> shipped 4.5 million tonnes in 2012, or a market share<br />
of 6.5% of NAFTA shipments. As a result of the ramp-up of new<br />
capacity, primarily in Columbus, we increased annual shipments<br />
by 17% compared to 2011. As we continue to ramp-up our new<br />
capacities, market share will continue to increase until we reach<br />
capacity. <strong>Severstal</strong>’s utilisation rate is approximately 80%, above<br />
the industry’s 2012 average of 75.7%.<br />
• <strong>Severstal</strong>’s key market sectors are automotive, energy (oil & gas)<br />
and service centres. Dearborn shipments are heavily focused on<br />
automotive, and total <strong>Severstal</strong> shipments to the automotive<br />
segment reached 1.4 million tonnes in 2012.<br />
• Production of light vehicles finished strongly in 2012, with<br />
NAFTA production up 17.4% to 15.4 million units, led by gains of<br />
19.3% in the US, 15.5% in Canada and 12.8% in Mexico. 2013<br />
NAFTA auto production is projected to increase by 3.2% over<br />
2012 to 15.9 million units.<br />
• Overall construction spending in 2012 finished the year 9.2%<br />
higher than 2011, with residential construction increasing 15%<br />
and non-residential increasing 6%. The AIA (American Institute<br />
of Architects) architecture billings index finished 2012 with an<br />
average of 50.1 and was above 50 for eight months out of the<br />
year; indicating future construction growth. As residential<br />
activity in the US continues to improve, we expect to see<br />
increased demand in this segment.<br />
• The energy market has levelled off, but the impact of shale<br />
exploration will be favourable, once governmental and<br />
environmental issues are addressed. There are signs of renewal<br />
as 2013 drilling programmes begin and new pipeline projects<br />
have been announced.<br />
• Industry steel selling prices declined by 11.2% in 2012 with CRU<br />
hot band prices averaging $723/t for the year. Prices declined<br />
throughout the first half of 2012 with some recovery by year<br />
end. Steel selling prices are expected to remain relatively flat<br />
given the global market environment, combined with the low<br />
utilisation levels in the US. Even with average steel prices<br />
remaining flat in 2013 compared to 2012, as we gain market<br />
share in high value-added products, revenue will increase.<br />
• Our shipments continue to be focused on the US with only<br />
Mexico accounting for any significant export shipments. Our<br />
mini-mill in Columbus, Mississippi, is benefiting from increasing<br />
industrial activity in the region of Mexico, and Columbus<br />
continues to obtain auto quality compliance certificates,<br />
granting access to a wider range of automotive customers.<br />
• In 2012, our strategy in the US was to complete modernisation<br />
at both steel plants to ensure they are fully prepared to benefit<br />
from the continuing recovery from the US’s 2009-2010 recession<br />
and expected US industrial and infrastructure revitalisation. In<br />
total, for the cycle and by the end of 2012, we spent US$3.1<br />
billion on expansion and modernisation programmes. With<br />
these investments now complete, our annual maintenance<br />
capex in <strong>Severstal</strong> International is expected to be minimal.<br />
• Our priority for 2013 is to focus on increasing efficiency of our<br />
operations. We are now analysing our sales and purchasing<br />
practices to reduce costs and optimise margins, in addition to<br />
increasing our sales of high value-added products.<br />
Dynamics of <strong>Severstal</strong> International’s sales volumes in 2012,<br />
(in thousand tonnes)<br />
Dynamics of <strong>Severstal</strong> International’s average steel price* in 2012,<br />
$/T<br />
1,221<br />
1,196<br />
$870<br />
$865<br />
1,081<br />
967<br />
$816<br />
$813<br />
Q1<br />
Q2<br />
Q3<br />
Q4<br />
Q1<br />
Q2<br />
Q3<br />
Q4<br />
* Steel price includes all steel products, based on mixed price terms, resulting ex works.<br />
<strong>Severstal</strong> Annual Report and accounts 2012
company Overview Strategy Performance Sustainability Governance Financial statements Additional information<br />
65
company Overview Strategy Performance Sustainability Governance Financial statements Additional information<br />
66<br />
<strong>Severstal</strong> International<br />
Key production facilities<br />
The division’s steel production business comprises the following<br />
assets:<br />
Steel production<br />
<strong>Severstal</strong> Columbus is one of the most technologically advanced<br />
steel-making facilities in North America. Commissioned in August<br />
2007, it is the newest mini-mill in North America and the only EAF<br />
compact strip process plant in the world designed to make exposed<br />
automotive steels. The mill produces high-quality flat-rolled<br />
products, including hot-rolled bands, hot-rolled processed sheet,<br />
cold-rolled full hard and cold-rolled fully processed sheet, and<br />
hot-dipped galvanized sheet. It is strategically located in Columbus,<br />
Mississippi, with outstanding access to rail, truck and water routes<br />
that enable it to deliver product faster and more economically than<br />
other steelmakers throughout the growing south-eastern US<br />
manufacturing region and into Mexico. Its site is designed to allow<br />
for additional processing operations, which are being developed.<br />
In 2013, we want to improve our Business System of <strong>Severstal</strong><br />
leading indicator site benchmark score, a key internal performance<br />
measurement, from its year-end 2012 level of 594 at a rate of 13<br />
points per month, to achieve a final 2013 target of 750, by<br />
developing and implementing action plans to address gaps<br />
indicated by the Business System of <strong>Severstal</strong> audit. We expect<br />
further implementation of the Business System of <strong>Severstal</strong><br />
initiative to generate continuous improvement, as outlined and<br />
tracked through the Business System of <strong>Severstal</strong> website and in<br />
keeping with the 2013 business plan objectives.<br />
<strong>Severstal</strong> Dearborn, in Michigan, has a history dating back to<br />
the earliest days of automotive manufacturing. It is strategically<br />
located close to major automotive customers, the Great Lakes<br />
waterways and three large railroads in North America, providing<br />
logistically favourable access to raw materials and customers.<br />
Dearborn’s products include hot-rolled, cold-rolled and galvanized<br />
steel, as well as high-strength, high-carbon and low-alloy steel,<br />
largely targeted at the automotive industry. Other markets<br />
include pipe and tubing, strip re-rollers and galvanizers, service<br />
centres, construction, appliances and furniture.<br />
Our modernisation of the Dearborn plant included constructing a<br />
Pickle Line and Tandem Cold Mill (PLTCM) complex and Hot Dipped<br />
Galvanizing Line (HDGL), both of which began production in 2011.<br />
The new cold mill can produce next-generation auto steels for sale<br />
or further processing at the new galvanizing line, with the latest hot<br />
dip technology to meet increasing exposed auto surface demands.<br />
The PLTCM has highly sophisticated control systems, cutting-edge<br />
operating practices, and in 2012 exceeded 2011 production from<br />
the old tandem mill by 495 thousand tonnes. We have successfully<br />
commissioned the HDGL and begun production of galvanized<br />
products. This strengthens our presence in the automotive industry,<br />
offering state-of-the-art controls for coating thickness and surface<br />
texture, as well as alloy and phase control. The line is capable of<br />
producing 500 thousand tonnes of steel for customers in the<br />
exposed automotive, appliance, and furniture industries – as well as<br />
precision automotive products, including high-strength and<br />
advanced high-strength steels for auto manufacturers.<br />
Joint ventures<br />
We have a number of JVs with local players on the US market.<br />
These can be broken down into two categories:<br />
• ensure raw materials self-sufficiency;<br />
• expand our value-added products manufacturing. JVs help us to<br />
extend our client outreach and minimise our capital exposure.<br />
Coke sufficiency:<br />
Mountain State Carbon LLC is a 50-50 joint venture with Renco<br />
Group. It has four coke oven batteries (three three-metre and one<br />
six-metre refurbished in 2006) providing high-quality coke for<br />
steelmaking operations. Mountain State Carbon meets<br />
approximately 60% of Dearborn coke needs.<br />
Extending the value chain:<br />
Double Eagle Steel Coating Company is a 50:50 joint venture<br />
with United States Steel Corporation. Adjacent to <strong>Severstal</strong><br />
Dearborn, it is the world’s largest electro-galvanizing line,<br />
producing premium-quality galvanized sheet steel primarily for<br />
automotive customers. The plant has a production capacity of 789<br />
thousand tonnes a year, approximately half of which is dedicated<br />
to Dearborn.<br />
Spartan Steel Coating LLC is a joint venture with Worthington<br />
Steel of Michigan – <strong>Severstal</strong> Dearborn owns 48% and supplies<br />
steel sheet used as substrate. Located in Monroe, Michigan, it<br />
produces hot-dip galvanized sheet steel primarily for the<br />
automotive and service centre industries. It has a production<br />
capacity of 544 thousand tonnes a year, about 80% of which is<br />
dedicated to Dearborn.<br />
Mississippi Steel Processing LLC (MSP), of which <strong>Severstal</strong><br />
Columbus owns 20%, is a processor of heavy gauge, hot roll and<br />
hot roll pickle and oil products. It is a joint venture with Merlo<br />
Holdings Inc (40%) and Layhill Ventures LLC (40%). Construction<br />
was completed and production began in the first quarter of 2011,<br />
and 2012 output was 221 thousand tonnes a year.<br />
<strong>Severstal</strong> Annual Report and accounts 2012
company Overview Strategy Performance Sustainability Governance Financial statements Additional information<br />
67<br />
Key Performance Indicators<br />
In 2012, <strong>Severstal</strong> International revenue increased by 13.3% to<br />
US$3,878.5 million.<br />
EBITDA is slightly reduced in 2012 and amounted to US$165.6<br />
million, which resulted in decrease of the full-year EBITDA margin<br />
to 4.3% from 5.3% in 2011. EBITDA per tonne of steel product<br />
reduced from US$47.5 to US$37.1.<br />
In 2012, <strong>Severstal</strong> International’s average headcount totalled 2,165.<br />
Production results<br />
In 2012, Columbus and Dearborn produced 4,587 thousand<br />
tonnes of crude steel and Dearborn produced 1,850 thousand<br />
tonnes of hot metal.<br />
Sales results<br />
In 2012, the division’s sales revenue increased by 13.3% to<br />
US$3,878.5 million.<br />
While NAFTA demand in 2012 increased by 3.5% for hot-rolled,<br />
2.0% for cold-rolled and 0.3% for coated products, <strong>Severstal</strong><br />
shipments of hot-dipped galvanized grew by 30.6%, followed by<br />
18.9% growth of hot-rolled strip and plate, and 4.6% growth of<br />
cold-rolled sheet. Cold-rolled sheet and hot-dipped galvanized will<br />
realise more growth in the future as our capacity continues to<br />
ramp up.<br />
In 2012, the automotive market realised significant improvement,<br />
as did agriculture, while construction, both residential and<br />
non-residential, began to climb from the previously depressed<br />
levels. All major NAFTA steel-consuming markets realised some<br />
gain from 2011 to 2012.<br />
Customer growth in both Columbus and Dearborn was due to a<br />
combination of market growth and share gain. For Columbus, the<br />
energy market (pipe and tube), had the greatest impact, while<br />
growth in Dearborn came from increases in automotive.<br />
EBITDA drivers in 2012, US$m<br />
55 4<br />
181<br />
(75)<br />
94<br />
(8)<br />
(30)<br />
166<br />
(55)<br />
EBITDA<br />
2011<br />
Sales<br />
Volume<br />
Sales<br />
Mix<br />
Sales<br />
Price<br />
COS<br />
Price<br />
Operational<br />
Impact<br />
G&A Other EBITDA<br />
2012<br />
Key perfomance indicators 2012 2011 Change %<br />
Production of crude steel (thousand tonnes) 4,587 3,939 16.5%<br />
Sales of steel products (thousand tonnes) 4,465 3,810 17.2%<br />
Revenue (US$ million) 3,878.5 3,422.1 13.3%<br />
Gross profit (US$ million) 103.6 130.5 (20.6%)<br />
(Loss)/profit from operations (US$ million) (6.9) 61.5 n/a<br />
Operating margin (%) (0.2%) 1.8% n/a<br />
EBITDA (US$ million) 165.6 180.9 (8.5%)<br />
EBITDA per tonne (US$/tonne) 37.1 47.5 (21.9%)<br />
EBITDA margin (%) 4.3% 5.3% n/a<br />
Avarage steel product price (US$/tonne)* 843 862 (2.2%)<br />
Hot-rolled strip and plate (US$/tonne) 744 779 (4.5%)<br />
Cold-rolled sheet (US$/tonne) 900 881 2.2%<br />
Galvanized and other metallic coated sheet (US$/tonne) 988 995 (0.7%)<br />
* Steel products include semi-finished, rolled, and downstream product.<br />
Production volumes (thousand tonnes) 2012 2011 Change %<br />
Hot metal 1,850 1,729 7.0%<br />
Crude steel 4,587 3,939 16.5%<br />
<strong>Severstal</strong> Annual Report and accounts 2012
company Overview Strategy Performance Sustainability Governance Financial statements Additional information<br />
68<br />
<strong>Severstal</strong> International<br />
Sales by product<br />
Dearborn and Columbus’s main products are hot-rolled, cold-rolled<br />
and coated sheets.<br />
Sales by product, %<br />
2.9%<br />
Sales of hot-rolled strip and plate increased by 18.9% in volume<br />
and 13.5% in revenue. Sales of cold-rolled sheet increased by 4.6%<br />
in volume and 6.8% in revenue. Sales of galvanized and other<br />
metallic coated sheet increased by 19.7% in volume and 18.9% in<br />
revenue.<br />
37.4%<br />
47.1%<br />
Hot-rolled strip and plate - 47.1%<br />
Cold-rolled sheet - 12.6%<br />
Galvanized and other metallic<br />
coated sheet - 37.4%<br />
Other and shipping - 2.9%<br />
12.6%<br />
2012 2011 Change, %<br />
Sales by products Thousand tonnes US$ million Thousand tonnes US$ million Thousand tonnes US$ million<br />
Hot-rolled strip and plate 2,454 1,824.9 2,064 1,607.5 18.9% 13.5%<br />
Cold-rolled sheet 543 488.5 519 457.3 4.6% 6.8%<br />
Galvanized and other metallic coated sheet 1,467 1,450.0 1,226 1,219.9 19.7% 18.9%<br />
Total rolled products 4,464 3,763.4 3,809 3,284.7 17.2% 14.6%<br />
Total semi-finished products 1 0.5 1 0.5 - -<br />
Total steel products 4,465 3,763.9 3,810 3,285.2 17.2% 14.6%<br />
Other and shipping - 114.6 - 136.9 n/a (16.3%)<br />
Total 4,465 3,878.5 3,810 3,422.1 17.2% 13.3%<br />
Sales by market<br />
In 2012, US domestic sales amounted to US$3,774.3 million, and<br />
export sales amounted to US$104.2 million. About 97.3% of our<br />
revenue comes from domestic sales to US steel consumers. Export<br />
sales are made up of Columbus’s sales to Mexico.<br />
Sales by market, %<br />
Domestic<br />
Exports<br />
2.7%<br />
97.3%<br />
2012 2011 Change, %<br />
Domestic sales by products Thousand tonnes US$ million Thousand tonnes US$ million Thousand tonnes US$ million<br />
Hot-rolled strip and plate 2,381 1,770.7 2,017 1,572.0 18.0% 12.6%<br />
Cold-rolled sheet 522 470.2 507 446.4 3.0% 5.3%<br />
Galvanized and other metallic coated sheet 1,441 1,426.2 1,212 1,207.3 18.9% 18.1%<br />
Total rolled products 4,344 3,667.1 3,736 3,225.7 16.3% 13.7%<br />
Total semi-finished products 1 0.5 1 0.5 - -<br />
Total steel products 4,345 3,667.6 3,737 3,226.2 16.3% 13.7%<br />
Other and shipping - 106.7 - 136.0 n/a (21.5%)<br />
Total 4,345 3,774.3 3,737 3,362.2 16.3% 12.3%<br />
<strong>Severstal</strong> Annual Report and accounts 2012
company Overview Strategy Performance Sustainability Governance Financial statements Additional information<br />
69<br />
2012 2011 Change, %<br />
Export sales by products Thousand tonnes US$ million Thousand tonnes US$ million Thousand tonnes US$ million<br />
Hot-rolled strip and plate 73 54.2 47 35.5 55.3% 52.7%<br />
Cold-rolled sheet 21 18.3 12 10.9 75.0% 67.9%<br />
Galvanized and other metallic coated sheet 26 23.8 14 12.6 85.7% 88.9%<br />
Total rolled products 120 96.3 73 59.0 64.4% 63.2%<br />
Total semi-finished products - - - - - -<br />
Total steel products 120 96.3 73 59.0 64.4% 63.2%<br />
Other and shipping - 7.9 - 0.9 - -<br />
Total 120 104.2 73 59.9 64.4% 74.0%<br />
Costs<br />
Total cost of sales in 2012 amounted to US$3,774.9 million, which is 14.7% more than in 2011. This is due to increased volumes and the<br />
higher cost of raw materials.<br />
Plans for 2013<br />
As mentioned above, in 2013 <strong>Severstal</strong> International plans to focus on high value-added products, overall growth, and efficiency of its<br />
operations, while implementing Business Systems projects, reducing costs and maintaining high safety and quality standards.<br />
We are expecting strong growth in cold-rolled and hot-dipped galvanized products, and by 2016 expect them to account for 78% of our<br />
product mix. Electro-galvanized products will decline as a proportion of our product mix, due to our strategic decision to grow in the other<br />
higher margin products. The main trend to point out in our expected market share development in this period, is an increasing share in<br />
the automotive market, on the strength of shipments from Columbus.<br />
Now our investment programme is complete, our focus is on improvements from our Business System. We have identified measures that<br />
will bring US$44.5 million of potential improvements in 2013, and have already begun more than half of these.
company Overview Strategy Performance Sustainability Governance Financial statements Additional information<br />
70<br />
Page Title
company Overview Strategy Performance Sustainability Governance Financial statements Additional information<br />
71<br />
Sustainability<br />
What’s inside<br />
72 Our approach<br />
74 Health and Safety<br />
76 Environment<br />
78 Employees<br />
80 Social Commitment
company Overview Strategy Performance Sustainability Governance Financial statements Additional information<br />
72<br />
Our approach<br />
Our commitment to sustainability<br />
Steel is a highly useful and versatile material, and does not lose<br />
its useful characteristics. When no longer required, it is very easy<br />
to recycle. Making steel is much less energy intensive than other<br />
materials with similar characteristics and utility. In these<br />
respects, steel supports sustainable development.<br />
Across all our operations, we pursue new business opportunities<br />
that also bring economic and environmental benefits to our<br />
customers and other stakeholders. Wherever we operate, we<br />
significantly influence economic and social development.<br />
We can only achieve these long-term business outcomes in the<br />
context of social stability and partnership. Therefore our<br />
commitment to being a sustainable business means we are ever<br />
mindful of health and safety, environmental stewardship and<br />
social responsibility, and particularly ensuring the wellbeing of<br />
our host communities.<br />
For this reason, we have common health, safety and environment<br />
(HSE) policies across all assets belonging to the company, and<br />
these are overseen by the company’s Board of Directors.<br />
Our strategy for sustainability<br />
We aim to be a reliable partner for all our stakeholders, and to:<br />
• create value for shareholders<br />
• help realise the creative potential of employees<br />
• constantly strive to improve labour safety<br />
• comply with the requirements of law, and work with the state<br />
to achieve sustainable development<br />
• improve environmental performance, and use resources more<br />
efficiently<br />
• contribute to social and economic development in our areas of<br />
operation.<br />
How we manage sustainability<br />
We have a corporate social responsibility policy that defines our<br />
public commitments to safety, health, and environmental and<br />
social responsibility. We have adopted this across all of our<br />
operations. We report regularly and publicly, based on GRI<br />
guidelines.<br />
Working with stakeholders<br />
<strong>Severstal</strong> is an open organisation whose stability relies on efficient<br />
dialogue cooperation between many different partners. This<br />
honest, constructive collaboration is important to our development<br />
as a leader in international business, and as a contributor to<br />
sustainable social development. Such dialogue is also vital to<br />
identify early warning signs, needs and opportunities, and to help<br />
us implement our voluntary commitments and increase our<br />
effectiveness in sustainability.<br />
Our partners play an invaluable role as follows:<br />
Shareholders <strong>Severstal</strong>’s Board of Directors plays a key role in<br />
elaborating strategy in line with shareholder<br />
decisions. Members of the board visit our<br />
worldwide businesses regularly.<br />
Employees Employees are involved in resolving key issues of<br />
social development and industrial safety<br />
through a system of collective agreements with<br />
labour unions and healthcare committees.<br />
Business<br />
partners<br />
The State<br />
Society<br />
We build long-term strategic relationships with<br />
our suppliers and customers. Working with key<br />
customers, special committees, steering groups<br />
and advisory councils, we strive to satisfy<br />
customer demands effectively.<br />
We are strongly committed to our legal<br />
obligations as established by the state. We<br />
shape efficient partnerships with government<br />
authorities, to resolve regional development<br />
issues within the framework of social and<br />
economic partnership agreements and specialpurpose<br />
programmes.<br />
We participate in initiatives, launched by Russian<br />
and international business associations, focused<br />
on improving professional and ethical corporate<br />
standards.<br />
Non-profit We liaise with organisations to support projects<br />
organisations; in areas where we operate, relating to<br />
members of local environmental safety, healthcare development,<br />
communities culture and sports.<br />
Our long-term commitment to sustainability focuses on the<br />
following four areas:<br />
• Health and safety<br />
• Environment<br />
• Development of our people<br />
• Social commitment.
company Overview Strategy Performance Sustainability Governance Financial statements Additional information<br />
73
company Overview Strategy Performance Sustainability Governance Financial statements Additional information<br />
74<br />
Health and Safety<br />
Our position<br />
At <strong>Severstal</strong>, we believe leadership in the field of health and<br />
safety is key to our sustainable development and long-term<br />
success. In fact, improved safety is one of the company’s key<br />
performance indicators, crucial for the long-term competitiveness<br />
of the business.<br />
Our Health and Safety Policy, signed by our CEO, guides our<br />
safety activities throughout all the companies, enterprises and<br />
production processes that together comprise <strong>Severstal</strong>. The policy<br />
states six fundamental principles:<br />
• Safe working conditions are a priority.<br />
• Health and Safety management is a key component of the<br />
<strong>Severstal</strong> Business System.<br />
• Workplace hazards must be identified and all accidents<br />
reported.<br />
• Employees should behave safely and responsibly.<br />
• We comply with all health and safety regulations.<br />
• Health and safety information must be clear and<br />
straightforward.<br />
Our action<br />
We remain fully committed to running a safe and accident-free<br />
business. Our goal is to achieve zero injuries and zero fatalities.<br />
To achieve this, we run a continuous safety improvement<br />
programme across all our operations, aiming to employ the best<br />
international health and safety practices and become the<br />
leading Russian company in this field.<br />
This is the Labour Safety project, which we have developed as<br />
part of the <strong>Severstal</strong> Business System. The project aims to<br />
improve performance by involving all employees and reinforcing<br />
a culture of safety based on personal responsibility and<br />
recognition. The project is structured in three parts: providing<br />
safer working conditions, training, and engaging employees. An<br />
essential element of the Labour Safety project is a<br />
comprehensive audit and analysis, allowing us to monitor and<br />
compare standards and practices across the company, further<br />
helping us to improve health and safety performance.<br />
Unfortunately, accidents still happen. In February 2013, we<br />
suffered a major accident in the whole history of <strong>Severstal</strong>. There<br />
was an accident involving an explosion at the Vorkutinskaya<br />
mine in Russia that resulted in 19 fatalities and 3 casualties and<br />
suspension of mining at the shaft. A specially established<br />
governmental Commission is investigating the cause of the<br />
accident. We are providing full support to the Commission. On<br />
behalf of all management at <strong>Severstal</strong>, we express deepest<br />
condolences to the families and friends of the miners who<br />
tragically died in an accident at the Vorkutinskaya mine. The<br />
health and safety of all employees across <strong>Severstal</strong> will always be<br />
our key priority.<br />
In total, in 2012 we spent US$304.3 million on<br />
health and safety measures.<br />
In 2012, we improved our safety record with an<br />
8.4% decrease in our lost time injury frequency rate<br />
(LTIFR), compared to 2011. At <strong>Severstal</strong> Russian<br />
Steel, fifteen operations completed the year with<br />
zero injuries.<br />
In 2012, we completed the introduction of our<br />
Labour Safety project at all <strong>Severstal</strong> Russian Steel<br />
operations.<br />
Safety training is a crucial component of the Labour<br />
Safety project. We employ specialist safety trainers<br />
who train and develop line managers directly at<br />
production sites. In 2012, we trained around 1,500<br />
line managers at the <strong>Severstal</strong> Russian Steel and<br />
<strong>Severstal</strong> Resources divisions as part of the project.<br />
At <strong>Severstal</strong> International, the Labour Safety project<br />
started in eleven areas. As a result, our International<br />
operations demonstrated considerable<br />
improvement in LTIFR in 2012, which fell 32%<br />
compared to 2011.
company Overview Strategy Performance Sustainability Governance Financial statements Additional information<br />
75
company Overview Strategy Performance Sustainability Governance Financial statements Additional information<br />
76<br />
Environment<br />
Our position<br />
Our Environmental Policy, developed in 2011, commits us to<br />
maintaining high standards for environmental responsibility by:<br />
• preventing environmental contamination, and participating in<br />
reduction of greenhouse gas emissions<br />
• optimising energy use and natural resources<br />
• managing wastes efficiently<br />
We aim to comply strictly with all environmental laws which<br />
apply to us, and to develop and implement efficient<br />
management systems to follow best international practices.<br />
We support the development of a system for constructive<br />
cooperation between government, work collectives, business<br />
partners, experts and the public in tackling environmental issues.<br />
Our managers work in partnership with the RUIE Committee on<br />
Environmental, Industrial and Process Safety. We also work with<br />
the World Steel Association (Worldsteel) to conduct research into<br />
climate change and reducing impact to environment.<br />
Our action<br />
In 2012, our Russian assets assigned more than US$100 million<br />
toward environmental protection. This is two times as much as in<br />
2011. Responsibility towards the environment is at the forefront<br />
of our construction and modernisation projects, outlined below.<br />
We are also a member of the Sustainability and Environmental<br />
Committees of Worldsteel.<br />
Our Cherepovets Steel Mill was the first company in the Russian<br />
ferrous metallurgical industry to develop and implement an<br />
environmental management system that satisfies the ISO 14001<br />
international standard. In 2007, we successfully completed<br />
recertification under the new ISO 14001:2004. By the end of<br />
2012, our major operational assets in Russia, <strong>Severstal</strong>lat in<br />
Latvia, and the USA were ISO 14001 certified.<br />
<strong>Severstal</strong> Russian Steel:<br />
During 2012, we implemented around 70 significant<br />
environmental projects and initiatives across the <strong>Severstal</strong> Russian<br />
Steel division.<br />
Our 2012 environmental programme at Cherepovets Steel Mill<br />
included a wide range of large-scale activities – more than 15 in<br />
total – to repair gas purification, aspiration, and water treatment<br />
facilities. Of these, about half are aimed at minimising<br />
atmospheric emissions, and focused on reducing dust and<br />
hydrogen sulphide content in ambient air at Cherepovets. We<br />
await the first results of this decreasing of dust emission, in 2013.<br />
Between 2012 and 2016, investments in environmental projects<br />
aimed at reducing atmospheric emissions at the Cherepovets Steel<br />
Mill will total approximately US$183.3 million.<br />
There are three major projects under implementation at<br />
Cherepovets Steel Mill focused on reducing inorganic dust<br />
atmospheric emissions:<br />
• An installation for capturing harmful emissions from converters #1-3<br />
• Emissions reduction at EAF production<br />
• Emissions reduction at sinter production<br />
The result of these investment projects will be superior systems for<br />
cleaning waste gases in steel-making and sinter production:<br />
• In 2012, we proceeded with a large environmental project<br />
launched in 2011, for reducing atmosphere emissions from the<br />
converters #1-3. The project, with a total investment of over<br />
US$100 million, comprises construction of new bag filters,<br />
smoke exhausts, a compressor station, a package transformer<br />
and a distribution substation, an automated process control<br />
system, and a dust removal system.<br />
Expected emissions reduction<br />
from the converters #1-3,<br />
tonnes per annum<br />
5000<br />
4,636<br />
4000<br />
3000<br />
2000<br />
1000<br />
1,011<br />
Before<br />
After completion
company Overview Strategy Performance Sustainability Governance Financial statements Additional information<br />
77<br />
• Starting from the middle of 2012, another project to prevent<br />
dust emissions is underway at EAF #1 (electric arc furnace). By<br />
completely reconstructing the gas treatment facilities we hope<br />
to achieve the best available standards. Completion of this<br />
project is scheduled for 2014.<br />
Emissions reduction at EAF<br />
production, tonnes per annum<br />
5000<br />
4000<br />
3000<br />
2000<br />
1000<br />
3,808<br />
Before<br />
123<br />
After completion<br />
• By 2015, we will cut non-organic dust emissions across sintering<br />
production by 33%, by fully upgrading the aspiration system at<br />
one of operated units, with an investment of up to US$28.3<br />
million.<br />
Emissions reduction at sintering unit,<br />
tonnes per annum<br />
2500<br />
2000<br />
1500<br />
1000<br />
500<br />
1,679<br />
Before<br />
171<br />
After completion<br />
Another project launched this year at a cost of approximately<br />
US$11.3 million, will enable us to reduce silicon dioxide emissions<br />
by 284 tonnes annually, through reconstructing the gas-cleaning<br />
units of the dolomite rotary kiln.<br />
We have also set up production facilities to process coal tar from<br />
the Cherepovets coke production plant. These will supply premium<br />
quality chemical raw materials – pitch, naphthalene and technical<br />
oils – to the international market. The production facilities are run<br />
by Severtar, a joint venture with Rutgers, and will feature state-ofthe-art<br />
technology and comply with international environmental<br />
standards.<br />
We are also working with the Moscow Institute of Steel and Alloys<br />
to reduce hydrogen sulphide emissions. We are taking 2,000<br />
measurements in 180 tests to identify the principal emission<br />
sources. We have made several improvements in our technological<br />
approach, allowing a decrease in hydrogen sulphide levels in the<br />
ambient air. The aim is to hit emissions targets by the end of 2015.<br />
In 2012, we allocated US$20 million toward water-protection<br />
measures. By 2013, we will have achieved a reduction of 200,000<br />
cubic metres in the wastewater we discharge into bodies of water,<br />
by closing two of our five effluent outlets. This snow run-off and<br />
storm water from industrial areas will be channelled to the<br />
wastewater treatment station, to be fed into the closed-loop water<br />
circulation system, reducing the use of river water to replenish<br />
recirculation cycles.<br />
Since our energy-saving programme started in 2000, we have<br />
reduced steelmaking energy consumption by 20%, down to 5.620<br />
Gcal per metric tonne in 2011. The overall reduction is made<br />
possible by upgrading equipment, modernising systems, and using<br />
new energy-saving technology, to save fuel, oxygen and electrical<br />
power.<br />
Izhora Pipe Mill<br />
An investment of around US$2.5 million improved wastewater<br />
treatment facilities at the Izhora Pipe Mill. Lubricating fluids, key<br />
elements in metalworking processes, are removed, and the plant<br />
now recycles clean water, considerably reducing the negative<br />
impact on municipal waste treatment facilities and the<br />
environment.<br />
Dneprometiz<br />
Dneprometiz, a Ukrainian company of <strong>Severstal</strong> Metiz, launched a<br />
new section for non-acid removal of dross from the surface of wire<br />
products, thus creating healthier working conditions for the<br />
employees.<br />
Dearborn<br />
In North America, in September, we hosted a tour of the facilities<br />
for distinguished environmental groups, to demonstrate the<br />
significant environmental advances we have made in pollution<br />
prevention, air, water and energy control, and recycling.<br />
<strong>Severstal</strong> Resources:<br />
Karelsky Okatysh<br />
Karelsky Okatysh is undertaking air protection initiatives to cut its<br />
gross harmful emissions by 23% by 2016, including a 12 thousand<br />
tonnes reduction in sulphur dioxide emission annually.<br />
Vorkutaugol<br />
At Vorkutaugol, this year we are completing the construction of<br />
two (11.6 MW and 5.8 MW, respectively) gas-fired reciprocating<br />
engines at Severnaya deep coal mine. When commissioned, the<br />
reciprocating engines will utilise around 28 million м3 coal mine<br />
methane to generate heat and power for the mine, which will<br />
result in the annual reduction of greenhouse gas emissions by<br />
470,000 tonnes of CO2 equivalent. Following a cost benefit<br />
analysis of the Severnaya methane project, we may initiate similar<br />
projects at other Vorkutaugol coal mines.<br />
In early 2012, <strong>Severstal</strong> received an Environmentally Responsible<br />
Business award as recognition of our environmental protection<br />
efforts, which were considered the best among all corporate<br />
members of the Russian Union of Industrialists and Entrepreneurs.<br />
<strong>Severstal</strong> Annual Report and accounts 2012
company Overview Strategy Performance Sustainability Governance Financial statements Additional information<br />
78<br />
Employees<br />
Our position<br />
People with the appropriate skills and motivation are crucial to<br />
the long-term, sustainable development of our business.<br />
Therefore we strive to create suitable conditions for our<br />
employees to realise their potential, and aim to shape a<br />
corporate culture based on professionalism, initiative and<br />
responsibility.<br />
Our action<br />
We have many ongoing schemes for employee development and<br />
training, from induction programmes through to senior<br />
professional development, and our progress is described below.<br />
Areas of activity in the social sphere include employee<br />
rehabilitation, support for mothers and children, catering and<br />
recreation for workers, social support for retirees and veterans,<br />
incentives for employee improvement, and many other kinds of<br />
benefits and insurance.<br />
In 2012, our average headcount totalled 67,297 employees,<br />
distributed among our divisions as follows:<br />
In 2012, more than 8,500 managers of top six<br />
levels participated in the annual appraisal process<br />
with the Target dialogue, 360 degrees feedback and<br />
HR Committees aimed at identifying and<br />
developing talent. Five percent of the headcount<br />
constitutes the Talent Pool of the organisation; the<br />
majority of the positions in the company are<br />
recruited internally.<br />
We benchmark our management approaches and<br />
metrics both globally and locally, to help us<br />
continually investigate and implement the best<br />
practices in this area.<br />
<strong>Severstal</strong><br />
Resources<br />
17,559<br />
<strong>Severstal</strong><br />
International<br />
2,165<br />
<strong>Severstal</strong><br />
Russian Steel<br />
47,573
company Overview Strategy Performance Sustainability Governance Financial statements Additional information<br />
79<br />
Training and professional development<br />
In 2012, 43% of employees passed through training courses, and<br />
100% for the top three management levels. Average training time<br />
was about 54 hours per employee across the three divisions.<br />
We continued our management development programme Achieve<br />
More Together. By the end of the year the programme had around<br />
900 graduates, and more than 450 new participants had started<br />
the programme. It aims to support change at <strong>Severstal</strong>, by building<br />
a team of associates capable of initiating change and achieving<br />
outstanding results.<br />
Graduate employment<br />
Another key area of human resources development at <strong>Severstal</strong> is<br />
the employment and retention of graduates. Our Young Resources<br />
programme includes a range of initiatives focused on developing<br />
young people’s interest in the steel and mining industries. We work<br />
closely with a number of secondary schools and institutions of<br />
higher education. On the back of the Young Resources programme,<br />
we are building a continuous system of education, professional<br />
development and motivation for young professionals. The<br />
programme offers specialised classes at secondary schools,<br />
student scholarships, collaboration with universities such as<br />
internships and graduate recruitment, and new employee support.<br />
The new concept of attracting, inducting and training university<br />
graduates in <strong>Severstal</strong> Russian Steel Division started and was<br />
communicated in 2012 to support our Employer Brand, and<br />
improve retention and motivation of young specialists.<br />
Remuneration<br />
Employee remuneration comprises regular pay and social benefits,<br />
including a company pension plan, health insurance, life insurance<br />
and others. Our corporate pension programme has been in place<br />
at all of our Russian operations, in partnership with the nongovernmental<br />
retirement fund StalFond, since 2003. We are<br />
establishing similar practices at other divisions.<br />
Equal rights, diversity and ethical behaviour<br />
<strong>Severstal</strong> is committed to fair employment practices, and treats all<br />
employees with dignity and respect. All decisions affecting<br />
employment and career development are made on merit. The<br />
fundamental assessment criteria are work performance,<br />
qualifications, competence, abilities, skills, knowledge and relevant<br />
job experience. In addition, <strong>Severstal</strong> is an equal opportunities<br />
employer and is committed to the equal treatment of both men<br />
and women in the workforce. At present, women account for<br />
around 32% of our headcount, which is a large proportion for a<br />
steel and mining company.<br />
Medical programmes<br />
The <strong>Severstal</strong> Health programme was implemented at Cherepovets<br />
in 2002. Each year we spend about US$20 million on the<br />
programme.<br />
The main objectives are to:<br />
• improve the availability and quality of medical care<br />
• strengthen the first line of healthcare<br />
• create conditions for efficient medical care at the pre-hospital stage<br />
• prevent disease<br />
• provide high-tech, state-of-the-art medical care<br />
<strong>Severstal</strong>’s medical unit has 51 attendance stations operating on<br />
site. The programme has created an efficient system for<br />
maintaining employee health based on regular medical screening.<br />
Last year in Cherepovets we conducted over 34,000 professional<br />
medical check-ups. More than 9,000 employees and their children<br />
receive preventative procedures in health resorts and camps, and<br />
around 5,000 employees undergo rehabilitation at the health<br />
complex, Rodnik.<br />
Housing programmes<br />
<strong>Severstal</strong> strives to help its employees secure adequate<br />
accommodation. In Cherepovets from 2005 to 2010, we built 26<br />
apartment blocks to house 2,345 families. In April 2012, we<br />
launched a second phase of the housing programme, through<br />
which a 400-apartment building will be ready in late 2013. In June<br />
2012, we built a third apartment building, in the village of Telman,<br />
with 117 apartments for our employees in the St. Petersburg<br />
region.
company Overview Strategy Performance Sustainability Governance Financial statements Additional information<br />
80<br />
Social commitment<br />
Our position<br />
<strong>Severstal</strong> continues to play a crucial role in supporting the<br />
development of the communities and regions we operate in. We<br />
aim to make a long-term positive impact in key areas, such as<br />
access to education and quality of education, youth policy,<br />
cultural preservation and sports. Developing and enriching the<br />
communities around us improves the sustainability of our<br />
business.<br />
Our action<br />
<strong>Severstal</strong>’s cooperation with regions in the social sphere is based<br />
on strategic programmes in such areas as employment,<br />
occupational guidance and healthcare, and support for<br />
disadvantaged people. Our main commitments are in the form of<br />
agreements we enter into with regional authorities. We also<br />
provide charitable support to programmes that help children,<br />
preserve and support culture, and develop sports. We regard<br />
these programmes as an investment in the spiritual and physical<br />
development of the younger generation.<br />
In 2012, we continued to support social projects in<br />
priority areas such as children’s programmes,<br />
education, culture and sports. We spent over US$79<br />
million on various social and community projects.<br />
We are committed to high-quality management of<br />
social programmes and support development of<br />
innovative approaches and technologies in this<br />
area. In 2012, <strong>Severstal</strong> founded the named<br />
professorship in the European University in St.<br />
Petersburg for developing educational and research<br />
programmes in the areas of Corporate Social<br />
Responsibility and Sustainable Development.<br />
We won various awards in 2012 for our social<br />
activities, including the competition Leaders of<br />
Corporate Charity 2012» (PWC, publishing House<br />
Vedomosti, Donors Forum). Our Road Home<br />
programme is a winner of the Regional stage of the<br />
All-Russian Competition of the best socially focused<br />
projects of non-profit organizations “Assistance —<br />
2012” (Agency of the strategic initiatives).
company Overview Strategy Performance Sustainability Governance Financial statements Additional information<br />
81<br />
Community<br />
<strong>Severstal</strong> maintains productive cooperation with local<br />
administrations and the general public on acute social, economic<br />
and environmental challenges, and works with nationwide and<br />
regional non-profit organisations and professional associations.<br />
This cooperation helps to foster favourable social conditions in the<br />
regions where our businesses are located.<br />
We support universities and colleges, cultural and sports<br />
organisations, and provide financial help to war veterans and<br />
people with disabilities. We use competitive selection tools to<br />
qualify projects and expand our collaboration with professional<br />
associations and non-profit organisations. We design tools for<br />
multifaceted cooperation focused on addressing specific social<br />
issues and on developing the inherent potential of the regions.<br />
The Agency for Urban Development, our non-profit joint venture<br />
with the City of Cherepovets, focused on developing small and<br />
medium businesses, brought tangible results. In 2012 in<br />
Cherepovets, 192 new enterprises (mostly in service, trade,<br />
production and building), and 1,860 new jobs were created by this<br />
programme, and 701 work places were retained.<br />
In 2012, the Agency for Urban Development received Osnova<br />
Rosta Award for support of small and medium entrepreneurship in<br />
the Contribution to Development of Regional Entrepreneurship<br />
nomination. Osnova Rosta Award is a joint project of the Ministry<br />
of Economic Development, RSPP and Russian Chamber of<br />
Commerce and Industry.<br />
Vorkutaugol spent more than 20 million roubles on supporting<br />
important public facilities in Komi Republic in 2012. The majority<br />
of this money was allocated to important facilities through our<br />
agreement with the city. According to the agreement, we<br />
supported the most important components of public infrastructure<br />
including education, healthcare, culture, sports and landscaping in<br />
Vorkuta. We provided financial help to public educational and<br />
healthcare institutions, and youth sports schools.<br />
Karelsky Okatysh annually finances the upkeep of the cultural and<br />
sports centre Druzhba, with more than 90,000 people attending<br />
various events. It also provides financial support for children’s<br />
educational institutions, sport clubs and schools, organisations for<br />
disabled people and veterans.<br />
Olkon supports various festivals, sports and cultural events, which<br />
attract a considerable part of the Olenegorsk population.<br />
Children and the future<br />
Child neglect is one of the most acute social problems in Russia.<br />
The number of orphans in the country continues to grow and is<br />
now nearing 740,000, 3% of the total child population. In 2006,<br />
<strong>Severstal</strong> initiated the unique Road Home programme, which<br />
focuses on the comprehensive prevention of child neglect and<br />
social orphanhood in Cherepovets.<br />
In 2012, we continued the programme in Vorkuta, Kostomuksha,<br />
Balakovo and Veliky Ustyug. To support its launch in these cities, we<br />
opened a resources and training centre for 95 social development<br />
NGOs and 25 governmental organization to support NGO-related<br />
social work in those cities. We started a new project Children of<br />
Krasavino, which focuses on decreasing social tension in the region.<br />
We launched a programme of corporate volunteerism in 2012.<br />
Culture and the arts<br />
<strong>Severstal</strong> has worked successfully on a number of rewarding<br />
collaborations with Russia’s leading museums and theatres.<br />
In 2012 we continued our partnership with the Bolshoi Theatre<br />
(Moscow), Russian Museum (St. Petersburg), State Tretyakov<br />
Gallery (Moscow), State Historical Museum (Moscow), Cherepovets<br />
Museum Association (Cherepovets), Kirillo-Belozersky Museum-<br />
Preserve (Kirillov), Museum of Dionisy Frescoes (Ferapontovo,<br />
Kirillovsky District), Vologda Museum and Reserve (Vologda,<br />
Semenkovo), Radishchev Arts Museum (Saratov), Balakovo Art<br />
Gallery (Balakovo).<br />
<strong>Severstal</strong> sponsored the Embroidered Trimmings exhibition in the<br />
Russian Museum, supported the Children’s art studio, and a project<br />
on technical equipment for exhibition halls in Tretyakov Gallery.<br />
In 2012, supported by <strong>Severstal</strong>, Art That I Live With, an exhibition<br />
of Russian artworks from Mikhail Baryshnikov’s collection opened<br />
at the ABA Gallery, New York. This is the first time that so many<br />
works from the legendary dancer’s collection have been exhibited<br />
to the public.<br />
<strong>Severstal</strong> traditionally supports the Golden Mask Theatre Festival<br />
in Moscow, Riga and Cherepovets, and VOICES International Film<br />
Festival in Vologda and Cherepovets. This festival is quickly<br />
becoming an important forum for young independent European<br />
filmmakers and contributes to development of European culture.<br />
<strong>Severstal</strong> continues to partner with Sergey Andriyaka’s Watercolour<br />
School. We helped to arrange a series of painting master classes<br />
and exhibitions in Vologda and Volgograd.<br />
In 2012 we continued to work with the Museums of Russian North<br />
grants programme, focused on reviving the regional arts museums.<br />
We organised the third grants contest among the museums of<br />
North-Western Russia as a part of this programme (the first grants<br />
contest took place in 2007). Five museums from Vologda region,<br />
Komi Republic and Republic of Karelia won the 2012 contest.<br />
In 2012, <strong>Severstal</strong> supported several important musical events in<br />
Kostomuksha, such as the Kanteletar International Folklore<br />
Festival, the International Festival of Chamber Art, the Sergey<br />
Ozhigov Art Song Festival and the Nord Session International Rock<br />
Festival. With our support, Kostomuksha became a cultural centre<br />
in north-west Russia.<br />
Sports<br />
<strong>Severstal</strong> promotes a healthy lifestyle among its employees and<br />
their families by supporting the development of sport. <strong>Severstal</strong><br />
invests in sports at the top competitive level: we believe that<br />
training the reserve for national teams is a great way to promote<br />
healthy lifestyle, to support psychological, social and spiritual<br />
welfare of youth, and to build the prestige of our company. We<br />
organise regional sports and public events for employees and local<br />
communities, and finance a number of leading sports teams.<br />
<strong>Severstal</strong> supports <strong>Severstal</strong> Hockey Club sponsored by<br />
Cherepovets Steel Mill. <strong>Severstal</strong> Sports Club is focused on training<br />
athletes at the top competitive level and organising their<br />
participation in nationwide and international events. <strong>Severstal</strong><br />
Sports Club trained 33 international masters and 330 national<br />
masters.<br />
We also sponsor the Dynamo women’s volleyball club.<br />
<strong>Severstal</strong> Annual Report and accounts 2012
company Overview Strategy Performance Sustainability Governance Financial statements Additional information<br />
82<br />
Page Title
company Overview Strategy Performance Sustainability Governance Financial statements Additional information<br />
83<br />
Governance<br />
What’s inside<br />
84 Board composition<br />
94 Corporate governance statement<br />
108 Risk report
company Overview Strategy Performance Sustainability Governance Financial statements Additional information<br />
84<br />
Board composition<br />
Christopher<br />
Clark<br />
Role: Chairman of the Board of Directors, Independent Non-<br />
Executive Director, Member of the Board Nomination and<br />
Remuneration Committee<br />
Appointment: since December, 2006<br />
Experience: Born in 1942, Chris Clark is a leading industrialist and<br />
senior executive, bringing extensive business knowledge to the<br />
Board. Chris’s career spanned 42 years at Johnson Matthey plc, the<br />
specialty chemicals and precious metals group, where he became<br />
CEO in 1998. He led the Group into the FTSE 100 in 2002. Since his<br />
retirement in 2004 from executive management roles, Chris has<br />
taken a number of non-executive positions. He has previously<br />
chaired: Associated British Ports, the UK’s leading ports group;<br />
Urenco Limited, the leading international supplier of enriched<br />
uranium to the power generating industry; and Wagon plc, the<br />
European manufacturer of metal components for the automobile<br />
industry.<br />
External appointments: Chairman of RusPetro plc, an<br />
independent oil and gas producer conducting oil exploration and<br />
production activities in the Krasnoleninsk field in Western Siberia,<br />
one of the largest oil producing regions in Russia.<br />
Education: Chris is a graduate in metallurgy. He studied at Trinity<br />
College, Cambridge and Brunel University, London.<br />
<strong>Severstal</strong> Annual Report and accounts 2012
company Overview Strategy Performance Sustainability Governance Financial statements Additional information<br />
85<br />
Alexey<br />
Mordashov<br />
Role: CEO, OAO <strong>Severstal</strong>, Member of the Board Nomination and<br />
Remuneration Committee<br />
Appointment: since September, 1994 (with <strong>Severstal</strong> Group since<br />
1988)<br />
Experience: Born in 1965, Alexey Mordashov has worked for<br />
<strong>Severstal</strong> since 1988. He started his career as a senior shop<br />
economist, becoming Chief Financial Officer in 1992. In December<br />
1996, he was appointed as <strong>Severstal</strong>’s Chief Executive Officer. In<br />
June 2002, Mr. Mordashov was elected Chairman of <strong>Severstal</strong>’s<br />
Board of Directors. Since 2002 he has served as Chief Executive<br />
Officer of <strong>Severstal</strong> Group and since December 2006 he has been<br />
the Chief Executive Officer of <strong>Severstal</strong>.<br />
External appointments: Member of the Supervisory Board of<br />
Non-Profit Partnership Russian Steel (since June 2010). Chairman<br />
of World Steel Association (since October 2012), which is<br />
headquartered in Brussels, Belgium. Head of the Russian Union of<br />
Industrialists and Entrepreneurs’ (RSPP) Committee on Integration,<br />
Trade and Customs Policy and WTO. Chairman of The Trade<br />
Taskforce of the Business 20 within the year of Russia’s<br />
chairmanship in Group of Twenty (G20) which has commenced on<br />
1 December 2012. Serves on the Entrepreneurs Council of the<br />
Government of Russian Federation. A member of the Russian-<br />
German workgroup responsible for strategic economic and finance<br />
issues. Since March 2006 – a member of the EU-Russia Business<br />
Cooperation Council. Member of the Atlantic Council President’s<br />
International Advisory Board. Chairman of the Board of OAO<br />
Power Machines. Member of the Board of Nordgold N.V. Chairman<br />
of the Board of ZAO SVEZA.<br />
Education: Alexey earned his undergraduate degree from the<br />
Leningrad Institute of Engineering and Economics. He also holds<br />
an MBA degree from Newcastle Business School of Northumbria<br />
University (Newcastle UK). Alexey was granted an honorary<br />
doctorate from the Saint-Petersburg State University of<br />
Engineering and Economics in 2001 and from the University of<br />
Northumbria in 2003.
company Overview Strategy Performance Sustainability Governance Financial statements Additional information<br />
86<br />
Board composition<br />
Alexander<br />
Grubman<br />
Role: CEO, <strong>Severstal</strong> Russian Steel Division<br />
Appointment: since June, 2011 (with <strong>Severstal</strong> Group since 2006)<br />
Experience: Born in 1962. Alexander joined <strong>Severstal</strong> in 2006 as<br />
Operations Director of <strong>Severstal</strong> Resources, becoming Chief<br />
Operating Officer later that year. In June 2009 Alexander became<br />
Chief Executive Officer of <strong>Severstal</strong> Resources. In September 2010,<br />
he was appointed Chief Executive Officer of <strong>Severstal</strong>’s Russian<br />
Steel Division. Prior to joining <strong>Severstal</strong>, Alexander held leading<br />
management positions at Coca-Cola Company, Sun Interbrew and<br />
Unimilk.<br />
External appointments: Member of the Board of Iron Mineral<br />
Beneficiation Services (Pty) Ltd.<br />
Education: Alexander graduated from Moscow Technological<br />
Institute of Food Industries as a mechanical engineer.<br />
<strong>Severstal</strong> Annual Report and accounts 2012
company Overview Strategy Performance Sustainability Governance Financial statements Additional information<br />
87<br />
Sergei<br />
Kuznetsov<br />
Role: CEO, <strong>Severstal</strong> International Division, CEO, <strong>Severstal</strong> North<br />
America<br />
Appointment: since June, 2009 (with <strong>Severstal</strong> Group since 2002)<br />
Experience: Born in 1971. Sergei Kuznetsov started his career in<br />
1994 as an expert in trade operations for steel and steel products<br />
at the state-owned Foreign Trade Association, Promsyrioimport<br />
(Industrial Materials Import/Export). In 1995-2001 he worked as a<br />
commercial representative in the Steel Trading section of the<br />
Moscow Representative Office of Cargill Enterprises, Inc. He joined<br />
<strong>Severstal</strong> in 2002 to head the Business Planning Group responsible<br />
for acquisitions of foreign assets and development of international<br />
projects. In 2004 he was appointed as Chief Financial Officer of<br />
<strong>Severstal</strong> North America. In 2008 he became Chief Financial<br />
Officer of OAO <strong>Severstal</strong>. In July 2009 Sergei became CEO of<br />
<strong>Severstal</strong> International and CEO of <strong>Severstal</strong> North America.<br />
External appointments: CEO and Member of the Board of<br />
<strong>Severstal</strong> Investments LLC and <strong>Severstal</strong> Dearborn LLC. Member of<br />
the Board of <strong>Severstal</strong> US Holdings LLC, <strong>Severstal</strong> Columbus<br />
Holding, LLC and <strong>Severstal</strong> US Holdings II LLC. Treasurer in<br />
Charnwood 1, LLC.<br />
Education: Sergei graduated from Bauman Moscow State<br />
Technical University in 1994, where he majored in Engineering. In<br />
1998 he received his Finance MBA from California State University,<br />
Hayward.
company Overview Strategy Performance Sustainability Governance Financial statements Additional information<br />
88<br />
Board composition<br />
Alexey<br />
Kulichenko<br />
Role: CFO, OAO <strong>Severstal</strong><br />
Appointment: since October, 2009 (with <strong>Severstal</strong><br />
Group since 2005)<br />
Experience: Born in 1974. In 1996-2003 he worked for<br />
Sun Interbrew, starting his career as cash flow<br />
economist of Omsk plant, Rosar, and ending as<br />
Efficiency Planning and Managing Director of Sun<br />
Interbrew. From 2003 to 2005 Alexey worked as CFO at<br />
Unimilk – the second largest milk producer in Russia,<br />
which owned 20 plants in Russia and Ukraine. From<br />
December 2005 to July 2009 he worked as CFO of CJSC<br />
<strong>Severstal</strong> Resource. From 2006 till 2010 Alexey was a<br />
member of the Board of directors of JSC Vorkutaugol. In<br />
July 2009 he was appointed CFO of OAO <strong>Severstal</strong>.<br />
External appointments: none.<br />
Education: Alexey graduated from the Omsk Institute of<br />
World Economy with a degree in economics.<br />
<strong>Severstal</strong> Annual Report and accounts 2012
company Overview Strategy Performance Sustainability Governance Financial statements Additional information<br />
89<br />
Mikhail<br />
Noskov<br />
Role: Non-Executive Director<br />
Appointment: since April, 1998 (with <strong>Severstal</strong><br />
Group since 1997)<br />
Experience: Born in 1963. Mikhail worked at the<br />
International Moscow Bank between 1989 and<br />
1993. From 1994, he was Trade Finance Director of<br />
Credit Suisse (Moscow). He has worked for <strong>Severstal</strong><br />
since February 1997 as Head of Corporate Finance<br />
and from 1998 as Finance and Economics Director.<br />
In June 2002, he was made Deputy CEO for Finance<br />
and Economics of the <strong>Severstal</strong> Group, from 2007 to<br />
2008 he was Deputy CEO for Finance and Economics<br />
of <strong>Severstal</strong>.<br />
External appointments: Deputy CFO of ZAO<br />
Severgroup. Chairman of the Board of Non-<br />
Governmental Pension Fund, StalFond. Member of<br />
the Board in such companies as Nordgold N.V., ОАО<br />
AB Russia, OAO Mostotrest, ZAO SVEZA, ZAO<br />
National media group, ZAO GK Video International,<br />
ZAO ABR Management, TUI Aktiengesellschaft,<br />
Non-Governmental Pension Fund, Gazfond.<br />
Education: Mikhail graduated from the Moscow<br />
Institute of Finance.
company Overview Strategy Performance Sustainability Governance Financial statements Additional information<br />
90<br />
Board composition<br />
Rolf<br />
Stomberg<br />
Role: Senior Independent Director, Chairman of the Board<br />
Nomination and Remuneration Committee<br />
Appointment: since December, 2006<br />
Experience: Born in 1940. After his executive career of nearly<br />
30 years with BP (British Petroleum Co plc), where he last held<br />
the position of CEO of BP’s downstream business and<br />
Managing Director on the main board of the company, he<br />
held a number of directorships in internationally operating<br />
companies in Europe, such as Smith and Nephew plc, Reed<br />
Elsevier Group, TNT NV, Scania AB, John Mowlem plc and<br />
Management Consulting Group plc, as well as on the boards<br />
of family owned companies.<br />
External appointments: Chairman of the Supervisory Board<br />
of LANXESS AG, Cologne, a global chemical company. Senior<br />
Independent Director and Chairman of the Remuneration<br />
Committee of RusPetro plc, London. Vice-Chairman of the<br />
Advisory Board of HOYER GmbH, Hamburg. Deputy Chairman<br />
of the Supervisory Board of Biesterfeld AG, Hamburg.<br />
Member of the Advisory Board of KEMNA Bau Andrea GmbH<br />
+ Co. KG, Pinneberg.<br />
Education: Rolf is an economics graduate holding a<br />
Doctorate of Hamburg University, where he also served as a<br />
lecturer. He was Honorary professor at the business school of<br />
Imperial College, London, and the Institut Francais de Petrol,<br />
Paris.<br />
<strong>Severstal</strong> Annual Report and accounts 2012
company Overview Strategy Performance Sustainability Governance Financial statements Additional information<br />
91<br />
Martin<br />
Angle<br />
Role: Independent Non-Executive Director, Chairman of the Board<br />
Audit Committee<br />
Appointment: since December, 2006<br />
Experience: Born in 1950. During his career, Martin has held senior<br />
executive positions in investment banking, industry and more recently<br />
private equity, where he was an Operational Managing Director of<br />
Terra Firma Capital Partners holding various senior Board positions in<br />
its portfolio companies. Prior to that, Martin was for a number of years<br />
the Group Finance Director of TI Group plc, a specialised engineering<br />
company in the UK FTSE 100 with activities in over 50 countries.<br />
Before that, he spent 20 years in investment banking, where he held a<br />
number of senior positions with SG Warburg & Co Ltd, Morgan Stanley<br />
and Dresdner Kleinwort Benson.<br />
External appointments: Non-executive Chairman of the National<br />
Exhibition Centre Group Ltd. Senior Independent Director and<br />
Chairman of the Audit Committee of Savills plc. Non-Executive<br />
Director and Chairman of the Remuneration Committee of Pennon<br />
Group plc. Non-Executive Director and Chairman of the Audit<br />
Committee of Shuaa Capital psc. Vice Chairman and Chairman of the<br />
Investment Committee of the FIA Foundation.<br />
Education: Martin is a graduate in physics, a Chartered Accountant, a<br />
Member of the Chartered Securities Institute and a Fellow of the Royal<br />
Society of Arts.
company Overview Strategy Performance Sustainability Governance Financial statements Additional information<br />
92<br />
Board composition<br />
Ronald<br />
Freeman<br />
Role: Independent Non-Executive Director, Member of<br />
the Board Audit Committee<br />
Appointment: since December, 2006<br />
Experience: Born in 1939. Between 1991 and 1997,<br />
Ronald was Head of the Banking Department of the<br />
European Bank for Reconstruction and Development<br />
(EBRD). He was responsible for debt and equity financing<br />
in the private sector in 23 countries of the former Soviet<br />
Union, with a total annual funds commitment of Euro 2<br />
billion. Prior to that, Ronald was vice-chairman of<br />
Citigroup European investment banking and a general<br />
partner of Salomon Brothers. Ronald held a number of<br />
directorships in such companies as Troika Dialog, KAMAZ<br />
Inc, Polish Telecom etc.<br />
External appointments: Non-Executive Member of the<br />
Board of Directors of Volga Gas. Member of the Executive<br />
Committee of the Atlantic Council. Member of the<br />
International Advisory Committee of Columbia Law<br />
School. Chairman of the Executive Committee of the<br />
Pilgrims Society (UK). Non-Executive Member of the<br />
Supervisory Board and Member of the Strategic Planning<br />
Committee of OAO Sberbank of Russia.<br />
Education: Ronald holds a BA degree from Lehigh<br />
University and an LLB from the Law School of Columbia<br />
University. He was admitted to the New York Bar.<br />
<strong>Severstal</strong> Annual Report and accounts 2012
company Overview Strategy Performance Sustainability Governance Financial statements Additional information<br />
93<br />
Peter<br />
Kraljic<br />
Role: Independent Non-Executive Director, Member of the Board<br />
Audit Committee<br />
Appointment: since December, 2006<br />
Experience: Born in 1939. Peter Kraljic is a Director Emeritus at<br />
McKinsey, where he spent 32 years and held a number of senior<br />
positions until his retirement in 2002. Focused mainly on industrial<br />
clients in the chemicals, pharmaceuticals, automotive assembly and<br />
steel and aluminium sectors, he was also a member of McKinsey’s<br />
Shareholders and Personnel Development Committee and has<br />
managed the company’s activities in France as a General Director.<br />
Peter has also written a number of scientific and business articles<br />
for publications such as the Harvard Business Review and Le Figaro<br />
Economic. He has also led special projects aimed at economic<br />
growth and job creation in Germany and Brazil. Peter was a<br />
member of the advisory board of several companies including<br />
Wolfsburg AG, GEMPLUS, Lek d.d., Gorenje and SID.<br />
External appointments: Member of the Advisory Board of Business<br />
School Bled.<br />
Education: Peter graduated from the University of Ljubljana,<br />
Slovenia (Faculty of Metallurgy) and holds a PhD degree from<br />
Polytechnic University in Hannover, Germany. He also holds a<br />
Masters degree in business management from the INSEAD<br />
business school, France.
company Overview Strategy Performance Sustainability Governance Financial statements Additional information<br />
94<br />
Corporate governance statement<br />
<strong>Severstal</strong> identified corporate governance excellence<br />
as a crucial element in helping the company position<br />
itself as a new breed of Russian business that is able<br />
to engage with stakeholders globally. We<br />
demonstrate our commitment to the highest<br />
standards of corporate governance by implementing<br />
the world’s best practices of corporate relations in our<br />
dealings with shareholders and with respect to<br />
transparency and quality of disclosure and reporting.<br />
<strong>Severstal</strong>’s corporate governance system underwent major<br />
changes in preparation for the company’s London listing at the<br />
end of 2006. Looking forward, <strong>Severstal</strong> is determined to continue<br />
to develop and evolve in its corporate governance practices, thus<br />
continuing the process it began in 2006.<br />
What are the governance initiatives we have implemented at<br />
<strong>Severstal</strong>?<br />
We have continued to build on the corporate governance<br />
initiatives instigated in 2006 in <strong>Severstal</strong>’s everyday operations.<br />
Our corporate governance evolution is strengthened by the<br />
processes and controlled procedures that we have put in place:<br />
These are as follows:<br />
1. separate Chairman and CEO,<br />
2. Chairman meeting independence criterion at appointment,<br />
3. independent non-executive senior independent director,<br />
4. Board consists of ten members – 50% of the board are<br />
independent non-executives in accordance with the Russian and<br />
UK Corporate Governance Code,<br />
5. audit committee consisting of three members, all of whom are<br />
independent non-executives,<br />
6. remuneration and nomination committee chaired by<br />
independent non-executive senior independent director,<br />
7. introduction of company Corporate Governance Code,<br />
8. adoption of the company’s new charter and Regulations on<br />
Board Committees,<br />
9. instigation of insider dealing regulations.<br />
The following initiatives further complement the above processes:<br />
1. quarterly statements of Internal Audit and Risk Management to<br />
the Audit Committee prepared on the basis of International<br />
Financial Reporting Standards,<br />
2. new policy of information transparency (<strong>Severstal</strong> complies with<br />
the applicable laws of the Russian Federation and international<br />
corporate governance standards and ensures a high level of<br />
interaction between all company shareholders, the Board of<br />
Directors and management),<br />
3. participation of auditor in all the meetings of Audit committee,<br />
separate meetings between auditor and Audit committee<br />
members and its chairman,<br />
4. separate regular meeting between independent directors and<br />
with company CEO,<br />
<strong>Severstal</strong> Annual Report and accounts 2012<br />
5. formal annual evaluation of board’s performance at both<br />
external and internal levels,<br />
6. non-scheduled site visits from Chairman and Board members.<br />
What corporate governance code do we observe?<br />
Since the formation of its corporate governance standards,<br />
<strong>Severstal</strong> continues to follow the requirements of:<br />
1. <strong>Severstal</strong> Corporate Governance Code – available<br />
at www.severstal.com,<br />
2. the UK Corporate Governance Code, 2012 (former the Combined<br />
Code on Corporate Governance of the Financial Reporting<br />
Council) – available at www.frc.org.uk, and<br />
3. recommendations of the Corporate Conduct Code (2002) issued<br />
by the Federal Commission for the Securities Market of Russia –<br />
available at www.fkcb.ffms.ru.<br />
What corporate governance principles are we adhering to?<br />
<strong>Severstal</strong>’s Corporate Governance Code has been prepared<br />
following the recommendations of the earlier Code of Best Practice<br />
set out in section 1 of the Financial Reporting Council’s Code on<br />
Corporate Governance, and is based on the following main<br />
principles:<br />
• solid commitment to full alignment with shareholders’ interests,<br />
• unified, well-shaped business structure supported by a focused<br />
corporate strategy,<br />
• disciplined merger and acquisition strategy supported by a<br />
qualified majority of Board members,<br />
• reliance on a stable, deep-rooted and incentivised management<br />
team,<br />
• industry-leading disclosure practices and transparent corporate<br />
reporting,<br />
• solid platform for delivering superior, long-term returns to all our<br />
shareholders.<br />
Along with the Corporate Governance Code and Charter of the<br />
company, the activities of <strong>Severstal</strong>’s management and<br />
supervisory bodies, as well as insider activities, are also governed<br />
by a set of internal corporate documents, such as:<br />
• General Shareholders Meeting Regulations (2006),<br />
• Board of Directors Regulations (2008),<br />
• Board Committees Regulations (2008),<br />
• Internal Audit Commission Regulations (2006),<br />
• General Director Regulations (2006), and<br />
• Insider Information Regulations (2011).<br />
The full set of the company’s documents is available online at<br />
www.severstal.com. All the principles and rules presented in the<br />
company’s documents are largely compliant with the UK<br />
Combined Code of Corporate Governance, 2012. <strong>Severstal</strong> has a<br />
‘standard listing’ for its depository receipts on the London Stock<br />
Exchange.<br />
Moreover, <strong>Severstal</strong> complies with the Russian corporate<br />
governance law requirements and meets the corporate governance<br />
mandatory requirements of MICEX for Russian listed ‘B’
company Overview Strategy Performance Sustainability Governance Financial statements Additional information<br />
95<br />
companies, such as: composition of the Board of Directors,<br />
formation of Board Committees, evaluation of the auditor’s<br />
opinion, set of internal documents etc.<br />
<strong>Severstal</strong> is a member of the Russian Institute of Directors, the<br />
leading expert and resource centre for corporate governance,<br />
established by the largest Russian issuer companies to develop,<br />
incorporate and monitor standards of corporate governance in Russia.<br />
How are we structured to ensure good, strong governance?<br />
Shareholder<br />
Level<br />
General Meeting of<br />
Shareholders<br />
External Auditor<br />
Internal Audit<br />
Commission<br />
Board Level<br />
Company Secretary<br />
Board of Directors<br />
Audit Committee 1<br />
Remuneration and<br />
Nomination Committee 2<br />
Internal Audit and Risk<br />
Management Dept.<br />
Management<br />
Level<br />
CEO<br />
Alexey Mordashov<br />
<strong>Severstal</strong> Russian Steel<br />
Alexander Grubman<br />
<strong>Severstal</strong> International<br />
Sergei Kuznetsov<br />
<strong>Severstal</strong> Resources<br />
Vadim Larin<br />
1<br />
Audit Committee members: Martin Angle (Chairman), Ronald Freeman, Peter Kraljic<br />
2<br />
Remuneration and Nomination Committe members: Rolf Stomberg (Chairman), Christopher Clark, Alexey Mordashov<br />
Governance calendar for 2012<br />
Overall calendar of General Meetings of Shareholders, Board and its committees are shown below:<br />
Governing bodies Jan Feb Mar Apr May Jun Jul Aug Sep Oct Nov Dec<br />
AGM<br />
EGM V V V<br />
In-person Board V V V V<br />
Audit Committee V V V V<br />
Remuneration and Nomination<br />
Committee V V V<br />
V<br />
<strong>Severstal</strong> Annual Report and accounts 2012
company Overview Strategy Performance Sustainability Governance Financial statements Additional information<br />
96<br />
Corporate governance statement<br />
General Meeting of Shareholders<br />
What is the role of the General Meeting of Shareholders and<br />
what are its key responsibilities?<br />
The General Meeting of Shareholders (GMS) is at the top of<br />
<strong>Severstal</strong>’s hierarchical structure: it represents the company’s<br />
overall governing body.<br />
<strong>Severstal</strong> GMS is responsible for:<br />
• approval and amendment of the company’s charter,<br />
• reorganisation of the company,<br />
• liquidation of the company, appointment of liquidation<br />
commission and approval of intermediate and final liquidation<br />
balance sheets,<br />
• determination of the number of members for the company’s<br />
Board, election of the Board members and the early termination<br />
of their powers,<br />
• determination of the quantity, face value and category of<br />
declared shares and rights given by these shares,<br />
• increases in the company’s share capital by increasing the face<br />
value of shares or by placing additional shares – only in cases,<br />
when pursuant to applicable law, the share capital may be<br />
increased by placing additional shares exclusively by the<br />
decision of the GMS,<br />
• reduction of the company’s share capital by reducing shares’<br />
face value or by acquiring part of shares with a view to reduce<br />
their total quantity, or through redemption of the shares the<br />
company acquires or buys,<br />
• formation of the company’s executive body and early<br />
termination of its authority,<br />
• election of Internal Audit Commission’s members and the early<br />
termination of their powers,<br />
• approval of the company’s auditor,<br />
• approval of annual statements, annual accounting and<br />
reporting documents, including profit and loss accounts,<br />
• distribution of profit, including disbursement of dividends, with<br />
the exception of profit distributed as dividends of the results of<br />
the first three quarters of the year, and distribution of the<br />
company’s loss at the end of a fiscal year,<br />
• approval of conducting procedure for the GMS,<br />
• split and consolidation of shares,<br />
• approval of transactions as required by the applicable law,<br />
• approval of major transactions as required by the applicable law,<br />
• acquisition of placed shares,<br />
• participation in financial and industrial groups, associations and<br />
other commercial corporations,<br />
• approval of internal documents regulating activities of the<br />
company’s bodies,<br />
• other matters provided for by the Russian Federal Law ‘On Joint<br />
Stock Companies’ and the company’s Charter.<br />
Preparation for, and conducting of, <strong>Severstal</strong>’s GMS is provided for<br />
by the company’s Regulations for the General Meeting of<br />
Shareholders.<br />
When do we hold the GMS?<br />
As required by the Russian law and the company’s Charter, the<br />
Annual General Meeting of Shareholders (the AGM) shall be held<br />
no earlier than 2 months and no later than 6 months after the end<br />
of each fiscal year.<br />
The Extraordinary General Meeting of Shareholders (the EGM)<br />
shall be held at the decision of the Board based on:<br />
• initiative of the Board of Directors,<br />
• request of the Internal Audit Commission,<br />
• request of the auditor,<br />
• request of a shareholder(s) of the company possessing in<br />
aggregate no less than 10% of the company’s voting shares on<br />
the date such a request is submitted to.<br />
Our shareholders exercise their rights relating to the company’s<br />
management by voting at the GMS.<br />
How do we inform our shareholders about the upcoming GMS?<br />
According to the company’s Charter, the Notice on conducting the<br />
GMS is to be published no later than 30 days prior to the date of<br />
the GMS. If the agenda of the EGM contains an item on election<br />
of the Board members, such a notice is to be published no later<br />
than 70 days prior to the date of the GMS.<br />
Within the above mentioned period, the Notice on the conducting<br />
the GMS is to be published in the newspapers: SEVERSTAL Russian<br />
steel (Cherepovets) and ‘The Russian Newspaper’. In addition, we<br />
post such a Notice on the <strong>Severstal</strong> website (www.severstal.com) in<br />
Russian and English.<br />
Ballots for voting on items of the GSM’s agenda are directed to the<br />
company’s shareholders no later than 20 days before the GSM.<br />
How do we inform our shareholders about the GMS resolutions?<br />
As required by the applicable law of Russia and <strong>Severstal</strong> internal<br />
regulations, the resolutions taken by the GMS and GMS voting<br />
results shall be:<br />
• announced at the GMS, in the course of which the voting was<br />
taken, or<br />
• if not announced at the GMS, published in the form of Voting<br />
Results Report in the SEVERSTAL Russian steel (Cherepovets)<br />
and ‘The Russian Newspaper’ newspapers within 10 days after<br />
the GMS Voting Results Minutes are drafted,<br />
• disclosed in the form of a Corporate Action Notice as required by<br />
the applicable law,<br />
• posted on the company’s official website (refer to www.severstal.com<br />
for more information).<br />
<strong>Severstal</strong> Annual Report and accounts 2012
company Overview Strategy Performance Sustainability Governance Financial statements Additional information<br />
97<br />
What are the issues <strong>Severstal</strong> GMS approved in 2012?<br />
On 10 April 2012, <strong>Severstal</strong> EGM approved reduction of the<br />
company’s share capital by way of buy-back (details are available<br />
at www.severstal.com).<br />
On 28 June 2012, <strong>Severstal</strong> AGM for 2011 approved the following:<br />
1. The company’s Board members.<br />
2. The company’s Annual Report, Annual Accounting Statements<br />
including Profit and Loss Account for 2011.<br />
3. Dividends for 2011 results in the amount of 3.56 rubles<br />
(US$0.11, June 28, 2012 exchange rate).<br />
4. Dividends for the 1st quarter 2012 results in the amount of 4.07<br />
roubles (US$0.12, June 28, 2012 exchange rate).<br />
5. The company’s Internal Audit Commission members.<br />
6. The company’s Auditor.<br />
7. An interested party transaction with OAO Sberbank of Russia,<br />
which may be executed by <strong>Severstal</strong> in the future in the normal<br />
course of business.<br />
On 27 September 2012, <strong>Severstal</strong> EGM approved the dividends for<br />
half year 2012 results in the amount of 1.52 roubles (US$0.05,<br />
September 27, 2012 exchange rate) per one ordinary registered<br />
share.<br />
On 20 December 2012, <strong>Severstal</strong> EGM approved the dividends for<br />
9 months 2012 results in the amount of 3.18 roubles (US$0.10,<br />
December 20, 2012 exchange rate) per one ordinary registered<br />
share.<br />
More information and materials for <strong>Severstal</strong> GMS and<br />
dividend pay-out history is available at www.severstal.com.
company Overview Strategy Performance Sustainability Governance Financial statements Additional information<br />
98<br />
Corporate governance statement<br />
The Board of Directors<br />
What is the role of our Board of Directors and what are its key<br />
responsibilities?<br />
<strong>Severstal</strong>’s Board of Directors is responsible for the general<br />
management and performance of the company’s operations,<br />
including discussion, review and approval of its strategy and<br />
business model, and closely monitoring its financial and business<br />
operations both by segment and as a whole.<br />
The Board’s main objective is to run the company in a way that<br />
increases shareholder value in the medium and long term.<br />
Short-term financial and operational issues, such as debt levels<br />
and costs, also receive close attention.<br />
The Board’s decisions are based on the best interests of all<br />
stakeholders. This can mean making difficult decisions in complex<br />
situations.<br />
The Board is also responsible for disclosure and dissemination of<br />
information about the company’s operations, for implementing<br />
the company’s information policy and for matters dealing with the<br />
company’s insider information.<br />
The Board has authority in decisions concerning major aspects of<br />
<strong>Severstal</strong>’s activity, except in matters within the competence of the<br />
GMS.<br />
The Board’s activity is regulated by the applicable law of Russia,<br />
the company’s Charter (2011) and Regulations for the Board of<br />
Directors (2008).<br />
Key responsibilities of our Board of Directors:<br />
1. company’s strategic direction,<br />
2. review of consolidated budget and submitting appropriate<br />
recommendations,<br />
3. review of appointment and compensation policy applicable to<br />
the company’s senior executives and making<br />
recommendations regarding such policy,<br />
4. approval of issues relating to calling and holding the GMS,<br />
which fall within its competence under the applicable law,<br />
5. dividend policy,<br />
6. placement of the company’s bonds and other issued securities<br />
in cases provided by the applicable law,<br />
7. approval of the price (estimated value) of assets, the price of<br />
placement and redemption of issued securities,<br />
8. Internal Audit Commission and auditor fees,<br />
9. recommendations of dividend amounts for approval of the<br />
GMS,<br />
10. use of emergency fund and other funds of the company,<br />
11. opening of the company’s branches and representative offices<br />
and their liquidation,<br />
12. approval of the company’s registrar and contract relations with it,<br />
13. approval of transactions with interested parties (as this term is<br />
defined in accordance with Russian law) with the value of each<br />
transaction up to 2% of <strong>Severstal</strong> assets’ book value on the<br />
date such a transaction is agreed,<br />
“This year, following a detailed survey,<br />
and with expert outside involvement,<br />
the board engaged in a thorough<br />
debate on its own performance. As a<br />
result, we instigated significant changes<br />
on the important subjects of health &<br />
safety, strategy and the interface with<br />
management.”<br />
Christopher Clark<br />
Chairman of the Board of Directors:<br />
14. approval of transaction amounts exceeding 10% of <strong>Severstal</strong><br />
assets’ book value on the date such a transaction is agreed,<br />
15. approval of transactions to acquire:<br />
• (i) shares or participation interests, or rights to manage such<br />
shares or participation interests,<br />
• (ii) fixed or intangible assets if the amount of the transaction<br />
specified in sub-clauses (i) or (ii) exceeds the equivalent of<br />
US$500 million,<br />
16. approval of the company’s Corporate Governance Code and<br />
internal documents regulating Board Committees’ activity and<br />
insider relations.<br />
Who is on our Board?<br />
According to the company’s Charter, <strong>Severstal</strong>’s Board comprises<br />
ten members. Our Board has a strong independent element. Its<br />
current structure represents a balance between Chairman<br />
(Christopher Clark), five Independent Non-Executive Directors<br />
including the Chairman, who met the independence criteria on his<br />
appointment as required by the UK Corporate Governance Code,<br />
2012 (Christopher Clark, Rolf Stomberg, Martin Angle, Ronald<br />
Freeman and Peter Kraljic), one Non-Executive Director (Mikhail<br />
Noskov) and four Executives (Alexey Mordashov, Sergei Kuznetsov,<br />
Alexey Kulichenko and Alexander Grubman). <strong>Severstal</strong> strongly<br />
believes that maintaining such a balance on the Board is a<br />
prerequisite for continued good decision-making and governance.<br />
The proportion of Independent Non-Executive Directors on the<br />
Board guarantees equal regard for the interests of all shareholders.<br />
The Board considers all of its Independent Non-Executive Directors<br />
to be independent, in line with the UK Corporate Governance<br />
Code, 2012.<br />
Details of our individual Directors can be found<br />
in their biographies on pages 84–93<br />
Board composition<br />
Executives 40%<br />
Non-Executives 60%<br />
Independent 50%<br />
Male 100%<br />
Female 0%<br />
<strong>Severstal</strong> Annual Report and accounts 2012
company Overview Strategy Performance Sustainability Governance Financial statements Additional information<br />
99<br />
The Board reviews the independence of all Independent and<br />
Non-Executive Directors annually, and has determined that all such<br />
directors are independent and have no cross-directorships or<br />
significant links, which could materially interfere with them<br />
exercising their independent judgment. The company’s<br />
Independent and Non-Executive Directors play a leading role in<br />
corporate accountability and governance through their<br />
membership and participation in the Audit Committee and<br />
Remuneration and Nomination Committee.<br />
How are the roles of Chairman and CEO clearly differentiated?<br />
The roles of the company’s Chairman and CEO are separate and<br />
their responsibilities are clearly defined in the company’s<br />
organisational documents and are regulated by the applicable law.<br />
Christopher Clark is <strong>Severstal</strong>’s Chairman of the Board of Directors.<br />
The Board Chairman is elected from among its members by a<br />
majority vote.<br />
The Board Chairman’s role is to:<br />
• lead the Board and with other members of the Remuneration<br />
and Nomination Committee lead the recruitment of new<br />
directors,<br />
• ensure constructive relations between executive and nonexecutive<br />
directors,<br />
• ensure that all Board members are able to maximise their<br />
contribution to the Board,<br />
• provide strategic insight from his wide-ranging business<br />
experience and contacts built up over many years,<br />
• provide a sounding Board for the CEO on key business decisions<br />
and challenge proposals where appropriate,<br />
• preside over the GMS,<br />
• meet with shareholders on governance matters and be as an<br />
alternative point of contact to CEO for shareholders on other matters.<br />
Alexey Mordashov is <strong>Severstal</strong>’s CEO. As required by <strong>Severstal</strong><br />
internal documents, the company’s CEO cannot be elected as the<br />
Board Chairman, which is in line with the UK Corporate<br />
Governance Code, 2012.<br />
The CEO’s role is to:<br />
• lead the business and the rest of the management team,<br />
• lead the development of the company’s strategy with input from<br />
the rest of the Board,<br />
• lead the management team in the company’s acquisitions and<br />
new build decisions,<br />
• ensure organisation, status and accuracy of the company’s<br />
accounting practices, timely provision of appropriate authorities<br />
with financial reports,<br />
• bring matters of particular significance or risk for discussion and<br />
consideration of the Board if appropriate,<br />
• be the principal public face of the company with shareholders,<br />
customers, suppliers and the industry generally,<br />
• cooperate with the company’s trade unions to protect interests<br />
of the company’s employees and communicate with state and<br />
municipal authorities.<br />
“Good corporate governance means, among<br />
other things, that senior management can look<br />
to experienced independent directors to assist<br />
management to develop and monitor a strategy<br />
to achieve efficient corporate growth.”<br />
Ronald Freeman<br />
Independent Non-Executive Director<br />
Why our Board is the right team to deliver the<br />
long-term success of the business?<br />
The <strong>Severstal</strong> Board, which comprises ten members, has a<br />
majority of Independent Non-Executive Directors, whose role is<br />
to properly challenge the management team. Their ability to act<br />
as a check and balance is underlined by the high calibre nature<br />
and broad experience of our Non-Executive Directors.<br />
<strong>Severstal</strong>’s Chairman is Christopher Clark, who previously had a<br />
career spanning 40 years at Johnson Matthey plc, the specialty<br />
chemicals and precious metals Group. Christopher currently also<br />
chairs RusPetro plc, an independent oil and gas producer<br />
conducting oil exploration and production activities in the<br />
Krasnoleninsk field in Western Siberia, one of the largest oil<br />
producing regions in Russia. He earlier chaired Associated British<br />
Ports, Urenco Limited and Wagon plc.<br />
<strong>Severstal</strong>’s Senior Independent Director is Rolf Stomberg. Rolf is<br />
chairman of the nomination and remuneration committee on<br />
<strong>Severstal</strong>’s Board, and was previously a senior executive with BP<br />
for more than 30 years as well as a director of medical<br />
technology group Smith & Nephew. Rolf is chairman of the<br />
supervisory board of LANXESS, a global chemical company.<br />
The other independent directors are: Martin Angle, a highly<br />
respected investment banker, who has Board level experience at<br />
a number of listed companies; Ronald Freeman, who was Head of<br />
the Banking Department of the European Bank of Reconstruction<br />
and is a non-executive member of the Board of Directors of Volga<br />
Gas; and Peter Kraljic, who had a highly distinguished career at<br />
McKinsey over 32 years where he held a number of senior<br />
positions.
company Overview Strategy Performance Sustainability Governance Financial statements Additional information<br />
100<br />
Corporate governance statement<br />
What have we done in 2012 to set best corporate governance<br />
standards?<br />
In May 2012, Ronald Freeman participated in the Third<br />
International Conference on Global Capital Markets and Corporate<br />
Governance: Quest for Global Standards held in Moscow. This<br />
conference was organised by the National Council on Corporate<br />
Governance with the participation of the World Bank Group,<br />
Organization for Economic Co-operation and Development and<br />
Russian Union of Industrialists and Entrepreneurs. Ronald Freeman<br />
took part in the panel discussion on corporate boards in the 21st<br />
century.<br />
In September 2012, Christopher Clark and Alexey Mordashov led<br />
<strong>Severstal</strong>’s senior management team as it presented <strong>Severstal</strong>’s<br />
updated development strategy to investors and analysts in London<br />
at the company’s Capital Markets Day. <strong>Severstal</strong>’s senior<br />
management team updated the audience on the delivery of the<br />
company’s growth strategy and objectives, as well as the outlook<br />
for global steel and steel-related mining markets. The team<br />
demonstrated that <strong>Severstal</strong> is well positioned to continue its<br />
outperformance, helped by further internal efficiencies and organic<br />
growth. This included an asset structure aligned with strategic<br />
priorities, further progress in implementing the Business System of<br />
<strong>Severstal</strong> and continued targeted investment. More details are<br />
available at: www.severstal.com.<br />
In October 2012, the Grand Ceremony of 2012 National Director<br />
of the Year award took place in Moscow hosted by the Association<br />
of Independent Directors, the Russian Union of Industrialists and<br />
Entrepreneurs and PricewaterhouseCoopers. <strong>Severstal</strong>, one of the<br />
world’s leading steel and steel-related mining companies, was the<br />
official partner of the prestigious National Director of the Year<br />
award.<br />
Alexei Mordashov was a member of the judging panel who<br />
selected the winners. The panel’s task was to evaluate independent<br />
directors sitting on the Boards of Russian companies whose job it<br />
is to ensure their company’s corporate governance is in line with<br />
international standards. Mr. Mordashov commented: “In the<br />
current macroeconomic environment, Independent Directors need<br />
to be flexible and ready to respond quickly to changes in the<br />
business environment.”<br />
Christopher Clark and <strong>Severstal</strong>’s Corporate Secretary, Oleg<br />
Tsvetkov (who also sat on the awards’ judging panel) were present<br />
at the awards ceremony. Mr. Clark, who presented the award for<br />
the Best Chairman of the Board, commented: “Excellence in<br />
corporate governance is a core value for <strong>Severstal</strong> and I believe it is<br />
an essential characteristic for all good businesses and a crucial<br />
foundation for engaging with employees, investors and other<br />
stakeholders.”<br />
<strong>Severstal</strong>’s Independent Directors have previously won numerous<br />
laureates in the Director of the Year award category, in particular:<br />
• 2011 – Ronald Freeman, Independent Non-Executive Director<br />
and Member of the Audit Committee, was honoured as one of<br />
the best in the nomination of Independent Director 2011,<br />
• 2008 – Rolf Stomberg, Senior Independent Director, was<br />
honoured as one of the best in the nomination Independent<br />
Director 2008.<br />
This year, because <strong>Severstal</strong> was the official partner of the award,<br />
<strong>Severstal</strong>’s directors were unable to be nominated but all five of<br />
the company’s Independent Board members and its Corporate<br />
Secretary were named amongst the 50 best Independent<br />
Directors, the 25 Best Chairmen of the Board of Directors, and the<br />
25 best Corporate Secretaries categories. More details are<br />
available at www.severstal.com and www.directorgoda.ru.<br />
What is the process for appointing new people to the Board?<br />
Each member of the company’s Board must be an individual.<br />
Members of the Board shall:<br />
• act conscientiously and responsibly in the best interests of all<br />
shareholders and the entire company,<br />
• be possessed of appropriate professional skills,<br />
• devote sufficient time to the performance of their duties as a<br />
member of the Board so as to work efficiently,<br />
• once elected, give up representation of interests of any group of<br />
persons in relation to the company, and act only in the best<br />
interests of all shareholders and the entire company, and<br />
• disclose in good faith full information about their interest in any<br />
transactions the company intends to enter into.<br />
Our Board members are elected by the company’s shareholders<br />
through cumulative voting at the GMS, for a term of office until<br />
the next AGM.<br />
At cumulative voting, the votes of each shareholder are multiplied<br />
by the number of persons to be elected to the company’s Board. A<br />
shareholder may give all of its votes to one candidate or distribute<br />
them between two or more candidates. Candidates with the<br />
greatest number of votes are considered elected. If a Board<br />
member elects to terminate their term of office the whole body of<br />
the Board is to be re-elected at a GMS. Those elected to the<br />
company’s Board may be re-elected an unlimited number of times.<br />
Directors new to the Board are given background information on<br />
the company when they take office. This includes details of the<br />
company’s operations and procedures, as well as information on<br />
what is required from them in their role according to the<br />
company’s internal documents. This includes <strong>Severstal</strong>’s Corporate<br />
Governance Code, applicable corporate governance law, and<br />
descriptions of best practice to help ensure their early effective<br />
contribution to the company.<br />
<strong>Severstal</strong> Annual Report and accounts 2012
company Overview Strategy Performance Sustainability Governance Financial statements Additional information<br />
101<br />
What has the Board done during 2012?<br />
Meetings of the Board of Directors are held in person or in absentia when<br />
necessary.<br />
Board meetings are convened by the Board Chairman at the Board’s own initiative,<br />
at the request of the company’s Board member, Internal Audit Commission,<br />
Auditor, executive body or shareholder(s) possessing in aggregate at least 2% of<br />
the company’s voting shares.<br />
In 2012, <strong>Severstal</strong>’s Board of Directors held four meetings in person and 43<br />
meetings in absentia.<br />
These are the key issues reviewed by the Board in 2012:<br />
• Board recommendations with the list of candidates to the company’s Board,<br />
Internal Audit Commission and auditor for approval by the company’s<br />
shareholders at the AGM.<br />
• Proposals from the company’s shareholders with items to the AGM’s agenda and<br />
candidates to the company’s Board, Internal Audit Commission and Auditor for<br />
approval by the company’s shareholders at the AGM.<br />
• Issues relating to convocation and conducting of the company’s GMS.<br />
• Recommendations to the GMS on the amount of dividends to be paid-out.<br />
• Election of the Board Chairman, Senior Independent Director and members of<br />
the Board Committees.<br />
• Approval of the company’s financials for FY2011, 1Q2012, 1H2012 and 9M2012.<br />
• Issues relating with operations of the company’s divisions for respective periods.<br />
• Contract terms and conditions with the company’s registrar.<br />
• Issues relating with issue of the company’s bonds.<br />
• Issues relating with the company’s share buy-back process.<br />
• <strong>Severstal</strong> budget for 2013.<br />
• Transactions with interested parties.<br />
The attendance of the company’s directors at the meetings of the Board and its committees during 2012 is shown below:<br />
Member of the Board<br />
Number of Board in-person<br />
meetings possible<br />
Number of Board meetings<br />
attended<br />
Audit Committee meetings<br />
attended (out of 4 meetings)<br />
“In 2012 the main strategic<br />
development was to re-focus<br />
upon the core steel business.<br />
For the future the Board’s<br />
role will be to contribute<br />
to considerations about<br />
the future growth platform<br />
as well as to support the<br />
further drive for operational<br />
excellence.”<br />
Peter Kraljic<br />
Independent Non-Executive Director<br />
Remuneration and Nomination<br />
Committee meetings attended<br />
(out of 3 meetings)<br />
Christopher Clark 4 4 4 * 3<br />
Rolf Stomberg 4 4 4 * 3<br />
Martin Angle 4 4 4 3 *<br />
Ronald Freeman 4 4 4 3 *<br />
Peter Kraljic 4 4 4 3 *<br />
Alexey Mordashov 4 4 - 3<br />
Mikhail Noskov 4 4 4 * -<br />
Alexander Grubman 4 4 1 * -<br />
Sergey Kuznetsov 4 4 1 * -<br />
Alexey Kulichenko 4 4 4 * -<br />
* means that the specified Director is not a member of that Committee, although he attended the meeting at the invitation of Chairman of the Committee.<br />
Moreover, Independent Non-Executive Directors meet separately during the year. There were four such meetings in 2012.<br />
Board and Committee members have direct and continuous access to Board and Committee materials via a special electronic system,<br />
which also serves as an archive for Board and Committee materials – and as a way to vote in Board meetings where members are able<br />
to participate remotely.
company Overview Strategy Performance Sustainability Governance Financial statements Additional information<br />
102<br />
Corporate governance statement<br />
How do we ensure we have an effective Board?<br />
The Board makes an annual self-evaluation of its performance<br />
based on the individual contribution of each Board member, and<br />
an external evaluation once every three years, as required by the<br />
UK Corporate Governance Code, 2012.<br />
In 2012, the Board commissioned its second ever independentlyfacilitated<br />
audit of its effectiveness, by the respected international<br />
executive search firm Heidrick & Struggles. The first was conducted<br />
in 2009. The audit involved a Board observation, interviews and<br />
online questionnaire with each Board member. Each participant<br />
was asked to evaluate the Board, its Committees, the Chairman<br />
and individual Board members. The process took place between<br />
December 2012 and February 2013.<br />
The approach involved three primary phases. These include ‘Discovery’,<br />
‘Understanding Overall Board Effectiveness’ and ‘Enhancing Board<br />
Performance’ through increased individual and team engagement.<br />
The Board was found to be high-performing with particular<br />
strength in terms of overall composition, stability and process.<br />
There is good engagement and a healthy dynamic between<br />
Non-Executive Directors and management.<br />
The Board has undertaken to continue its focus on progressive<br />
development with the following initiatives:<br />
• creating an additional Board committee to focus on Health and<br />
Safety, led by a Non-Executive Director,<br />
• a review of the induction process for new Directors, and training<br />
and mentoring for existing Directors,<br />
• increased frequency of site visits to be combined with in-depth<br />
research on topics of special interest,<br />
• the Board is committed to regular reviews of its performance<br />
and contribution to stewardship of the business.<br />
What is the role of our Senior Independent Director?<br />
Rolf Stomberg is <strong>Severstal</strong>’s Senior Independent Director and is<br />
also Chairman of the Remuneration and Nomination Committee.<br />
The Senior Independent Director’s role is to:<br />
• work with the Chairman on the Board evaluation,<br />
• lead evaluation of the Chairman,<br />
• meet major shareholders,<br />
• chair meetings of the Independent and Non-Executive Directors<br />
when the Chairman is not present.<br />
Details of Rolf Stomberg’s biography<br />
can be found on page 90<br />
What is the role of our Corporate Secretary?<br />
The Corporate Secretary ensures <strong>Severstal</strong>’s compliance with the<br />
requirements of applicable law, the company’s Charter and<br />
internal documents regulating the needs and interests of the<br />
company’s shareholders. The Corporate Secretary is responsible for<br />
safeguarding the rights and interests of shareholders, as well as<br />
establishing transparent and effective regulations to secure the<br />
rights of shareholders.<br />
The Corporate Secretary’s role is to:<br />
• facilitate activities of the Board and its committees,<br />
• keep the Board and its committees informed on governance<br />
matters,<br />
• facilitate the induction of new directors to the Board,<br />
• arrange preparation and holding of the company’s GMS,<br />
• ensure disclosure of information as required by the applicable law,<br />
• assist in the ongoing development of the company’s policies,<br />
• ensure communication with the company’s shareholders, GDR<br />
holders as well as Russian and foreign stock market regulators.<br />
Oleg Tsvetkov (PhD, MBA) became Corporate Secretary of<br />
<strong>Severstal</strong> in 2006, after its listing in London. Oleg was awarded the<br />
‘Corporate Governance Director – Corporate Secretary’ (2008)<br />
award and headed the list of Directors on Corporate Governance<br />
2010 - 2012 in the steelmaking sector. Since July 2011 Oleg has<br />
been Chairman of the All-Russian public organisation ‘National<br />
Association of Corporate Secretaries’.<br />
What is our remuneration and compensation policy for the<br />
Board?<br />
By the decision of the GMS, Board members may be paid<br />
remuneration during execution of their duties, and any expenses<br />
incurred in connection with their functions as Board members may<br />
be reimbursed. The amount of such remuneration or compensation<br />
is to be approved by the decision of the GMS only. Should any<br />
Board member decide to resign before their term of office expires,<br />
such a Board member is paid pro rata in proportion to the term of<br />
office that expired prior to resignation. The Board Chairman<br />
receives an annual special incentive fee, the amount of which is<br />
also subject to approval by the GMS.<br />
We reimburse our Board members’ expenses incurred in connection<br />
with the performance of their duties as Board members, including<br />
transport, accommodation or mailing costs, as well as costs<br />
relating to translation of company documents or materials that<br />
they are provided with.<br />
<strong>Severstal</strong> Annual Report and accounts 2012
company Overview Strategy Performance Sustainability Governance Financial statements Additional information<br />
103<br />
What is our share capital structure?<br />
<strong>Severstal</strong> share capital comprises ordinary shares with a nominal<br />
value of RUB 0.01 each. Following the reduction and cancellation<br />
of 169,982,695 <strong>Severstal</strong> shares in July 2012, authorised share<br />
capital of <strong>Severstal</strong> at 31 December 2012 comprises 837,718,660<br />
issued and fully paid shares. Previously, authorised share capital of<br />
<strong>Severstal</strong> at 31 December 2011 comprised 1,007,701,355 shares.<br />
All <strong>Severstal</strong> shares carry equal voting and distribution rights.<br />
There are no restrictions or limitations on voting rights for holders<br />
of <strong>Severstal</strong> shares and GDRs.<br />
Equity capital structure as at December 31, 2012<br />
Share, % Shareholders<br />
equity capital<br />
Alexey Mordashov * 79.17%<br />
Institutional investors and employees 20.83%<br />
Total 100%<br />
* Through participating in <strong>Severstal</strong>’s privatisation auctions and other purchases, Alexey<br />
Mordashov (the ‘Majority Shareholder’) had purchased shares in <strong>Severstal</strong> such that<br />
as at 31 December 2012 he controlled indirectly 79.17% of <strong>Severstal</strong>’s share capital.<br />
What are the recent changes to the company’s Charter?<br />
<strong>Severstal</strong>’s Charter and any other internal documents regulating<br />
the activities of the Company’s bodies, can be amended or<br />
adopted in a new edition by the resolution of the GMS only, as<br />
required by the applicable law of Russia and the company’s<br />
Charter. Decision on the company’s Charter amendment or its<br />
adoption in the new edition is taken by a ¾ qualified majority<br />
shareholder vote at the GMS.<br />
Following <strong>Severstal</strong>’s EGM dated April 10, 2012 that approved the<br />
terms and conditions of the company’s share capital reduction by<br />
way of buy-back, the Board approved the Buy-Back Report and the<br />
Charter Amendments on July 18, 2012 as required by the<br />
applicable law of Russia. The Amendments to the company’s<br />
Charter are available at www.severstal.com.<br />
The Board Committees<br />
What are the Committees of our Board and what do they do?<br />
<strong>Severstal</strong>’s Board of Directors includes the following committees:<br />
• Audit Committee, and<br />
• Remuneration and Nomination Committee.<br />
The Board Committees serve as consultative and advisory bodies<br />
that deal with issues raised by the Board. Committees may not act<br />
on behalf of the Board and are not considered to be management<br />
bodies of the company. They have no powers in relation to<br />
managing the company.<br />
Committee meetings are held as and when necessary, but at least<br />
three times a year. They are held apart from the Board meetings so<br />
that extra attention can be given to discussing issues, which<br />
require preliminary Board consideration prior to approval by the<br />
Board members, and determine the necessity of the Board’s<br />
approval for a specific issue.<br />
Decisions of each Committee are taken by a majority vote of all<br />
Committee members taking part in the meeting. Each member has<br />
one vote and the Committee Chairman has no casting vote in the<br />
event of a tie.<br />
Activity of <strong>Severstal</strong> Committees is regulated by the Regulations<br />
for the Board Committees. Please refer to www.severstal.com for<br />
more information.
company Overview Strategy Performance Sustainability Governance Financial statements Additional information<br />
104<br />
Corporate governance statement<br />
The Audit Committee<br />
Who is on our Audit Committee?<br />
The Audit Committee consists of three Independent Non-Executive<br />
Directors. Currently they are:<br />
1. Martin Angle (Chairman),<br />
2. Ronald Freeman, and<br />
3. Dr. Peter Kraljic.<br />
Details of the abovementioned Audit Committee members<br />
can be found in their biographies on pages 91-93<br />
In accordance with its terms, the Committee has sufficient recent<br />
relevant financial experience, and the overall skills required for<br />
financial statements, business risk analysis and financial<br />
management skills. No senior executive of the company is a<br />
member of the Audit Committee.<br />
What is the role of the Audit Committee and what are its key<br />
responsibilities?<br />
The Audit Committee assists the Board of Directors in monitoring<br />
the company’s risk management processes and control<br />
environment, and in reviewing the company’s annual and quarterly<br />
financial statements and audit.<br />
In its work, the Audit Committee also:<br />
1. evaluates candidates put forward as the company’s external<br />
auditorsand makes recommendations to the Board regarding<br />
the selection of external auditors,<br />
2. develops recommendations to the Board regarding external<br />
auditors’ fees,<br />
3. reviews the scope and results of the auditors’ work and their opinion<br />
and its efficiency and objectivity. Monitors the independence of the<br />
external auditor, taking into account the applicable requirements of<br />
professional and regulatory bodies in Russia and the UK,<br />
4. reviews the company’s quarterly and annual financial statements,<br />
changes in accounting policies and practices, as well as material<br />
adjustments, if any, arising from the Audit, before the financial<br />
statements are submitted to the Board for approval and publication,<br />
5. reviews any other statements to be published which may relate<br />
to the financial performance of the company, prior to their<br />
recommendation to the Board for approval,<br />
6. monitors the effectiveness of risk management processes,<br />
internal control and corporate governance systems,<br />
7. monitors the internal audit function,<br />
8. monitors and controls the compliance policy for auditors<br />
supplying non-audit services,<br />
9. analyses material changes to applicable law that affects the<br />
company’s financial statements, and any findings of supervisory<br />
bodies and court proceedings.<br />
The Audit Committee also prepares its own evaluation of the<br />
auditors’ opinion on financial statements and provides this<br />
evaluation to the company’s Board and the AGM.<br />
To ensure that the company’s financial and business operations<br />
are monitored efficiently, external auditors with no interests in the<br />
company are employed to verify and approve the accounts. The<br />
Audit Committee monitors the auditor’s independence. ZAO<br />
KPMG – external auditor lead partner – always participates in the<br />
“The Audit Committee provides an<br />
important governance tool for the Board.<br />
The committee continues to meet best<br />
international practice, and it adapts its<br />
agenda to changes in the risk environment<br />
in which the company operates.”<br />
Martin Angle<br />
Chairman of the Audit Committee<br />
meetings of the Audit Committee, reviewing the company’s<br />
quarterly and annual results. Audit Committee members meet the<br />
external auditor regularly, without management, to discuss<br />
matters arising from the audit and review process. There were four<br />
such meetings in 2012.<br />
<strong>Severstal</strong> books and records are audited in compliance with the<br />
requirements of statutory law and International Standards on<br />
Auditing issued by the International Auditing and Assurance<br />
Standards Board (IAASB), with respect to financial statements<br />
prepared under International Financial Reporting Standards (IFRS).<br />
Such audit takes place annually and, as of the first, second and<br />
third quarter of 2012, the company’s interim condensed financial<br />
statements, prepared in accordance with International Financial<br />
Reporting Standard IAS 34 Interim Financial Reporting, are also<br />
reviewed in accordance with International Standard on Review<br />
Engagements 2410 Review of Interim Financial Information<br />
Performed by the Independent Auditor of the Entity.<br />
What has the Audit Committee done during 2012?<br />
The Audit Committee met four times in 2012. The Chairman of the<br />
Audit Committee is continuously in touch with the Board<br />
Chairman, the external audit lead partner, the company’s CFO and<br />
Head of Internal Audit.<br />
These are the key issues reviewed by the Audit Committee in 2012:<br />
• External Auditor’s Report to <strong>Severstal</strong>’s RAS financial statements<br />
for 2011.<br />
• <strong>Severstal</strong>’s RAS financial statements for 2011 and recommended<br />
the Board approve it and submit it for attention of the AGM.<br />
• Transactions with related parties approved by the Board in 2011.<br />
• Internal Audit Plan for 2012.<br />
• External Auditor’s Report to <strong>Severstal</strong>’s RAS financial statements<br />
for Q1, H1 and 9M of 2012.<br />
• <strong>Severstal</strong>’s IFRS condensed interim financial statements for Q1,<br />
H1 and 9M of 2012.<br />
• Internal Audit report for Q1, H1 and 9M of 2012.<br />
• Internal control environment in <strong>Severstal</strong> Divisions: <strong>Severstal</strong><br />
Russian Steel, <strong>Severstal</strong> Resources, <strong>Severstal</strong> International.<br />
• Development and implementation of <strong>Severstal</strong> fraud prevention<br />
system (anti-bribery programme).<br />
• <strong>Severstal</strong> Business Standard project implementation.<br />
Individual attendance of the Audit Committee meetings by<br />
its members is shown on page 101<br />
<strong>Severstal</strong> Annual Report and accounts 2012
company Overview Strategy Performance Sustainability Governance Financial statements Additional information<br />
105<br />
The Remuneration and Nomination Committee<br />
Who is on our Remuneration and Nomination Committee?<br />
The Remuneration and Nomination Committee consists of three<br />
members. At least two members of the Remuneration and<br />
Nomination Committee, including the Chairman of the<br />
Committee, are Independent Non-Executive Directors. Currently<br />
the Remuneration and Nomination Committee comprises:<br />
1. Dr. Rolf Stomberg (Chairman)<br />
2. Christopher Clark, and<br />
3. Alexey Mordashov.<br />
Details of the above mentioned Committee members can be<br />
found in their biographies on pages 90, 84, 85<br />
What is the role of the Remuneration and Nomination<br />
Committee and what are its key responsibilities?<br />
The Remuneration and Nomination Committee’s role is to help the<br />
company engage qualified professionals to manage the company,<br />
and create the incentives necessary to ensure their successful work<br />
for the company. It also reviews remuneration and compensation<br />
for the company’s senior managers and Independent Board<br />
members.<br />
The Remuneration and Nomination Committee:<br />
1. develops general recommendations for the Board on selecting<br />
nominees to the Board, proposed by the Board,<br />
2. conducts preliminary evaluations of potential nominees to the<br />
Board and provides the Board with recommendations,<br />
3. informs the Board of any potential nominees to the Board it is<br />
aware of and recommends individual persons for nomination or<br />
election to the Board,<br />
4. issues an opinion as to whether a person nominated to the<br />
Board qualifies as an Independent Director,<br />
5. develops the system of remuneration and other payments made<br />
by the company or at the company’s expense (including life and<br />
health insurance, and pension plans) for Board members, based<br />
on members’ personal contributions to the company’s strategic<br />
objectives,<br />
6. prepares and submits the appointment and remuneration policy<br />
for senior executives of the company, including its Chief<br />
Executive, as well as providing recommendations on the terms of<br />
the contract signed with the Chief Executive,<br />
7. reviews the Board members’ performance, including the<br />
advisability of nominating respective Board members for<br />
another term in office,<br />
8. provides the Board with recommendations regarding the<br />
material terms of the General Director’s contract,<br />
9. reviews information furnished by the Board members – to be<br />
disclosed in accordance with applicable law or the Charter – for<br />
establishing whether such Board members have an interest in<br />
any decisions of the company, as well as information related to<br />
the circumstances preventing the aforementioned officers from<br />
efficiently discharging their duties as members of the Board, and<br />
any circumstances entailing their loss of independence as a<br />
member of the Board.<br />
“Attracting, retaining and developing<br />
top calibre executives is of utmost<br />
importance for the success of the<br />
company. The Committee, therefore,<br />
focuses on talent review, executive<br />
development and the need to have<br />
motivating, incentivising and competitive<br />
remuneration packages in place.”<br />
Rolf Stomberg<br />
Chairman of the Remuneration and Nomination<br />
Committee:<br />
What has the Remuneration and Nomination Committee done<br />
during 2012?<br />
The Remuneration and Nomination Committee met three times in<br />
2012. The Chairman of the Remuneration and Nomination<br />
Committee is in regular contact with the company’s CEO and<br />
Senior Vice-President of Human Resources.<br />
These are the key issues reviewed by the Remuneration and<br />
Nomination Committee in 2012:<br />
• Top ten company executives’ remunerations and compensations.<br />
• Heidrick & Struggles proposals for succession assessment and<br />
development for <strong>Severstal</strong> management.<br />
• <strong>Severstal</strong>’s succession planning procedures.<br />
Individual attendance of Remuneration and Nomination<br />
Committee meetings by its members is shown on page 101<br />
<strong>Severstal</strong> Annual Report and accounts 2012
company Overview Strategy Performance Sustainability Governance Financial statements Additional information<br />
106<br />
Corporate governance statement<br />
Sole Executive Body<br />
Who is the company’s Sole Executive Body?<br />
The authority of the company’s Sole Executive Body is exercised by<br />
the Chief Executive Officer/General Director of the Company.<br />
The CEO is appointed by the company’s GMS for a three-year<br />
period and can be re-elected an unlimited number of times. Alexey<br />
Mordashov was re-appointed CEO at <strong>Severstal</strong>’s AGM in 2010.<br />
Details are available at www.severstal.com.<br />
The GMS can, at any time, adopt a resolution on the early<br />
termination of the CEO’s authorities.<br />
What is the role of our Sole Executive Body and what are its key<br />
responsibilities?<br />
The CEO, among other things, acts on behalf of the company,<br />
represents its interests, commits transactions, and approves<br />
manning schedules, and issues orders and instructions obligatory<br />
for all of the company’s employees.<br />
The CEO carries out day-to-day management of the company and<br />
ensures its efficient operation by performing the tasks set by the<br />
Board of Directors. The CEO is responsible for the organisation,<br />
status and accuracy of accounting practices, timely provision of<br />
appropriate authorities with financial reports, and the timely<br />
provision to shareholders, creditors and the media of information<br />
regarding the Company’s operations. The Chief Executive Officer<br />
also cooperates with trade unions to protect the interests of<br />
company employees and communicates with state and municipal<br />
authorities.<br />
More details on the role of <strong>Severstal</strong>’s CEO are on page 99<br />
CEO’s activity is regulated by <strong>Severstal</strong>’s Regulations for the General<br />
Director. These Regulations are available at www.severstal.com.
company Overview Strategy Performance Sustainability Governance Financial statements Additional information<br />
107<br />
Supervisory bodies of the company<br />
What are the company’s supervisory bodies?<br />
<strong>Severstal</strong> supervisory bodies are as follows:<br />
• Internal Audit Commission, and<br />
• External Auditor.<br />
What is the role of the company’s supervisory bodies and what<br />
are their key responsibilities?<br />
Internal Audit Commission<br />
<strong>Severstal</strong>’s Internal Audit Commission is a full-time internal control<br />
body that supervises the company’s financial and business<br />
operations, to obtain adequate assurance that the company’s<br />
operations are in full compliance with the applicable law of Russia,<br />
and to make sure the rights of the company’s shareholders are<br />
observed, and the company’s reports and accounts have no<br />
material mis-statements. The Internal Audit Commission acts in<br />
the best interests of shareholders and reports to the GMS.<br />
Our Internal Audit Commission comprises three persons. They are<br />
elected for a period until the next AGM. Members of the Internal<br />
Audit Commission cannot be members of the company’s Board<br />
and occupy any other position in the company’s management<br />
structure at the same time.<br />
<strong>Severstal</strong>’s Internal Audit Commission was elected by the AGM on<br />
28 June 2012 in the following body:<br />
1. Nikholay Lavrov (Chief Audit Executive),<br />
2. Roman Antonov (Deputy Chief Audit Executive), and<br />
3. Svetlana Guseva (Manager of Internal Audit and Risk<br />
Management).<br />
Activity of the company’s Internal Audit Commission is regulated<br />
by <strong>Severstal</strong>’s Regulations for the Internal Audit Commission.<br />
These regulations are available at www.severstal.com.<br />
External Auditor<br />
An external auditor is appointed annually by the GMS. The<br />
external auditor’s role is to review the company’s financial and<br />
reporting performance. The amount of its remuneration is subject<br />
to Board’s approval.<br />
As in 2011, ZAO KPMG was re-appointed as <strong>Severstal</strong>’s auditor by<br />
the AGM in June 2012. KPMG was first elected as <strong>Severstal</strong>’s<br />
auditor in 1997. According to recent tender offer, which has been<br />
conducted in December 2012, KPMG has been chosen as<br />
<strong>Severstal</strong>’s auditor for 2013-2015 period. Detailed information<br />
about the company’s auditor is shown below:<br />
Auditor name: ZAO KPMG<br />
Legal address: 18/1, Olympiysky prospect, room 3035, Moscow<br />
129110.<br />
Postal address: 10, Presnenskaya Naberezhnaya, Moscow, Russia,<br />
123317.<br />
State<br />
registration:<br />
Membership in<br />
self-regulating<br />
auditors’<br />
organisation:<br />
Registered by the Moscow Registration Chamber<br />
on 25 May 1992, Registration No. 011.585.<br />
Included in the Unified State Register of Legal<br />
Entities on 13 August 2002 by the Moscow<br />
Inter-Regional Tax Inspectorate No.39 of the<br />
Ministry for Taxes and Duties of the Russian<br />
Federation, Registration No. 1027700125628,<br />
Certificate series 77 No. 005721432.<br />
Member of the Non-Commercial Partnership<br />
‘Chamber of Auditors of Russia’. The Principal<br />
Registration Number of the Entry in the State<br />
Register of Auditors and Audit Organisations:<br />
No.10301000804.<br />
Internal Control and Risk Management Systems<br />
The information required by DTR 7.2.5 regarding the Company’s<br />
Internal Control and Risk Management Systems in relation to the<br />
financial reporting process is included in the Risk Management<br />
section below.<br />
<strong>Severstal</strong> Annual Report and accounts 2012
company Overview Strategy Performance Sustainability Governance Financial statements Additional information<br />
108<br />
Risk report<br />
Risk management framework<br />
<strong>Severstal</strong>’s operations are subject to certain risks. Effective risk<br />
management is an essential element of our operations and strategy.<br />
The accurate and timely identification, assessment and management<br />
of risks supports decision making at all management levels and<br />
ensures we will achieve our strategic goals and meet our KPIs.<br />
Our risk management framework is designed to identify, manage<br />
and mitigate the risk of failure to achieve business objectives.<br />
Executive management and managers and employees at all levels<br />
participate in the process of managing risks on a continuing basis,<br />
and perform duties assigned to them within the risk management<br />
process. The Board of Directors and all employees of <strong>Severstal</strong> are<br />
obliged to adhere to the company’s risk policies and standards at<br />
all times during their work.<br />
There is a formalised risk management structure in place, with<br />
clear delineation of roles, responsibilities and accountabilities for<br />
the Board, Audit Committee, Executive Committee and Risk<br />
Management function (a part of the Internal Audit and Risk<br />
Management Department).<br />
The Board of Directors is ultimately responsible for maintaining a<br />
sound risk management and internal control system. The Audit<br />
Committee closely monitors the effectiveness of the risk<br />
management system and internal audit function and obtains<br />
regular risk reports from management.<br />
Our risk management structure includes a Risk Management<br />
Committee that is responsible for implementing our risk<br />
management policy and monitoring the effectiveness of controls<br />
in support of the company’s business objectives. This committee<br />
meets several times a year and can meet more frequently if<br />
required. The committee comprises key vice presidents, the CEOs<br />
of our most important production facilities, and the head of our<br />
risk management function. Risk reports are compiled and<br />
submitted at each Risk Management Committee meeting, after<br />
which the most material risks are reported to the Audit Committee.<br />
The Risk Management function (part of our Internal Audit and Risk<br />
Management Department) is responsible for coordinating risk<br />
identification and assessment processes, implementing risk<br />
management best practice, and internal and external reporting.<br />
Board<br />
Audit<br />
Committee<br />
Risk<br />
Management<br />
Committee<br />
Risk<br />
Management<br />
function<br />
Risk owners<br />
• Assures shareholders that the company has<br />
identified key risks and is successfully managing<br />
them<br />
• Monitors the overall effectiveness of the risk<br />
management system and internal audit function<br />
• Monitors performance of the risk management<br />
system and key risks<br />
• Promotes communication between functional<br />
managers and between management and the<br />
Board<br />
• Preliminarily approves risk management policies<br />
and procedures<br />
• Reviews and approves external and internal risk<br />
reports<br />
• Coordinates risk identification, assessment and<br />
mitigation measures<br />
• Accumulates and processes risk assessment data<br />
• Generates consolidated risk reports<br />
• Identify specific risks and initiate risk<br />
management measures<br />
The key risks factors which are likely to affect our business,<br />
financial position and operational performance as well as<br />
mitigation measures are described below 16 .<br />
<strong>Severstal</strong> Annual Report and accounts 2012<br />
16 This chapter presents only key risks and does not give an exhaustive account of all<br />
risks facing the Company.
company Overview Strategy Performance Sustainability Governance Financial statements Additional information<br />
109<br />
Key risks and uncertainties<br />
Political risks<br />
<strong>Severstal</strong>’s activities are primarily concentrated in Russia, and the<br />
CIS and with additional operations in North America, Europe,<br />
Africa, South America and Asia. <strong>Severstal</strong> has legal entities<br />
registered in various jurisdictions and the overall political climates<br />
in the countries of our operation differ significantly, as do<br />
limitations on business activities and assets expropriation;<br />
confiscation rules; monetary systems and their potential for<br />
negative change; and potential crisis factors. In addition,<br />
governments may establish new trade barriers, which could have a<br />
negative impact on our export or import operations. Other political<br />
risks that could affect our operations include potential conflicts,<br />
terrorist acts, social unrest, and the introduction of a state of<br />
emergency. Although to date none of these have directly affected<br />
our business, they could have an adverse impact on our business,<br />
financial position and operational results.<br />
Mitigating factors:<br />
• The majority of our production facilities and business operations<br />
are located in regions and countries with stable political and<br />
social systems.<br />
• <strong>Severstal</strong>’s investment policy considers regional political risks.<br />
• All our operational and investment decisions imply proper<br />
on-going risk assessment and monitoring. In those countries<br />
experiencing political instability, we undertake additional risk<br />
mitigation measures, including specialised types of insurance<br />
against political risks.<br />
Economic risks<br />
Global economic sustainable recovery forecasts have not been<br />
met: global GDP in 2012 grew by 2.3% which was 1.0 per cent<br />
lower than expected previously, according to The World Bank.<br />
In 2012 US GDP grew by 2.2%, but EU GDP declined by 0.2%.<br />
During 2012, the global economy and steel market were in very<br />
difficult position. Chinese economy slowdown, European sovereign<br />
debt problems, US fiscal cliff tensions, bleak performance of<br />
emerging countries (India, Brazil, Russia) resulted in a sharp fall of<br />
raw material prices, which pulls down steel prices, as well. Central<br />
banks tried to support the economy by liquidity injections in the<br />
form of monetary easing in the USA, Europe, Japan. Many<br />
countries decreased interest policy rates in order to stimulate the<br />
economy, while inflation was under control.<br />
Slow global economic growth could heavily impact the Russian<br />
economy. Recession risk could result in reduced demand for oil and<br />
gas, metals and other exported raw materials; destabilise the<br />
rouble; and spark capital outflow from Russia, along with increased<br />
inflation, production decline, increased unemployment and<br />
increased social risks.<br />
Russian Federal State Statistics Service (Rosstat) estimated<br />
Russian GDP growth of 3.4% in 2012, which was below<br />
expectations. According to Rosstat estimates, Russia’s inflation in<br />
2012 was 6.6%.<br />
Given the large share of oil and oil products in the Russian export<br />
structure, the Russian economy is significantly dependent on price<br />
fluctuations for these commodities. In 2012, the average price of<br />
Urals oil blend, the main Russian export commodity, was US$108/<br />
bbl, which is 1.2% lower than in 2011. Nevertheless Russia finished<br />
the year with self-supporting budget, according to preliminary<br />
calculations of the Ministry of Finance. The Russian Ministry of<br />
Economic Development reduced their forecasts for Russia’s GDP for<br />
2013 in the range of 3.0 to 3.2 per cent due to the escalation of<br />
the financial crisis in the Eurozone, the decline of raw material<br />
prices and the decrease in investments in risk regions. But the<br />
World Bank kept their forecast for Russia’s GDP at the level of 3.6<br />
per cent.<br />
Mitigating factors:<br />
• The geographic diversification of our sales helps to minimise the<br />
negative impact of economic risks. The domestic market is our<br />
primary focus; however, our ability to quickly redirect shipments<br />
provides more flexibility in reacting to external factors, and helps<br />
us to insure against sudden regional crises.<br />
• We monitor the most important advanced indicators of<br />
economic slowdown.<br />
• We are working to develop economic scenarios that will help us<br />
to prepare our management team for possible negative changes<br />
to the external environment.<br />
Market risks<br />
Industry cyclicality and demand fluctuations<br />
Steel demand depends on the economic situations of different<br />
regions and demand in steel-consuming industries. <strong>Severstal</strong> is<br />
highly sensitive to changes in the automotive, building and pipe<br />
industries as these are key steel-consuming industries.<br />
In 2012, the Russian steel consumption grew by an estimated 5%,<br />
according to industry experts, and a similar 3% growth is forecast<br />
for 2013. Domestic steel production reached 71 million tonnes,<br />
3.3% higher than in 2011.<br />
Mitigating factors:<br />
• Domestic market growth allowed <strong>Severstal</strong> to increase sales to<br />
traditional consumers. <strong>Severstal</strong> is promoting its production in<br />
the automotive and pipe segments of the domestic market.<br />
Furthermore, we are pursuing cost and productivity<br />
improvements to improve our competitiveness and strengthen<br />
our ability to withstand general economic cyclicality.<br />
• We are monitoring the global market and are ready to increase<br />
export sales if necessary. In 2009, <strong>Severstal</strong> demonstrated its<br />
ability to redirect commodity flows from domestic to external<br />
markets, leveraging its cost efficient production methods.<br />
<strong>Severstal</strong> Annual Report and accounts 2012
company Overview Strategy Performance Sustainability Governance Financial statements Additional information<br />
110<br />
Risk report<br />
Changes to sale prices<br />
The steel and mining industries are highly susceptible to cyclical<br />
changes to steel prices.<br />
Our operations depend heavily on changes to rolled steel and steel<br />
products prices on both the domestic and world markets.<br />
In 2012, world steel prices continued to decline, starting in the<br />
second quarter 2011. Prices fell by 13.4% in comparison to average<br />
price of 2011. The primary reasons for the price drop were slack on<br />
key markets at the EU recession and crisis, and instability on the<br />
commodity markets. The average price of hot rolled coil in 2012<br />
was US$645/ton.<br />
Mitigating factors:<br />
• We were able to moderate the negative impact of the adverse<br />
economic situation, and to quickly overcome the consequences<br />
of the crisis.<br />
• We made major efforts to manage working capital effectively,<br />
increase operational effectiveness, use raw materials and energy<br />
effectively, increase labour productivity, closely control costs,<br />
focus on customers (quality of production and service), and<br />
increase our production of high-value-added goods whose prices<br />
are less sensitive to economic fluctuations.<br />
• We also strengthened our position in most prospective product<br />
niches, which have preferable competitive conditions and an<br />
attractive supply-demand balance. Our comparatively low<br />
production costs help us to mitigate the risk of steel price<br />
fluctuations.<br />
• To reduce the influence of sharp market fluctuations on our<br />
revenue, management initiated the Foresight project to improve<br />
employee understanding of our markets, and the Early Warning<br />
System to predict short-term price fluctuations three months in<br />
advance. We devote special attention to raw materials prices<br />
forecasting, as this helps us coordinate our purchasing strategy<br />
in line with market trends.<br />
• We closely consider the dynamics of leading indicators which<br />
signal possible future price changes. In certain markets we<br />
diversify our sales commitments between spot market and<br />
contract-based pricing to limit exposure to price volatility.<br />
Fluctuations in raw materials, energy and services prices<br />
<strong>Severstal</strong> requires substantial amounts of raw materials for steel<br />
production, in particular coal and iron ore, alloys and fluxes,<br />
natural gas, electric energy and industrial oxygen.<br />
In 2012, decreased steel demand in the US and EU created slack<br />
in production. Prices fell in comparison to 2011. The low demand<br />
from steel producers negatively affected prices of coking coal, iron<br />
ore and scrap.<br />
In 2012, the price for Australian coking coal decreased by 27% to<br />
US$210/tonne FOB. This was the result of a decreased world<br />
coking coal demand provoked by lower steel production levels. In<br />
2013, coking coal prices are expected to continue to fall. In first<br />
quarter 2013, the contract price of Australian coking coal fell by<br />
another 14% to US$180/tonne FOB.<br />
In 2012, the price of Australian average contract iron ore price fell<br />
to US$131/tonne FOB, a 16% drop compared to 2012. The drop<br />
was provoked by a slowdown in Chinese economy, and reduced<br />
global steel production levels. In first quarter 2013, the contracts<br />
for Australian iron ore were concluded with price of US$108/tonne<br />
FOB, the annual average price of Australian iron ore is expected to<br />
further reduce compared with 2012.<br />
In 2012 scrap prices declined by 15-20% compared to the previous<br />
year, followed by lower steel prices which caused economic<br />
slowdown and steel overcapacity. The bullish trend will continue<br />
this year because of pressure from low raw materials prices. In<br />
2013 scrap prices are expected to decrease by 5-7% year-on-year<br />
followed by lower steel and other raw materials (iron ore, coking<br />
coal) prices. Through the year: in the summer prices would slide<br />
due to comfortable weather conditions for collecting and<br />
delivering scrap with further recovery in autumn as a result of<br />
restocking at mills before the year end.<br />
Supply volumes and the timeliness of their delivery can heavily<br />
impact operations; however, <strong>Severstal</strong> has little control over these<br />
factors. <strong>Severstal</strong>’s activities have been heavily affected by reduced<br />
steel production levels brought on by reduced demand and slight<br />
fluctuations in raw materials and energy prices and high<br />
transportation costs. In addition, among <strong>Severstal</strong>’s contractors<br />
are natural monopolies (electrical energy and natural gas providers<br />
and railroad companies), whose rates are set and adjusted by the<br />
federal government: this could lead to increased prices for gas and<br />
electricity and higher transportation costs where railroad services<br />
are limited.<br />
Mitigating factors:<br />
• We manage sector risks related to the provision of raw materials<br />
and services by establishing long-term mutually advantageous<br />
contracts with key suppliers, optimising purchasing processes<br />
and conducting continuous inventory management. Most of our<br />
purchasing contracts for primary raw materials (pellets, iron ore<br />
and coking coal) are concluded for a period of at least one year.<br />
• High reliance on our own iron ore, coking coal and scrap supplies<br />
helps us to mitigate raw materials price rises.<br />
• Our heavier reliance on Russian suppliers helps us to gain on<br />
lower domestic prices.<br />
Competition risks<br />
During 2012, the global economy and steel market were in a very<br />
difficult position. Chinese economy slowdown, European sovereign<br />
debt problems, US fiscal cliff tensions, bleak performance of<br />
emerging countries (India, Brazil, Russia) resulted in a sharp fall of<br />
raw material prices, which pulls down steel prices, as well. Central<br />
banks tried to support the economy by liquidity injections in the<br />
form of monetary easing in the USA, Europe, Japan. Many<br />
countries decreased interest policy rates in order to stimulate<br />
economy, while inflation was under control.<br />
Low-cost producers could reduce prices in order to gain market<br />
share, and competitors’ M&A deals could affect the competitive<br />
environment. The consolidation of niche-products manufacturers<br />
could create new entry barriers and complicate <strong>Severstal</strong>’s<br />
development in such markets. Artificial barriers set by local<br />
authorities could complicate entrance onto new markets and<br />
increase existing market shares.<br />
<strong>Severstal</strong> Annual Report and accounts 2012
company Overview Strategy Performance Sustainability Governance Financial statements Additional information<br />
111<br />
The main peculiarity of the Russian market is its closed nature,<br />
which is the result of factors such as a weak logistics infrastructure<br />
and strict certification requirements.<br />
Nevertheless, the Russian market is vulnerable to interventions by<br />
external producers of high added-value rolled stock (esp. China).<br />
2008 and the first half of 2010 illustrate this fact: during these<br />
periods Chinese imports occupied more than half of the Russian<br />
high added-value rolled products market. In the second half of<br />
2012, due to declining domestic steel demand, China began to<br />
export cheap steel products around the world, that stepped up the<br />
competition.<br />
The development and appearance of new steel-consuming<br />
technologies potentially provides <strong>Severstal</strong> with more<br />
opportunities. However, competition on these markets has become<br />
increasingly fierce as markets mature.<br />
Increased pressure comes from competition with substitute<br />
products (concrete, plastics, aluminium), which is currently<br />
growing.<br />
Mitigating factors:<br />
• We continue with our Clients Retention project which focuses on<br />
helping us to obtain a better understanding of clients needs,<br />
and improve our corporate image which will help us to more<br />
effectively compete domestically and globally.<br />
• We also continue to diversify our steel products capability in our<br />
major markets, as demonstrated by the recent modernisation<br />
program in North America.<br />
Credit risk<br />
Counterparties’ risks: clients<br />
Our practice of selling products on deferred payment terms<br />
exposes us to credit risks (clients’ default).<br />
Mitigating factors:<br />
• We have developed and implemented policies and procedures to<br />
manage credit risks, including credit committee approval and<br />
on-going credit evaluation of the customer base.<br />
• Credit committee approval is required prior to the sale of<br />
products to key customers under deferred payment terms. When<br />
necessary, we use collateralisation or risk transference<br />
arrangements (for example, bank guarantees from approved<br />
institutions, letters of credit, or credit insurance).<br />
Counterparties’ risks: financial institutions<br />
The bankruptcy or insolvency of any of the banks we work with<br />
could adversely affect our business. Another banking crisis or the<br />
bankruptcy or insolvency of any of the banks at which we hold<br />
funds could result in a loss of income for several days, or affect our<br />
ability to complete banking transactions. Furthermore, any<br />
shortages of funds or other banking disruptions experienced by<br />
our banks could have a material adverse effect on our ability to<br />
execute planned developments or to obtain the financing required<br />
for our planned growth. All the above factors could have a material<br />
adverse effect on our business, financial position, operational<br />
results and future prospects.<br />
Mitigating factors:<br />
• <strong>Severstal</strong> has centralised bank risk management procedures<br />
• In order to minimise the potential risk of bank default, we have<br />
a diverse client base and hold liquid assets in several banks<br />
under flexible conditions.<br />
• <strong>Severstal</strong> cooperates with financial institutions based on credit<br />
risk limits established on a regular basis. These limits are<br />
determined and regularly approved by the committee, according<br />
to internal procedure.<br />
• We regularly monitor the financial standing of banks and the<br />
overall financial environment to foresee defaults and minimise<br />
the potential negative impact.<br />
Interest rate fluctuations<br />
Financial markets volatility and low economic recovery rates could<br />
limit <strong>Severstal</strong>’s access to external creditors, which could affect<br />
current debt refinancing and operational activities financing.<br />
Increased liabilities on loans could negatively affect <strong>Severstal</strong>’s<br />
financial indicators and decrease cost efficiency. Our debt<br />
financing interest rates are either fixed or variable, with a fixed<br />
spread over LIBOR, EURIBOR or MOSPRIME.<br />
Mitigating factors:<br />
• By maintaining a diversified debt portfolio we minimise potential<br />
adverse effects of interest rate fluctuations.<br />
• We also monitor the economic environment closely, and current<br />
debt trends on the capital markets. <strong>Severstal</strong> operates all<br />
necessary tools to convert viable rates to fixed and vice versa in<br />
key loan agreements.<br />
• We can also use our existing cash cushion to repay debts<br />
affected by adverse interest rate changes.<br />
Foreign currency exchange rate fluctuations<br />
<strong>Severstal</strong> is exposed to translation and transactional foreign<br />
currency exchange rate risks. Translation risks arise when assets<br />
and liabilities are translated into currencies other than US dollar<br />
amounts for financial reporting purposes. Transaction risks arise as<br />
a result of payments we make or receive in foreign currencies.<br />
Currently, our operations in foreign currencies balance, i.e.<br />
revenues, expenses and borrowings related to international<br />
operations are all denominated in the same currency. Revenue<br />
from our Russian operations are denominated in roubles, US<br />
dollars and euros, with meaningful fluctuations year on year.<br />
Our expenses are mostly in roubles, and our borrowings are in US<br />
dollars and euros. As we report our financial results in US dollars,<br />
and frequently exchange or translate foreign currency into roubles<br />
or roubles into foreign currencies, exchange rate fluctuations could<br />
have a material adverse effect on our business, financial position,<br />
operational results and future prospects.<br />
Mitigating factors:<br />
• Our existing natural hedge of export sales against financing in<br />
US dollars or euros covers much of the existing rouble-dollar<br />
exposure of our Russian operations. To manage these opposite<br />
cash streams more effectively, we have entered into a number of<br />
cross-currency swaps and forward contracts.<br />
<strong>Severstal</strong> Annual Report and accounts 2012
company Overview Strategy Performance Sustainability Governance Financial statements Additional information<br />
112<br />
Risk report<br />
Credit agreement provisions<br />
Credit agreements signed by <strong>Severstal</strong> include provisions triggering<br />
default in the case of material adverse changes or covenant<br />
violations.<br />
Mitigating factors:<br />
• We regularly monitor possible credit covenant violations on the<br />
basis of our business plan. Beforehand we amend agreement<br />
provisions or get waivers, if required, to prevent defaults and<br />
adverse impacts on our financial statements.<br />
Investment effectiveness<br />
Steel production and mining are capital intensive businesses. We<br />
have undertaken a capital expenditure programme focused on<br />
modernising and developing our existing steel production and<br />
mining facilities. We plan to rely on cash generated from our<br />
operations, and on external financing, to provide the capital<br />
needed for the programme. However, there is no assurance that we<br />
will be able to generate adequate cash from operations, or that<br />
external financing, if necessary, will be available on reasonable<br />
terms.<br />
In addition, our capital expenditure programme is subject to a<br />
variety of potential problems and uncertainties. These include<br />
changes in economic conditions, delays in completion or delivery,<br />
cost overruns, and defects in design or construction, all of which<br />
may create the need for additional cash investment. Fluctuations<br />
in prices or on the loan market could negatively affect investment<br />
project implementation deadlines.<br />
Furthermore, our capital expenditure programme includes plans to<br />
acquire significant amounts of new equipment, including more<br />
advanced technologies. While such new production equipment<br />
and technologies are aimed at increasing the operational<br />
performance of our facilities, there can be no assurance that the<br />
equipment will meet its intended production targets on a timely<br />
basis, or at all, and this could result in reduced production, delays<br />
or additional costs. Moreover, in financing the programme, we may<br />
incur a substantial amount of additional debt, the interest and<br />
principal repayments on which may become a significant drain on<br />
our cash flow. The failure or delay of our capital expenditure<br />
programme, or significant increases in financing costs arising from<br />
programme funding, could have a material adverse effect on our<br />
business, financial position and operational results.<br />
Mitigating factors:<br />
• To mitigate technical and technological risks, we carefully select<br />
construction and equipment installation contractors.<br />
• Under our company-wide development program, we regularly<br />
assess employees and provide necessary training.<br />
• In response to the recent global economic downturn, we reduced<br />
our investment programme, protected our cash position and<br />
focused on the maintenance, repair and modernisation of<br />
equipment and near-deadline projects.<br />
Mergers and acquisitions<br />
<strong>Severstal</strong> has grown rapidly and we intend to pursue opportunities<br />
to grow our operations through further acquisitions. However,<br />
there can be no assurance that we will be able to identify suitable<br />
acquisition targets or successfully integrate acquired companies.<br />
In recent years, we have increased our ownership interests in a<br />
number of companies, and acquired other companies, businesses<br />
and production assets. In particular, <strong>Severstal</strong> Resources has<br />
acquired a number of mining operations. We may consider future<br />
acquisitions of assets or companies that we believe are aligned<br />
with our corporate strategy and financial targets and offer<br />
significant potential synergies. In particular, we are considering<br />
growth opportunities in emerging markets.<br />
The success of past, current and future acquisitions will depend on<br />
our ability to manage the assimilation of the acquired assets or<br />
companies into our operations, despite the inherent difficulties,<br />
such as:<br />
• existing operational inefficiencies<br />
• cultural differences<br />
• personnel redundancies<br />
• incompatibility of equipment and information technology<br />
• production failures or delays<br />
• loss of significant customers<br />
• difficulties with minority shareholders in acquired companies<br />
and their material subsidiaries<br />
• potential disruption of <strong>Severstal</strong> business<br />
• assumption of liabilities relating to the acquired assets or<br />
businesses<br />
• possibility that indemnification agreements with the sellers of<br />
such assets may be unenforceable or insufficient to cover<br />
potential liabilities<br />
• impairment of relationships with employees and counterparties<br />
as a result of difficulties arising from integration<br />
• poor records or internal controls<br />
• difficulties in establishing immediate control over cash flows.<br />
Furthermore, there can be no assurance that we will be able to<br />
achieve the targeted synergies in our operations with recent or<br />
planned acquisitions.<br />
<strong>Severstal</strong> Annual Report and accounts 2012
company Overview Strategy Performance Sustainability Governance Financial statements Additional information<br />
113<br />
Social risks<br />
Our business depends on good relations with employees. A<br />
breakdown in these relations, or restrictive labour and employment<br />
laws, could have a material adverse effect on our operations.<br />
Although we believe that relations with our employees are good,<br />
there can be no assurance that a work slowdown or stoppage will<br />
not occur at one of our operating units or exploration prospects. At<br />
most of our business units, there are collective bargaining<br />
agreements in place with labour unions. Any future work<br />
stoppages, disputes with labour unions or other labour-related<br />
developments or disputes, including renegotiation of collective<br />
bargaining agreements, could result in a decrease in our<br />
production levels. They could also lead to adverse publicity or an<br />
increase in costs, which could have a material adverse effect on<br />
our business, financial position and operational results.<br />
Mitigating factors:<br />
• We devote significant attention to staff support and<br />
development programmes.<br />
• We undertake sociological surveys (employee satisfaction),<br />
create conditions for the development and fulfilment of<br />
employee working potential, and implement social assistance<br />
programmes.<br />
• Employee benefit programmes in different parts of our business<br />
include employee healthcare programmes, maternity and<br />
childcare support, catering and the organisation of recreational<br />
activities, social assistance for retired staff and veterans, staff<br />
education and development, and social benefits for outstanding<br />
employees.<br />
Health, safety and environmental risks<br />
<strong>Severstal</strong> operates industrial facilities that harbour heavy metals or<br />
hazardous substances which may present significant risks to the<br />
health or safety of neighbouring populations and to the<br />
environment. In this respect, we have in the past, and may in the<br />
future, incur liabilities for having caused injury or damage to<br />
persons or property, or for polluting the environment.<br />
Although we have made provisions for such potential liabilities,<br />
there can be no assurance that the amounts covered by such<br />
provisions will be sufficient in the future, due to the intrinsic<br />
uncertainties involved in projecting expenditures and liabilities<br />
relating to health, safety and the environment. Achieving<br />
environmental compliance at sites that are currently in operation,<br />
or that have been decommissioned, entails a risk that could<br />
generate substantial financial costs for us. The competent<br />
authorities have made, are making, or may in the future make,<br />
specific requests that we carry out environmental improvement<br />
works. These include cleaning up and rehabilitating sites, and<br />
controlling emissions at sites where we are currently operating, or<br />
where we have operated in the past. Fulfilling these obligations, we<br />
may incur significant costs, which could have a material adverse<br />
effect on our business, financial position and operational results.<br />
Additional or stricter environmental rules and regulations may<br />
significantly increase the cost of compliance. Our steel-making<br />
plants and mining operations involve potential environmental<br />
problems, including the generation of pollutants and the storage<br />
and disposal of wastes and other hazardous materials. As a result,<br />
we must comply with stringent regulatory requirements<br />
necessitating the commitment of significant financial resources,<br />
and we expect that the global trend towards stricter environmental<br />
laws and regulations will continue. Any significant increase in the<br />
cost of complying with such environmental rules and regulations in<br />
the future could have a material adverse effect on our business,<br />
financial position and operational results.<br />
Mitigating factors:<br />
• We adopted a unified health, safety and environmental (HSE)<br />
protection policy in 2008. This policy includes efficient HSE<br />
management systems and standards, setting objectives and<br />
targets, and identifying, assessing and managing HSE hazards<br />
and risks. It also sets obligations for <strong>Severstal</strong>, such as:<br />
• Strive to work without fatal accidents<br />
• Decrease by 30% accidents with losses of labour capacity<br />
• Decrease accidents with time losses<br />
• Develop and implement effective HSE management systems<br />
• Initiate an HSE internal control system.<br />
• To ensure compliance with the HSE policy <strong>Severstal</strong> will:<br />
• Introduce annual HSE planning<br />
• Promote an HSE culture by implementing HSE audits<br />
• Extend managers’ responsibility for organising and supporting<br />
the HSE system and controls on all levels<br />
• Use leading experience and technologies for prevention and<br />
to decrease our negative impact on the environment<br />
• Initiate staff coaching, adaptation, etc.<br />
• <strong>Severstal</strong> conducted the centralised monitoring and efficiency<br />
analysis of implemented HSE activities. Immediate corrective<br />
measures were taken where deficiencies were identified.<br />
• <strong>Severstal</strong> HSE activities comply with international legislation,<br />
laws and norms in operating regions, provided terms conditions<br />
and client expectations. <strong>Severstal</strong> provides:<br />
• Compulsory insurance of employees against accidents and<br />
professional diseases<br />
• Compulsory insurance of company responsibilities<br />
• Insurance against equipment shutdowns and lost revenues<br />
risks.<br />
<strong>Severstal</strong> Annual Report and accounts 2012
company Overview Strategy Performance Sustainability Governance Financial statements Additional information<br />
114<br />
Risk report<br />
Legislative and regulatory risks<br />
Taxes<br />
Russian tax legislation is amended or corrected annually. Changes<br />
to legislation can both benefit or hinder business. For instance<br />
federal law #227 of 18 July 2011 expanded the list of<br />
interdependent parties and their characteristics, and controlled<br />
deals (deals between interdependent parties and parties equated<br />
to them ).<br />
Current Russian tax legislation provides effective tools for taxpayer<br />
protection, and <strong>Severstal</strong> makes extensive use of these tools.<br />
Internationally, risks could arise for <strong>Severstal</strong> on the domestic<br />
market and on external markets, as the tax legislation of any<br />
country can be changed and amended over time. However, risks<br />
connected with foreign tax legislation changes are partially<br />
mitigated by <strong>Severstal</strong> being registered in Russia for tax purposes.<br />
Near-term exposure within the US is limited as a result of the<br />
existence of considerable tax loss carryforwards.<br />
Property law<br />
Russian property law, in particular in relation to private land<br />
ownership and use, is less developed than that in more developed<br />
market economies (e.g. North America and Europe). In Russia, land<br />
use and title systems are rather complex, and as a result, the<br />
status of titles to land targeted for use of ownership by <strong>Severstal</strong><br />
may be unclear or in doubt. Moreover, we run the risk that our right<br />
to the title or use of our properties may be challenged or<br />
invalidated due to technical errors or defects in title documents.<br />
This lack of developed legislation creates operational uncertainties<br />
in emerging markets, which could hinder <strong>Severstal</strong>’s long-term<br />
planning abilities and prevent us from successfully implementing<br />
our business strategy. Should relevant approvals, consents,<br />
registration certificates or other documents be missing or be found<br />
to be erroneous, we could lose the right to use property. This could<br />
have a material adverse effect on our business, financial position<br />
and operational results.<br />
Administrative sanctions<br />
We have expanded our operations through the acquisition of<br />
companies that are incorporated and operate in Russia, or by<br />
acquiring assets that are located in Russia, such as the mining<br />
companies that currently comprise <strong>Severstal</strong> Resources. Some of<br />
these acquisitions are, or were, subject to the prior approval or<br />
subsequent notification requirements of the Federal Antimonopoly<br />
Service of the Russian Federation (FAS), or its predecessor<br />
agencies. Some of these requirements are worded vaguely, and as<br />
such there can be no assurance that FAS will not challenge our<br />
past compliance, which could result in administrative sanctions,<br />
compulsory divestitures or limitations on our operations. Any such<br />
sanctions, divestitures or limitations would have a material adverse<br />
effect on our business, financial position and operational results.<br />
Licence agreements<br />
Our business depends on the continuing validity of our licences,<br />
the receipt of new licences and our compliance with the terms of<br />
our licences, including subsoil licences for our mining operations in<br />
Russia. Regulatory authorities exercise considerable discretion in<br />
the timing of licence issuing and renewal, and in monitoring<br />
licensees’ compliance with licence terms. The requirements<br />
imposed by these authorities may be costly and time-consuming,<br />
and may result in delays in starting or continuing exploration or<br />
production operations. Moreover, legislation on subsoil rights<br />
remains internally inconsistent and vague, and the acts and<br />
instructions of licensing authorities, and the procedures by which<br />
licences are issued, are often arguably inconsistent with legislation.<br />
In addition, our business outside of Russia also depends on the<br />
continuing validity of licences, the receipt of new licences and<br />
compliance with the terms of such licences, which may involve<br />
uncertainties and additional costs for us. Any or all of these factors<br />
may affect our ability to obtain, maintain or renew the necessary<br />
licences. If we are unable to obtain, maintain or renew the<br />
necessary licences, or can obtain or renew them only with newly<br />
introduced material restrictions, we may be unable to benefit fully<br />
from our reserves, and this could have a material adverse effect on<br />
our business, financial position and operational results.<br />
Mitigating factors:<br />
• We base our activities, Russian and international, on strict<br />
adherence to all applicable laws and regulations (e.g. tax,<br />
customs and currency control). We ensure monitoring and<br />
timely, appropriate reaction to changes, and strive to maintain<br />
constructive dialogue with regulators on issues of interpreting<br />
and implementing laws and regulations.<br />
• In particular, we work with Russian federal and local authorities,<br />
and participate in the Russian Union of Industrialists and<br />
Entrepreneurs and various ad hoc governmental committees.<br />
Our international activities are analysed both by in-house<br />
lawyers and respectable local or international law firms. We<br />
always hold negotiations with government bodies, such as<br />
anti-trust, financial and securities market authorities, in good<br />
faith and in strict compliance with their regulations, to maintain<br />
long-term constructive dialogue.<br />
• <strong>Severstal</strong> business includes different types of activities, some of<br />
them subject to licensing. With regard to organisation and<br />
technology, <strong>Severstal</strong> business processes conform to the highest<br />
standards, and as such there is low risk of the stiffening of<br />
license requirements and conditions.<br />
• It should be noted, that the Russian government has begun<br />
cutting the number of activities subject to licensing, and<br />
simplifying licensing procedures.<br />
• From the above, we could conclude that changes to licensing<br />
requirements or the necessity for additional licensing of several<br />
activities would lead to additional costs on obtaining new<br />
licenses or renewing existing ones. However, related risks are<br />
minimal.<br />
• The risk of necessity to license activities on external markets is<br />
also minimal.<br />
<strong>Severstal</strong> Annual Report and accounts 2012
company Overview Strategy Performance Sustainability Governance Financial statements Additional information<br />
115
company Overview Strategy Performance Sustainability Governance Financial statements Additional information<br />
116
company Overview Strategy Performance Sustainability Governance Financial statements Additional information<br />
117<br />
Financial<br />
statementS<br />
What’s inside<br />
118 Auditors’ Report<br />
120 Consolidated income statements<br />
121 Consolidated statements of<br />
comprehensive income<br />
122 Consolidated statements of financial position<br />
123 Consolidated statements of cash flows<br />
124 Consolidated statements of changes in equity<br />
125 Notes to the consolidated financial statements
company Overview Strategy Performance Sustainability Governance Financial statements Additional information<br />
118<br />
ZAO KPMG<br />
10 Presnenskaya Naberezhnaya<br />
Moscow, Russia 123317<br />
Telephone +7 (495) 937 4477<br />
Fax +7(495) 937 4400/99<br />
Internet www.kpmg.ru<br />
Auditors’ Report<br />
To the Shareholders and Board of Directors<br />
OAO <strong>Severstal</strong><br />
We have audited the accompanying consolidated financial statements of OAO <strong>Severstal</strong> (the “Company”)<br />
and its subsidiaries (the “Group”), which comprise the consolidated statements of financial position as at 31<br />
December 2012, 2011 and 2010, and the consolidated income statements, consolidated statements of<br />
comprehensive income, changes in equity and cash flows for 2012, 2011 and 2010, and notes, comprising a<br />
summary of significant accounting policies and other explanatory information.<br />
Management’s Responsibility for the Сonsolidated Financial Statements<br />
Management is responsible for the preparation and fair presentation of these consolidated financial<br />
statements in accordance with International Financial Reporting Standards, and for such internal control as<br />
management determines is necessary to enable the preparation of consolidated financial statements that<br />
are free from material misstatement, whether due to fraud or error.<br />
Auditors’ Responsibility<br />
Our responsibility is to express an opinion on the fair presentation of these consolidated financial statements<br />
based on our audits. We conducted our audits in accordance with Russian Federal Auditing Standards and<br />
International Standards on Auditing. Those standards require that we comply with ethical requirements and<br />
plan and perform the audit to obtain reasonable assurance about whether the consolidated financial<br />
statements are free from material misstatement.<br />
An audit involves performing procedures to obtain audit evidence about the amounts and disclosures in the<br />
consolidated financial statements. The procedures selected depend on the auditor’s judgment, including the<br />
assessment of the risks of material misstatement of the consolidated financial statements, whether due to<br />
fraud or error. In making those risk assessments, the auditor considers internal control relevant to the entity’s<br />
preparation and fair presentation of the consolidated financial statements in order to design audit<br />
procedures that are appropriate in the circumstances, but not for the purpose of expressing an opinion on the<br />
effectiveness of the entity’s internal control. An audit also includes evaluating the appropriateness of<br />
accounting policies used and the reasonableness of accounting estimates made by management, as well as<br />
evaluating the overall presentation of the consolidated financial statements.<br />
We believe that the audit evidence we have obtained is sufficient and appropriate to express an opinion on<br />
the fair presentation of these consolidated financial statements.<br />
Opinion<br />
In our opinion, the consolidated financial statements present fairly, in all material respects, the financial<br />
position of the Group as at 31 December 2012, 2011 and 2010, and its financial performance and its cash<br />
flows for 2012, 2011 and 2010 in accordance with International Financial Reporting Standards.<br />
Mr. Altukhov K.V., Director,<br />
power of attorney dated 1 October 2010 No. 24/10<br />
ZAO KPMG<br />
4 March 2013<br />
Moscow, Russian Federation<br />
Audited entity: OAO <strong>Severstal</strong><br />
Registered by decree # 1150 of Cherepovets’ council on 24<br />
September 1993.<br />
Registered in the Unified State Register of Legal Entities on 31<br />
July 2002 by the Vologda regional Tax Inspectorate of Ministry<br />
for Taxes and Duties of Russian Federation for Cherepovets,<br />
Registration No. 1023501236901, Certificate series 35 No.<br />
000782100.<br />
30, Mira street, Cherepovets, Vologodskaya oblast, Russia<br />
162608<br />
<strong>Severstal</strong> Annual Report and accounts 2012<br />
Independent auditor: ZAO KPMG, a company incorporated<br />
under the Laws of the Russian Federation, a part of the KPMG<br />
Europe LLP group, and a member firm of the KPMG network of<br />
independent member firms affiliated with KPMG International<br />
Cooperative (“KPMG International”), a Swiss entity.<br />
Registered by the Moscow Registration Chamber on 25 May<br />
1992, Registration No. 011.585.<br />
Entered in the Unified State Register of Legal Entities on 13<br />
August 2002 by the Moscow Inter-Regional Tax Inspectorate<br />
No.39 of the Ministry for Taxes and Duties of the Russian<br />
Federation, Registration No. 1027700125628, Certificate series<br />
77 No. 005721432.<br />
Member of the Non-commercial Partnership “Chamber of<br />
Auditors of Russia”. The Principal Registration Number of the<br />
Entry in the State Register of Auditors and Audit Organisations:<br />
No.10301000804.
company Overview Strategy Performance Sustainability Governance Financial statements Additional information<br />
119
company Overview Strategy Performance Sustainability Governance Financial statements Additional information<br />
120<br />
OAO <strong>Severstal</strong> and subsidiaries<br />
Consolidated income statements<br />
Years ended December 31, 2012, 2011 and 2010<br />
(Amounts expressed in thousands of US dollars, except as otherwise stated)<br />
Year ended December 31,<br />
Note 2012 2011 2010<br />
Revenue<br />
Revenue – third parties 13,915,605 15,573,090 12,756,783<br />
Revenue – related parties 10 188,101 239,310 62,335<br />
4 14,103,706 15,812,400 12,819,118<br />
Cost of sales (10,785,292) (10,903,222) (8,716,766)<br />
Gross profit 3,318,414 4,909,178 4,102,352<br />
General and administrative expenses (754,613) (725,043) (585,043)<br />
Distribution expenses (1,048,395) (1,101,191) (990,727)<br />
Other taxes and contributions (134,266) (145,854) (136,572)<br />
Share of associates’ and joint ventures’ profit 1,993 7,319 20,361<br />
Loss on remeasurement and disposal of financial investments 6 (6,581) (4,652) (146,322)<br />
Loss on disposal of property, plant and equipment and intangible assets (25,962) (20,939) (42,790)<br />
Net other operating income/(expenses) 20,243 (1,461) (15,953)<br />
Profit from operations 1,370,833 2,917,357 2,205,306<br />
(Impairment)/reversal of impairment of non-current assets 7 (54,117) 438 (80,130)<br />
Net other non-operating expenses 8 (70,536) (65,381) (43,599)<br />
Profit before financing and taxation 1,246,180 2,852,414 2,081,577<br />
Interest income 68,169 49,681 100,595<br />
Interest expense (440,938) (436,141) (617,785)<br />
Foreign exchange differences 163,510 (36,980) 109,736<br />
Profit before income tax 1,036,921 2,428,974 1,674,123<br />
Income tax expense 9 (263,485) (466,012) (427,306)<br />
Profit from continuing operations 773,436 1,962,962 1,246,817<br />
Profit/(loss) from discontinued operations 27 46,363 210,773 (1,761,396)<br />
Profit/(loss) for the period 819,799 2,173,735 (514,579)<br />
Attributable to:<br />
shareholders of OAO <strong>Severstal</strong> 761,962 2,034,833 (574,914)<br />
non-controlling interests 57,837 138,902 60,335<br />
Basic weighted average number of shares outstanding during the period<br />
(millions of shares) 26 839.8 1,005.2 1,005.2<br />
Basic earnings/(loss) per share (US dollars) 0.91 2.02 (0.57)<br />
Basic earnings per share – continuing operations (US dollars) 0.87 1.89 1.22<br />
Basic earnings/(loss) per share – discontinued operations (US dollars) 0.04 0.13 (1.79)<br />
Diluted weighted average number of shares outstanding during the period<br />
(millions of shares) 26 846.4 1,005.2 1,005.2<br />
Diluted earnings/(loss) per share (US dollars) 0.91 2.02 (0.57)<br />
Diluted earnings per share – continuing operations (US dollars) 0.88 1.89 1.22<br />
Diluted earnings/(loss) per share – discontinued operations (US dollars) 0.03 0.13 (1.79)<br />
These consolidated financial statements were approved by the Board of Directors on February 28, 2013.<br />
The accompanying notes form an integral part of these consolidated financial statements.<br />
<strong>Severstal</strong> Annual Report and accounts 2012
company Overview Strategy Performance Sustainability Governance Financial statements Additional information<br />
OAO <strong>Severstal</strong> and subsidiaries<br />
Consolidated statements of comprehensive income<br />
Years ended December 31, 2012, 2011 and 2010<br />
(Amounts expressed in thousands of US dollars, except as otherwise stated)<br />
121<br />
Year ended December 31,<br />
2012 2011 2010<br />
Profit/(loss) for the period 819,799 2,173,735 (514,579)<br />
Other comprehensive income/(loss)<br />
Foreign exchange differences 276,553 (407,245) (242,832)<br />
Changes in fair value of cash flow hedges 2,303 1,109 -<br />
Deferred tax on changes in fair value of cash flow hedges (405) (120) -<br />
Changes in fair value of available-for-sale financial assets 4,503 (20,158) 50,876<br />
Deferred tax on changes in fair value of available-for-sale financial assets (380) 4,850 (7,626)<br />
Actuarial losses (32,645) (8,884) (14,886)<br />
Reclassification of the Gold segment’s reserves to profit/(loss) from discontinued operations<br />
(Note 27) (76,089) - -<br />
Other comprehensive income/(loss) for the period, net of tax 173,840 (430,448) (214,468)<br />
Total comprehensive income/(loss) for the period 993,639 1,743,287 (729,047)<br />
Attributable to:<br />
shareholders of OAO <strong>Severstal</strong> 921,155 1,628,462 (801,730)<br />
non-controlling interests 72,484 114,825 72,683<br />
The accompanying notes form an integral part of these consolidated financial statements.<br />
<strong>Severstal</strong> Annual Report and accounts 2012
company Overview Strategy Performance Sustainability Governance Financial statements Additional information<br />
122<br />
OAO <strong>Severstal</strong> and subsidiaries<br />
Consolidated statements of financial position<br />
December 31, 2012, 2011 and 2010<br />
(Amounts expressed in thousands of US dollars, except as otherwise stated)<br />
December 31,<br />
Note 2012 2011 2010<br />
Assets<br />
Current assets:<br />
Cash and cash equivalents 12 1,726,275 1,863,538 2,012,662<br />
Short-term bank deposits 13 - - 12,690<br />
Short-term financial investments 14 23,778 10,500 27,463<br />
Trade accounts receivable 15 1,040,567 1,219,961 967,837<br />
Accounts receivable from related parties 11 15,468 27,349 12,359<br />
Restricted financial assets - - 41,313<br />
Inventories 16 2,352,898 2,519,154 2,369,134<br />
VAT recoverable 214,419 193,885 279,626<br />
Income tax recoverable 21,169 90,916 39,578<br />
Other current assets 17 302,120 327,163 298,183<br />
Assets held for sale 27 - 2,677,310 3,509,882<br />
Total current assets 5,696,694 8,929,776 9,570,727<br />
Non-current assets:<br />
Long-term financial investments 18 108,060 182,262 204,542<br />
Investments in associates and joint ventures 19 316,503 301,315 158,564<br />
Property, plant and equipment 20 8,462,711 7,463,394 7,299,849<br />
Intangible assets 21 820,935 770,454 1,930,942<br />
Restricted financial assets 32,970 22,638 61,714<br />
Deferred tax assets 9 100,796 99,651 103,777<br />
Other non-current assets 168,546 140,301 78,266<br />
Total non-current assets 10,010,521 8,980,015 9,837,654<br />
Total assets 15,707,215 17,909,791 19,408,381<br />
Liabilities and shareholders’ equity<br />
Current liabilities:<br />
Trade accounts payable 1,057,621 1,115,110 897,389<br />
Accounts payable to related parties 11 36,234 1,583,031 16,717<br />
Short-term debt finance 22 1,382,128 1,185,467 1,423,551<br />
Income taxes payable 16,604 28,086 41,230<br />
Other taxes and social security payable 152,590 141,353 156,078<br />
Dividends payable 86,538 111,208 17,131<br />
Other current liabilities 23 637,947 655,420 554,577<br />
Liabilities related to assets held for sale 27 - 550,123 3,272,354<br />
Total current liabilities 3,369,662 5,369,798 6,379,027<br />
Non-current liabilities:<br />
Long-term debt finance 22 4,327,412 4,790,631 4,722,926<br />
Deferred tax liabilities 9 338,078 287,126 515,071<br />
Retirement benefit liabilities 24 201,552 161,734 164,555<br />
Other non-current liabilities 25 255,268 233,179 277,149<br />
Total non-current liabilities 5,122,310 5,472,670 5,679,701<br />
Equity:<br />
Share capital 26 2,752,728 3,311,288 3,311,288<br />
Treasury shares (235,657) (1,586,293) (26,303)<br />
Additional capital 315,922 1,165,530 1,165,530<br />
Foreign exchange differences (411,658) (642,228) (297,219)<br />
Retained earnings 4,767,325 4,386,461 2,805,232<br />
Other reserves 5,800 44,738 76,411<br />
Total equity attributable to shareholders of OAO <strong>Severstal</strong> 7,194,460 6,679,496 7,034,939<br />
Non-controlling interests 20,783 387,827 314,714<br />
Total equity 7,215,243 7,067,323 7,349,653<br />
Total equity and liabilities 15,707,215 17,909,791 19,408,381<br />
The accompanying notes form an integral part of these consolidated financial statements.<br />
<strong>Severstal</strong> Annual Report and accounts 2012
company Overview Strategy Performance Sustainability Governance Financial statements Additional information<br />
OAO <strong>Severstal</strong> and subsidiaries<br />
Consolidated statements of cash flows<br />
Years ended December 31, 2012, 2011 and 2010<br />
(Amounts expressed in thousands of US dollars, except as otherwise stated)<br />
123<br />
Year ended December 31,<br />
2012 2011 2010<br />
Operating activities:<br />
Profit before financing and taxation 1,246,180 2,852,414 2,081,577<br />
Adjustments to reconcile profit to cash generated from operations:<br />
Depreciation and amortization 726,045 646,821 615,979<br />
Impairment/(reversal of impairment) of non-current assets (Note 7) 54,117 (438) 80,130<br />
Movements in provision for inventories, receivables and other provisions 128,333 34,295 9,684<br />
Loss on disposal of property, plant and equipment and intangible assets 25,962 20,939 42,790<br />
Gain on disposal of subsidiaries and associates (Note 28) (9,873) (21,033) -<br />
Loss on remeasurement and disposal of financial investments (Note 6) 6,581 4,652 146,322<br />
Share of associates’ and joint ventures’ results less dividends from associates and joint ventures 6,839 16,176 (8,661)<br />
Changes in operating assets and liabilities:<br />
Trade accounts receivable 228,989 (280,836) (156,036)<br />
Amounts receivable from related parties 1,340 (59,578) 15,001<br />
VAT recoverable (39,866) 42,708 (48,884)<br />
Inventories 153,922 (535,842) (431,073)<br />
Trade accounts payable (155,580) 272,951 130,238<br />
Amounts payable to related parties (198) 11,290 197<br />
Other taxes and social security payable 7,841 22,882 22,611<br />
Other non-current liabilities (8,342) 3,335 (621)<br />
Assets held for sale - 7,242 (3,378)<br />
Net other changes in operating assets and liabilities 2,035 94,406 (94,695)<br />
Cash generated from operations 2,374,325 3,132,384 2,401,181<br />
Interest paid (424,322) (441,295) (551,884)<br />
Income tax paid (191,391) (514,150) (309,983)<br />
Net cash from operating activities – continuing operations 1,758,612 2,176,939 1,539,314<br />
Net cash (used in)/from operating activities – discontinued operations (8,253) 402,496 (280,140)<br />
Net cash from operating activities 1,750,359 2,579,435 1,259,174<br />
Investing activities:<br />
Additions to property, plant and equipment (1,336,450) (1,609,493) (1,011,870)<br />
Additions to intangible assets (111,729) (106,722) (63,552)<br />
Net decrease/(increase) in short-term bank deposits - 13,150 (46,661)<br />
Additions to financial investments and associates (103,920) (40,619) (211,125)<br />
Net cash outflow on acquisitions of subsidiaries (Note 28) - - (7,535)<br />
Net cash inflow from disposals of subsidiaries (Note 28) - 96,994 118,647<br />
Proceeds from disposal of property, plant and equipment 8,762 16,722 5,910<br />
Proceeds from disposal of financial investments 364,262 7,892 169,430<br />
Interest received 105,825 44,236 96,889<br />
Dividends received 13,742 28,435 -<br />
Cash used in investing activities – continuing operations (1,059,508) (1,549,405) (949,867)<br />
Cash used in investing activities – discontinued operations (42,518) (352,115) (549,399)<br />
Cash used in investing activities (1,102,026) (1,901,520) (1,499,266)<br />
Financing activities:<br />
Proceeds from debt finance 2,825,787 2,000,414 3,478,424<br />
Repayment of debt finance (3,098,195) (2,010,250) (3,218,308)<br />
Repayments under lease obligations (4,542) (8,020) (4,323)<br />
Dividends paid (344,396) (380,162) (130,068)<br />
Repurchase of issued shares (19,874) - -<br />
Acquisitions of non-controlling interests (193,883) (3,020) (113,297)<br />
Disposal of non-controlling interests - - 5,744<br />
Contributions from non-controlling interests - 13,610 -<br />
Cash (used in)/from financing activities – continuing operations (835,103) (387,428) 18,172<br />
Cash used in financing activities – discontinued operations - (151,626) (306,053)<br />
Cash used in financing activities (835,103) (539,054) (287,881)<br />
Effect of exchange rates on cash and cash equivalents 7,339 (70,852) (104,719)<br />
Net (decrease)/increase in cash and cash equivalents (179,431) 68,009 (632,692)<br />
Less change in cash and cash equivalents of discontinued operations 42,168 - -<br />
Less cash and cash equivalents of discontinued operations and assets held for sale at the end of<br />
the period - (217,133) (208,022)<br />
Cash and cash equivalents at beginning of the period 1,863,538 2,012,662 2,853,376<br />
Cash and cash equivalents at end of the period 1,726,275 1,863,538 2,012,662<br />
The accompanying notes form an integral part of these consolidated financial statements.<br />
<strong>Severstal</strong> Annual Report and accounts 2012
company Overview Strategy Performance Sustainability Governance Financial statements Additional information<br />
124<br />
OAO <strong>Severstal</strong> and subsidiaries<br />
Consolidated statements of changes in equity<br />
Years ended December 31, 2012, 2011 and 2010<br />
(Amounts expressed in thousands of US dollars, except as otherwise stated)<br />
Attributable to the shareholders of OAO <strong>Severstal</strong> Non-controlling interests Total<br />
Share<br />
capital<br />
Treasury<br />
shares<br />
Additional<br />
capital<br />
Foreign exchange<br />
differences<br />
Retained<br />
earnings<br />
Other<br />
reserves<br />
Total<br />
Balances at December 31, 2009 3,311,288 (26,303) 1,165,530 (52,478) 3,436,270 43,600 7,877,907 498,432 8,376,339<br />
Loss for the period - - - - (574,914) - (574,914) 60,335 (514,579)<br />
Foreign exchange differences - - - (244,741) - - (244,741) 1,909 (242,832)<br />
Other comprehensive (loss)/income - - - - (14,886) 37,242 22,356 13,634 35,990<br />
Deferred tax on other comprehensive (loss)/income - - - - - (4,431) (4,431) (3,195) (7,626)<br />
Total comprehensive (loss)/income for the period (244,741) (589,800) 32,811 (801,730) 72,683 (729,047)<br />
Dividends - - - - (140,963) - (140,963) - (140,963)<br />
Effect of acquisitions and disposals without a change in control - - - - 99,725 - 99,725 (550,796) (451,071)<br />
Effect of acquisitions and disposals with a change in control - - - - - - - 294,395 294,395<br />
Balances at December 31, 2010 3,311,288 (26,303) 1,165,530 (297,219) 2,805,232 76,411 7,034,939 314,714 7,349,653<br />
Profit for the period - - - - 2,034,833 - 2,034,833 138,902 2,173,735<br />
Foreign exchange differences - - - (387,822) - - (387,822) (19,423) (407,245)<br />
Other comprehensive loss - - - - (8,661) (13,297) (21,958) (5,975) (27,933)<br />
Deferred tax on other comprehensive loss - - - - - 3,409 3,409 1,321 4,730<br />
Total comprehensive (loss)/income for the period (387,822) 2,026,172 (9,888) 1,628,462 114,825 1,743,287<br />
Dividends - - - - (469,434) - (469,434) - (469,434)<br />
Gold segment separation (Note 27) - (1,559,990) - - - - (1,559,990) - (1,559,990)<br />
Effect of acquisitions without a change in control - - - - (9,228) - (9,228) (41,712) (50,940)<br />
Effect of disposals with a change in control - - - 42,813 33,719 (21,785) 54,747 - 54,747<br />
Balances at December 31, 2011 3,311,288 (1,586,293) 1,165,530 (642,228) 4,386,461 44,738 6,679,496 387,827 7,067,323<br />
Profit for the period - - - - 761,962 - 761,962 57,837 819,799<br />
Foreign exchange differences - - - 261,700 - - 261,700 14,853 276,553<br />
Other comprehensive loss - - - (31,130) (32,439) (38,153) (101,722) (206) (101,928)<br />
Deferred tax on other comprehensive loss - - - - - (785) (785) - (785)<br />
Total comprehensive income/(loss) for the period 230,570 729,523 (38,938) 921,155 72,484 993,639<br />
Dividends - - - - (311,921) - (311,921) - (311,921)<br />
Repurchase of issued shares (Note 26) - (20,480) - - - - (20,480) - (20,480)<br />
Cancellation of shares (Note 26) (558,560) 1,474,965 (916,405) - - - - - -<br />
Issue of convertible bonds (Note 22) - - 66,797 - - - 66,797 - 66,797<br />
Gold segment separation (Note 27) - (103,849) - - - - (103,849) (274,892) (378,741)<br />
Effect of acquisitions without a change in control - - - - (36,738) - (36,738) (164,636) (201,374)<br />
Balances at December 31, 2012 2,752,728 (235,657) 315,922 (411,658) 4,767,325 5,800 7,194,460 20,783 7,215,243<br />
The accompanying notes form an integral part of these consolidated financial statements.<br />
<strong>Severstal</strong> Annual Report and accounts 2012
company Overview Strategy Performance Sustainability Governance Financial statements Additional information<br />
125<br />
OAO <strong>Severstal</strong> and subsidiaries<br />
Notes to the consolidated financial statements<br />
for the years ended December 31, 2012, 2011 and 2010<br />
(Amounts expressed in thousands of US dollars, except as otherwise stated)<br />
1. Operations<br />
These consolidated financial statements of OAO <strong>Severstal</strong> and subsidiaries comprise the parent company, OAO <strong>Severstal</strong> (‘<strong>Severstal</strong>’ or<br />
‘the Parent Company’) and its subsidiaries (collectively ‘the Group’) as listed in Note 28.<br />
<strong>Severstal</strong> began operations on August 24, 1955 and completed the development of an integrated iron and steel mill in Cherepovets<br />
during February 1959 when the first steel was rolled. On September 24, 1993, as a part of the Russian privatization program, <strong>Severstal</strong><br />
was registered as a Joint Stock Company (‘OAO’) and privatized. Through participating in <strong>Severstal</strong>’s privatization auctions and other<br />
purchases, Alexey Mordashov (the ‘Majority Shareholder’) had purchased shares in <strong>Severstal</strong> such that as at December 31, 2012 he<br />
controlled indirectly 79.17% of <strong>Severstal</strong>’s share capital (at December 31, 2011 – 82.94%; at December 31, 2010 – 77.98% and had an<br />
option to purchase another 4.96%).<br />
<strong>Severstal</strong>’s global depositary receipts (GDRs) have been quoted on the London Stock Exchange since November 2006. <strong>Severstal</strong>’s shares<br />
are quoted on the Moscow Exchange (‘MICEX’). <strong>Severstal</strong>’s registered office is located at Ul. Mira 30, Cherepovets, Russia.<br />
The Group comprises the following segments:<br />
• <strong>Severstal</strong> Resources (formerly Steel Resources) – this segment comprises two iron ore complexes, Karelsky Okatysh and Olcon in<br />
northwest Russia, and two coal mining complexes, Vorkutaugol in northwest Russia and PBS Coals Limited located in the USA.<br />
• Gold (discontinued, Note 27) – this segment comprised the extraction and refining facilities that were located in the Russian Federation,<br />
Burkina Faso, Guinea and Kazakhstan which was classified as held for sale and discontinued operations as at December 31, 2011 and<br />
separated in 2012.<br />
• <strong>Severstal</strong> Russian Steel (formerly Russian Steel) – this segment consists primarily of the Group’s steel production and high-grade<br />
automotive galvanizing facilities in Cherepovets; rolling mill 5000 in Kolpino; a large-diameter pipe mill in Izhora, all in northwest<br />
Russia; metalware plants located in Russia, Ukraine and Italy; a ferrous scrap metal recycling business operating in northwest and<br />
central Russia, as well as various worldwide supporting functions for trading, maintenance and transportation.<br />
• <strong>Severstal</strong> International (formerly <strong>Severstal</strong> North America) – this segment includes an integrated iron and steel mill, <strong>Severstal</strong> Dearborn<br />
LLC, in the Midwest region; a mini-mill, <strong>Severstal</strong> Columbus LLC, in the southeast of the USA. The <strong>Severstal</strong> International segment also<br />
included three integrated iron and steel mills: <strong>Severstal</strong> Sparrows Point LLC, in the South Atlantic located on the East Coast of the USA,<br />
<strong>Severstal</strong> Wheeling Inc (formerly the Esmark group of companies) in the Midwest region of the USA, <strong>Severstal</strong> Warren LLC (formerly<br />
WCI Steel Inc) in the Midwest region of the USA and a coking coal production facility, Mountain State Carbon LLC located on the<br />
border of the South and Midwest regions of the USA, which were classified as held for sale and discontinued operations as at December<br />
31, 2010 and disposed in 2011 (Note 27).<br />
• Lucchini (discontinued, Note 27) – this segment included two integrated steel producers in Italy, four electric furnace based steel plants<br />
in France and several processing plants and joint ventures in Italy. All Lucchini segment assets were combined into the Piombino and<br />
Ascometal business units based on geographical location (Italy and France, respectively). Products of the segment included rails, wire<br />
rod, special and high quality bars and commercial slabs. The segment also included a distribution network serving both business units<br />
from locations primarily in Western Europe and an engineering research center located in France.<br />
A segmental analysis of the consolidated statements of financial position and consolidated income statements is given in Note 29.<br />
Economic environment<br />
A large part of the Group is based in the Russian Federation and is consequently exposed to the economic and political effects of the<br />
policies adopted by the Russian government. These conditions and future policy changes could affect the operations of the Group and<br />
the realization and settlement of its assets and liabilities.<br />
International sales of rolled steel from the Group’s Russian operations have been the subject of several anti-dumping investigations. The<br />
Group has taken steps to address the concerns of such investigations and participates actively in their resolution. A brief description of<br />
protective measures effective at <strong>Severstal</strong>’s key export markets is given below:<br />
• Exports of hot-rolled coils and thin sheets from Russia to the USA are subject to annual quotas and minimum prices issued quarterly by<br />
the US Department of Commerce;<br />
• Exports of hot-rolled plates from Russia to the USA are subject to minimum prices established based on the producer’s actual cost and<br />
profit on the domestic market. <strong>Severstal</strong> is the first and currently only Russian company, for which, since September 2005, the hot-rolled<br />
plates market is open.<br />
In the past years the European Union (‘EU’) market was also protected by quotas, however, on August 22, 2012 the Russian Federation<br />
acceded to the World Trade Organization (‘WTO’). Therefore beginning from August 23, 2012, there are no quantitative restrictions<br />
against import of certain steel products originating from the Russian Federation into the EU. Despite the Russian Federation accession to<br />
the WTO, the risk of new trade restrictions in the EU against the Russian Federation steel producers persists in the long-term.<br />
<strong>Severstal</strong> Annual Report and accounts 2012
company Overview Strategy Performance Sustainability Governance Financial statements Additional information<br />
OAO <strong>Severstal</strong> and subsidiaries<br />
Notes to the consolidated financial statements<br />
for the years ended December 31, 2012, 2011 and 2010<br />
(Amounts expressed in thousands of US dollars, except as otherwise stated)<br />
2. Basis for preparation of the consolidated financial statements<br />
126<br />
Statement of compliance<br />
These consolidated financial statements are prepared in accordance with International Financial Reporting Standards (‘IFRS’) as issued<br />
by the International Accounting Standards Board.<br />
The Group additionally prepared IFRS consolidated financial statements presented in Russian rubles and in Russian language in<br />
accordance with the Federal Law No. 208 – FZ ‘On consolidated financial reporting’.<br />
Basis of measurement<br />
The consolidated financial statements are prepared on the historic cost basis except for financial instruments at fair value through profit<br />
and loss and available-for-sale financial assets stated at fair value.<br />
The Group’s statutory financial records are maintained in accordance with the legislative requirements of the countries in which the<br />
individual entities are located, which differ in certain respects from IFRS. The accounting policies applied in the preparation of these<br />
consolidated financial statements are set out in Note 3.<br />
Critical accounting judgments, estimates and assumptions<br />
Preparation of the consolidated financial statements in accordance with IFRS requires the Group’s management to make estimates and<br />
assumptions that affect the reported amounts of assets and liabilities and disclosure of contingent assets and liabilities at the date of the<br />
financial statements, and the reported amounts of revenues and expenses during the reporting period. The determination of estimates<br />
requires judgments which are based on historical experience, current and expected economic conditions, and other available information.<br />
Actual results could differ from those estimates.<br />
The most significant areas requiring the use of management estimates and assumptions relate to:<br />
• useful lives of property, plant and equipment;<br />
• impairment of assets;<br />
• allowances for doubtful debts, obsolete and slow-moving inventories;<br />
• decommissioning liability;<br />
• retirement benefit liabilities;<br />
• litigations; and<br />
• deferred income tax assets.<br />
Useful lives of property, plant and equipment<br />
The Group assesses the remaining useful lives of items of property, plant and equipment at least at each financial year-end and, if<br />
expectations differ from previous estimates, the changes are accounted for as a change in an accounting estimate in accordance with<br />
IAS 8 “Accounting Policies, Changes in Accounting Estimates and Errors”. These estimates may have a material impact on the amount of<br />
the carrying values of property, plant and equipment and on depreciation expense for the period.<br />
Impairment of assets<br />
The Group reviews the carrying amount of its tangible and intangible assets to determine whether there is any indication that those<br />
assets are impaired. In making the assessments for impairment, assets that do not generate independent cash flows are allocated to an<br />
appropriate cash-generating unit. Subsequent changes to the cash-generating unit allocation or to the timing of cash flows could impact<br />
the carrying value of the respective assets.<br />
Allowance for doubtful debts<br />
The Group makes allowance for doubtful receivables to account for estimated losses resulting from the inability of customers to make<br />
required payments. When evaluating the adequacy of an allowance for doubtful debts, management bases its estimates on the current<br />
overall economic conditions, the ageing of accounts receivable balances, historical write-off experience, customer creditworthiness and<br />
changes in payment terms. Changes in the economy, industry or specific customer conditions may require adjustments to the allowance<br />
for doubtful accounts recorded in the consolidated financial statements.<br />
Allowance for obsolete and slow-moving inventories<br />
The Group makes allowance for obsolete and slow-moving raw materials and spare parts. In addition, certain finished goods of the Group<br />
are carried at net realizable value. Estimates of net realizable value of finished goods are based on the most reliable evidence available at<br />
the time the estimates are made. These estimates take into consideration fluctuations of price or cost directly relating to events occurring<br />
subsequent to the end of the reporting period to the extent that such events confirm conditions existing at the end of the period.<br />
<strong>Severstal</strong> Annual Report and accounts 2012
company Overview Strategy Performance Sustainability Governance Financial statements Additional information<br />
127<br />
OAO <strong>Severstal</strong> and subsidiaries<br />
Notes to the consolidated financial statements<br />
for the years ended December 31, 2012, 2011 and 2010<br />
(Amounts expressed in thousands of US dollars, except as otherwise stated)<br />
Decommissioning liability<br />
The Group reviews its decommissioning liability, representing site restoration provisions, at each reporting date and adjusts it to reflect<br />
the current best estimate in accordance with IFRIC 1 “Changes in Existing Decommissioning, Restoration and Similar Liabilities”. The<br />
amount recognized as a provision is the best estimate of the expenditures required to settle the present obligation at the reporting date<br />
based on the requirements of the current legislation of the country where the respective operating assets are located. The risks and<br />
uncertainties that inevitably surround many events and circumstances are taken into account in reaching the best estimate of a provision.<br />
Considerable judgment is required in forecasting future site restoration costs. Future events that may affect the amount required to settle<br />
an obligation are reflected in the amount of a provision when there is sufficient objective evidence that they will occur.<br />
Retirement benefit liabilities<br />
The Group uses an actuarial valuation method for measurement of the present value of post-employment benefit obligations and related<br />
current service cost. This involves the use of demographic assumptions about the future characteristics of the current and former<br />
employees who are eligible for benefits (mortality, both during and after employment, rates of employee turnover, disability and early<br />
retirement, etc.) as well as financial assumptions (discount rate, future salary and benefit levels, etc.).<br />
Litigations<br />
The Group exercises judgment in measuring and recognizing provisions and the exposure to contingent liabilities related to pending<br />
litigations or other outstanding claims subject to negotiated settlement, mediation, arbitration or government regulation, as well as other<br />
contingent liabilities. Judgment is necessary in assessing the likelihood that a pending claim will succeed, or liability will arise, and to<br />
quantify the possible range of the final settlement. Because of the inherent uncertainties in this evaluation process, actual losses may be<br />
different from the originally estimated provision. These estimates are subject to change as new information becomes available, primarily<br />
with the support of internal specialists or with the support of outside consultants. Revisions to the estimates may significantly affect<br />
future operating results.<br />
Deferred income tax assets<br />
Deferred tax assets are reviewed at each reporting date and reduced to the extent that it is no longer probable that sufficient taxable<br />
profit will be available to allow all or part of the deferred tax asset to be utilized. The estimation of that probability includes judgments<br />
based on the expected performance. Various factors are considered to assess the probability of the future utilization of deferred tax<br />
assets, including past operating results, operational plans, expiration of tax losses carried forward, and tax planning strategies. If actual<br />
results differ from that estimates or if these estimates must be adjusted in future periods, the financial position, results of operations and<br />
cash flows may be negatively affected. In the event that the assessment of future utilization of deferred tax assets must be reduced, this<br />
reduction will be recognized in the income statement.<br />
Functional and presentation currency<br />
The presentation currency of these consolidated financial statements is the US dollar.<br />
The functional currency is determined separately for each of the Group’s entities. For most Russian entities the functional currency is the<br />
Russian ruble. The functional currency of the Group’s entities located in North America is the US dollar. The functional currency of the<br />
majority of the Group’s entities located in Western Europe is the Euro.<br />
The translation into the presentation currency is made as follows:<br />
• all assets and liabilities, both monetary and non-monetary, are translated at the closing exchange rates at the dates of each statement<br />
of financial position presented;<br />
• all income and expenses in each income statement are translated at the average exchange rates for the periods presented; and<br />
• all resulting exchange differences are recognized as a separate component in other comprehensive income.<br />
Any conversion of amounts into US dollars should not be construed as a representation that such amounts have been, could be, or will be<br />
in the future, convertible into US dollars at the exchange rates used, or at any other exchange rate.<br />
Adoption of amended and revised Standards and Interpretations<br />
A number of amendments to Standards and Interpretations were adopted for the year ended December 31, 2012, and have been applied<br />
in these consolidated financial statements.<br />
Standards and Interpretations<br />
Effective for annual periods<br />
beginning on or after<br />
IAS 12 (Amended) «Income taxes» January 1, 2012<br />
IFRS 1 (Amended) «First-time adoption of international financial reporting standards» July 1, 2011<br />
IFRS 7 (Amended) «Financial instruments: disclosures» July 1, 2011<br />
IFRIC 20 «Stripping costs in the production phase of a surface mine» January 1, 2013<br />
<strong>Severstal</strong> Annual Report and accounts 2012
company Overview Strategy Performance Sustainability Governance Financial statements Additional information<br />
OAO <strong>Severstal</strong> and subsidiaries<br />
Notes to the consolidated financial statements<br />
for the years ended December 31, 2012, 2011 and 2010<br />
(Amounts expressed in thousands of US dollars, except as otherwise stated)<br />
128<br />
Amended IAS 12 Income taxes provided an exception to the general principles of IAS 12 for investment property measured using the fair<br />
value model. For the purpose of measuring deferred tax, the amendments introduced a rebuttable presumption that the carrying amount<br />
of such an asset will be recovered entirely through sale. The amendment also introduced similar guidance for measuring deferred tax on<br />
non-depreciable assets measured using the revaluation model in IAS 16. These requirements were previously included into SIC 21 Income<br />
taxes-recovery of revalued non-depreciable assets. Amended IAS 12 did not have a significant effect on the Group’s consolidated financial<br />
statements.<br />
IFRS 1 First-time Adoption of International Financial Reporting Standards replaced references to a fixed date of ‘1 January 2004’ with<br />
‘the date of transition to IFRSs’, thus eliminating the need for companies adopting IFRSs for the first time to reconstruct transactions that<br />
occurred before the date of transition to IFRSs. The standard also provided guidance on how an entity should present financial<br />
statements in accordance with IFRSs after a period when its functional currency was subject to severe hyperinflation. Amended IFRS 1 did<br />
not have a significant effect on the Group’s consolidated financial statements.<br />
IFRS 7 Financial Instruments: disclosures introduces additional disclosure requirements for transfers of financial assets in situations<br />
where assets are not derecognized in their entirety or where the assets are derecognized in their entirety but a continuing involvement in<br />
the transferred assets is retained. The amendments help users of financial statements evaluate the risk exposures relating to transfers of<br />
financial assets and the effect of those risks on an entity’s financial position and promote transparency in the reporting of transfer<br />
transactions, particularly those that involve securitization of financial assets. Amended IFRS 7 did not have a significant effect on the<br />
Group’s consolidated financial statements.<br />
In January 2012, the Group early adopted of IFRIC 20 Stripping costs in the production phase of a surface mine. IFRIC 20 addresses<br />
accounting for stripping costs that are incurred in a surface mining activity during the production phase (‘production stripping costs’).<br />
Under the interpretation, production stripping costs that provide access to ore to be mined in the future are capitalized as non-current<br />
assets if the component of the ore body for which access has been improved can be identified and future benefits arising from the<br />
improved access are both probable and reliably measurable. The interpretation also addresses how capitalized production stripping costs<br />
should be depreciated and how capitalized amounts should be allocated between inventory and the stripping activity asset. IFRIC 20<br />
requires prospective application to production stripping costs incurred on or after the beginning of the earliest period presented.<br />
The effect of the early adoption of IFRIC 20 is presented below:<br />
Year ended December 31, 2012<br />
Increase in property, plant and equipment 47,406<br />
Decrease in cost of sales 47,406<br />
New accounting pronouncements<br />
A number of new Standards and amendments to Standards were not yet effective for the year ended December 31, 2012, and have not<br />
been applied in these consolidated financial statements.<br />
Standards<br />
Effective for annual periods<br />
beginning on or after<br />
IAS 1 (Amended) “Presentation of financial statements” July 1, 2012, January 1, 2013<br />
IAS 16 (Amended) “Property, Plant and Equipment” January 1, 2013<br />
IAS 27 (Amended) “Separate financial statements” January 1, 2013, January 1, 2014<br />
IAS 28 (Amended) “Investments in associates and joint ventures” January 1, 2013<br />
IAS 32 (Amended) “Financial instruments: presentation” January 1, 2013, January 1, 2014<br />
IAS 34 (Amended) “Interim Financial Reporting” January 1, 2013<br />
IFRS 1 (Amended) “First-time adoption of international financial reporting standards” January 1, 2013<br />
IFRS 7 (Amended) “Financial instruments: disclosure” January 1, 2013<br />
IFRS 9 (Amended) “Financial instruments” January 1, 2015<br />
IFRS 10 (Amended) “Consolidated financial statements” January 1, 2013, January 1, 2014<br />
IFRS 11 (Amended) “Joint arrangements” January 1, 2013<br />
IFRS 12 (Amended) “Disclosure of interests in other entities” January 1, 2013, January 1, 2014<br />
IFRS 13 “Fair value measurement” January 1, 2013<br />
The adoption of the pronouncements listed above is not expected to have a significant impact on the Group’s consolidated financial<br />
statements in future periods except for those discussed below.<br />
<strong>Severstal</strong> Annual Report and accounts 2012
company Overview Strategy Performance Sustainability Governance Financial statements Additional information<br />
129<br />
OAO <strong>Severstal</strong> and subsidiaries<br />
Notes to the consolidated financial statements<br />
for the years ended December 31, 2012, 2011 and 2010<br />
(Amounts expressed in thousands of US dollars, except as otherwise stated)<br />
Amended IAS 1 Presentation of Financial Statements requires a separate presentation of items of other comprehensive income that<br />
may be reclassified to profit or loss in the future from those that will never be reclassified to profit or loss. Amended IAS 1 will be effective<br />
for annual periods beginning on or after 1 July, 2012 and requires retrospective application.<br />
Amended IAS 34 Interim Financial Reporting requires a separate presentation of total assets and liabilities for a particular reportable<br />
segment if such amounts are regularly provided to the Group’s management and if there has been a material change from the amount<br />
disclosed in the last annual financial statements for that reportable segment. Amended IAS 34 will be effective for annual periods<br />
beginning on or after 1 January, 2013 and requires retrospective application.<br />
IFRS 9 Financial Instruments becomes effective for annual periods beginning on or after 1 January 2015. The new standard is to be<br />
issued in several phases and is intended to replace IAS 39 Financial Instruments: Recognition and Measurement.<br />
The first and second phases of IFRS 9 were finalised in November 2009 and October 2010, respectively, and relate to the recognition and<br />
measurement of financial assets and liabilities. The Group recognises that the new standard introduces many changes to the accounting<br />
for financial instruments and is likely to have a significant impact on the Group’s consolidated financial statements. The impact of these<br />
changes will be analysed during the course of the project as further phases of the standard are issued.<br />
IFRS 11 Joint Arrangements supersedes IAS 31 Interests in Joint Ventures and introduces a classification of all joint arrangements<br />
either as joint operations, which are consolidated on a proportionate basis, or as joint ventures, for which the equity method is applied.<br />
IFRS 11 will be effective for annual periods beginning on or after 1 January 2013 and requires retrospective application.<br />
IFRS 12 Disclosure of interests in other entities requires extended disclosures for interests in subsidiaries, joint arrangements, associates<br />
and unconsolidated structured entities. IFRS 12 will be effective for annual periods beginning on or after 1 January 2013 and requires<br />
retrospective application.<br />
IFRS 13 Fair value measurement provides a revised definition of fair value, establishes a framework for measuring fair value and sets out<br />
expanded disclosure requirements for fair value measurements. IFRS 13 will be effective for annual periods beginning on or after 1<br />
January 2013 and requires prospective application.<br />
3. Summary of the principal accounting policies<br />
The following significant accounting policies have been consistently applied in the preparation of these consolidated financial statements<br />
throughout the Group.<br />
a. Basis of consolidation<br />
Subsidiaries<br />
Subsidiaries are those enterprises controlled, directly or indirectly, by the Parent Company. The financial statements of subsidiaries are<br />
included in these consolidated financial statements from the date that control effectively commences until the date that control<br />
effectively ceases. The non-controlling interests represent the non-controlling shareholders’ proportion of the net identifiable assets of the<br />
subsidiaries, including the non-controlling shareholders’ share of fair value adjustments on acquisitions. The non-controlling interests are<br />
presented in the statement of financial position within equity, separately from the parent’s shareholders’ equity.<br />
Intra-group balances and transactions, and any unrealized gains arising from intra-group transactions, are eliminated in preparing these<br />
consolidated financial statements; unrealized losses are also eliminated unless the transaction provides an evidence of impairment of the<br />
asset transferred.<br />
Acquisition of Subsidiaries<br />
The purchase method of accounting was used to account for the acquisition of subsidiaries by the Group.<br />
The initial accounting for a business combination involves identifying and determining the fair values to be assigned to the acquiree’s<br />
identifiable assets, the liabilities assumed and the consideration transferred. If the initial accounting for a business combination is<br />
incomplete by the end of the period in which the combination is effected, the Group accounts for the combination using the provisional<br />
values for the items for which the accounting is incomplete. The Group recognizes any adjustments to those provisional values as a result<br />
of completing the initial accounting within twelve months from the acquisition date. As a result goodwill or gain from bargain purchase is<br />
adjusted accordingly.<br />
Comparative information for the periods before the completion of the initial accounting for the acquisition is presented as if the initial<br />
accounting had been completed at the acquisition date.<br />
Accounting for business combinations of entities under common control<br />
IFRS provides no guidance on accounting for business combinations of entities under common control. Management adopted the<br />
accounting policy for such transactions based on the relevant guidance of accounting principles generally accepted in the United States<br />
(‘US GAAP’). Management believes that this approach and the accounting policy disclosed below are in compliance with IFRS.<br />
Acquisitions of controlling interests in companies that were previously under the control of the Majority Shareholder are accounted for as<br />
if the acquisition had occurred at the beginning of the earliest comparative period presented or, if later, at the date on which control was<br />
<strong>Severstal</strong> Annual Report and accounts 2012
company Overview Strategy Performance Sustainability Governance Financial statements Additional information<br />
OAO <strong>Severstal</strong> and subsidiaries<br />
Notes to the consolidated financial statements<br />
for the years ended December 31, 2012, 2011 and 2010<br />
(Amounts expressed in thousands of US dollars, except as otherwise stated)<br />
130<br />
obtained by the Majority Shareholder. The assets and liabilities acquired are recognized at their book values. The components of equity of<br />
the acquired companies are added to the same components within Group equity, except that any share capital of the acquired companies<br />
is recorded as a part of additional capital. The cash consideration for such acquisitions is recognized as a liability to or a reduction of<br />
receivables from related parties, with a corresponding reduction in equity, from the date the acquired company is included in these<br />
consolidated financial statements until the cash consideration is paid. Parent Company shares issued in consideration for the acquired<br />
companies are recognized from the moment the acquired companies are included in these financial statements.<br />
No goodwill is recognized where the Group acquires additional interests in the acquired companies from the Majority shareholder. The<br />
difference between the share of net assets acquired and consideration transferred is recognized directly in equity.<br />
Business combination achieved in stages<br />
In a business combination achieved in stages, the Group remeasures its previously held equity interest in the associates or joint ventures<br />
at its acquisition date fair value and recognizes the resulting gain or loss, if any, in profit or loss in the income statement.<br />
Investments in associates<br />
Associates are those enterprises in which the Group has significant influence, but does not have control over the financial and operating<br />
policies.<br />
Investments in associates are accounted for under the equity method and are initially recognized at cost, from the date that significant<br />
influence commences until the date that significant influence ceases. Subsequent changes in the carrying value reflect the postacquisition<br />
changes in the Group’s share of net assets of the associate and goodwill impairment charges, if any, after adjustments to<br />
align the accounting policies with those of the Group. When the Group’s share of losses exceeds the carrying amount of the associate, the<br />
carrying amount is reduced to nil and recognition of further losses is discontinued, except to the extent that the Group has incurred<br />
obligations in respect of the associate.<br />
Unrealized gains on transactions between the Group and its associates are eliminated to the extent of the Group’s interest in the<br />
associates; unrealized losses are also eliminated unless the transaction provides evidence of an impairment of the asset transferred.<br />
Interests in joint ventures<br />
A joint venture is a contractual arrangement whereby the Group and other parties undertake an economic activity when the strategic<br />
financial and operating policy decisions relating to the activities of the joint venture require the unanimous consent of the parties sharing<br />
control.<br />
Where a Group entity undertakes its activities under joint venture arrangements directly, the Group’s share of jointly controlled assets and<br />
any liabilities incurred jointly with other venturers are recognized in its financial statements and classified according to their nature.<br />
Liabilities and expenses incurred directly in respect of interests in jointly controlled assets are accounted for on the accrual basis. Income<br />
from the sale or use of the Group’s share of the output of jointly controlled assets, and its share of joint venture expenses, are recognized<br />
when it is probable that the economic benefits associated with the transactions will flow to the Group and their amount can be measured<br />
reliably.<br />
Joint venture arrangements that involve the establishment of a separate entity in which each venturer has an interest are referred to as<br />
jointly controlled entities. The Group reports its interests in jointly controlled entities using the equity method of accounting whereby an<br />
interest in jointly controlled entities is initially recorded at cost and adjusted thereafter for post-acquisition changes in the Group’s share<br />
of net assets of the joint venture. The income statement reflects the Group’s share of the results of operations of the joint venture.<br />
Unrealized gains on transactions between the Group and its jointly controlled entities are eliminated to the extent of the Group’s interest<br />
in the joint venture; unrealized losses are also eliminated unless the transaction provides evidence of an impairment of the asset<br />
transferred.<br />
Goodwill<br />
Goodwill is measured as the difference between:<br />
• the aggregate of the acquisition-date fair value of the consideration transferred, the amount of any non-controlling interest, and in a business<br />
combination achieved in stages, the acquisition-date fair value of the acquirer’s previously-held equity interest in the acquiree; and<br />
• the net of the acquisition-date amounts of the identifiable assets acquired and the liabilities assumed.<br />
Goodwill is initially recognized as an asset at cost and is subsequently measured at cost less any accumulated impairment losses.<br />
Goodwill in respect of subsidiaries is disclosed as an intangible asset and goodwill relating to associates and jointly controlled entities is<br />
included within the carrying value of the investments in these entities.<br />
No goodwill is recognized where the Group acquires additional interests in the acquired companies (acquisitions of non-controlling<br />
interest). The difference between the share of net assets acquired and the consideration transferred is recognized directly in equity.<br />
Where goodwill forms a part of a cash-generating unit and the part of the operations within that unit is disposed of, the goodwill<br />
associated with that operation is included in the carrying amount of the operation when determining the gain or loss on disposal of the<br />
operation.<br />
<strong>Severstal</strong> Annual Report and accounts 2012
company Overview Strategy Performance Sustainability Governance Financial statements Additional information<br />
131<br />
OAO <strong>Severstal</strong> and subsidiaries<br />
Notes to the consolidated financial statements<br />
for the years ended December 31, 2012, 2011 and 2010<br />
(Amounts expressed in thousands of US dollars, except as otherwise stated)<br />
Gain from bargain purchase represents the excess of the Group’s share in the fair value of acquired identifiable assets and the liabilities<br />
assumed over the consideration transferred, and in a business combination achieved in stages, the acquisition-date fair value of the<br />
acquirer’s previously-held equity interest in the acquire. It is recognized in the income statement at the date of the acquisition.<br />
b. Foreign currency transactions<br />
Transactions in foreign currencies are translated to the functional currency of each entity at the foreign exchange rate ruling on the date<br />
of the transaction. Monetary assets and liabilities denominated in foreign currencies at the reporting date are translated to the functional<br />
currency of each entity at the foreign exchange rate ruling at that date. Non-monetary assets and liabilities denominated in foreign<br />
currencies are translated to the functional currency of the entity at the foreign exchange rate ruling at the date of the transaction.<br />
Foreign exchange gains and losses arising on the translation are recognized in the income statement.<br />
c. Exploration for and evaluation of mineral resources<br />
Expenditures associated with search for specific mineral resources are recognized as exploration and evaluation assets. The following<br />
expenditure comprises cost of exploration and evaluation assets:<br />
• obtaining of the rights to explore and evaluate mineral reserves and resources including costs directly related to this acquisition;<br />
• researching and analyzing existing exploration data;<br />
• conducting geological studies, exploratory drilling and sampling;<br />
• examining and testing extraction and treatment methods;<br />
• compiling prefeasibility and feasibility studies;<br />
• activities in relation to evaluating the technical feasibility and commercial viability of extracting a mineral resource.<br />
Administration and other overhead costs are charged to the cost of exploration and evaluation assets only if directly related to an<br />
exploration and evaluation project.<br />
If a project does not prove viable, all irrecoverable exploration and evaluation expenditure associated with the project net of any related<br />
impairment allowances is written off to the income statement.<br />
The Group measures its exploration and evaluation assets at cost and classifies as tangible or intangible according to the nature of the<br />
assets acquired and applies the classification consistently. Exploration and evaluation assets considered to be tangible are recorded as a<br />
component of property, plant and equipment at cost less impairment charges. Otherwise, they are recorded as intangible assets, such as<br />
licenses. To the extent that tangible asset is consumed in developing an intangible asset, the amount reflecting that consumption is<br />
capitalized as a part of the cost of the intangible asset.<br />
As the asset is not available for use, it is not depreciated. All exploration and evaluation assets are monitored for indications of impairment.<br />
An exploration and evaluation asset is no longer classified as such when the technical feasibility and commercial viability of extracting a<br />
mineral resource are demonstrable and the development of the deposit is sanctioned by management. The carrying amount of such<br />
exploration and evaluation asset is reclassified into development asset.<br />
d. Development expenditure<br />
Development expenditure includes costs directly attributable to the construction of a mine and the related infrastructure and is<br />
accumulated separately for each area of interest. Development expenditure is capitalized and is recorded as a component of property,<br />
plant and equipment or intangible assets, as appropriate. No depreciation is charged on the development expenditure before the start of<br />
commercial production.<br />
To the extent that revenue arises from test production during the development stage, an amount is charged from development<br />
expenditure to the cost of sales so as to reflect a zero net margin.<br />
e. Stripping costs<br />
The Group separates two different types of stripping costs that are incurred in surface mining activity:<br />
• Stripping activity asset; and<br />
• Current stripping costs.<br />
Stripping activity asset is created as part of usual surface activity in order to obtain improved access to further quantities of minerals that<br />
will be mined in future periods.<br />
Current stripping costs are costs that are incurred in order to mine the mineral ore only in current period.<br />
The Group recognizes a stripping activity asset if, and only if, all of the following are met:<br />
• it is probable that the future economic benefit (improved access to the ore body) associated with the stripping activity will flow to the<br />
entity;<br />
<strong>Severstal</strong> Annual Report and accounts 2012
company Overview Strategy Performance Sustainability Governance Financial statements Additional information<br />
OAO <strong>Severstal</strong> and subsidiaries<br />
Notes to the consolidated financial statements<br />
for the years ended December 31, 2012, 2011 and 2010<br />
(Amounts expressed in thousands of US dollars, except as otherwise stated)<br />
132<br />
• the entity can identify the component of the ore body for which access has been improved; and<br />
• the costs relating to the improved access to that component can be measured reliably.<br />
After initial recognition, stripping activity assets are carried at cost less accumulated depreciation and impairment loss. Depreciation is<br />
calculated using the units of production method.<br />
f. Property, plant and equipment<br />
Property, plant and equipment are carried at cost less accumulated depreciation and accumulated impairment losses. Cost includes<br />
expenditure that is directly attributable to the acquisition of the asset and, for qualifying assets, borrowing costs capitalized. In the case<br />
of assets constructed by the Group, related works and direct project overheads are included in cost. The cost of replacing part of an item<br />
of property, plant and equipment is recognized in the carrying amount of the item if it is probable that the future economic benefits<br />
embodied within the part will flow to the Group and its cost can be measured reliably. The carrying amount of the replaced part is<br />
derecognized. Repair and maintenance expenses are charged to the income statement as incurred. Gains or losses on disposals of<br />
property, plant and equipment are recognized in the income statement.<br />
Depreciation is provided so as to write off property, plant and equipment over its expected useful life. Depreciation is calculated using the<br />
straight-line basis, except for depreciation on vehicles and certain metal-rolling equipment, which is calculated on the basis of mileage<br />
and units of production, respectively. The estimated useful lives of assets are reviewed regularly and revised when necessary.<br />
The principal periods over which assets are depreciated are as follows:<br />
Buildings and constructions 20 – 50 years<br />
Plant and machinery 10 – 20 years<br />
Other productive assets 5 – 20 years<br />
Infrastructure assets 5 – 50 years<br />
g. Lease<br />
Leases are classified as finance leases whenever the terms of the lease transfer substantially all the risks and rewards of ownership to the<br />
Group. All other leases are classified as operating leases.<br />
Assets held under finance leases are initially recognized as assets of the Group at their fair value at the inception of the lease or, if lower,<br />
at the present value of the minimum lease payments. The corresponding liability to the lessor is included in the statement of financial<br />
position as a finance lease obligation.<br />
Lease payments are apportioned between finance charges and reduction of the lease obligation so as to achieve a constant rate of<br />
interest on the remaining balance of the liability. Finance charges are charged directly to the income statement as a part of interest<br />
expense.<br />
The depreciation policy for depreciable leased assets is consistent with that for depreciable assets, which are owned. If there is no<br />
reasonable certainty that the Group will obtain ownership by the end of the lease term, the asset is fully depreciated over the shorter of<br />
the lease term or its useful life.<br />
Operating lease payments are recognized as an expense on a straight-line basis over the lease term, except where another systematic<br />
basis is more representative of the time pattern in which economic benefits from the leased asset are consumed.<br />
h. Intangible assets (excluding goodwill)<br />
Intangible assets acquired by the Group are measured on initial recognition at cost. Following initial recognition, intangible assets are<br />
carried at cost less accumulated amortization and accumulated impairment losses.<br />
Intangible assets are amortized over their estimated useful lives using the straight-line basis and assessed for impairment whenever there<br />
is an indication that the intangible asset may be impaired. The estimated useful life and amortization method are reviewed at the end of<br />
each annual reporting period, with the effect of any changes in estimate being accounted for on a prospective basis.<br />
The table below presents the useful lives of intangible assets:<br />
Mineral rights<br />
12 – 25 years<br />
Software<br />
3 – 10 years<br />
Other intangible assets 3 – 50 years<br />
The major components of the other intangible assets include capitalized favorable contracts and land lease rights. Amortization of<br />
intangible assets is included in the captions “Cost of sales” and “General and administrative expenses” in the consolidated income<br />
statement.<br />
<strong>Severstal</strong> Annual Report and accounts 2012
company Overview Strategy Performance Sustainability Governance Financial statements Additional information<br />
133<br />
OAO <strong>Severstal</strong> and subsidiaries<br />
Notes to the consolidated financial statements<br />
for the years ended December 31, 2012, 2011 and 2010<br />
(Amounts expressed in thousands of US dollars, except as otherwise stated)<br />
i. Impairment of assets<br />
The carrying amount of goodwill is tested for impairment annually. At each reporting date the Group assesses whether there is any<br />
indication of impairment of the Group’s other assets. If any such indication exists, the asset’s recoverable amount is estimated. An<br />
impairment loss is recognized whenever the carrying amount of an asset or its cash-generating unit exceeds its recoverable amount.<br />
Calculation of recoverable amount<br />
For financial assets carried at amortized cost, the amount of the impairment is the difference between the asset’s carrying amount and its<br />
recoverable amount that is the present value of estimated future cash flows, discounted at the financial asset’s original effective interest<br />
rate. For other assets the recoverable amount is the greater of the fair value less cost to sell and value in use. In assessing value in use, the<br />
estimated future cash flows are discounted to their present value using a pre-tax discount rate that reflects current market assessments<br />
of the time value of money and the risks specific to the asset. For an asset that does not generate cash inflows largely independent of<br />
those from other assets, the recoverable amount is determined for the cash-generating unit to which the asset belongs.<br />
Reversals of impairment<br />
An impairment loss in respect of a held-to-maturity investment, loan or receivable is reversed if the subsequent increase in recoverable<br />
amount can be related objectively to an event occurring after the impairment loss was recognized. An impairment loss in respect of<br />
goodwill is not reversed. In respect of other assets, an impairment loss is reversed if there has been a change in the estimates used to<br />
determine the recoverable amount. An impairment loss is reversed only to the extent that the asset’s carrying amount does not exceed<br />
the carrying amount that would have been determined, net of depreciation or amortization, if no impairment loss had been recognized.<br />
j. Inventories<br />
Inventories are stated at the lower of cost and net realizable value. Net realizable value is the estimated selling price in the ordinary<br />
course of business, less the estimated costs of completion and selling expenses. The cost of inventories is based on the weighted average<br />
principle and includes expenditure incurred in acquiring the inventories and bringing them to their existing location and condition. In the<br />
case of manufactured inventories and work in progress, cost includes an appropriate share of production overheads. Allowances are<br />
recorded against slow-moving and obsolete inventories.<br />
k. Financial assets<br />
Financial assets include cash and cash equivalents, investments, and loans and receivables.<br />
Cash and cash equivalents comprise cash balances, cash deposits and highly liquid investments with original maturities of three months<br />
or less, that are readily convertible to known amounts of cash and are subject to an insignificant risk of changes in value.<br />
Financial assets are classified into the following specified categories: financial assets ‘at fair value through profit or loss’ (FVTPL), ‘held-tomaturity’<br />
investments, ‘available-for-sale’ (AFS) financial assets and ‘loans and receivables’. The classification depends on the nature and<br />
purpose of the financial assets and is determined at the time of initial recognition.<br />
Effective interest method<br />
The effective interest method is a method of calculating the carrying value of a financial asset held at amortized cost and of allocating<br />
interest income over the relevant period. The effective interest rate is the rate that exactly discounts estimated future cash receipts<br />
(including all fees and points paid or received that form an integral part of the effective interest rate, transaction costs and other<br />
premiums or discounts) through the expected life of the financial asset, or, where appropriate, a shorter period.<br />
Income is recognized on an effective interest basis for debt instruments other than those financial assets designated as at FVTPL.<br />
Financial assets at FVTPL<br />
Financial assets are classified as at FVTPL where the financial asset is either held for trading or it is designated as at FVTPL.<br />
A financial asset is classified as held for trading if:<br />
• it has been acquired principally for the purpose of selling in the near future; or<br />
• it is a part of an identified portfolio of financial instruments that the Group manages together and has a recent actual pattern of<br />
short-term profit-taking.<br />
A financial asset other than a financial asset held for trading may be designated as at FVTPL upon initial recognition if:<br />
• such designation eliminates or significantly reduces a measurement or recognition inconsistency that would otherwise arise; or<br />
• the financial asset forms part of a group of financial instruments, which are managed and performance is evaluated on a fair value<br />
basis, in accordance with the Group’s documented risk management or investment strategy, and information about the grouping is<br />
provided internally on that basis.<br />
Financial assets at FVTPL are stated at fair value, with any resultant gain or loss recognized in profit or loss. The net gain or loss<br />
recognized in the income statement incorporates any dividend or interest earned on the financial asset.<br />
<strong>Severstal</strong> Annual Report and accounts 2012
company Overview Strategy Performance Sustainability Governance Financial statements Additional information<br />
OAO <strong>Severstal</strong> and subsidiaries<br />
Notes to the consolidated financial statements<br />
for the years ended December 31, 2012, 2011 and 2010<br />
(Amounts expressed in thousands of US dollars, except as otherwise stated)<br />
134<br />
Held-to-maturity investments<br />
Non-derivative financial assets with fixed or determinable payments and fixed maturity dates that the Group has the positive intent and<br />
ability to hold to maturity are classified as held-to-maturity investments. Held-to-maturity investments are recorded at amortized cost<br />
using the effective interest method less any impairment.<br />
Loans and receivables<br />
Trade receivables, loans, and other receivables that have fixed or determinable payments that are not quoted in an active market are<br />
classified as loans and receivables. Loans and receivables are measured at amortized cost using the effective interest method, less any<br />
impairment. Interest income is recognized by applying the effective interest rate, except for short-term receivables when the recognition<br />
of interest would be immaterial.<br />
AFS financial assets<br />
Available for sale financial assets are those non-derivative financial assets that are not classified as financial assets at FVTPL, held-tomaturity<br />
or loans and receivables and are stated at fair value. Listed shares that are traded in an active market are stated at their market<br />
value. Investments in unlisted shares that do not have a quoted market price in an active market are measured at management’s<br />
estimate of fair value. Gains and losses arising from changes in fair value are recognized in other comprehensive income with the<br />
exception of impairment losses, which are recognized directly in the income statement. Where the investment is disposed of or is<br />
determined to be impaired, the cumulative gain or loss previously recognized in the equity is included in the income statement for the<br />
period.<br />
Dividends on AFS equity instruments are recognized in the income statement when the Group’s right to receive the dividends is<br />
established.<br />
Derecognition of financial assets<br />
The Group derecognizes a financial asset only when the contractual rights to the cash flows from the asset expire or it transfers the<br />
financial asset and substantially all the risks and rewards of ownership of the asset to another entity.<br />
l. Financial liabilities<br />
Financial liabilities are classified as either financial liabilities ‘at FVTPL’ or ‘other financial liabilities’.<br />
Financial liabilities at FVTPL<br />
Financial liabilities are classified as at FVTPL where the financial liability is either held for trading or it is designated as at FVTPL.<br />
A financial liability is classified as held for trading if:<br />
• it has been incurred principally for the purpose of repurchasing in the near future; or<br />
• it is a part of an identified portfolio of financial instruments that the Group manages together and has a recent actual pattern of<br />
short-term profit-taking.<br />
A financial liability other than a financial liability held for trading may be designated as at FVTPL upon initial recognition if:<br />
• such designation eliminates or significantly reduces a measurement or recognition inconsistency that would otherwise arise; or<br />
• the financial liability forms a part of a group of financial instruments, which are managed and where performance is evaluated on a fair<br />
value basis, in accordance with the Group’s documented risk management or investment strategy, and information about the grouping<br />
is provided internally on that basis.<br />
Financial liabilities at FVTPL are stated at fair value, with any resultant gain or loss recognized in profit or loss. The net gain or loss<br />
recognized in profit or loss incorporates any interest paid on the financial liability.<br />
Other financial liabilities<br />
Other financial liabilities, including borrowings, are initially measured at fair value, net of transaction costs. Borrowing costs on loans<br />
specifically for the purchase or construction of a qualifying asset are capitalized as a part of the cost of the asset they are financing.<br />
Other financial liabilities are subsequently measured at amortized cost using the effective interest method, with interest expense<br />
recognized in the income statement.<br />
Derecognition of financial liabilities<br />
The Group derecognizes financial liabilities when, and only when, the Group’s obligations are discharged, cancelled or they expire.<br />
m. Hedging instruments<br />
The Group holds cash flow hedging instruments in order to hedge the exposure to variability in cash flows that is attributable to a<br />
particular risk associated with a recognized asset or liability or a highly probable forecast transaction and which could affect profit or loss.<br />
Changes in the fair value of the derivative hedging instrument designated as a cash flow hedge are recognized in other comprehensive income<br />
to the extent that the hedge is effective. To the extent that the hedge is ineffective, changes in fair value are recognized in profit or loss.<br />
<strong>Severstal</strong> Annual Report and accounts 2012
company Overview Strategy Performance Sustainability Governance Financial statements Additional information<br />
135<br />
OAO <strong>Severstal</strong> and subsidiaries<br />
Notes to the consolidated financial statements<br />
for the years ended December 31, 2012, 2011 and 2010<br />
(Amounts expressed in thousands of US dollars, except as otherwise stated)<br />
If the hedging instrument no longer meets the criteria for hedge accounting, expires or is sold, terminated or exercised, then hedge<br />
accounting is discontinued prospectively. The cumulative gain or loss that has been previously recognized in other comprehensive income<br />
remains in equity until the forecast transaction occurs. When the hedged item is a non-financial asset, the amount that has been recognized<br />
in other comprehensive income is transferred to the carrying amount of the asset when it is recognized. In other cases the amount<br />
recognized in other comprehensive income is transferred to profit or loss in the same period that the hedged item affects profit or loss.<br />
n. Dividends payable<br />
Dividends are recognized as a liability in the period in which they are authorized by the shareholders.<br />
o. Other taxes and contributions<br />
Other taxes and contributions are taxes and mandatory contributions paid to the government, or government controlled agencies, that<br />
are calculated on a variety of bases, but exclude taxes calculated on profits, value added taxes calculated on revenues and purchases and<br />
social security costs calculated on wages and salaries. Social security costs are included in cost of sales, distribution expenses and general<br />
and administrative expenses in accordance with the nature of related wages and salaries expenses.<br />
p. Income tax<br />
Income tax on the profit for the year comprises current and deferred tax. Income tax is recognized in the income statement except to the<br />
extent that it relates to items recognized in other comprehensive income, in which case it is recognized in other comprehensive income.<br />
Current tax expense is calculated by each entity on the pre-tax income determined in accordance with the tax law of the country, in which<br />
the entity is incorporated, using tax rates enacted at the reporting date, and any adjustment to tax payable in respect of previous years.<br />
Deferred tax is calculated using the balance sheet method, providing for temporary differences between the carrying amounts of assets<br />
and liabilities for financial reporting and taxation purposes. Deferred tax is measured at the tax rates that are expected to be applied to<br />
the temporary differences when they reverse, based on the laws that have been enacted or substantively enacted by the reporting date.<br />
Deferred tax assets and liabilities are offset if there is a legally enforceable right to offset current tax liabilities and assets, and they relate<br />
to income taxes levied by the same tax authority on the same taxable entity, or on different tax entities, but they intend to settle current<br />
tax liabilities and assets on a net basis or their tax assets and liabilities will be realized simultaneously.<br />
Deferred tax assets are recognized only to the extent that it is probable that future taxable profits will be available against which these<br />
assets can be utilized. Deferred tax assets are reviewed at each reporting date and are reduced to the extent that it is no longer probable<br />
that the related tax income will be realized.<br />
Deferred tax is not recognized in respect of the following:<br />
• investments in subsidiaries where the Group is able to control the timing of the reversal of the temporary differences and it is probable<br />
that the temporary difference will not reverse in the foreseeable future;<br />
• if it arises from the initial recognition of an asset or liability that is not a business combination and, at the time of the transaction,<br />
affects neither accounting profit nor taxable profit or loss;<br />
• initial recognition of goodwill.<br />
q. Provisions<br />
Employee benefits<br />
The Group pays retirement, healthcare and other long-term benefits to its employees.<br />
The Group has two types of retirement benefits: defined contribution plans and defined benefit plans. Defined contribution plans are<br />
post-employment benefit plans under which the Group pays fixed contributions into a separate entity and will have no legal or<br />
constructive obligation to pay further amounts in respect of those benefits. The Group’s only obligation is to pay contributions as they fall<br />
due, including contributions to the Russian Federation State pension fund. Prepaid contributions are recognized as an asset to the extent<br />
that a cash refund or a reduction in future payments is available.<br />
Defined benefit plans are post-employment benefits plans other than defined contribution plans. The Group uses an actuarial valuation<br />
method for measurement of the present value of post-employment benefit obligations and related current service cost. This involves the<br />
use of demographic assumptions about the future characteristics of the current and former employees who are eligible for benefits<br />
(mortality, both during and after employment, rates of employee turnover, disability and early retirement, etc.) as well as financial<br />
assumptions (discount rate, future salary and benefit levels, etc.). The discount rate used is the yield at the balance sheet date on high<br />
quality corporate bonds for a respective country that have maturity dates approximating the terms of the Group’s obligations. The<br />
calculation of the Group’s net obligation in respect of defined retirement benefit plans is performed annually using the projected unit<br />
credit method. In accordance with this method, the Group’s net obligation is calculated separately for each defined benefit plan. Any<br />
actuarial gain or loss arising from the calculation of the retirement benefit liability is fully recognized in other comprehensive income.<br />
Other long-term employee benefits include various compensations, non-monetary benefits and a long-term incentive program.<br />
<strong>Severstal</strong> Annual Report and accounts 2012
company Overview Strategy Performance Sustainability Governance Financial statements Additional information<br />
OAO <strong>Severstal</strong> and subsidiaries<br />
Notes to the consolidated financial statements<br />
for the years ended December 31, 2012, 2011 and 2010<br />
(Amounts expressed in thousands of US dollars, except as otherwise stated)<br />
136<br />
Decommissioning liability<br />
The Group has environmental liabilities related to restoration of soil and other related works, which are due upon the closures of certain of<br />
its production sites. Decommissioning liabilities are estimated case-by-case based on available information, taking into account<br />
applicable local legal requirements. The estimation is made using existing technology, at current prices, and discounted using a real<br />
discount rate. Future decommissioning costs, discounted to net present value, are capitalized and the corresponding decommissioning<br />
liability raised as soon as the constructive obligation to incur such costs arises. Future decommissioning costs are capitalized in property,<br />
plant and equipment and are depreciated over the life of the related asset. The effect of the time value of money on the<br />
decommissioning liability is recognized in the consolidated income statement as an interest expense. Ongoing rehabilitation costs are<br />
expensed when incurred.<br />
Onerous contracts<br />
A provision for onerous contracts is recognized when the expected benefits to be derived by the Group from a contract are lower than the<br />
unavoidable cost of meeting its obligations under the contract. The provision is measured at the present value of the lower of the<br />
expected cost of terminating the contract and the expected net cost of continuing with the contract. Before a provision is established, the<br />
Group recognizes any impairment loss on the assets associated with that contract.<br />
Other provisions<br />
Other provisions are recognized in the statement of financial position when the Group has a legal or constructive obligation as a result of<br />
a past event, it is probable that an outflow of economic benefits will be required to settle the obligation, and a reliable estimate can be<br />
made of the amount of the obligation.<br />
r. Share capital<br />
Ordinary shares<br />
Ordinary shares are classified as equity. Incremental costs directly attributable to the issue of ordinary shares and share options are<br />
recognized as a deduction from equity, net of any tax effects.<br />
Repurchase of issued shares<br />
When share capital recognized as equity is repurchased, the amount of the consideration paid which includes directly attributable costs,<br />
is net of any tax effects, and is recognized as a deduction from equity. Repurchased shares are classified as treasury shares and are<br />
presented as a deduction from total equity. When treasury shares are sold or reissued subsequently, the amount received is recognized as<br />
an increase in equity, and the resulting surplus or deficit on the transaction is transferred to/from retained earnings.<br />
s. Operating income and expenses<br />
The Group presents profit or loss from operations, which includes various types of income and expenses arising in the course of production<br />
and sale of the Group’s products, disposal of property, plant and equipment, participation in joint ventures and associates, securities<br />
operations and other Group’s regular activities.<br />
Certain items are presented separately from profit or loss from operations by virtue of their size, incidence or nature to enable a full<br />
understanding of the Group’s financial performance. Such items, which are included in profit or loss before financing and taxation,<br />
primarily include impairment of non-current assets, negative goodwill and other non-operating income and expenses, as, for example,<br />
gain or loss from disposal of subsidiaries and associates and charitable donations.<br />
t. Revenue recognition<br />
Revenue is measured at the fair value of the consideration received or receivable. Revenue is reduced for estimated customer returns,<br />
rebates and other similar allowances.<br />
When goods are sold or services are rendered in exchange for dissimilar goods or services, the revenue is measured at the fair value of the<br />
goods or services received, adjusted by the amount of cash or cash equivalents transferred. When the fair value of the goods or services<br />
received cannot be measured reliably, the revenue is measured at the fair value of the goods or services given up, adjusted by the amount<br />
of any cash or cash equivalents transferred.<br />
Sale of goods<br />
Revenue from the sale of goods is recognized in the income statement when the significant risks and rewards of ownership have been<br />
transferred to the buyer; the Group retains neither continuing managerial involvement to the degree usually associated with ownership<br />
nor effective control over the goods sold; the amount of revenue can be measured reliably; it is probable that the economic benefits<br />
associated with the transaction will flow to the entity; and the costs incurred or to be incurred in respect of the transaction can be<br />
measured reliably.<br />
Rendering of services<br />
Revenue from a contract to provide services is recognized by reference to the stage of completion of the contract.<br />
<strong>Severstal</strong> Annual Report and accounts 2012
company Overview Strategy Performance Sustainability Governance Financial statements Additional information<br />
137<br />
OAO <strong>Severstal</strong> and subsidiaries<br />
Notes to the consolidated financial statements<br />
for the years ended December 31, 2012, 2011 and 2010<br />
(Amounts expressed in thousands of US dollars, except as otherwise stated)<br />
u. Interest income<br />
Interest income is recognized in the income statement on a time basis, by reference to the principal outstanding and at the effective<br />
interest rate applicable, which is the rate that exactly discounts estimated future cash receipts through the expected life of the financial<br />
asset to that asset’s net carrying amount.<br />
v. Interest expense<br />
Interest expense is recognized in the income statement as it accrues, taking into account the effective yield on the liability.<br />
w. Gain on remeasurement and disposal of financial investments<br />
Gain on remeasurement and disposal of financial investments comprises dividend income (except for dividends from equity associates<br />
and joint ventures), realized and unrealized gains on financial assets at fair value through profit or loss, realized gains and impairment<br />
losses on available-for-sale and held-to-maturity investments.<br />
x. Earnings per share<br />
Earnings per share is calculated by dividing the net profit by the weighted average number of shares outstanding during the year,<br />
assuming that shares issued in consideration for the companies acquired from the Majority Shareholder were issued from the moment<br />
these companies are included in these consolidated financial statements.<br />
y. Discontinued operations<br />
Discontinued operations are disclosed when a component of the Group either has been disposed of during the reporting period, or is<br />
classified as held for sale at the reporting date. This condition is regarded as met only when the disposal is highly probable within one<br />
year from the date of classification.<br />
The comparative income statement is presented as if the operation had been discontinued from the beginning of the comparative period.<br />
Assets and liabilities of a disposal group are presented in the statement of financial position separately from other assets and liabilities.<br />
Comparative information related to discontinued operations is not amended in the balance sheet.<br />
z. Segment reporting<br />
An operating segment is a component of the Group that engages in business activities from which it may earn revenues and incur<br />
expenses, including revenues and expenses that relate to transactions with any of the Group’s other components. An operating segment’s<br />
operating results are reviewed regularly by the CEO to make decisions about resources to be allocated to the segment and assess its<br />
performance, and for which discrete financial information is available.<br />
The reportable segments’ amounts in the disclosure are stated before intersegment elimination and are measured on the same basis as<br />
those in the consolidated financial statements, except that:<br />
• non-monetary long-term investments in subsidiaries are translated into the presentation currency at the historic exchange rate;<br />
• no impairment is recognized on investments in subsidiaries.<br />
Inter-segment pricing is determined on an arm’s length basis.<br />
Segment capital expenditure is the total cost incurred during the period to acquire property, plant and equipment, and intangible assets<br />
other than goodwill.<br />
aa. Government grants<br />
Government grants are recognized when there is a reasonable assurance that they will be received and the Group will comply with the<br />
conditions associated with the grant. Government grants related to assets are presented as a deduction from the cost of the asset.<br />
<strong>Severstal</strong> Annual Report and accounts 2012
company Overview Strategy Performance Sustainability Governance Financial statements Additional information<br />
OAO <strong>Severstal</strong> and subsidiaries<br />
Notes to the consolidated financial statements<br />
for the years ended December 31, 2012, 2011 and 2010<br />
(Amounts expressed in thousands of US dollars, except as otherwise stated)<br />
4. Revenue<br />
Revenue by product was as follows:<br />
138<br />
Year ended December 31,<br />
2012 2011 2010<br />
Hot-rolled strip and plate 4,541,333 5,002,608 3,964,534<br />
Galvanized and other metallic coated sheet 2,022,553 1,998,091 1,532,821<br />
Cold-rolled sheet 1,406,266 1,655,157 1,587,051<br />
Metalware products 967,628 964,353 832,397<br />
Shipping and handling costs billed to customers 875,889 876,119 677,955<br />
Coal and coking coal concentrate 697,424 843,197 686,179<br />
Pellets and iron ore 668,060 725,764 383,727<br />
Large diameter pipes 562,266 1,006,714 961,348<br />
Long products 547,235 595,173 470,015<br />
Other tubes and pipes, formed shapes 482,746 511,805 347,834<br />
Semi-finished products 459,993 769,474 635,134<br />
Colour-coated sheet 428,642 305,777 288,147<br />
Scrap 17,315 76,849 98,222<br />
Others 426,356 481,319 353,754<br />
14,103,706 15,812,400 12,819,118<br />
Revenue by delivery destination was as follows:<br />
Year ended December 31,<br />
2012 2011 2010<br />
Russian Federation 6,412,704 7,476,438 5,811,686<br />
North America 4,138,335 3,912,225 3,131,834<br />
Europe 1,959,044 2,506,408 1,979,612<br />
China and Central Asia 571,728 735,692 469,246<br />
Central and South America 458,281 335,059 422,484<br />
The Middle East 329,467 446,919 437,766<br />
South-East Asia 135,948 273,322 454,799<br />
Africa 98,199 126,337 111,691<br />
14,103,706 15,812,400 12,819,118<br />
<strong>Severstal</strong> Annual Report and accounts 2012
company Overview Strategy Performance Sustainability Governance Financial statements Additional information<br />
139<br />
OAO <strong>Severstal</strong> and subsidiaries<br />
Notes to the consolidated financial statements<br />
for the years ended December 31, 2012, 2011 and 2010<br />
(Amounts expressed in thousands of US dollars, except as otherwise stated)<br />
5. Staff costs<br />
Employment costs were as follows:<br />
Year ended December 31,<br />
2012 2011 2010<br />
Wages and salaries (1,586,361) (1,455,418) (1,237,287)<br />
Social security costs (479,263) (427,759) (217,946)<br />
Retirement benefit service costs (4,856) (4,107) (5,152)<br />
(2,070,480) (1,887,284) (1,460,385)<br />
Key management’s remuneration for the year ended December 31, 2012, consisting of salaries and bonuses, totalled US$ 38.1 million<br />
(2011: US$ 43.0 million; 2010: US$ 33.4 million). Additionally, in 2012, provision for their long-term incentive programmes was accrued in<br />
the amount of US$ 16.1 million (2011: US$ 34.2 million; 2010: US$ 19.4 million). This provision is subject to further adjustments,<br />
depending on a range of the Group’s and its industry peers’ financial indicators.<br />
6. Loss on remeasurement and disposal of financial investments<br />
Year ended December 31,<br />
2012 2011 2010<br />
Held-for-trading securities<br />
(Loss)/gain on disposal - (111) 481<br />
Remeasurement to fair value (559) - -<br />
Held-to-maturity securities, deposits and loans<br />
Loss on disposal (21,615) (32,866) (13,982)<br />
Reversal of impairment/(impairment) (Note 30) 1,851 (835) (133,969)<br />
Available-for-sale financial assets<br />
Net gain/(loss) on disposal transferred from equity - 725 (5,042)<br />
Dividend income 13,742 28,435 6,190<br />
(6,581) (4,652) (146,322)<br />
<strong>Severstal</strong> Annual Report and accounts 2012
company Overview Strategy Performance Sustainability Governance Financial statements Additional information<br />
OAO <strong>Severstal</strong> and subsidiaries<br />
Notes to the consolidated financial statements<br />
for the years ended December 31, 2012, 2011 and 2010<br />
(Amounts expressed in thousands of US dollars, except as otherwise stated)<br />
7. (Impairment)/reversal of impairment of non-current assets<br />
140<br />
Year ended December 31,<br />
2012 2011 2010<br />
Impairment of goodwill (48,655) - -<br />
(Impairment)/reversal of impairment of property, plant and equipment (5,462) 438 (54,077)<br />
Impairment of intangible assets - - (26,053)<br />
(54,117) 438 (80,130)<br />
For the purpose of impairment testing, the recoverable amount of each cash-generating unit has been determined based on value in use<br />
calculations. The value in use calculation uses cash flow projections based on actual operating results and the business plan approved by<br />
management and a corresponding discount rate which reflects the time value of money and risks associated with each individual<br />
cash-generating unit. Key assumptions management used in their value in use calculations are as follows:<br />
• For all cash-generating units, apart from the <strong>Severstal</strong> Resources segment, cash flow projections cover a period of five years. Cash flows<br />
beyond the five-year period have been extrapolated taking into account business cycles. Cash flow projections for cash-generating units<br />
of the <strong>Severstal</strong> Resources segment cover a period which corresponds to the contractual time of the respective mining licenses.<br />
• Cash flow projections were prepared in nominal terms.<br />
• Cash flow projections during the forecast period are based on long-term price trends for both sales prices and material costs specific for<br />
each segment and geographic region and operating cost inflation in line with consumer price inflation for each country. Consumer price<br />
inflation expectations (in local currency) during the forecast period are as follows in percentage terms:<br />
Year ended December 31,<br />
2012 2011 2010<br />
Russia n/a n/a 5.4 - 7.0<br />
USA 0.3 - 3.0 2.1 - 2.3 1.3 - 2.8<br />
Italy n/a 1.9 - 2.5 1.5 - 2.0<br />
• Discount rates for each cash-generating unit were estimated in nominal terms based on the weighted average cost of capital. These<br />
rates, presented by segment, are as follows in percentage terms:<br />
Year ended December 31,<br />
2012 2011 2010<br />
<strong>Severstal</strong> Resources:<br />
USA 14.7 17.0 18.0<br />
<strong>Severstal</strong> Russian Steel:<br />
Russia* n/a n/a 13.3<br />
Italy* n/a 17.3 16.9<br />
<strong>Severstal</strong> International n/a n/a 16.5 - 19.6<br />
*US$ rate<br />
Values assigned to key assumptions and estimates used to measure the unit’s recoverable amount are consistent with external sources of<br />
information and historic data for each cash-generating unit. Management believes that the values assigned to the key assumptions and<br />
estimates represent the most realistic assessment of future trends.<br />
<strong>Severstal</strong> Annual Report and accounts 2012
company Overview Strategy Performance Sustainability Governance Financial statements Additional information<br />
141<br />
OAO <strong>Severstal</strong> and subsidiaries<br />
Notes to the consolidated financial statements<br />
for the years ended December 31, 2012, 2011 and 2010<br />
(Amounts expressed in thousands of US dollars, except as otherwise stated)<br />
<strong>Severstal</strong> Resources segment<br />
PBS Coals Limited<br />
2010<br />
As a result of value in use calculation no impairment loss was recognized in 2010.<br />
The carrying amount of goodwill allocated to the cash-generating unit was US$ 111.7 million as of December 31, 2010.<br />
The following assumptions were used in the impairment test:<br />
• the forecast extraction volumes increase by 5% in 2011 and remain constant at the 2011 level thereafter;<br />
• the coking coal concentrate prices are forecast to remain generally constant;<br />
• the forecast steam coal prices increase on average by 4% p.a. during the five-year forecast period, increase by 2% in 2016 and remain<br />
constant at the 2016 level thereafter;<br />
• operating costs are forecast to decrease by 3% in 2011 and remain constant at the 2011 level thereafter;<br />
• pre-tax discount rate of 18.0% (in US$ terms).<br />
The above estimates are particularly sensitive in the following areas:<br />
• a 1% increase in discount rate causes the carrying amount of the cash-generating unit to exceed its recoverable amount by US$ 18.5<br />
million;<br />
• a 10% decrease in future planned revenues causes the carrying amount of the cash-generating unit to exceed its recoverable amount<br />
by US$ 210.1 million.<br />
Specific impairment loss in the amount of US$ 5.7 million was recognized in 2010 and was allocated to intangible assets.<br />
2011<br />
As a result of value in use calculation no impairment loss was recognized in 2011.<br />
The carrying amount of goodwill allocated to the cash-generating unit was US$ 111.7 million as of December 31, 2011.<br />
The following assumptions were used in the impairment test:<br />
• the forecast extraction volumes increase by 17% in 2012 and remain constant at the 2012 level thereafter;<br />
• the forecast coking coal concentrate prices decrease by 22% in 2012, increase on average by 4% p.a. in 2013 to 2015, increase by 2% in<br />
2016, increase by 3% in 2017 and remain constant at the 2017 level thereafter;<br />
• the forecast steam coal prices decrease by 7% in 2012, increase on average by 4% p.a. in 2013 to 2015, increase by 2% in 2016,<br />
increase by 3% in 2017 and remain constant at the 2017 level thereafter;<br />
• operating costs are forecast to increase by 8% in 2012, further grow on average by 2% p.a. in 2013 to 2016, decrease by 2% in 2017<br />
and remain constant at the 2017 level thereafter;<br />
• pre-tax discount rate of 17.0% (in US$ terms).<br />
The above estimates are particularly sensitive in the following areas:<br />
• a 10% decrease in future planned revenues causes the carrying amount of the cash-generating unit to exceed its recoverable amount<br />
by US$ 31.7 million.<br />
2012<br />
The impairment loss was recognized in 2012 in the amount of US$ 48.7 million and was allocated fully to goodwill.<br />
The carrying amount of goodwill allocated to the cash-generating unit before the impairment loss was US$ 111.7 million as of December<br />
31, 2012.<br />
The following assumptions were used in the impairment test:<br />
• the forecast extraction volumes decrease by 9% in 2013, decrease by 3% in 2014 and remain at this level in 2015, increase by 24% in<br />
2016 and remain constant at the 2016 level thereafter;<br />
• the forecast coking coal concentrate prices decrease by 18% in 2013, increase by 13% in 2014, increase on average by 6% p.a. in 2015<br />
to 2022, further grow on average by 2% p.a.;<br />
• the forecast steam coal prices decrease by 15% in 2013, increase by 13% in 2014, increase on average by 6% p.a. in 2015 to 2022,<br />
further grow on average by 2% p.a.;<br />
• operating costs are forecast to decrease by 14% in 2013, remain constant at the 2013 level in 2014 to 2015, increase by 26% in 2016,<br />
further grow on average by 4% p.a.;<br />
<strong>Severstal</strong> Annual Report and accounts 2012
company Overview Strategy Performance Sustainability Governance Financial statements Additional information<br />
OAO <strong>Severstal</strong> and subsidiaries<br />
Notes to the consolidated financial statements<br />
for the years ended December 31, 2012, 2011 and 2010<br />
(Amounts expressed in thousands of US dollars, except as otherwise stated)<br />
142<br />
• pre-tax discount rate of 14.7% (in US$ terms).<br />
The above estimates are particularly sensitive in the following areas:<br />
• a 1% increase in discount rate increases the impairment loss by US$ 31.5 million;<br />
• a 10% decrease in future planned revenues increases the impairment loss by US$ 267.4 million.<br />
Other units<br />
2010<br />
The impairment loss was recognized in 2010 in the amount of US$ 9.1 million in relation to specific items of property, plant and<br />
equipment and intangible assets.<br />
2012<br />
The impairment loss was recognized in 2012 in the amount of US$ 3.0 million in relation to specific items of property, plant and<br />
equipment.<br />
<strong>Severstal</strong> Russian Steel segment<br />
Neva-Metall<br />
2010<br />
As a result of value in use calculation no impairment loss was recognized in 2010.<br />
The carrying amount of goodwill allocated to cash-generating unit was US$ 10.6 million as of December 31, 2010.<br />
The following specific assumptions were used in the impairment test:<br />
• cash flow projections are based on financial forecasts approved by management covering a five-year period;<br />
• volumes are assumed to increase on average by 10% p.a. during the forecast period and remain constant at the 2015 level thereafter;<br />
• the forecast sales prices increase by 8% in 2011, increase on average by 5% p.a. in 2012 to 2015 and increase on average by 1.8% p.a.<br />
thereafter;<br />
• operating costs are forecast to increase by 19% in 2011, increase on average by 5% p.a. in 2012 to 2015 and increase on average by<br />
1.8% p.a. thereafter;<br />
• pre-tax discount rate of 13.3% (in US$ terms).<br />
Redaelli Tecna S.p.A.<br />
2010<br />
As a result of value in use calculation no impairment loss was recognized in 2010.<br />
The carrying amount of goodwill allocated to the cash-generating unit was US$ 31.4 million as of December 31, 2010.<br />
The following assumptions were used in the impairment test:<br />
• the forecast sales volumes decrease by 7% in 2011, increase on average by 4% p.a. in 2012 to 2015 and remain constant thereafter;<br />
• forecast sales prices decrease on average by 4% p.a. in 2011 to 2012 and then increase on average by 2% p.a. in 2013 to 2015 and<br />
increase on average by 1.8% p.a. thereafter;<br />
• operating costs are forecast to decrease by 8% in 2011, increase on average by 1% p.a. in 2012 to 2015 and increase on average by<br />
1.8% p.a. thereafter;<br />
• pre-tax discount rate of 16.9% (in US$ terms).<br />
The above estimates are particularly sensitive in the following areas:<br />
• a 1% increase in discount rate causes the carrying amount of the cash-generating unit to exceed its recoverable amount by US$ 5.1<br />
million;<br />
• a 10% decrease in future planned revenues causes the carrying amount of the cash-generating unit to exceed its recoverable amount<br />
by US$ 72.1 million.<br />
2011<br />
As a result of value in use calculation no impairment loss was recognized in 2011.<br />
The carrying amount of goodwill allocated to the cash-generating unit was US$ 30.4 million as of December 31, 2011.<br />
The following assumptions were used in the impairment test:<br />
• the forecast sales volumes decrease by 7% in 2012 and increase on average by 4% p.a. in 2013 to 2016 and remain constant at the<br />
2016 level thereafter;<br />
<strong>Severstal</strong> Annual Report and accounts 2012
company Overview Strategy Performance Sustainability Governance Financial statements Additional information<br />
143<br />
OAO <strong>Severstal</strong> and subsidiaries<br />
Notes to the consolidated financial statements<br />
for the years ended December 31, 2012, 2011 and 2010<br />
(Amounts expressed in thousands of US dollars, except as otherwise stated)<br />
• forecast sales prices decrease by 8% in 2012, increase by 12% in 2013, decrease by 6% in 2014, increase on average by 9% p.a. in 2015<br />
to 2016 and remain constant at the 2016 level thereafter;<br />
• operating costs are forecast to decrease by 14% in 2012, increase on average by 7% p.a. in 2013 to 2016 and remain constant at the<br />
2016 level thereafter;<br />
• pre-tax discount rate of 17.3% (in US$ terms).<br />
The above estimates are particularly sensitive in the following areas:<br />
• a 1% increase in discount rate causes the carrying amount of the cash-generating unit to exceed its recoverable amount by US$ 12.8<br />
million;<br />
• a 10% decrease in future planned revenues causes the carrying amount of the cash-generating unit to exceed its recoverable amount<br />
by US$ 64.2 million.<br />
Other units<br />
2010<br />
The impairment loss related to other cash-generating units within the segment was recognized in the amount of US$ 21.1 million in 2010<br />
and was allocated to specific items of property, plant and equipment in the amount of US$ 10.7 million and intangible assets in the<br />
amount of US$ 10.4 million.<br />
2011<br />
The reversal of impairment loss related to other cash-generating units within the segment was recognized in the amount of US$ 0.4<br />
million in 2011 and was allocated to specific items of property, plant and equipment.<br />
2012<br />
The impairment loss was recognized in the amount of US$ 2.4 million in 2012 and was allocated to specific items of property, plant and<br />
equipment.<br />
<strong>Severstal</strong> International segment<br />
2010<br />
An impairment loss was recognized in the amount of US$ 44.2 million in 2010 and was allocated to specific items of property, plant and<br />
equipment in the amount of US$ 34.1 million and intangible assets in the amount of US$ 10.1 million.<br />
8. Net other non-operating expenses<br />
Year ended December 31,<br />
2012 2011 2010<br />
Social expenditure (31,995) (43,314) (29,067)<br />
Charitable donations (47,423) (39,504) (15,542)<br />
Gain on disposal of subsidiaries and associates (Note 28) 9,873 21,033 -<br />
Depreciation of infrastructure assets (3,405) (1,776) (1,783)<br />
Other 2,414 (1,820) 2,793<br />
(70,536) (65,381) (43,599)<br />
<strong>Severstal</strong> Annual Report and accounts 2012
company Overview Strategy Performance Sustainability Governance Financial statements Additional information<br />
OAO <strong>Severstal</strong> and subsidiaries<br />
Notes to the consolidated financial statements<br />
for the years ended December 31, 2012, 2011 and 2010<br />
(Amounts expressed in thousands of US dollars, except as otherwise stated)<br />
9. Taxation<br />
The following is an analysis of the income tax expense:<br />
144<br />
Year ended December 31,<br />
2012 2011 2010<br />
Current tax charge (226,811) (481,303) (383,054)<br />
Corrections to prior year’s current tax charge 3,325 (4,806) 27,132<br />
Deferred tax (expense)/benefit (39,999) 20,097 (71,384)<br />
Income tax expense (263,485) (466,012) (427,306)<br />
The following table is a reconciliation of the reported net income tax expense and the amount calculated by applying the Russian<br />
statutory tax rate of 20% to reported profit before income tax.<br />
Year ended December 31,<br />
2012 2011 2010<br />
Profit before income tax 1,036,921 2,428,974 1,674,123<br />
Tax charge at Russian statutory rate (207,384) (485,795) (334,825)<br />
Profits taxed at different rates 54,709 4,287 83,758<br />
Corrections to prior years’ current tax charge 3,325 (4,806) 27,132<br />
Non-tax deductible expenses, net (48,656) (41,550) (56,147)<br />
Tax-loss carry forwards expired (1,057) (4,638) -<br />
Changes in non-recognized deferred tax assets (73,361) 71,572 (151,874)<br />
Reassessment of deferred tax liabilities 8,939 (5,082) 4,650<br />
Income tax expense (263,485) (466,012) (427,306)<br />
The composition of the net deferred tax liability based on the temporary differences arising between the fiscal and reporting balance<br />
sheets of the consolidated companies, is given below:<br />
December 31,<br />
2012 2011 2010<br />
Deferred tax assets:<br />
Tax-loss carry forwards 187,088 276,782 300,717<br />
Property, plant and equipment 5,973 8,839 51,954<br />
Intangible assets 262 281 495<br />
Inventory 46,650 35,030 29,965<br />
Accounts receivable 65,198 38,373 18,683<br />
Provisions 134,284 117,206 73,366<br />
Financial investments 94,087 93,734 37,705<br />
Other 73,268 52,742 114,624<br />
Gross deferred tax assets 606,810 622,987 627,509<br />
Less offsetting with deferred tax liabilities (506,014) (523,336) (523,732)<br />
Recognized deferred tax assets 100,796 99,651 103,777<br />
<strong>Severstal</strong> Annual Report and accounts 2012
company Overview Strategy Performance Sustainability Governance Financial statements Additional information<br />
145<br />
OAO <strong>Severstal</strong> and subsidiaries<br />
Notes to the consolidated financial statements<br />
for the years ended December 31, 2012, 2011 and 2010<br />
(Amounts expressed in thousands of US dollars, except as otherwise stated)<br />
December 31,<br />
2012 2011 2010<br />
Deferred tax liabilities:<br />
Property, plant and equipment (615,756) (555,062) (560,735)<br />
Provisions (4,072) (7,812) (3,570)<br />
Intangible assets (143,862) (138,536) (382,392)<br />
Inventory (19,469) (17,290) (23,842)<br />
Investments in joint ventures and associates (29,521) (36,817) (38,164)<br />
Accounts receivable (2,286) (249) (62)<br />
Financial liabilities (7,152) (6,988) (24,875)<br />
Other (21,974) (47,708) (5,163)<br />
Gross deferred tax liabilities (844,092) (810,462) (1,038,803)<br />
Less offsetting with deferred tax assets 506,014 523,336 523,732<br />
Recognized deferred tax liabilities (338,078) (287,126) (515,071)<br />
Net deferred tax liability (237,282) (187,475) (411,294)<br />
The movement in the net deferred tax liability was as follows:<br />
Year ended December 31,<br />
2012 2011 2010<br />
Opening balance (187,475) (411,294) (155,155)<br />
Recognized in income statement (39,999) 8,515 (76,938)<br />
Recognized in other comprehensive income (785) 4,730 (7,626)<br />
Business combinations - - (120,139)<br />
Reclassified to liabilities related to assets held for sale - 198,118 (51,690)<br />
Foreign exchange differences (9,023) 12,456 254<br />
Closing balance (237,282) (187,475) (411,294)<br />
The Group has not recognized cumulative tax-loss carry forwards in the following amounts and with the following expiry dates (stated in<br />
millions of US dollars):<br />
December 31,<br />
2012 2011 2010<br />
In the following year - - 0.1<br />
Between one and five years 86.8 - 67.9<br />
Between five and ten years 116.0 49.9 127.0<br />
Between ten and twenty years 2,216.4 2,014.3 1,836.4<br />
No expiry - - 85.5<br />
2,419.2 2,064.2 2,116.9<br />
Taxable differences, related to investments in subsidiaries where the Group is able to control the timing of the reversal and it is probable<br />
that the temporary difference will not reverse in the foreseeable future, amounted to US$ 6,336.6 million at December 31, 2012<br />
(December 31, 2011: US$ 5,066.2 million; December 31, 2010: US$ 4,603.4 million).<br />
<strong>Severstal</strong> Annual Report and accounts 2012
company Overview Strategy Performance Sustainability Governance Financial statements Additional information<br />
OAO <strong>Severstal</strong> and subsidiaries<br />
Notes to the consolidated financial statements<br />
for the years ended December 31, 2012, 2011 and 2010<br />
(Amounts expressed in thousands of US dollars, except as otherwise stated)<br />
146<br />
10. Related party transactions<br />
Year ended December 31,<br />
2012 2011 2010<br />
Revenue – related parties:<br />
Revenue – associates 86,041 147,345 30,194<br />
Revenue – joint ventures 60,443 48,235 859<br />
Revenue – other related parties 41,617 43,730 31,282<br />
Interest income from related parties:<br />
Interest income from joint ventures 3,245 3,240 -<br />
Interest income from other related parties 31,022 23,350 33,153<br />
222,368 265,900 95,488<br />
Purchases from related parties:<br />
Purchases from associates:<br />
Non-capital expenditures 75,459 74,717 60,586<br />
Purchases from joint ventures:<br />
Non-capital expenditures 252,390 254,504 92,739<br />
Purchases from other related parties:<br />
Non-capital expenditures 38,808 33,657 20,266<br />
Capital expenditures 153 874 6,862<br />
Interest expense 53 68 3,533<br />
366,863 363,820 183,986<br />
<strong>Severstal</strong> Annual Report and accounts 2012
company Overview Strategy Performance Sustainability Governance Financial statements Additional information<br />
147<br />
OAO <strong>Severstal</strong> and subsidiaries<br />
Notes to the consolidated financial statements<br />
for the years ended December 31, 2012, 2011 and 2010<br />
(Amounts expressed in thousands of US dollars, except as otherwise stated)<br />
11. Related party balances<br />
December 31,<br />
2012 2011 2010<br />
Joint ventures’ balances<br />
Short-term trade accounts receivable 4,557 8,048 -<br />
Long-term loans 53,550 35,821 34,792<br />
Long-term promissory notes 19,900 - -<br />
Short-term trade accounts payable 21,886 26,284 7,959<br />
Associates’ balances<br />
Short-term trade accounts receivable 5,136 10,040 3,046<br />
Long-term loans 5,446 3,965 3,915<br />
Long-term trade accounts receivable - 8,859 -<br />
Short-term trade accounts payable 11,392 8,760 6,510<br />
Other related party balances<br />
Cash and cash equivalents at related party bank and pension fund 561,946 689,388 669,643<br />
Short-term deposits with related party bank and pension fund - - 12,627<br />
Accounts receivable from other related parties:<br />
Trade accounts receivable 4,852 3,040 2,603<br />
Advances paid 625 5,506 5,870<br />
Other receivables 298 715 840<br />
Short-term loans 1,027 1,741 487<br />
Short-term promissory notes 2,407 207 4,146<br />
Long-term loans - 2,490 -<br />
Available-for-sale financial assets 812 5,434 7,653<br />
10,021 19,133 21,599<br />
Short-term trade accounts payable to other related parties:<br />
Trade accounts payable 1,909 705 556<br />
Advances received 433 208 -<br />
Liability related to Gold segment separation (Note 27) - 1,546,951 -<br />
Other accounts payable 614 123 1,692<br />
2,956 1,547,987 2,248<br />
Debt financing includes the following balances with other related parties:<br />
Short-term debt financing - 19 -<br />
Long-term debt financing 4,391 4,104 4,315<br />
4,391 4,123 4,315<br />
The amounts outstanding are expected to be settled in cash, except liability related to Gold segment separation. The Group did not hold<br />
any collateral for amounts owed by related parties.<br />
Loans given to related parties were provided at interest rates ranging from nil to 13% per annum in 2012 (from nil to 15% per annum in<br />
2011 and 2010) and were given to finance working capital and investments.<br />
<strong>Severstal</strong> Annual Report and accounts 2012
company Overview Strategy Performance Sustainability Governance Financial statements Additional information<br />
OAO <strong>Severstal</strong> and subsidiaries<br />
Notes to the consolidated financial statements<br />
for the years ended December 31, 2012, 2011 and 2010<br />
(Amounts expressed in thousands of US dollars, except as otherwise stated)<br />
12. Cash and cash equivalents<br />
148<br />
December 31,<br />
2012 2011 2010<br />
Petty cash 374 368 412<br />
Cash at bank 586,216 813,417 1,043,239<br />
Short-term deposits with maturity of less than 3 months 1,139,685 1,049,753 969,011<br />
1,726,275 1,863,538 2,012,662<br />
13. Short-term bank deposits<br />
Short-term bank deposits totaled US$ nil at December 31, 2012 (December 31, 2011: US$ nil, December 31, 2010: US$ 12.7 million) and<br />
consisted of deposits with an original maturity of more than three months but remaining period to maturity of less than one year.<br />
14. Short-term financial investments<br />
December 31,<br />
2012 2011 2010<br />
Available-for-sale financial assets 12,970 16 -<br />
Held-to-maturity securities 5,797 3,619 5,232<br />
Loans 4,981 2,772 3,881<br />
Held-for-trading securities 30 4,093 18,350<br />
23,778 10,500 27,463<br />
15. Trade accounts receivable<br />
December 31,<br />
2012 2011 2010<br />
Customers 1,092,309 1,277,898 1,033,179<br />
Allowance for doubtful debts (51,742) (57,937) (65,342)<br />
1,040,567 1,219,961 967,837<br />
16. Inventories<br />
December 31,<br />
2012 2011 2010<br />
Raw materials and supplies 1,107,363 1,201,155 1,157,403<br />
Finished goods 746,310 780,984 691,778<br />
Work-in-progress 499,225 537,015 519,953<br />
2,352,898 2,519,154 2,369,134<br />
Of the above amounts US$ 36.8 million (December 31, 2011: US$ 24.2 million, December 31, 2010: US$ 709.3 million) were stated at net<br />
realizable value.<br />
During the year ended December 31, 2012, the Group recognized a US$ 48.5 million release and a US$ 163.3 million allowance to reduce<br />
the carrying amount to a net realizable value (2011: US$ 70.8 million and US$ 68.9 million, respectively; 2010: US$ 44.8 million and US$<br />
42.5 million, respectively).<br />
17. Other current assets<br />
December 31,<br />
2012 2011 2010<br />
Advances paid and prepayments 135,846 247,250 248,180<br />
Derivative financial assets 34,808 - -<br />
Other taxes and social security prepaid 16,431 10,159 8,826<br />
Other assets 115,035 69,754 41,177<br />
302,120 327,163 298,183<br />
<strong>Severstal</strong> Annual Report and accounts 2012
company Overview Strategy Performance Sustainability Governance Financial statements Additional information<br />
149<br />
OAO <strong>Severstal</strong> and subsidiaries<br />
Notes to the consolidated financial statements<br />
for the years ended December 31, 2012, 2011 and 2010<br />
(Amounts expressed in thousands of US dollars, except as otherwise stated)<br />
18. Long-term financial investments<br />
December 31,<br />
2012 2011 2010<br />
Loans 59,079 146,621 38,935<br />
Available-for-sale financial assets 26,870 32,347 155,477<br />
Held-to-maturity securities and deposits 22,111 3,294 10,130<br />
108,060 182,262 204,542<br />
19. Investments in associates and joint ventures<br />
The Group’s investments in associates and joint ventures companies are described in the table below. The Group structure and certain<br />
additional information on investments in associates and joint ventures, including ownership percentages, are presented in Note 28.<br />
December 31,<br />
2012 2011 2010<br />
Associates<br />
SPG Mineracao SA 43,123 42,290 -<br />
Iron Mineral Beneficiation Services (Proprietary) Ltd 39,711 17,169 7,177<br />
ZAO Air Liquide <strong>Severstal</strong> 26,971 21,858 17,878<br />
Intex Resources ASA - 12,264 14,609<br />
Other - 1,429 693<br />
Joint ventures<br />
Mountain State Carbon LLC 83,832 102,135 -<br />
Spartan Steel Coating LLC 44,297 46,810 47,507<br />
Gestamp-<strong>Severstal</strong>-Kaluga LLC 17,379 16,316 18,032<br />
Double Eagle Steel Coating Сompany 15,166 14,269 18,476<br />
Gestamp <strong>Severstal</strong> Vsevolozhsk LLC 14,976 13,868 14,907<br />
<strong>Severstal</strong>-Gonvarri-Kaluga LLC 13,794 8,918 10,015<br />
Todlem S.L. 12,252 3,605 3,723<br />
Other 5,002 384 5,547<br />
316,503 301,315 158,564<br />
The following is summarized financial information in respect of associates:<br />
December 31,<br />
2012 2011 2010<br />
Current assets 975,467 1,586,019 107,385<br />
Non-current assets 157,020 187,242 121,949<br />
Short-term liabilities 1,225,608 1,500,621 20,212<br />
Long-term liabilities 69,539 165,916 62,558<br />
Equity (162,660) 106,724 146,564<br />
Year ended December 31,<br />
2012 2011 2010<br />
Revenue 1,301,393 2,746,807 67,647<br />
Net (loss)/income (215,633) 136,265 8,178<br />
The Group’s unrecognized share of losses in Lucchini S.p.A. amounted to US$ 113.9 million for the year ended December 31, 2012.<br />
<strong>Severstal</strong> Annual Report and accounts 2012
company Overview Strategy Performance Sustainability Governance Financial statements Additional information<br />
OAO <strong>Severstal</strong> and subsidiaries<br />
Notes to the consolidated financial statements<br />
for the years ended December 31, 2012, 2011 and 2010<br />
(Amounts expressed in thousands of US dollars, except as otherwise stated)<br />
The following is summarized financial information in respect of joint ventures:<br />
150<br />
December 31,<br />
2012 2011 2010<br />
Current assets 215,391 236,649 119,923<br />
Non-current assets 517,010 478,223 347,489<br />
Short-term liabilities 124,392 147,122 84,228<br />
Long-term liabilities 159,014 114,210 111,484<br />
Equity 448,995 453,540 271,700<br />
Year ended December 31,<br />
2012 2011 2010<br />
Revenue 546,587 609,852 91,749<br />
Net (loss)/income (12,100) 19,785 6,095<br />
20. Property, plant and equipment<br />
Land and<br />
buildings<br />
Plant and<br />
machinery<br />
Other productive<br />
assets<br />
Infrastructure<br />
assets<br />
Constructionin-progress<br />
Total<br />
Cost:<br />
December 31, 2009 2,841,832 9,708,310 518,978 106,784 1,737,792 14,913,696<br />
Reclassifications (18,926) 163,680 (175,453) (811) 31,510 -<br />
Additions - - - - 1,229,687 1,229,687<br />
Business combinations 4,621 117,088 5,453 - 6,899 134,061<br />
Disposals (20,215) (99,457) (5,833) (5,071) (14,609) (145,185)<br />
Business de-combinations (22,409) (42,310) - - - (64,719)<br />
Reclassified to assets held for sale (693,951) (3,397,658) (102,788) (172) (319,585) (4,514,154)<br />
Transfers from/(to) other assets - - 15,511 - (26,706) (11,195)<br />
Transfers 117,307 330,463 26,814 5,874 (480,458) -<br />
Foreign exchange differences (47,894) (133,004) (1,248) (998) (16,786) (199,930)<br />
December 31, 2010 2,160,365 6,647,112 281,434 105,606 2,147,744 11,342,261<br />
Reclassifications 4,451 (16,244) 12,773 (864) (116) -<br />
Additions - - - - 1,873,516 1,873,516<br />
Disposals (16,121) (104,408) (9,354) (1,023) (24,345) (155,251)<br />
Reclassified to assets held for sale (254,136) (352,456) (15,006) (96) (196,147) (817,841)<br />
Transfers (to)/from other assets and<br />
liabilities (30,694) (206) 30,279 (868) (124,153) (125,642)<br />
Transfers 417,072 1,314,725 114,945 3,323 (1,850,065) -<br />
Foreign exchange differences (103,389) (298,464) (16,464) (5,666) (91,612) (515,595)<br />
December 31, 2011 2,177,548 7,190,059 398,607 100,412 1,734,822 11,601,448<br />
Reclassifications (27,282) 63,793 (31,341) (5,170) - -<br />
Additions - - - - 1,424,817 1,424,817<br />
Disposals (8,535) (195,882) (25,364) (613) (2,182) (232,576)<br />
Business de-combinations (754) (11,685) (72) - - (12,511)<br />
Transfers from/(to) other assets and<br />
liabilities 3,809 22,502 6,202 346 (5,445) 27,414<br />
Transfers 118,418 1,051,357 113,747 18,445 (1,301,967) -<br />
Foreign exchange differences 94,938 307,827 14,914 6,730 80,711 505,120<br />
December 31, 2012 2,358,142 8,427,971 476,693 120,150 1,930,756 13,313,712<br />
Of the above amounts of additions to construction-in-progress US$ 34.7 million (2011: US$ 62.1 million, 2010: US$ 42.3 million) is<br />
interest capitalized.<br />
<strong>Severstal</strong> Annual Report and accounts 2012
company Overview Strategy Performance Sustainability Governance Financial statements Additional information<br />
151<br />
OAO <strong>Severstal</strong> and subsidiaries<br />
Notes to the consolidated financial statements<br />
for the years ended December 31, 2012, 2011 and 2010<br />
(Amounts expressed in thousands of US dollars, except as otherwise stated)<br />
The Group applied the weighted average capitalization rate of 8.3% (2011: 7.3%) to determine the amount of borrowing costs eligible for<br />
capitalization for the year ended December 31, 2012.<br />
Depreciation and impairment:<br />
Land and<br />
buildings<br />
Plant and<br />
machinery<br />
Other productive<br />
assets<br />
Infrastructure<br />
assets<br />
Constructionin-progress<br />
December 31, 2009 920,184 4,077,077 261,880 63,312 105,763 5,428,216<br />
Reclassifications 6,740 73,465 (79,064) (1,141) - -<br />
Depreciation expense 95,759 604,997 58,338 1,783 - 760,877<br />
Disposals (9,369) (74,230) (4,281) (1,887) (11,337) (101,104)<br />
Reclassified to assets held for sale (225,023) (1,602,879) (100,593) (51) (33,411) (1,961,957)<br />
Business de-combinations (15,949) (32,337) - - - (48,286)<br />
Transfers 1,488 3,725 140 81 (5,434) -<br />
Impairment/(reversal of impairment)<br />
of assets 5,298 (14,494) 33,307 (22) 17,310 41,399<br />
Foreign exchange differences (11,710) (62,560) (2,057) 1,121 (1,527) (76,733)<br />
December 31, 2010 767,418 2,972,764 167,670 63,196 71,364 4,042,412<br />
Reclassifications 2,613 (12,581) 10,468 (500) - -<br />
Depreciation expense 95,373 523,985 47,987 1,776 - 669,121<br />
Disposals (8,965) (86,333) (8,937) (536) (10,721) (115,492)<br />
Reclassified to assets held for sale (90,245) (133,912) (7,885) (29) (3,061) (235,132)<br />
Transfers - 4,285 82 445 (4,812) -<br />
Transfers from/(to) other assets and<br />
liabilities 6,840 (2,913) (2,575) 3,447 (11,323) (6,524)<br />
Impairment of assets - - 15 391 2,226 2,632<br />
Foreign exchange differences (44,055) (162,499) (7,461) (3,628) (1,320) (218,963)<br />
December 31, 2011 728,979 3,102,796 199,364 64,562 42,353 4,138,054<br />
Reclassifications (10,265) 35,225 (22,394) (2,566) - -<br />
Depreciation expense 77,655 542,783 59,585 3,405 - 683,428<br />
Disposals (5,578) (167,428) (24,286) (561) - (197,853)<br />
Business de-combinations (655) (10,154) (68) - - (10,877)<br />
Transfers from/(to) other assets and<br />
liabilities 4,725 19,303 (268) (232) (4,223) 19,305<br />
Impairment of assets - 28 29 1,172 4,233 5,462<br />
Foreign exchange differences 40,191 159,948 7,375 3,906 2,062 213,482<br />
December 31, 2012 835,052 3,682,501 219,337 69,686 44,425 4,851,001<br />
Total<br />
Net book values:<br />
December 31, 2010 1,392,947 3,674,348 113,764 42,410 2,076,380 7,299,849<br />
December 31, 2011 1,448,569 4,087,263 199,243 35,850 1,692,469 7,463,394<br />
December 31, 2012 1,523,090 4,745,470 257,356 50,464 1,886,331 8,462,711<br />
Other productive assets include transmission equipment, transportation equipment and tools.<br />
<strong>Severstal</strong> Annual Report and accounts 2012
company Overview Strategy Performance Sustainability Governance Financial statements Additional information<br />
OAO <strong>Severstal</strong> and subsidiaries<br />
Notes to the consolidated financial statements<br />
for the years ended December 31, 2012, 2011 and 2010<br />
(Amounts expressed in thousands of US dollars, except as otherwise stated)<br />
21. Intangible assets<br />
Evaluation and<br />
exploration assets<br />
Other intangible<br />
assets<br />
152<br />
Goodwill Mineral rights Software<br />
Total<br />
Cost:<br />
December 31, 2009 703,139 642,426 91,657 308,944 298,918 2,045,084<br />
Additions - 4,753 33,075 64,798 33,336 135,962<br />
Business combinations 7,542 660,251 - 14,961 456 683,210<br />
Transfers from other assets - - 7,422 - 903 8,325<br />
Disposals - (19,985) - - (3,404) (23,389)<br />
Business de-combinations - - - - (13,676) (13,676)<br />
Reclassified to assets held for sale (70,943) - (45,210) - (118,435) (234,588)<br />
Foreign exchange differences (3,516) (7,440) (384) (2,135) (193) (13,668)<br />
December 31, 2010 636,222 1,280,005 86,560 386,568 197,905 2,587,260<br />
Reclassifications - 61,499 8,472 (44,328) (25,643) -<br />
Additions - 44,058 57,112 120,507 1,961 223,638<br />
Transfers from/(to) other assets - 6,731 5,888 73,052 (12,162) 73,509<br />
Disposals - (101) - - (812) (913)<br />
Reclassified to assets held for sale (87,554) (988,781) (2,577) (388,262) (674) (1,467,848)<br />
Foreign exchange differences (5,907) (11,699) (8,088) (17,631) (6,030) (49,355)<br />
December 31, 2011 542,761 391,712 147,367 129,906 154,545 1,366,291<br />
Reclassifications - - 312 1,233 (1,545) -<br />
Additions - 7,940 48,937 55,953 211 113,041<br />
Transfers from other assets - - 2,244 2,241 953 5,438<br />
Foreign exchange differences 9,739 4,586 7,856 1,192 4,414 27,787<br />
December 31, 2012 552,500 404,238 206,716 190,525 158,578 1,512,557<br />
Amortization and impairment:<br />
December 31, 2009 460,311 69,798 19,067 - 126,704 675,880<br />
Amortization expense - 77,680 7,143 - 24,551 109,374<br />
Impairment - - - 982 26,204 27,186<br />
Disposals - (2,312) - (29) (4) (2,345)<br />
Business de-combinations - - - - (13,044) (13,044)<br />
Reclassified to assets held for sale (70,943) - (10,328) - (57,293) (138,564)<br />
Foreign exchange differences (1,043) (337) (215) 3 (577) (2,169)<br />
December 31, 2010 388,325 144,829 15,667 956 106,541 656,318<br />
Reclassifications - 1,556 5,278 683 (7,517) -<br />
Amortization expense - 121,049 11,388 - 1,135 133,572<br />
Impairment - 19 - 3,684 - 3,703<br />
Transfers from/(to) other assets - 20,660 (1,555) (231) 6,295 25,169<br />
Reclassified to assets held for sale - (210,563) (879) (4,179) - (215,621)<br />
Foreign exchange differences (1,492) (3,397) (663) (176) (1,576) (7,304)<br />
December 31, 2011 386,833 74,153 29,236 737 104,878 595,837<br />
Reclassifications - - (189) 460 (271) -<br />
Amortization expense - 20,237 15,249 1,683 5,448 42,617<br />
Impairment 48,655 - - - - 48,655<br />
Transfers from other assets - - 66 - - 66<br />
Foreign exchange differences 1,589 164 1,025 75 1,594 4,447<br />
December 31, 2012 437,077 94,554 45,387 2,955 111,649 691,622<br />
Net book values:<br />
December 31, 2010 247,897 1,135,176 70,893 385,612 91,364 1,930,942<br />
December 31, 2011 155,928 317,559 118,131 129,169 49,667 770,454<br />
December 31, 2012 115,423 309,684 161,329 187,570 46,929 820,935<br />
<strong>Severstal</strong> Annual Report and accounts 2012
company Overview Strategy Performance Sustainability Governance Financial statements Additional information<br />
153<br />
OAO <strong>Severstal</strong> and subsidiaries<br />
Notes to the consolidated financial statements<br />
for the years ended December 31, 2012, 2011 and 2010<br />
(Amounts expressed in thousands of US dollars, except as otherwise stated)<br />
22. Debt finance<br />
December 31,<br />
2012 2011 2010<br />
Eurobonds 2013 543,552 543,552 543,552<br />
Eurobonds 2014 375,000 375,000 375,000<br />
Eurobonds 2016 500,000 500,000 -<br />
Eurobonds 2017 1,000,000 1,000,000 1,000,000<br />
Convertible bonds 2017 475,000 - -<br />
Eurobonds 2022 750,000 - -<br />
Ruble bonds 2012 - 465,895 492,176<br />
Ruble bonds 2013 493,865 465,895 492,176<br />
<strong>Severstal</strong> Columbus bonds 525,000 525,000 525,000<br />
Other issued notes and bonds - 1,783 150,427<br />
Bank financing 991,393 2,017,230 2,474,183<br />
Factoring of receivables 9,632 - -<br />
Other financing 60,195 44,124 68,896<br />
Accrued interest 110,664 110,675 106,629<br />
Discounting (71,061) - -<br />
Unamortized balance of transaction costs (53,700) (73,056) (81,562)<br />
5,709,540 5,976,098 6,146,477<br />
Total debt is denominated in the following currencies:<br />
US Dollars 4,743,206 4,285,094 4,192,629<br />
Rubles 518,002 1,048,915 1,092,543<br />
Euro 448,332 642,089 827,305<br />
Other currencies - - 34,000<br />
5,709,540 5,976,098 6,146,477<br />
Total debt is contractually repayable after the balance sheet date as follows:<br />
Less than one year 1,382,128 1,185,467 1,423,551<br />
Between one and five years 3,070,645 3,256,897 3,096,833<br />
After more than five years 1,256,767 1,533,734 1,626,093<br />
5,709,540 5,976,098 6,146,477<br />
Bonds issued<br />
In April 2004, Citigroup Germany, a non-related party, issued US dollar-denominated loan participation notes in an aggregate principal<br />
amount of US$ 375.0 million for the sole purpose of financing a loan facility between the Group and Citigroup Germany. The loan is due<br />
in April 2014 and bears interest at an annual rate of 9.25% payable semi-annually in April and in October each year. As at December 31,<br />
2012 the amount outstanding under this facility was US$ 375.0 million.<br />
In July 2008, the Group issued US$ 1,250.0 million US dollar-denominated bonds maturing in 2013. Bonds bear an interest rate of 9.75% per<br />
annum which is payable semi-annually in January and July each year. As at December 31, 2012 the amount outstanding under this facility<br />
was US$ 543.6 million.<br />
In February 2010, the Group’s subsidiary <strong>Severstal</strong> Columbus issued US dollar-denominated bonds in an aggregate principal amount of<br />
US$ 525.0 million maturing in 2018. These bonds bear an interest rate of 10.25% per annum, which is payable semi-annually in February<br />
and August each year, beginning in August 2010. As at December 31, 2012 the amount outstanding under this facility was US$ 525.0<br />
million.<br />
In February 2010, the Group issued ruble-denominated bonds in an aggregate principal amount of US$ 498.0 million maturing in 2013.<br />
These bonds bear an interest rate of 9.75% per annum, which is payable semi-annually in February and August each year, beginning in<br />
August 2010. As at December 31, 2012 the amount outstanding under this facility was US$ 493.9 million.<br />
<strong>Severstal</strong> Annual Report and accounts 2012
company Overview Strategy Performance Sustainability Governance Financial statements Additional information<br />
OAO <strong>Severstal</strong> and subsidiaries<br />
Notes to the consolidated financial statements<br />
for the years ended December 31, 2012, 2011 and 2010<br />
(Amounts expressed in thousands of US dollars, except as otherwise stated)<br />
154<br />
In October 2010, the Group issued US$ 1.0 billion US dollar-denominated bonds maturing in 2017. Bonds bear an interest rate of 6.7%<br />
per annum which is payable semi-annually in April and October each year, beginning in April 2011. These bonds were issued under the<br />
Group’s newly established US$ 3.0 billion Loan Participation Note Programme. As at December 31, 2012 the amount outstanding under<br />
this facility was US$ 1.0 billion. The proceeds from the bonds issuance were used to fund the purchase of US$ 706.4 million nominal of<br />
Group’s US$ 1,250.0 million Eurobonds in US dollars and for refinancing of certain other Group’s debts.<br />
In July 2011, the Group issued US$ 500.0 million bonds denominated in US dollars maturing in 2016. These bonds bear an interest rate<br />
of 6.25% per annum, which is payable semi-annually in January and July each year, beginning in January 2012. The proceeds from the<br />
bonds issuance were partially utilized to refinance short-term loan facilities. As at December 31, 2012 the amount outstanding under this<br />
facility was US$ 500.0 million.<br />
In September 2012, the Group issued US$ 475.0 million senior unsecured convertible bonds maturing in 2017. The initial conversion price<br />
was set at US$ 19.08 per share. The conversion rights may be exercised at any time on or after November 5, 2012. The bonds bear an<br />
interest rate of 1.0% per annum, which is payable semi-annually in March and September each year, beginning in March 2013, and a<br />
yield-to-maturity of 2.0% per annum. Holders of the bonds have an option to require an early redemption of their bonds in September<br />
2015 at the accreted principal amount at such time plus accrued interest. The Group also has an option for early redemption, exercisable<br />
starting from October 2015, provided the market value of the Group’s GDRs deliverable on conversion of the bonds exceeds 140.0% of the<br />
accreted principal amount of the bonds over a period specified in terms and conditions of the bonds. The proceeds from the bonds<br />
issuance were mainly used to refinance existing indebtedness and for other general corporate purposes. As a result of this transaction<br />
US$ 66.8 million was recognized in equity, determined based on the market rate of 5.3% per annum. As at December 31, 2012 the<br />
amount outstanding under this facility was US$ 475.0 million.<br />
In October 2012, the Group issued US$ 750.0 million bonds denominated in US dollars maturing in 2022. These bonds bear an interest<br />
rate of 5.9% per annum, which is payable semi-annually in April and October each year, beginning in April 2013. The proceeds from the<br />
bonds issuance will be used for general corporate purposes, including refinancing of debt maturing in 2013. As at December 31, 2012 the<br />
amount outstanding under this facility was US$ 750.0 million.<br />
Bank financing<br />
In December 2007 the Group entered into a syndicated facility with the European Bank for Reconstruction and Development (EBRD)<br />
(subsequently amended in March 2008), for a maximum principal amount of € 600.0 million. The facility expires in 2017 with the<br />
outstanding principal amount being amortized from 2009 until the expiration date and bear interest at EURIBOR six month plus<br />
2.0-2.2%. As at December 31, 2012 the amount outstanding under this facility was US$ 349.2 million.<br />
Debt finance arising from banks and unused credit lines were secured by the following charges:<br />
• US$ 2,716.6 million (December 31, 2011: US$ 2,677.9 million; December 31, 2010: US$ 2,255.0 million) of the net book value of plant<br />
and equipment;<br />
• US$ 1,058.6 million (December 31, 2011: US$ 1,280.8 million; December 31, 2010: US$ 892.3 million) of current assets and revenues<br />
from export contracts;<br />
• US$ nil (December 31, 2011: US$ 5.7 million; December 31, 2010: US$ 112.0 million) of investments to available-for-sale financial<br />
assets;<br />
• all Group’s investment in Mountain State Carbon LLC, Spartan Steel Coating LLC and Double Eagle Steel Coating Company, the Group’s<br />
joint ventures, at December 31, 2012 and 2011;<br />
• all Group’s ownership in Societe Des Mines de Taparko and Guinor Gold Corporation, 50% of Group’s ownership in Mountain State<br />
Carbon LLC, the Group’s subsidiaries, and investments in Spartan Steel Coating LLC and Double Eagle Steel Coating Company, the<br />
Group’s joint ventures, at December 31, 2010.<br />
A part of the Group’s debt financing is subject to certain covenants. The Group complied with all debt covenants, including equity ratios,<br />
during the years ended December 31, 2012, 2011 and 2010.<br />
At the reporting date the Group had US$ 150.0 million (December, 31, 2011: nil; December, 31, 2010: nil) of unused short-term сredit lines<br />
and US$ 772.1 million (December 31, 2011: US$ 393.4 million; December 31, 2010: US$ 350.0 million) of unused long-term credit lines<br />
available to it.<br />
<strong>Severstal</strong> Annual Report and accounts 2012
company Overview Strategy Performance Sustainability Governance Financial statements Additional information<br />
155<br />
OAO <strong>Severstal</strong> and subsidiaries<br />
Notes to the consolidated financial statements<br />
for the years ended December 31, 2012, 2011 and 2010<br />
(Amounts expressed in thousands of US dollars, except as otherwise stated)<br />
23. Other current liabilities<br />
December 31,<br />
2012 2011 2010<br />
Amounts payable to employees 279,831 229,245 189,944<br />
Advances received 207,304 269,094 210,314<br />
Provisions (Note 25) 41,261 64,269 29,161<br />
Accrued expenses 17,620 24,302 23,786<br />
Derivative financial liabilities 10,341 13,242 5,713<br />
Decommissioning liability (Note 25) 7,195 12,403 -<br />
Retirement benefit liability (Note 24) 4,917 8,942 17,127<br />
Lease liabilities 2,109 6,112 7,965<br />
Deferred income 1,592 1,393 61<br />
Other payables 65,777 26,418 70,506<br />
637,947 655,420 554,577<br />
24. Retirement benefit liabilities<br />
The Group provides for its employees the following retirement benefits, which are actuarially calculated as defined benefit obligations:<br />
lump sums payable to employees on retirement, monthly pensions, jubilee benefits, invalidity and death lump sums, burial expenses<br />
compensations, healthcare benefits, life insurance and other benefits.<br />
The current portion of retirement benefit liabilities is included in caption ‘Other current liabilities’. The total amount of the retirement<br />
benefit liabilities is presented in the table below:<br />
December 31,<br />
2012 2011 2010<br />
Current portion 4,917 8,942 17,127<br />
Non-current portion 201,552 161,734 164,555<br />
206,469 170,676 181,682<br />
The Group’s weighted average duration of the defined benefit obligations equaled to 16 years as at December 31, 2012.<br />
The following assumptions were used to calculate the retirement benefit liability:<br />
December 31,<br />
2012 2011 2010<br />
Discount rates:<br />
Russia 6.6% to 7.0% 8.3% to 8.4% 7.3% to 7.8%<br />
USA 3.5% 4.3% 4.8%<br />
Future rates of benefit increase:<br />
Russia 4.7% to 5.3% 4.7% 5.2% to 6.3%<br />
USA Fixed at 0% Fixed at 0% Fixed at 0%<br />
The present value of the defined benefit obligation less the fair value of plan assets is recognized as a retirement benefit liability in the<br />
statement of financial position.<br />
December 31,<br />
2012 2011 2010 2009 2008<br />
Present value of the defined benefit obligation 273,059 230,517 237,109 1,008,654 987,418<br />
Fair value of the plan assets (66,590) (59,841) (55,427) (220,940) (208,122)<br />
Retirement benefit liability 206,469 170,676 181,682 787,714 779,296<br />
<strong>Severstal</strong> Annual Report and accounts 2012
company Overview Strategy Performance Sustainability Governance Financial statements Additional information<br />
OAO <strong>Severstal</strong> and subsidiaries<br />
Notes to the consolidated financial statements<br />
for the years ended December 31, 2012, 2011 and 2010<br />
(Amounts expressed in thousands of US dollars, except as otherwise stated)<br />
The movements in the defined benefit obligation were as follows:<br />
156<br />
Year ended December 31,<br />
2012 2011 2010<br />
Opening balance 230,517 237,109 1,008,654<br />
Reclassified to liabilities related to assets held for sale - - (787,660)<br />
Benefits paid (23,876) (23,820) (55,486)<br />
Interest cost 16,940 17,210 48,551<br />
Service cost 4,856 4,107 20,984<br />
Actuarial losses* 33,998 7,475 14,416<br />
Foreign exchange differences 10,624 (11,564) (12,350)<br />
Closing balance 273,059 230,517 237,109<br />
* Actuarial losses arise primarily from changes in financial assumptions.<br />
The movements in the plan assets were as follows:<br />
Year ended December 31,<br />
2012 2011 2010<br />
Opening balance 59,841 55,427 220,940<br />
Reclassified to liabilities related to assets held for sale - - (162,163)<br />
Contributions made during the year 13,546 11,409 16,588<br />
Benefits paid (16,650) (5,703) (27,944)<br />
Return on assets 5,045 4,162 10,323<br />
Actuarial gains/(losses)* 1,353 (1,409) (470)<br />
Foreign exchange differences 3,455 (4,045) (1,847)<br />
Closing balance 66,590 59,841 55,427<br />
* Actuarial gains/(losses) arise primarily from changes in financial assumptions.<br />
The defined benefit obligation analysis was as follows:<br />
December 31,<br />
2012 2011 2010<br />
Wholly unfunded 161,850 139,994 143,724<br />
Partly funded 111,209 90,523 93,385<br />
273,059 230,517 237,109<br />
The plan assets analysis was as follows:<br />
December 31,<br />
2012 2011 2010<br />
Corporate bonds 36,839 32,283 22,747<br />
Shares in mutual funds 14,028 13,830 12,479<br />
Deposits 8,252 4,488 4,585<br />
Equity instruments 4,231 3,661 8,912<br />
Government bonds 2,511 2,658 2,688<br />
Cash 324 545 1,067<br />
Other investments 405 2,376 2,949<br />
66,590 59,841 55,427<br />
The Group’s best estimate of contributions expected to be paid to the plan in 2013 is US$ 15.9 million.<br />
The Group’s retirement benefit service costs are allocated and recognized in the income statement as part of ‘Cost of sales’ and ‘General<br />
and administrative expenses’ proportionally to related salary expenses.<br />
Interest cost and return on plan assets are recognized as part of ‘Interest expense’; actuarial gains/(losses) are recognized as a separate<br />
component in other comprehensive income.<br />
<strong>Severstal</strong> Annual Report and accounts 2012
company Overview Strategy Performance Sustainability Governance Financial statements Additional information<br />
157<br />
OAO <strong>Severstal</strong> and subsidiaries<br />
Notes to the consolidated financial statements<br />
for the years ended December 31, 2012, 2011 and 2010<br />
(Amounts expressed in thousands of US dollars, except as otherwise stated)<br />
25. Other non-current liabilities<br />
December 31,<br />
2012 2011 2010<br />
Decommissioning liability 129,300 106,899 182,894<br />
Amounts payable to employees 41,229 24,562 29,735<br />
Deferred income 28,545 29,837 2,610<br />
Provisions 15,266 15,404 18,271<br />
Lease liabilities 1,502 1,821 2,894<br />
Derivative financial liabilities 1,191 24,938 16,573<br />
Restructured tax liabilities - - 725<br />
Other liabilities 38,235 29,718 23,447<br />
255,268 233,179 277,149<br />
Decommissioning liability<br />
The Group has environmental liabilities related to restoration of soil and other related works, which are due upon the closures of its mines<br />
and production facilities. These costs are expected to be incurred between 2013 – 2045. The present value of expected cash outflows<br />
were estimated using existing technology, and discounted using a real discount rate. These rates, presented by segment, are as follows:<br />
Discount rates, %<br />
2012 2011 2010<br />
<strong>Severstal</strong> Resources:<br />
Russia 2.1 - 3.7 3.0 - 4.7 0.0 - 2.0<br />
USA 4.0 - 6.5 3.4 - 4.6 1.0 - 3.3<br />
Gold:<br />
Kazakhstan - - 0.1 - 0.9<br />
Burkina Faso - - 0.6<br />
Guinea - - 0.8<br />
The movements in the decommissioning liability were as follows:<br />
Year ended December 31,<br />
2012 2011 2010<br />
Opening balance 119,302 182,894 279,426<br />
Additional accrual 9,798 66,146 10,508<br />
Change in assumptions 8,730 (76,860) -<br />
Interest cost 11,918 15,505 10,597<br />
Business combinations - - 9,828<br />
Usage of decommissioning liability (16,601) (1,103) (21,762)<br />
Reclassified to liabilities related to assets held for sale - (61,262) (104,637)<br />
Foreign exchange differences 3,348 (6,018) (1,066)<br />
Closing balance 136,495 119,302 182,894<br />
The change in assumptions in 2012 and 2011 related to the re-scheduling of the decommissioning of the Vorkutaugol mines and the<br />
change in the discount rate.<br />
<strong>Severstal</strong> Annual Report and accounts 2012
company Overview Strategy Performance Sustainability Governance Financial statements Additional information<br />
OAO <strong>Severstal</strong> and subsidiaries<br />
Notes to the consolidated financial statements<br />
for the years ended December 31, 2012, 2011 and 2010<br />
(Amounts expressed in thousands of US dollars, except as otherwise stated)<br />
158<br />
December 31,<br />
2012 2011 2010<br />
Current portion 7,195 12,403 -<br />
Non-current portion 129,300 106,899 182,894<br />
136,495 119,302 182,894<br />
Provisions<br />
The current portion of provisions is included in the caption ‘Other current liabilities’. The total amount of the provisions is presented in the<br />
table below:<br />
December 31,<br />
2012 2011 2010<br />
Legal claims 32,551 32,375 26,219<br />
Other employee related 6,066 7,400 9,724<br />
Environmental claims 4,062 2,092 2,682<br />
Tax and social security claims 757 26,837 2,555<br />
Other 13,091 10,969 6,252<br />
56,527 79,673 47,432<br />
December 31,<br />
2012 2011 2010<br />
Current portion 41,261 64,269 29,161<br />
Non-current portion 15,266 15,404 18,271<br />
56,527 79,673 47,432<br />
These provisions represent management’s best estimate of the potential losses arising in these cases, calculated based on available<br />
information and appropriate assumptions used. The actual outcome of those cases is currently uncertain and might differ from the<br />
recorded provisions.<br />
The movements in the provisions were as follows:<br />
Year ended December 31,<br />
2012 2011 2010<br />
Opening balance 79,673 47,432 203,038<br />
Charge to the income statement (24,277) 62,987 7,919<br />
Business combinations - - 22,841<br />
Usage of provisions - (6,582) (14,459)<br />
Reclassified to liabilities related to assets held for sale - (23,442) (165,217)<br />
Foreign exchange differences 1,131 (722) (6,690)<br />
Closing balance 56,527 79,673 47,432<br />
<strong>Severstal</strong> Annual Report and accounts 2012
company Overview Strategy Performance Sustainability Governance Financial statements Additional information<br />
159<br />
OAO <strong>Severstal</strong> and subsidiaries<br />
Notes to the consolidated financial statements<br />
for the years ended December 31, 2012, 2011 and 2010<br />
(Amounts expressed in thousands of US dollars, except as otherwise stated)<br />
26. Shareholders’ equity<br />
Share Capital<br />
The Parent Company’s share capital consists of ordinary shares with a nominal value of RUB 0.01 each. Authorized share capital of<br />
<strong>Severstal</strong> at December 31, 2012 comprised 837,718,660 issued and fully paid shares (December 31, 2011 and 2010: 1,007,701,355).<br />
The nominal amount of initial share capital was converted into US dollars using exchange rates during the Soviet period, when the<br />
Government contributed the original capital funds to the enterprise. These capital funds were converted into ordinary shares on<br />
September 24, 1993 and sold by the Government at privatization auctions.<br />
The total value of issued share capital presented in these consolidated financial statements comprised:<br />
Number of shares,<br />
mln.<br />
US$’000<br />
Share capital at December 31, 2010 1,007.7 3,311,288<br />
Share capital at December 31, 2011 1,007.7 3,311,288<br />
Share capital at December 31, 2012 837.7 2,752,728<br />
All shares carry equal voting and distribution rights.<br />
The reconciliation of the number of shares outstanding at the beginning and at the end of the period is presented below:<br />
Number of shares,<br />
mln.<br />
Number of shares outstanding at December 31, 2011 1,005.2<br />
Gold segment separation effect (192.9)<br />
Repurchase of issued shares (1.7)<br />
Number of shares outstanding at December 31, 2012 810.6<br />
Treasury shares<br />
In March 2012, the Group completed the separation of the Gold segment resulting in the increase of the Group’s treasury stock by<br />
192,900,120 shares (Note 27).<br />
On July 26, 2012 ОАО <strong>Severstal</strong>’s share capital was reduced by cancellation of 169,982,695 shares. As a result, the Group’s share capital<br />
decreased by US$ 558.6 million, treasury shares decreased by US$ 1,475.0 million, and additional capital decreased by US$ 916.4 million.<br />
The movement of the Group’s treasury shares is presented below:<br />
Treasury shares<br />
Balance before Gold segment separation 26,303<br />
Gold segment separation effect:<br />
Gold segment’s net identifiable assets 2,290,388<br />
Net identifiable assets attributable to non-controlling interests (274,892)<br />
Disposal costs 12,507<br />
Intercompany debts (364,164)<br />
Repurchase of issued shares 20,480<br />
Cancellation of shares (1,474,965)<br />
Balance at December 31, 2012 235,657<br />
Earnings/(loss) per share<br />
The calculation of basic and diluted earnings/(loss) per share is presented below:<br />
Year ended December 31,<br />
2012 2011 2010<br />
Profit/(loss) for the period attributable to shareholders of OAO <strong>Severstal</strong> 761,962 2,034,833 (574,914)<br />
Interest expense on convertible bonds, net of tax 6,574 - -<br />
Diluted profit/(loss) for the period attributable to shareholders of OAO <strong>Severstal</strong> 768,536 2,034,833 (574,914)<br />
Basic weighted average number of shares outstanding during the period (millions of shares) 839.8 1,005.2 1,005.2<br />
Effect on conversion of convertible bonds (millions of shares) 6.6 - -<br />
Diluted weighted average number of shares outstanding during the period (millions of shares) 846.4 1,005.2 1,005.2<br />
Basic earnings/(loss) per share (US dollars) 0.91 2.02 (0.57)<br />
Diluted earnings/(loss) per share (US dollars) 0.91 2.02 (0.57)<br />
<strong>Severstal</strong> Annual Report and accounts 2012
company Overview Strategy Performance Sustainability Governance Financial statements Additional information<br />
OAO <strong>Severstal</strong> and subsidiaries<br />
Notes to the consolidated financial statements<br />
for the years ended December 31, 2012, 2011 and 2010<br />
(Amounts expressed in thousands of US dollars, except as otherwise stated)<br />
160<br />
Capital management<br />
The Group’s policy is to maintain a strong capital base so as to maintain investor, creditor and market confidence and to sustain future<br />
development of the business. This policy includes compliance with certain externally imposed minimum capital requirements. The Group’s<br />
management constantly monitors profitability and leverage ratios and compliance with the minimum capital requirements. The Group uses<br />
the return on capital employed ratio which is defined as profit before financing and taxation for the last twelve months divided by capital<br />
employed and the leverage ratio calculated as net debt, comprising of long-term and short-term indebtedness less cash, cash equivalents<br />
and short-term bank deposits, divided by shareholder’s equity. The level of dividends is also monitored by the Board of Directors of the Group.<br />
There were no changes in the Group’s approach to capital management during the year.<br />
Dividends<br />
The maximum dividend payable is restricted to the total accumulated retained earnings of the Parent Company determined according to<br />
Russian law.<br />
On December 20, 2010 an Extraordinary Meeting of Shareholders approved an interim dividend of RUB 4.29 (US$ 0.14 at December 20,<br />
2010 exchange rate) per share and per GDR for the nine months of 2010.<br />
On June 27, 2011 the Meeting of Shareholders approved an annual dividend of RUB 2.42 (US$ 0.09 at June 27, 2011 exchange rate) per<br />
share and per GDR for the year 2010 and an interim dividend of RUB 3.9 (US$ 0.14 at June 27, 2011 exchange rate) per share and per<br />
GDR for the first quarter of 2011.<br />
On September 30, 2011 the Meeting of Shareholders approved an interim dividend of RUB 4.37 (US$ 0.14 at September 30, 2011<br />
exchange rate) per share and per GDR for the first six months of 2011.<br />
On December 30, 2011 an Extraordinary Meeting of Shareholders approved an interim dividend of RUB 3.36 (US$ 0.10 at December 30,<br />
2011 exchange rate) per share and per GDR for the first nine months of 2011.<br />
On June 28, 2012 the Meeting of Shareholders approved an annual dividend of RUB 3.56 (US$ 0.11 at June 28, 2012 exchange rate) per<br />
share and per GDR for the year 2011 and an interim dividend of RUB 4.07 (US$ 0.12 at June 28, 2012 exchange rate) per share and per<br />
GDR for the first quarter of 2012.<br />
On September 27, 2012 the Meeting of Shareholders approved an interim dividend of RUB 1.52 (US$ 0.05 at September 27, 2012<br />
exchange rate) per share and per GDR for the first six months of 2012.<br />
On December 20, 2012 an Extraordinary Meeting of Shareholders approved an interim dividend of RUB 3.18 (US$ 0.10 at December 20,<br />
2012 exchange rate) per share and per GDR for the nine months of 2012.<br />
27. Discontinued operations and assets held for sale<br />
The Group’s discontinued operations represented the Lucchini segment, <strong>Severstal</strong> Sparrows Point LLC, <strong>Severstal</strong> Warren LLC, <strong>Severstal</strong><br />
Wheeling Inc and Mountain State Carbon LLC, which were an operating segment within the <strong>Severstal</strong> International reporting segment,<br />
and the Gold segment, following the management’s decision to dispose of these businesses.<br />
The results of discontinued operations were as follows:<br />
Year ended December 31,<br />
2012 2011 2010<br />
Revenue 161,072 1,949,534 5,041,064<br />
Expenses (73,252) (1,720,251) (5,357,717)<br />
Loss on remeasurement of disposal groups to fair value less costs to sell - - (1,300,050)<br />
Profit/(loss) before income tax 87,820 229,283 (1,616,703)<br />
Income tax expense (10,112) (77,605) (144,693)<br />
Profit/(loss) net of tax 77,708 151,678 (1,761,396)<br />
Net (loss)/gain on disposal (31,345) 59,095 -<br />
Profit/(loss) for the period 46,363 210,773 (1,761,396)<br />
Attributable to:<br />
shareholders of OAO <strong>Severstal</strong> 29,597 127,563 (1,800,086)<br />
non-controlling interests 16,766 83,210 38,690<br />
Lucchini segment<br />
In March 2010, the Group acquired a 20.2% stake in Lucchini S.p.A. from a Lucchini family company for a total consideration of € 82.5 million<br />
(US$ 113.3 million at the transaction date exchange rate). After the acquisition, the Group’s share in the capital of Lucchini S.p.A. became 100%.<br />
In June 2010, the Group sold its 50.8% stake in Lucchini S.p.A. to the Majority Shareholder for a total consideration of € 1 (US$ 1.2 at the<br />
transaction date exchange rate). The Group continued to consolidate the Lucchini segment primarily due to a call option exercisable within<br />
<strong>Severstal</strong> Annual Report and accounts 2012
company Overview Strategy Performance Sustainability Governance Financial statements Additional information<br />
161<br />
OAO <strong>Severstal</strong> and subsidiaries<br />
Notes to the consolidated financial statements<br />
for the years ended December 31, 2012, 2011 and 2010<br />
(Amounts expressed in thousands of US dollars, except as otherwise stated)<br />
the following five years and a contractual entitlement, for the benefit of the Group, to any gain on a subsequent sale of this stake to a third<br />
party. In view of the projected disposal the Group classified the Lucchini segment as assets held for sale and discontinued operations.<br />
The fair value less costs to sell of the Lucchini segment as of December 31, 2010 was measured using a combination of valuation<br />
techniques. The loss on remeasurement of the Lucchini segment to fair value less costs to sell recognized in 2010 in the amount of US$<br />
1,010.3 million was allocated to property, plant and equipment and intangible assets on a pro-rata basis.<br />
In February 2011, the Group signed an amendment to Lucchini’s share purchase agreement with the Majority Shareholder which<br />
cancelled the call option and the entitlement, for the benefit of the Group, to any gain on a subsequent sale of this stake to a third party.<br />
Effective from the date of this amendment the Group accounts for the investment in Lucchini using the equity method.<br />
Upon deconsolidation, the Group’s investments in Lucchini were stated at fair values of US$ nil with the difference on remeasuring to fair<br />
value recognized within the profit/(loss) from discontinued operations.<br />
A cumulative net loss of US$ 46.8 million was recognized in the Group’s other comprehensive income as at December 31, 2010 in relation<br />
to foreign exchange differences and changes in cash flow hedges for the Lucchini segment.<br />
North America disposal group<br />
As of December 31, 2010 the North America disposal group was measured at the fair value less costs to sell determined based on price<br />
offers available.<br />
The loss on remeasurement of the North America disposal group to fair value less costs to sell recognized in 2010 in the amount of US$<br />
289.8 million was allocated to property, plant and equipment and intangible assets on a pro-rata basis.<br />
In March 2011, the Group sold its 100% stake in <strong>Severstal</strong> Sparrows Point LLC, <strong>Severstal</strong> Warren LLC, <strong>Severstal</strong> Wheeling Inc and a 50% stake<br />
in Mountain State Carbon LLC. The remaining share in Mountain State Carbon LLC of 50% is accounted for using the equity method.<br />
Upon deconsolidation, the Group’s investment in Mountain State Carbon LLC was stated at fair value of US$ 116.1 million with the<br />
difference on remeasuring to fair value recognized within the profit/(loss) from discontinued operations.<br />
A cumulative net income of US$ 33.0 million was recognized in the Group’s other comprehensive income as at December 31, 2010 in<br />
relation to the fair value adjustment upon acquisition of subsidiary to previously held interest for the North America disposal group.<br />
Gold segment<br />
In November 2011, the Group decided to separate the Gold segment by exchange of 100% shares of Nord Gold N.V., the segment’s<br />
holding company, for OAO <strong>Severstal</strong> shares and GDRs based on the relative fair values.<br />
At December 31, 2011 the Group recognized the liability for the Gold segment separation of US$ 1,547.0 million (Note 11) in treasury<br />
shares equal to the book value of the Gold segment’s net assets attributable to shareholders of OAO <strong>Severstal</strong> at that date. The book<br />
value was used for the assessment of liability since the Gold segment continued to be controlled by the Group’s majority shareholder after<br />
separation. The transaction costs of US$ 13.0 million were also recognized in treasury shares as at December 31, 2011.<br />
In the year ended December 31, 2012 the Group additionally recognised in treasury shares the amount of US$ 103.8 million as a result of<br />
further increase in the Group’s share in the Gold segment’s net assets compared to December 31, 2011.<br />
A cumulative net income of US$ 119.5 million was recognized in the Group’s other comprehensive income as at December 31, 2011 in relation<br />
to foreign exchange differences and changes in fair value of available-for-sale financial assets for the Gold segment’s foreign operations.<br />
In March 2012, the Group completed the separation of the Gold segment by exchange of 100% shares of Nord Gold N.V., the segment’s<br />
holding company, for OAO <strong>Severstal</strong> shares and GDRs resulting in the increase of the Group’s treasury stock by 192,900,120 shares (Note 26).<br />
A summary of assets and liabilities disposed during the years ended December 31, 2012, 2011 and 2010 is presented below:<br />
Year ended December 31,<br />
2012 2011 2010<br />
Assets held for sale (2,827,037) (3,599,109) -<br />
Liabilities related to assets held for sale 536,649 3,495,149 -<br />
Net identifiable assets (2,290,388) (103,960) -<br />
Foreign exchange differences and other reserves 76,089 (53,872) -<br />
Fair value adjustment for equity accounted investments - 83,943 -<br />
Consideration:<br />
Consideration in cash - 84,094 -<br />
Consideration in other financial assets* (107,434) 67,600 -<br />
Selling costs - (18,710) -<br />
Net (loss)/gain on disposal (31,345) 59,095 -<br />
Net change in cash and cash equivalents - 84,094 -<br />
* In the year ended December 31, 2012 the Group recognised an impairment allowance in the amount of US$ 107.4 million within the profit/(loss) from discontinued operations<br />
in respect of consideration in other financial assets receivable from the sale of the North America disposal group.<br />
<strong>Severstal</strong> Annual Report and accounts 2012
company Overview Strategy Performance Sustainability Governance Financial statements Additional information<br />
OAO <strong>Severstal</strong> and subsidiaries<br />
Notes to the consolidated financial statements<br />
for the years ended December 31, 2012, 2011 and 2010<br />
(Amounts expressed in thousands of US dollars, except as otherwise stated)<br />
162<br />
The Group’s assets held for sale represented the Gold segment that was classified as held for sale as at December 31, 2011 and the<br />
Lucchini segment and <strong>Severstal</strong> Sparrows Point LLC, <strong>Severstal</strong> Warren LLC, <strong>Severstal</strong> Wheeling Inc and Mountain State Carbon LLC as at<br />
December 31, 2010.<br />
The major classes of assets and liabilities of the disposal groups measured at the lower of carrying amount and fair value less costs to sell<br />
at December 31, 2012, 2011 and 2010 were as follows:<br />
December 31,<br />
2012 2011 2010<br />
Current assets:<br />
Cash and cash equivalents - 217,133 208,928<br />
Short-term financial investments - 3,596 5,862<br />
Trade accounts receivable - 367 711,162<br />
Accounts receivable from related parties - 594 3,835<br />
Inventories - 387,590 1,135,314<br />
VAT recoverable - 57,031 8,870<br />
Income tax recoverable - 3,051 13,163<br />
Other current assets - 73,301 65,429<br />
Total current assets - 742,663 2,152,563<br />
Non-current assets:<br />
Long-term financial investments - 86,370 38,972<br />
Investments in associates and joint ventures - 4,775 70<br />
Property, plant and equipment - 582,709 1,204,978<br />
Intangible assets - 1,252,227 70,335<br />
Deferred tax assets - 2,812 -<br />
Other non-current assets - 5,754 42,964<br />
Total non-current assets - 1,934,647 1,357,319<br />
Total assets - 2,677,310 3,509,882<br />
Current liabilities:<br />
Trade accounts payable - 95,190 680,535<br />
Short-term debt finance - 58,811 1,071,286<br />
Income tax payable - 18,176 4,360<br />
Other taxes and social security payable - 25,496 64,433<br />
Other current liabilities - 76,961 223,160<br />
Total current liabilities - 274,634 2,043,774<br />
Non-current liabilities:<br />
Long-term debt finance - - 354,820<br />
Deferred tax liabilities - 200,930 53,723<br />
Retirement benefit liabilities - - 592,772<br />
Other non-current liabilities - 74,559 227,265<br />
Total non-current liabilities - 275,489 1,228,580<br />
Total liabilities - 550,123 3,272,354<br />
As of December 31, 2010 the short-term debt finance included US$ 767.0 million of the Lucchini segment debt finance reclassified to<br />
short-term due to breach of finance covenants of related loan agreements.<br />
<strong>Severstal</strong> Annual Report and accounts 2012
company Overview Strategy Performance Sustainability Governance Financial statements Additional information<br />
163<br />
OAO <strong>Severstal</strong> and subsidiaries<br />
Notes to the consolidated financial statements<br />
for the years ended December 31, 2012, 2011 and 2010<br />
(Amounts expressed in thousands of US dollars, except as otherwise stated)<br />
28. Subsidiaries, associates and joint ventures<br />
The following is a list of the Group’s significant subsidiaries, associates and joint ventures and the effective ownership holdings therein:<br />
December 31,<br />
Company 2012 2011 2010 Location Activity<br />
<strong>Severstal</strong> Russian Steel segment:<br />
Subsidiaries:<br />
CJSC Severgal 100.0% 100.0% 100.0% Russia Hot dip galvanizing<br />
<strong>Severstal</strong> SMC-Kolpino LLC 100.0% 100.0% 100.0% Russia Steel constructions<br />
<strong>Severstal</strong> TPZ-Sheksna LLC 100.0% 100.0% 100.0% Russia Steel constructions<br />
CJSC <strong>Severstal</strong> Steel Solutions 100.0% 100.0% 100.0% Russia Steel constructions<br />
ZAO <strong>Severstal</strong> LPM Balakovo 100.0% 100.0% 100.0% Russia Iron & steel mill<br />
SSM-Tyazhmash LLC 100.0% 100.0% 100.0% Russia Repairs&construction<br />
JSC Domnaremont 65.5% 65.5% 65.5% Russia Repairs&construction<br />
<strong>Severstal</strong>-Promservice LLC 99.9% 99.9% 99.9% Russia Repairs&construction<br />
JSC Metallurgremont 75.0% 75.0% 75.0% Russia Repairs&construction<br />
Victory Industries Inc 99.9% 99.9% 99.9% USA Repairs&construction<br />
Aircompany <strong>Severstal</strong> Ltd 100.0% 100.0% 100.0% Russia Air transport<br />
<strong>Severstal</strong> Export GmbH 99.8% 99.8% 99.8% Switzerland* Steel sales<br />
JSC <strong>Severstal</strong>lat 100.0% 84.2% 84.2% Latvia* Steel sales<br />
AS Latvijas Metals 100.0% 84.2% 84.2% Latvia* Steel sales<br />
ZAO SeverStalBel 100.0% 100.0% 100.0% Belarus* Steel sales<br />
<strong>Severstal</strong>-Ukraine LLC 100.0% 100.0% 51.0% Ukraine* Steel sales<br />
JSC Neva-Metall 100.0% 100.0% 100.0% Russia Shipping operations<br />
Upcroft Limited 100.0% 100.0% 100.0% Cyprus* Holding company<br />
Varndell Limited n/a n/a 100.0% Cyprus* Holding company<br />
Baracom Limited 100.0% 100.0% 100.0% Cyprus* Holding company<br />
JSC Vtorchermet 85.6% 85.6% 85.6% Russia Processing scrap<br />
ZAO Rospromresursy 100.0% 100.0% 100.0% Russia Processing scrap<br />
JSC Murmanskvtormet 74.6% 74.6% 74.6% Russia Processing scrap<br />
JSC Arhangelski Vtormet 75.0% 75.0% 75.0% Russia Processing scrap<br />
ZAO Trade House <strong>Severstal</strong>-Invest 100.0% 100.0% 100.0% Russia Metal sales<br />
ZAO North Steel Company 99.9% 99.9% 99.9% Russia Leasing<br />
JSC Rostovmetall 100.0% 84.8% 95.0% Russia Leasing<br />
PPTK-1 LLC 100.0% 100.0% 100.0% Russia Leasing<br />
JSC RC Group 100.0% 100.0% 100.0% Russia Leasing<br />
CJSC Izhora Pipe Mill 100.0% 100.0% 100.0% Russia Wide pipes<br />
JSC <strong>Severstal</strong>-Metiz 100.0% 100.0% 100.0% Russia Steel machining<br />
JSC Dneprometiz 98.7% 98.7% 98.7% Ukraine Steel machining<br />
Redaelli Tecna S.p.A. 100.0% 100.0% 100.0% Italy Steel machining<br />
UniFence LLC 100.0% 100.0% 100.0% Russia Steel machining<br />
Associates:<br />
ZAO Air Liquide <strong>Severstal</strong> 25.0% 25.0% 25.0% Russia<br />
Production liquid<br />
oxygen<br />
Lucchini S.p.A. 49.2% 49.2% n/a France Holding company<br />
G.S.I. Lucchini S.p.A. 34.1% 34.1% n/a Italy Steel spheres<br />
Servola S.p.A. 49.2% 49.2% n/a Italy Asset holding<br />
Sideris Steel S.A.S 49.2% 49.2% n/a France Investment holding<br />
Lucchini Holland B.V. 49.2% 49.2% n/a The Netherlands Investment holding<br />
Bari Fonderie Meridionali S.p.A. n/a 49.2% n/a Italy Forgings<br />
(*) <strong>Severstal</strong> Russian Steel segment contains Russian production entities, foreign trading companies, which sell products primarily produced in Russia, and other foreign<br />
companies, which either provide services to Russian production entities or are managed from Russia.<br />
<strong>Severstal</strong> Annual Report and accounts 2012
company Overview Strategy Performance Sustainability Governance Financial statements Additional information<br />
OAO <strong>Severstal</strong> and subsidiaries<br />
Notes to the consolidated financial statements<br />
for the years ended December 31, 2012, 2011 and 2010<br />
(Amounts expressed in thousands of US dollars, except as otherwise stated)<br />
164<br />
December 31,<br />
Company 2012 2011 2010 Location Activity<br />
<strong>Severstal</strong> Russian Steel segment (continue):<br />
Joint ventures:<br />
Todlem S.L. 25.0% 25.0% 25.0% Spain Holding company<br />
<strong>Severstal</strong>-Gonvarri-Kaluga LLC 50.0% 50.0% 50.0% Russia Iron & steel mill<br />
Gestamp-<strong>Severstal</strong>-Kaluga LLC 25.0% 25.0% 25.0% Russia<br />
Production car body<br />
components<br />
Gestamp <strong>Severstal</strong> Vsevolozhsk LLC 25.0% 25.0% 25.0% Russia<br />
Production car body<br />
components<br />
Subsidiary classified as held for sale:<br />
OOO <strong>Severstal</strong>-metiz: welding consumables n/a n/a 100.0% Russia Welding consumables<br />
<strong>Severstal</strong> International segment:<br />
Subsidiaries:<br />
<strong>Severstal</strong> US Holdings LLC 100.0% 100.0% 100.0% USA Holding company<br />
<strong>Severstal</strong> Dearborn LLC 100.0% 100.0% 100.0% USA Iron & steel mill<br />
<strong>Severstal</strong> Columbus LLC 100.0% 100.0% 100.0% USA Steel mill<br />
Associate:<br />
Delaco Processing LLC 49.0% 49.0% 49.0% USA Steel slitting<br />
Joint ventures:<br />
Spartan Steel Coating LLC 48.0% 48.0% 48.0% USA Hot dip galvanizing<br />
Double Eagle Steel Coating Сompany 50.0% 50.0% 50.0% USA Electro-galvanizing<br />
Bethlehem Roll Technologies LLC n/a n/a 50.0% USA Grinding steel mill rolls<br />
Ohio Coatings Company n/a n/a 50.0% USA Tin plate steel<br />
Mississippi Steel Processing LLC 20.0% 20.0% 20.0% USA Steel service center<br />
Mountain State Carbon LLC 50.0% 50.0% n/a USA Coking coal<br />
Subsidiaries classified as discontinued operations*:<br />
<strong>Severstal</strong> Warren LLC n/a n/a 100.0% USA Iron & steel mill<br />
<strong>Severstal</strong> Sparrows Point LLC n/a n/a 100.0% USA Iron & steel mill<br />
<strong>Severstal</strong> Wheeling Inc n/a n/a 100.0% USA Steel mill<br />
Mountain State Carbon LLC n/a n/a 100.0% USA Coking coal<br />
Lucchini segment (classified as discontinued operation)*:<br />
Subsidiaries:<br />
Lucchini S.p.A. n/a n/a 49.2% France Holding company<br />
Ascometal S.A.S n/a n/a 49.2% France Steel manufacturing<br />
Ascometal GmbH n/a n/a 49.2% Germany Sales<br />
Bari Fonderie Meridionali S.p.A. n/a n/a 49.2% Italy Forgings<br />
G.S.I. Lucchini S.p.A. n/a n/a 34.1% Italy Steel spheres<br />
Lucchini Asia Pacific Pte Ltd n/a n/a 49.2% Singapore Sales<br />
Lucchini Holland B.V. n/a n/a 49.2%<br />
The<br />
Netherlands Investment holding<br />
Lucchini Iberia SI n/a n/a 49.2% Spain Sales<br />
Lucchini USA Inc n/a n/a 49.2% USA Sales<br />
Servola S.p.A. n/a n/a 49.2% Italy Asset holding<br />
Sideris Steel S.A.S n/a n/a 49.2% France Investment holding<br />
Associates:<br />
ESPRA S.A.S n/a n/a 17.2% France Steel scrap<br />
Tecnologie Ambientali Pulite S.p.A. n/a n/a 12.2% Italy Environmental services<br />
GICA SA n/a n/a 12.3% Switzerland Carbon dioxide trading<br />
(*) Note 27.<br />
<strong>Severstal</strong> Annual Report and accounts 2012
company Overview Strategy Performance Sustainability Governance Financial statements Additional information<br />
165<br />
OAO <strong>Severstal</strong> and subsidiaries<br />
Notes to the consolidated financial statements<br />
for the years ended December 31, 2012, 2011 and 2010<br />
(Amounts expressed in thousands of US dollars, except as otherwise stated)<br />
December 31,<br />
Company 2012 2011 2010 Location Activity<br />
<strong>Severstal</strong> Resources segment:<br />
Subsidiaries:<br />
JSC Karelsky Okatysh 100.0% 100.0% 100.0% Russia Iron ore pellets<br />
JSC Olcon 100.0% 100.0% 100.0% Russia Iron ore concentrate<br />
<strong>Severstal</strong> Liberia Iron Ore Ltd 100.0% 61.5% 61.5% Liberia Iron ore<br />
JSC Vorkutaugol 99.0% 88.1% 88.1% Russia Coking coal concentrate<br />
PBS Coals Limited 100.0% 100.0% 100.0% USA Coking coal concentrate<br />
SPB-Giproshakht Limited 100.0% 100.0% 100.0% Russia Engineering<br />
Mining Holding Company LLC 100.0% 100.0% 100.0% Russia Holding company<br />
Lybica Holding B.V. 100.0% 100.0% 100.0% The Netherlands Holding company<br />
7029740 Canada Limited 100.0% 100.0% 100.0% Canada Holding company<br />
Altcom Limited 100.0% 100.0% 100.0% Cyprus Holding company<br />
Associates:<br />
Iron Mineral Beneficiation Services (Proprietary) Ltd 33.0% 33.0% 25.6%<br />
Republic of<br />
South Africa<br />
Research & investing<br />
Intex Resources ASA n/a 21.7% 21.7% Norway Mining and exploration<br />
SPG Mineracao SA 25.0% 25.0% n/a Brazil Iron ore<br />
Gold segment (classified as discontinued operation)*:<br />
Subsidiaries:<br />
OOO Neryungri Metallic n/a 100.0% 100.0% Russia Gold mining<br />
ZАO Mine Аprelkovo n/a 100.0% 100.0% Russia Gold mining<br />
Celtic Resources Holdings Ltd n/a 100.0% 100.0% Ireland Holding company<br />
JSC FIC Alel n/a 100.0% 100.0% Kazakhstan Gold mining<br />
Zherek LLP n/a 100.0% 100.0% Kazakhstan Gold mining<br />
High River Gold Mines Ltd n/a 75.1% 72.6% Canada Holding company<br />
OJSC Buryatzoloto n/a 63.8% 61.6% Russia Gold mining<br />
Berezitovy Rudnik LLC n/a 75.0% 72.6% Russia Gold mining<br />
Societe Des Mines de Taparko n/a 67.6% 65.4% Burkina Faso Gold mining<br />
Semgeo LLP n/a 100.0% 100.0% Kazakhstan Gold mining<br />
Crew Gold Corporation n/a 100.0% 93.4% Canada Holding company<br />
Societe Miniere de Dinguiraye n/a 100.0% 93.4% Guinea Gold mining<br />
Nord Gold N.V. n/a 100.0% 100.0% The Netherlands Holding company<br />
(*) Note 27.<br />
In addition, at the reporting date, a further 70 (December 31, 2011: 111; December 31, 2010: 53) subsidiaries, associates and a joint<br />
venture, which are not material to the Group, either individually or in aggregate, have been included in these consolidated financial<br />
statements.<br />
Information on carrying amounts of associates and joint ventures is disclosed in Note 19 of these consolidated financial statements.<br />
<strong>Severstal</strong> Annual Report and accounts 2012
company Overview Strategy Performance Sustainability Governance Financial statements Additional information<br />
OAO <strong>Severstal</strong> and subsidiaries<br />
Notes to the consolidated financial statements<br />
for the years ended December 31, 2012, 2011 and 2010<br />
(Amounts expressed in thousands of US dollars, except as otherwise stated)<br />
166<br />
Investments in associates and other equity investments<br />
Investments in 2010<br />
In May 2010, the Group acquired a 16.5% stake in Core Mining Limited (“СML”) for a total consideration of US$ 15.0 million. CML is a<br />
private company registered in the Isle of Man focused on the exploration, development and operation of iron ore projects in Central and<br />
Western Africa, mainly in Republic of Congo (Brazzaville) and Republic of Gabon.<br />
In September 2010, the Group acquired a 21.7% stake in Intex Resources ASA (“Intex”) for a total consideration of US$ 13.0 million. Intex<br />
is a public mining and exploration company listed on Oslo Stock Exchange with its headquarters in Oslo, Norway. Intex’s main asset is the<br />
Mindoro Nickel Project — a substantial nickel laterite deposit in the Philippines. In addition, Intex has two molybdenum assets in Norway,<br />
as well as Maniitsoq, a diamond province in Greenland.<br />
During 2010, the Group acquired an 11% stake in Sacre-Coeur Minerals Ltd (“SCM”) for a total consideration of US$ 6.2 million, increasing<br />
its ownership up to 18.1%. SCM is engaged in the acquisition, exploration and development of properties for the potential mining of gold<br />
and metals in South America, initially focusing on exploration for gold on its properties in Guyana.<br />
During 2010, the Group acquired a 25.6% stake in Iron Mineral Beneficiation Services (Proprietary) Limited (IMBS) for a total<br />
consideration of US$ 35.7 million, of which US$ 28.2 million are payable during the next four years based on the future performance of<br />
the company. IMBS is a research and development company based in Johannesburg, South Africa. IMBS has developed a coal-based<br />
Finesmelt technology capable of processing unusable iron ore fines and thermal coal into valuable metallic products similar to DRI/HBI.<br />
Currently IMBS is developing its first commercial project in Phalaborwa, South Africa.<br />
Investments in 2011<br />
In March 2011, the Group acquired a 7.4% stake in Iron Mineral Beneficiation Services (Proprietary) Limited (IMBS) for a total<br />
consideration of US$ 7.4 million, increasing its ownership interest up to 33.0%.<br />
In May 2011, the Group acquired a 25.0% stake in SPG Mineracao SA for a total consideration of US$ 49.0 million, of which US$ 25.0<br />
million are payable during the next three years. The Group has also entered into a call option agreement to purchase an additional 50%<br />
stake in this company, exercisable upon fulfillment of certain future conditions. SPG Mineracao SA owns exploration licenses for a number<br />
of high prospective iron ore properties in the northern state of Amapa, Brazil.<br />
Acquisition of subsidiary from third parties<br />
During October-November 2010, the Group paid a US$ 7.2 million of contingent consideration in respect of the acquired 61.5% stake in<br />
African Iron Ore Group Ltd (re-named to <strong>Severstal</strong> Liberia Iron Ore Ltd) in December 2008.<br />
Acquisitions of non-controlling interests<br />
Acquisition in 2011<br />
In March 2011, the Group acquired an additional 49.0% stake in <strong>Severstal</strong>-Ukraine LLC for a total consideration of US$ 3.0 million,<br />
increasing its ownership interest up to 100%.<br />
Acquisitions in 2012<br />
In January 2012, the Group acquired an additional 15.8% stake in JSC <strong>Severstal</strong>lat for a total consideration of EUR 6.0 million (US$ 7.8<br />
million at the transaction date exchange rate), increasing its ownership interest up to 100%.<br />
In April 2012, the Group acquired an additional 38.5% stake in <strong>Severstal</strong> Liberia Iron Ore Ltd for a total consideration of US$ 115.0<br />
million, increasing its ownership interest up to 100%.<br />
During October – December 2012, the Group acquired an additional 14.8% stake in JSC Vorkutaugol for a total consideration of US$ 70.9<br />
million, increasing its ownership interest up to 99.0%.<br />
Disposal of associate<br />
In January 2012, the Group sold its 21.7% stake in Intex for a total consideration of US$ 20.0 million.<br />
<strong>Severstal</strong> Annual Report and accounts 2012
company Overview Strategy Performance Sustainability Governance Financial statements Additional information<br />
167<br />
OAO <strong>Severstal</strong> and subsidiaries<br />
Notes to the consolidated financial statements<br />
for the years ended December 31, 2012, 2011 and 2010<br />
(Amounts expressed in thousands of US dollars, except as otherwise stated)<br />
Disposals of subsidiaries (other than discontinued operations)<br />
Disposal in 2010<br />
In May 2010, the Group sold Northern Steel Group, a group of companies within the <strong>Severstal</strong> International segment, for a total<br />
consideration of US$ 124.0 million.<br />
Disposals in 2011<br />
In March 2011, the Group sold its 100% stake in SSM RP Holding B.V. and its wholly owned subsidiary OOO <strong>Severstal</strong>-metiz: welding<br />
consumables for a total consideration of US$ 12.9 million.<br />
In July 2011, the Group sold its 91.6% stake in OAO Stalmag for a total consideration of RUB 448 thousand (US$ 14 thousand).<br />
A summary of assets and liabilities disposed during 2012, 2011 and 2010 is presented below:<br />
Year ended December 31,<br />
2012 2011 2010<br />
Trade accounts receivable - - (49,723)<br />
Inventories - - (90,841)<br />
Other assets - - (1,547)<br />
Property, plant and equipment - - (16,433)<br />
Intangible assets - - (632)<br />
Assets held for sale - (14,884) -<br />
Trade accounts payable - - 35,307<br />
Liabilities related to assets held for sale - 23,003 -<br />
Other liabilities - - 5,222<br />
Net identifiable assets - 8,119 (118,647)<br />
Consideration in cash - 12,914 118,647<br />
Net gain on disposal - 21,033 -<br />
Net change in cash and cash equivalents - 12,914 118,647<br />
Dilution of Group’s ownership<br />
On June 15, 2012, ZAO Mine Vorgashorskaya 2 was merged into JSC Vorkutaugol. As a result of this merger, the Group’s ownership<br />
interest in JSC Vorkutaugol reduced from 88.1% to 84.2%.<br />
Transactions within discontinued operations<br />
Crew Gold Corporation<br />
In February 2010, the Group acquired a 26.6% stake in Crew Gold Corporation for a total consideration of US$ 90.3 million. Crew Gold<br />
Corporation is a mining company based in London, UK. Crew Gold Corporation owns and operates a gold mining project in Guinea, West<br />
Africa.<br />
In July 2010, the Group acquired an additional 13.8% stake in Crew Gold Corporation for a total consideration of US$ 84.5 million,<br />
increasing its ownership interest up to 40.4%.<br />
In July 2010, the Group acquired an additional 9.8% stake in Crew Gold Corporation for a total consideration of US$ 70.9 million,<br />
increasing its ownership interest up to 50.2%.<br />
The acquiree’s profit from the beginning of the period to the date of acquisition comprised US$ 10.8 million. The acquiree’s revenue from<br />
the beginning of the period to the date of acquisition comprised US$ 140.6 million. The loss since the acquisition date included in the<br />
Group’s profit/(loss) from discontinued operations amounted to US$ 14.5 million. Revenue since the acquisition date included in the<br />
Group’s revenue from discontinued operations amounted to US$ 98.6 million.<br />
<strong>Severstal</strong> Annual Report and accounts 2012
company Overview Strategy Performance Sustainability Governance Financial statements Additional information<br />
OAO <strong>Severstal</strong> and subsidiaries<br />
Notes to the consolidated financial statements<br />
for the years ended December 31, 2012, 2011 and 2010<br />
(Amounts expressed in thousands of US dollars, except as otherwise stated)<br />
A summary of assets and liabilities acquired from third parties during 2012, 2011 and 2010 is presented below:<br />
168<br />
Year ended December 31,<br />
2012 2011 2010<br />
Cash and cash equivalents - - 29,929<br />
Trade accounts receivable - - 16,500<br />
Inventories - - 51,251<br />
Other current assets - - 6,896<br />
Property, plant and equipment - - 134,061<br />
Intangible assets - - 675,668<br />
Other non-current assets - - 9,745<br />
Trade accounts payable - - (20,037)<br />
Other taxes and social security payable - - (51)<br />
Other current liabilities - - (67,345)<br />
Deferred tax liabilities - - (120,139)<br />
Debt finance - - (113,055)<br />
Other non-current liabilities - - (11,715)<br />
Net identifiable assets and liabilities acquired - - 591,708<br />
Non-controlling interests - - (294,395)<br />
<strong>Severstal</strong>’s share of net identifiable assets and liabilities acquired - - 297,313<br />
Investments at equity - - (182,846)<br />
Fair value adjustment upon acquisition of subsidiary to previously held interest - - (42,170)<br />
Consideration:<br />
Consideration in cash - - (70,879)<br />
Negative goodwill on acquisition of subsidiaries - - 1,418<br />
Net change in cash and cash equivalents - - (40,950)<br />
In September 2010, the Group acquired an additional 43.2% stake in Crew Gold Corporation for a total consideration of US$ 214.8<br />
million, increasing its ownership interest up to 93.4%.<br />
In January 2011, the Group acquired an additional 6.6% stake in Crew Gold Corporation for a total consideration of US$ 32.9 million,<br />
increasing its ownership interest up to 100%.<br />
High River Gold Mines Ltd<br />
In May 2010, the Group acquired an additional 18.8% stake in High River Gold Mines Ltd for a total consideration of US$ 107.3 million,<br />
increasing its ownership interest up to 68.9%.<br />
In August 2010, the Group acquired an additional stake in High River Gold Mines Ltd upon exercise of warrants held by the Group for a<br />
total consideration of US$ 25.1 million, increasing its ownership interest up to 70.4%.<br />
In October 2010, the Group acquired an additional 2.3% stake in High River Gold Mines Ltd for a total consideration of US$ 19.7 million,<br />
increasing its ownership interest up to 72.6%.<br />
In August 2011, the Group acquired an additional 2.4% stake in High River Gold Mines Ltd for a total consideration of US$ 26.5 million,<br />
increasing its ownership interest up to 75.1 %.<br />
<strong>Severstal</strong> Annual Report and accounts 2012
company Overview Strategy Performance Sustainability Governance Financial statements Additional information<br />
169<br />
OAO <strong>Severstal</strong> and subsidiaries<br />
Notes to the consolidated financial statements<br />
for the years ended December 31, 2012, 2011 and 2010<br />
(Amounts expressed in thousands of US dollars, except as otherwise stated)<br />
29. Segment information<br />
Segmental statements of financial position as at December 31, 2012:<br />
<strong>Severstal</strong> Annual Report and accounts 2012<br />
<strong>Severstal</strong><br />
Resources<br />
<strong>Severstal</strong><br />
Russian<br />
Steel<br />
<strong>Severstal</strong><br />
International<br />
Inter<br />
segment<br />
balances<br />
Assets<br />
Current assets:<br />
Cash and cash equivalents 317,014 1,361,450 47,811 - 1,726,275<br />
Short-term financial investments 2,079,173 957,347 - (3,012,742) 23,778<br />
Trade accounts receivable 162,990 648,050 229,527 - 1,040,567<br />
Amounts receivable from related parties 117,983 56,389 1,275 (160,179) 15,468<br />
Inventories 178,618 1,424,633 767,219 (17,572) 2,352,898<br />
VAT recoverable 31,246 183,173 - - 214,419<br />
Income tax recoverable 9,827 11,207 135 - 21,169<br />
Other current assets 79,267 178,403 44,450 - 302,120<br />
Total current assets 2,976,118 4,820,652 1,090,417 (3,190,493) 5,696,694<br />
Non-current assets:<br />
Long-term financial investments 951,207* 5,674,938 19,900 (6,537,985) 108,060<br />
Investments in associates and joint ventures 82,835 89,360 144,308 - 316,503<br />
Property, plant and equipment 1,530,367 4,318,481 2,640,935 (27,072) 8,462,711<br />
Intangible assets 586,374 229,748 4,813 - 820,935<br />
Restricted financial assets 32,970 - - - 32,970<br />
Deferred tax assets 7,605 47,236 45,955 - 100,796<br />
Other non-current assets 6,616 21,527 140,403 - 168,546<br />
Total non-current assets 3,197,974 10,381,290 2,996,314 (6,565,057) 10,010,521<br />
Total assets 6,174,092 15,201,942 4,086,731 (9,755,550) 15,707,215<br />
Liabilities<br />
Current liabilities:<br />
Trade accounts payable 127,094 538,106 392,421 - 1,057,621<br />
Amounts payable to related parties 5,674 128,670 58,861 (156,971) 36,234<br />
Short-term debt finance 126,148 2,879,696 852,022 (2,475,738) 1,382,128<br />
Income taxes payable 1,575 14,829 200 - 16,604<br />
Other taxes and social security payable 54,177 93,534 4,879 - 152,590<br />
Dividends payable - 89,079 - (2,541) 86,538<br />
Other current liabilities 144,955 424,466 68,526 - 637,947<br />
Total current liabilities 459,623 4,168,380 1,376,909 (2,635,250) 3,369,662<br />
Non-current liabilities:<br />
Long-term debt finance 687,477 3,865,661 1,278,280 (1,504,006) 4,327,412<br />
Deferred tax liabilities 170,530 170,888 - (3,340) 338,078<br />
Retirement benefit liabilities 23,363 111,031 67,158 - 201,552<br />
Other non-current liabilities 177,185 36,037 42,046 - 255,268<br />
Total non-current liabilities 1,058,555 4,183,617 1,387,484 (1,507,346) 5,122,310<br />
Equity 4,655,914** 6,849,945 1,322,338 (5,612,954) 7,215,243<br />
Total equity and liabilities 6,174,092 15,201,942 4,086,731 (9,755,550) 15,707,215<br />
* This amount includes US$ 210.0 million of <strong>Severstal</strong> treasury shares, measured at the Group’s share in the Gold segment’s net assets as at the date of its separation.<br />
** This amount includes US$ 66.8 million effect of convertible bonds issue (Note 22).<br />
Consolidated
company Overview Strategy Performance Sustainability Governance Financial statements Additional information<br />
OAO <strong>Severstal</strong> and subsidiaries<br />
Notes to the consolidated financial statements<br />
for the years ended December 31, 2012, 2011 and 2010<br />
(Amounts expressed in thousands of US dollars, except as otherwise stated)<br />
Segmental statements of financial position as at December 31, 2011:<br />
<strong>Severstal</strong><br />
Resources<br />
<strong>Severstal</strong><br />
Russian<br />
Steel<br />
<strong>Severstal</strong><br />
International<br />
Inter<br />
segment<br />
balances<br />
170<br />
Gold<br />
Assets<br />
Current assets:<br />
Cash and cash equivalents 429,801 - 1,184,963 248,774 - 1,863,538<br />
Short-term financial investments 332,557 - 871,805 - (1,193,862) 10,500<br />
Trade accounts receivable 243,453 - 675,514 300,994 - 1,219,961<br />
Amounts receivable from related parties 161,756 - 41,548 1,186 (177,141) 27,349<br />
Inventories 155,062 - 1,604,877 807,752 (48,537) 2,519,154<br />
VAT recoverable 23,558 - 170,327 - - 193,885<br />
Income tax recoverable 6,618 - 73,822 10,476 - 90,916<br />
Other current assets 97,753 - 186,590 42,820 - 327,163<br />
Assets held for sale - 2,680,066 - - (2,756) 2,677,310<br />
Total current assets 1,450,558 2,680,066 4,809,446 1,412,002 (1,422,296) 8,929,776<br />
Non-current assets:<br />
Long-term financial investments 1,437,168 - 6,307,481 100,000 (7,662,387) 182,262<br />
Investments in associates and joint ventures 71,211 - 66,196 163,908 - 301,315<br />
Property, plant and equipment 1,186,872 - 3,645,189 2,659,039 (27,706) 7,463,394<br />
Intangible assets 582,820 - 182,297 5,337 - 770,454<br />
Restricted financial assets 21,455 - 1,001 182 - 22,638<br />
Deferred tax assets 14,323 - 40,804 44,524 - 99,651<br />
Other non-current assets 18,359 - 25,096 96,846 - 140,301<br />
Total non-current assets 3,332,208 - 10,268,064 3,069,836 (7,690,093) 8,980,015<br />
Total assets 4,782,766 2,680,066 15,077,510 4,481,838 (9,112,389) 17,909,791<br />
Liabilities<br />
Current liabilities:<br />
Trade accounts payable 114,471 - 507,656 492,983 - 1,115,110<br />
Amounts payable to related parties 4,995 - 158,756 49,070 1,370,210* 1,583,031<br />
Short-term debt finance 488,060 - 1,161,699 64,309 (528,601) 1,185,467<br />
Income taxes payable 17,135 - 10,916 35 - 28,086<br />
Other taxes and social security payable 78,599 - 62,632 122 - 141,353<br />
Dividends payable - - 111,208 - - 111,208<br />
Other current liabilities 120,852 - 441,547 93,021 - 655,420<br />
Liabilities related to assets held for sale - 894,094 - - (343,971) 550,123<br />
Total current liabilities 824,112 894,094 2,454,414 699,540 497,638 5,369,798<br />
Non-current liabilities:<br />
Long-term debt finance 209,307 - 3,926,889 2,172,470 (1,518,035) 4,790,631<br />
Deferred tax liabilities 160,421 - 135,551 - (8,846) 287,126<br />
Retirement benefit liabilities 19,975 - 83,621 58,138 - 161,734<br />
Other non-current liabilities 144,677 - 35,776 52,726 - 233,179<br />
Total non-current liabilities 534,380 - 4,181,837 2,283,334 (1,526,881) 5,472,670<br />
Equity 3,424,274 1,785,972 8,441,259 1,498,964 (8,083,146) 7,067,323<br />
Total equity and liabilities 4,782,766 2,680,066 15,077,510 4,481,838 (9,112,389) 17,909,791<br />
* This amount includes US$ 1,547.0 million liability related to Gold segment separation (Note 11).<br />
Consolidated<br />
<strong>Severstal</strong> Annual Report and accounts 2012
company Overview Strategy Performance Sustainability Governance Financial statements Additional information<br />
171<br />
OAO <strong>Severstal</strong> and subsidiaries<br />
Notes to the consolidated financial statements<br />
for the years ended December 31, 2012, 2011 and 2010<br />
(Amounts expressed in thousands of US dollars, except as otherwise stated)<br />
Segmental statements of financial position as at December 31, 2010:<br />
<strong>Severstal</strong><br />
Resources<br />
<strong>Severstal</strong><br />
Russian<br />
Steel<br />
<strong>Severstal</strong><br />
International<br />
Inter<br />
segment<br />
balances<br />
Gold<br />
Lucchini<br />
Assets<br />
Current assets:<br />
Cash and cash equivalents 66,497 212,182 1,700,229 - 33,754 - 2,012,662<br />
Short-term bank deposits 22 - 12,668 - - - 12,690<br />
Short-term financial investments 48,904 2,070 677,564 - - (701,075) 27,463<br />
Trade accounts receivable 142,397 1,260 613,854 - 210,326 - 967,837<br />
Amounts receivable from related parties 207,708 - 110,524 - 39 (305,912) 12,359<br />
Restricted financial assets - - 41,313 - - - 41,313<br />
Inventories 101,091 283,479 1,527,266 - 522,968 (65,670) 2,369,134<br />
VAT recoverable 26,454 32,510 220,662 - - - 279,626<br />
Income tax recoverable 4,437 3,833 20,570 - 10,738 - 39,578<br />
Other current assets 56,072 32,400 171,495 - 38,216 - 298,183<br />
Assets held for sale 3,266 - 10,899 1,853,849 1,643,991 (2,123) 3,509,882<br />
Total current assets 656,848 567,734 5,107,044 1,853,849 2,460,032 (1,074,780) 9,570,727<br />
Non-current assets:<br />
Long-term financial investments 1,325,960 120,185 6,409,105 - 6,000 (7,656,708) 204,542<br />
Investments in associates and joint ventures 21,336 5,547 67,142 - 64,539 - 158,564<br />
Property, plant and equipment 1,088,406 488,164 3,573,159 - 2,174,087 (23,967) 7,299,849<br />
Intangible assets 497,342 1,275,184 137,918 - 19,229 1,269 1,930,942<br />
Restricted financial assets 19,017 5,453 37,244 - - - 61,714<br />
Deferred tax assets 4,166 11,163 38,448 - 50,000 - 103,777<br />
Other non-current assets 8,042 6,052 16,982 - 47,190 - 78,266<br />
Total non-current assets 2,964,269 1,911,748 10,279,998 - 2,361,045 (7,679,406) 9,837,654<br />
Total assets 3,621,117 2,479,482 15,387,042 1,853,849 4,821,077 (8,754,186) 19,408,381<br />
Liabilities<br />
Current liabilities:<br />
Trade accounts payable 102,108 57,879 408,026 - 329,376 - 897,389<br />
Amounts payable to related parties 6,067 - 175,419 - 8,306 (173,075) 16,717<br />
Short-term debt finance 282,991 280,241 1,301,799 - 57,777 (499,257) 1,423,551<br />
Income taxes payable 6,765 26,231 8,234 - - - 41,230<br />
Other taxes and social security payable 61,849 25,909 67,766 - 554 - 156,078<br />
Dividends payable - - 17,131 - - - 17,131<br />
Other current liabilities 70,035 77,509 354,597 - 48,289 4,147 554,577<br />
Liabilities related to assets held for sale 12,795 - 1,057 2,026,696 1,705,094 (473,288) 3,272,354<br />
Total current liabilities 542,610 467,769 2,334,029 2,026,696 2,149,396 (1,141,473) 6,379,027<br />
Non-current liabilities:<br />
Long-term debt finance 235,481 116,174 3,731,224 - 1,370,428 (730,381) 4,722,926<br />
Deferred tax liabilities 169,418 206,524 153,090 - - (13,961) 515,071<br />
Retirement benefit liabilities 22,582 - 88,894 - 53,079 - 164,555<br />
Other non-current liabilities 141,613 63,409 36,566 - 35,553 8 277,149<br />
Total non-current liabilities 569,094 386,107 4,009,774 - 1,459,060 (744,334) 5,679,701<br />
Equity 2,509,413 1,625,606 9,043,239 (172,847) 1,212,621 (6,868,379) 7,349,653<br />
Total equity and liabilities 3,621,117 2,479,482 15,387,042 1,853,849 4,821,077 (8,754,186) 19,408,381<br />
Consolidated<br />
<strong>Severstal</strong> Annual Report and accounts 2012
company Overview Strategy Performance Sustainability Governance Financial statements Additional information<br />
OAO <strong>Severstal</strong> and subsidiaries<br />
Notes to the consolidated financial statements<br />
for the years ended December 31, 2012, 2011 and 2010<br />
(Amounts expressed in thousands of US dollars, except as otherwise stated)<br />
Segmental income statements for the year ended December 31, 2012:<br />
<strong>Severstal</strong><br />
Resources<br />
<strong>Severstal</strong><br />
Russian<br />
Steel<br />
<strong>Severstal</strong><br />
International<br />
Inter<br />
segment<br />
transactions<br />
172<br />
Gold<br />
Revenue<br />
Revenue – third parties 1,611,174 - 8,426,091 3,878,340 - 13,915,605<br />
Revenue – related parties 1,393,381 - 191,039 145 (1,396,464) 188,101<br />
3,004,555 - 8,617,130 3,878,485 (1,396,464) 14,103,706<br />
Cost of sales (1,724,862) - (6,711,442) (3,774,920) 1,425,932 (10,785,292)<br />
Gross profit 1,279,693 - 1,905,688 103,565 29,468 3,318,414<br />
General and administrative expenses (155,355) - (517,304) (91,107) 9,153 (754,613)<br />
Distribution expenses (313,893) - (729,349) (5,336) 183 (1,048,395)<br />
Other taxes and contributions (66,726) - (65,622) (1,918) - (134,266)<br />
Share of associates’ and joint ventures’ (loss)/profit (990) - 7,889 (4,906) - 1,993<br />
Gain/(loss) on remeasurement and disposal of<br />
financial investments 8,021 - 381,510 - (396,112) (6,581)<br />
Loss on disposal of property, plant<br />
and equipment and intangible assets (3,866) - (19,887) (2,209) - (25,962)<br />
Net other operating income/(expenses) 3,726 - 27,267 (5,025) (5,725) 20,243<br />
Profit/(loss) from operations 750,610 - 990,192 (6,936) (363,033) 1,370,833<br />
Impairment of non-current assets (51,687) - (2,430) - - (54,117)<br />
Net other non-operating income/(expenses) 517,830* - (49,189) (222) (538,955) (70,536)<br />
Profit/(loss) before financing and taxation 1,216,753 - 938,573 (7,158) (901,988) 1,246,180<br />
Interest income 81,908 - 110,965 3,386 (128,090) 68,169<br />
Interest expense (58,001) - (365,360) (141,818) 124,241 (440,938)<br />
Foreign exchange differences (23,465) - 194,219 (7,244) - 163,510<br />
Profit/(loss) before income tax 1,217,195 - 878,397 (152,834) (905,837) 1,036,921<br />
Income tax (expense)/benefit (132,051) - (127,284) 1,498 (5,648) (263,485)<br />
Profit/(loss) from continuing operations 1,085,144 - 751,113 (151,336) (911,485) 773,436<br />
Profit/(loss) from discontinued operations - 153,797 - (107,434) - 46,363<br />
Profit/(loss) for the period 1,085,144 153,797 751,113 (258,770) (911,485) 819,799<br />
Additional information:<br />
depreciation and amortization expense 240,357 - 318,297 170,342 (2,951) 726,045<br />
capital expenditures 555,507 - 829,553 155,348 (2,550) 1,537,858<br />
intersegment revenue (incl. in revenue from<br />
related parties) 1,301,001 - 95,463 - (1,396,464) -<br />
* This amount includes US$ 537.3 million gain on transfer of OAO <strong>Severstal</strong> shares and GDR’s, received as a result of the Gold segment separation, to <strong>Severstal</strong> Russian Steel,<br />
subsequently eliminated within Intersegment transactions.<br />
Consolidated<br />
<strong>Severstal</strong> Annual Report and accounts 2012
company Overview Strategy Performance Sustainability Governance Financial statements Additional information<br />
173<br />
OAO <strong>Severstal</strong> and subsidiaries<br />
Notes to the consolidated financial statements<br />
for the years ended December 31, 2012, 2011 and 2010<br />
(Amounts expressed in thousands of US dollars, except as otherwise stated)<br />
Segmental income statements for the year ended December 31, 2011:<br />
<strong>Severstal</strong><br />
Resources<br />
<strong>Severstal</strong><br />
Russian<br />
Steel<br />
<strong>Severstal</strong><br />
International<br />
Inter<br />
segment<br />
transactions<br />
Gold<br />
Lucchini<br />
Revenue<br />
Revenue – third parties 1,762,604 - 10,388,391 - 3,422,095 - 15,573,090<br />
Revenue – related parties 1,948,828 - 158,440 - - (1,867,958) 239,310<br />
3,711,432 - 10,546,831 - 3,422,095 (1,867,958) 15,812,400<br />
Cost of sales (1,745,500) - (7,748,673) - (3,291,548) 1,882,499 (10,903,222)<br />
Gross profit 1,965,932 - 2,798,158 - 130,547 14,541 4,909,178<br />
General and administrative expenses (160,307) - (497,400) - (82,698) 15,362 (725,043)<br />
Distribution expenses (326,582) - (774,609) - - - (1,101,191)<br />
Other taxes and contributions (63,524) - (82,807) - 477 - (145,854)<br />
Share of associates’ (loss)/profit (2,727) - 1,873 - 8,173 - 7,319<br />
Gain/(loss) on remeasurement and disposal of<br />
financial investments 33 - (4,685) - - - (4,652)<br />
Loss on disposal of property, plant and<br />
equipment and intangible assets (7,848) - (11,140) - (1,951) - (20,939)<br />
Net other operating (expenses)/income (10,761) - 20,610 - 6,993 (18,303) (1,461)<br />
Profit from operations 1,394,216 - 1,450,000 - 61,541 11,600 2,917,357<br />
Reversal of impairment of non-current assets - - 438 - - - 438<br />
Net other non-operating expenses (21,207) - (53,283) - - 9,109 (65,381)<br />
Profit before financing and taxation 1,373,009 - 1,397,155 - 61,541 20,709 2,852,414<br />
Interest income 24,768 - 183,677 - 79 (158,843) 49,681<br />
Interest expense (106,751) - (358,642) - (98,178) 127,430 (436,141)<br />
Foreign exchange differences 65,689 - (102,669) - - - (36,980)<br />
Profit/(loss) before income tax 1,356,715 - 1,119,521 - (36,558) (10,704) 2,428,974<br />
Income tax expense (285,097) - (171,056) - (4,884) (4,975) (466,012)<br />
Profit/(loss) from continuing operations 1,071,618 - 948,465 - (41,442) (15,679) 1,962,962<br />
Profit/(loss) from discontinued operations - 277,582 - 129,217 (226,231) 30,205 210,773<br />
Profit/(loss) for the period 1,071,618 277,582 948,465 129,217 (267,673) 14,526 2,173,735<br />
Additional information:<br />
depreciation and amortization expense 201,974 155,873 329,613 - 117,432 (2,199) 802,693<br />
capital expenditures 490,833 320,306 712,319 - 573,696 - 2,097,154<br />
intersegment revenue (incl. in revenue<br />
from related parties) 1,789,829 - 78,129 - - (1,867,958) -<br />
Consolidated<br />
<strong>Severstal</strong> Annual Report and accounts 2012
company Overview Strategy Performance Sustainability Governance Financial statements Additional information<br />
OAO <strong>Severstal</strong> and subsidiaries<br />
Notes to the consolidated financial statements<br />
for the years ended December 31, 2012, 2011 and 2010<br />
(Amounts expressed in thousands of US dollars, except as otherwise stated)<br />
Segmental income statements for the year ended December 31, 2010:<br />
<strong>Severstal</strong><br />
Resources<br />
<strong>Severstal</strong><br />
Russian<br />
Steel<br />
<strong>Severstal</strong><br />
International<br />
Inter<br />
segment<br />
transactions<br />
174<br />
Gold<br />
Lucchini<br />
Revenue<br />
Revenue – third parties 1,235,576 - 8,610,139 - 2,911,068 - 12,756,783<br />
Revenue – related parties 1,496,440 - 204,615 - 444 (1,639,164) 62,335<br />
2,732,016 - 8,814,754 - 2,911,512 (1,639,164) 12,819,118<br />
Cost of sales (1,387,112) - (6,006,406) - (2,909,333) 1,586,085 (8,716,766)<br />
Gross profit 1,344,904 - 2,808,348 - 2,179 (53,079) 4,102,352<br />
General and administrative expenses (84,435) - (424,161) - (78,353) 1,906 (585,043)<br />
Distribution expenses (210,559) - (780,872) - - 704 (990,727)<br />
Other taxes and contributions (60,210) - (75,802) - (560) - (136,572)<br />
Share of associates’ profit 4,727 - 2,906 - 12,728 - 20,361<br />
Loss on remeasurement and disposal of<br />
financial investments (6,171) - (140,151) - - - (146,322)<br />
(Loss)/gain on disposal of property, plant and<br />
equipment and intangible assets (25,852) - (20,337) - 3,399 - (42,790)<br />
Net other operating (expenses)/income (10,997) - (2,855) - 1,473 (3,574) (15,953)<br />
Profit/(loss) from operations 951,407 - 1,367,076 - (59,134) (54,043) 2,205,306<br />
Impairment of non-current assets (14,834) - (21,136) - (44,160) - (80,130)<br />
Net other non-operating expenses (17,088) - (26,511) - - - (43,599)<br />
Profit/(loss) before financing and taxation 919,485 - 1,319,429 - (103,294) (54,043) 2,081,577<br />
Interest income 19,098 - 282,853 - 184 (201,540) 100,595<br />
Interest expense (161,234) - (469,673) - (151,024) 164,146 (617,785)<br />
Foreign exchange differences 62,214 - 47,522 - - - 109,736<br />
Profit/(loss) before income tax 839,563 - 1,180,131 - (254,134) (91,437) 1,674,123<br />
Income tax expense (144,722) - (235,830) - (58,505) 11,751 (427,306)<br />
Profit/(loss) from continuing operations 694,841 - 944,301 - (312,639) (79,686) 1,246,817<br />
Profit/(loss) from discontinued operations - 148,700 - (1,210,076) (742,684) 42,664 (1,761,396)<br />
Profit/(loss) for the period 694,841 148,700 944,301 (1,210,076) (1,055,323) (37,022) (514,579)<br />
Additional information:<br />
depreciation and amortization expense 177,048 121,415 287,571 37,981 237,711 - 861,726<br />
capital expenditures 262,114 171,673 575,633 15,183 341,620 - 1,366,223<br />
intersegment revenue (incl. in revenue<br />
from related parties) 1,496,377 - 142,787 7,121 - (1,646,285) -<br />
Consolidated<br />
<strong>Severstal</strong> Annual Report and accounts 2012
company Overview Strategy Performance Sustainability Governance Financial statements Additional information<br />
175<br />
OAO <strong>Severstal</strong> and subsidiaries<br />
Notes to the consolidated financial statements<br />
for the years ended December 31, 2012, 2011 and 2010<br />
(Amounts expressed in thousands of US dollars, except as otherwise stated)<br />
The following is a summary of non-current assets other than financial instruments, investments in associates and joint ventures and<br />
deferred tax assets by location:<br />
December 31,<br />
2012 2011 2010<br />
Russian Federation 5,861,457 4,784,705 5,111,242<br />
North America 3,293,635 3,336,165 2,790,550<br />
Africa 168,931 128,910 1,063,247<br />
Europe 115,816 92,863 130,269<br />
Central Asia - - 275,463<br />
9,439,839 8,342,643 9,370,771<br />
The locations are primarily represented by the following countries:<br />
• In Europe: Latvia, Italy and Ukraine;<br />
• In Africa: Liberia (as at December 31, 2012 and 2011); Burkina Faso, Liberia and Guinea (as at December 31, 2010);<br />
• In the Central Asia: Kazakhstan (as at December 31, 2010);<br />
• In North America: the USA.<br />
30. Financial instruments<br />
The Group’s risk management policies are established to identify and analyze the risks faced by the Group, to set appropriate risk limits<br />
and controls, and to monitor risks and adherence to limits. Risk management policies and systems are reviewed regularly to reflect<br />
changes in market conditions and the Group’s activities.<br />
The Group’s Board of Directors oversees how management monitors compliance with the Group’s risk management policies and<br />
procedures and reviews the adequacy of the risk management framework in relation to the risks faced by the Group.<br />
Exposure to credit, liquidity, interest rate and currency risk arises in the normal course of the Group’s business. The <strong>Severstal</strong> Resources<br />
segment of the Group has not used derivative financial instruments to reduce exposure to fluctuations in foreign exchange rates and<br />
interest rates. The use in the <strong>Severstal</strong> Russian Steel and <strong>Severstal</strong> International segments of derivatives to hedge their interest rates,<br />
commodity inputs and foreign exchange rate exposures were not material to these consolidated financial statements.<br />
Management believes that the fair value of its financial assets and liabilities approximates their carrying amounts except for the<br />
following borrowings:<br />
<strong>Severstal</strong> Annual Report and accounts 2012<br />
December 31, 2012<br />
Market value Book value Difference<br />
Ruble bonds 2013 492,087 493,865 (1,778)<br />
Eurobonds 2013 569,632 543,552 26,080<br />
Eurobonds 2014 409,234 375,000 34,234<br />
Eurobonds 2016 535,780 500,000 35,780<br />
Eurobonds 2017 1,096,900 1,000,000 96,900<br />
Convertible bonds 2017 480,268 475,000 5,268<br />
Eurobonds 2022 759,608 750,000 9,608<br />
<strong>Severstal</strong> Columbus bonds 553,875 525,000 28,875<br />
4,897,384 4,662,417 234,967<br />
December 31, 2011<br />
Market value Book value Difference<br />
Ruble bonds 2012 464,404 465,895 (1,491)<br />
Ruble bonds 2013 476,471 465,895 10,576<br />
Eurobonds 2013 581,503 543,552 37,951<br />
Eurobonds 2014 399,578 375,000 24,578<br />
Eurobonds 2016 468,240 500,000 (31,760)<br />
Eurobonds 2017 943,910 1,000,000 (56,090)<br />
<strong>Severstal</strong> Columbus bonds 547,313 525,000 22,313<br />
3,881,419 3,875,342 6,077
company Overview Strategy Performance Sustainability Governance Financial statements Additional information<br />
OAO <strong>Severstal</strong> and subsidiaries<br />
Notes to the consolidated financial statements<br />
for the years ended December 31, 2012, 2011 and 2010<br />
(Amounts expressed in thousands of US dollars, except as otherwise stated)<br />
176<br />
December 31, 2010<br />
Market value Book value Difference<br />
Ruble bonds 2012 516,834 492,176 24,658<br />
Ruble bonds 2013 514,160 492,176 21,984<br />
Eurobonds 2013 605,044 543,552 61,492<br />
Eurobonds 2014 418,361 375,000 43,361<br />
Eurobonds 2017 988,125 1,000,000 (11,875)<br />
<strong>Severstal</strong> Columbus bonds 561,425 525,000 36,425<br />
3,603,949 3,427,904 176,045<br />
The above amounts exclude accrued interest. The market value of the Group’s Eurobonds was determined based on London Stock<br />
Exchange quotations. The market value of the Group’s Ruble bonds was determined based on MICEX.<br />
Credit risk<br />
The maximum exposure to credit risk is represented by the carrying amount of each financial asset in the statement of financial position<br />
and guarantees (Note 31e). The Group has developed policies and procedures for the management of credit exposures, including the<br />
establishment of credit committees that actively monitors credit risk.<br />
The maximum exposure to credit risk for financial instruments, including accounts receivable from related parties, was:<br />
December 31,<br />
2012 2011 2010<br />
Cash and cash equivalents 1,726,275 1,863,538 2,012,662<br />
Loans and receivables 1,180,733 1,465,579 1,138,656<br />
Derivative financial assets 34,808 - -<br />
Held-to-maturity securities and deposits 27,908 6,913 28,052<br />
Available-for-sale financial assets 39,840 32,363 155,477<br />
Held-for-trading securities 30 4,093 18,350<br />
Restricted financial assets 32,970 22,638 103,027<br />
3,042,564 3,395,124 3,456,224<br />
The maximum exposure to credit risk for trade receivables, including trade receivables from related parties by geographic region, was:<br />
December 31,<br />
2012 2011 2010<br />
Russian Federation 600,511 549,392 432,626<br />
North America 258,131 332,720 228,910<br />
Europe 177,984 216,797 202,661<br />
The Middle East 9,925 79,088 3,787<br />
China and Central Asia 4,145 24,625 35,973<br />
Central and South America 3,722 18,352 6,121<br />
South-East Asia 712 32,129 26,457<br />
Africa 54 35 37,311<br />
1,055,184 1,253,138 973,846<br />
The maximum exposure to credit risk for trade receivables, including trade receivables from related parties by type of customer, was:<br />
December 31,<br />
2012 2011 2010<br />
Industrial consumers 804,000 751,943 757,760<br />
Wholesale customers 177,709 412,155 122,215<br />
Retail customers 13,629 18,219 59,769<br />
Other customers 59,846 70,821 34,102<br />
1,055,184 1,253,138 973,846<br />
The Group holds bank and other guarantees provided as collateral for financial assets. Amount of collateral held does not fully cover<br />
Group’s exposure to credit risk.<br />
<strong>Severstal</strong> Annual Report and accounts 2012
company Overview Strategy Performance Sustainability Governance Financial statements Additional information<br />
177<br />
OAO <strong>Severstal</strong> and subsidiaries<br />
Notes to the consolidated financial statements<br />
for the years ended December 31, 2012, 2011 and 2010<br />
(Amounts expressed in thousands of US dollars, except as otherwise stated)<br />
Impairment losses<br />
The aging of trade receivables, including trade receivables from related parties, was:<br />
December 31,<br />
2012 2011 2010<br />
Gross Impairment Gross Impairment Gross Impairment<br />
Not past due 887,464 (47,569) 1,116,018 (49,251) 887,212 (17,795)<br />
Past due less than 30 days 173,504 (1,672) 118,613 (487) 55,913 (179)<br />
Past due 31-90 days 36,335 (1,641) 39,223 (92) 18,566 (162)<br />
Past due 91-180 days 4,658 (577) 10,605 (1,073) 12,410 (1,139)<br />
Past due 181-365 days 2,997 (2,631) 10,799 (1,724) 25,479 (10,948)<br />
More than one year 55,271 (50,955) 47,839 (37,332) 41,516 (37,027)<br />
1,160,229 (105,045) 1,343,097 (89,959) 1,041,096 (67,250)<br />
The impairment allowance at December 31, 2012 included the impairment allowance in respect of trade receivables from related parties<br />
for the total amount of US$ 50.1 million (December 31, 2011: US$ 31.9 million; December 31, 2010: US$ 3.4 million).<br />
The movement in allowance for impairment in respect of trade receivables, including trade receivables from related parties, during the<br />
years was as follows:<br />
Year ended December 31,<br />
2012 2011 2010<br />
Opening balance (89,959) (67,250) (85,649)<br />
Impairment loss recognized (45,653) (58,445) (64,920)<br />
Impairment loss reversed 34,661 27,234 64,584<br />
Reclassified to assets held for sale - 6,474 16,288<br />
Foreign exchange differences (4,094) 2,028 2,447<br />
Closing balance (105,045) (89,959) (67,250)<br />
The allowance account in respect of trade receivables, including trade receivables from related parties, is used to record impairment losses<br />
unless the Group is satisfied that no recovery of the amount owing is possible; at that point the amount is considered irrecoverable and is<br />
written off against the financial asset directly.<br />
The allowance for doubtful debts contains primarily individually impaired trade receivables from debtors placed under liquidation or<br />
companies which are in breach of contract terms.<br />
At December 31, 2012 the Group recognized an impairment allowance in respect of deposit in the amount of US$ nil (December 31,<br />
2011: US$ nil; December 31, 2010: US$ 134.0 million) (Note 6).<br />
Concentration of credit risk<br />
2012<br />
The Group has a concentration of cash and short-term bank deposits with OAO Bank VTB, OAO Metcombank, AB Russia and OAO<br />
Sberbank Russia that at December 31, 2012 represented US$ 428.5 million, US$ 290.3 million, US$ 271.6 million and US$ 254.9 million,<br />
respectively.<br />
2011<br />
The Group has a concentration of cash and short-term bank deposits with AB Russia, OAO Bank VTB, OAO Metcombank and ОАО<br />
Gazprombank that at December 31, 2011 represented US$ 373.8 million, US$ 335.7 million, US$ 259.0 million and US$ 326.5 million,<br />
respectively.<br />
2010<br />
The Group has a concentration of cash and short-term bank deposits with AB Russia, OAO Bank VTB, OAO Sberbank Russia and OAO<br />
Metcombank that at December 31, 2010 represented US$ 322.8 million, US$ 393.5 million, US$ 300.0 million and US$ 168.2 million,<br />
respectively.<br />
The Group has a concentration of available-for-sale financial assets with Detour Gold Corporation that at December 31, 2010 represented<br />
US$ 90.6 million.<br />
<strong>Severstal</strong> Annual Report and accounts 2012
company Overview Strategy Performance Sustainability Governance Financial statements Additional information<br />
OAO <strong>Severstal</strong> and subsidiaries<br />
Notes to the consolidated financial statements<br />
for the years ended December 31, 2012, 2011 and 2010<br />
(Amounts expressed in thousands of US dollars, except as otherwise stated)<br />
178<br />
Liquidity risk<br />
The Group manages liquidity risk with the objective of ensuring that funds will be available at all times to honor all cash flow obligations<br />
as they become due by preparing an annual budgets, by continuously monitoring forecast and actual cash flows and matching the<br />
maturity profiles of financial assets and liabilities.<br />
The following are the contractual maturities of financial liabilities, including estimated interest payments and excluding the impact of<br />
netting agreements:<br />
Non-derivative financial liabilities<br />
Carrying<br />
amount<br />
Contractual<br />
cash flows<br />
less than 1<br />
year 1-2 years 2-5 years<br />
December 31, 2012<br />
More<br />
than 5 years<br />
Debt finance 5,709,540 (7,209,143) (1,623,905) (888,299) (3,166,531) (1,530,408)<br />
Lease liabilities 3,611 (3,611) (1,878) (27) (1,706) -<br />
Trade and other payables 1,284,405 (1,287,610) (1,248,073) (35,444) (4,093) -<br />
Derivative financial liabilities 11,532 (13,487) (11,899) (1,588) - -<br />
7,009,088 (8,513,851) (2,885,755) (925,358) (3,172,330) (1,530,408)<br />
Carrying<br />
amount<br />
Contractual<br />
cash flows<br />
less than 1<br />
year 1-2 years 2-5 years<br />
December 31, 2011<br />
More<br />
than 5 years<br />
Non-derivative financial liabilities<br />
Debt finance 5,976,098 (7,265,954) (1,457,545) (1,769,545) (2,336,373) (1,702,491)<br />
Lease liabilities 7,933 (7,933) (5,880) (238) - (1,815)<br />
Trade and other payables 1,318,534 (1,322,204) (1,289,456) (10,024) (22,724) -<br />
Derivative financial liabilities 38,180 (43,089) (15,286) (26,360) (1,443) -<br />
7,340,745 (8,639,180) (2,768,167) (1,806,167) (2,360,540) (1,704,306)<br />
Carrying<br />
amount<br />
Contractual<br />
cash flows<br />
less than 1<br />
year 1-2 years 2-5 years<br />
December 31, 2010<br />
More<br />
than 5 years<br />
Non-derivative financial liabilities<br />
Debt finance 6,146,477 (7,716,557) (1,784,457) (1,126,555) (2,619,640) (2,185,905)<br />
Lease liabilities 10,859 (10,860) (7,966) (842) (952) (1,100)<br />
Trade and other payables 1,025,190 (1,029,186) (1,002,788) (5,250) (17,646) (3,502)<br />
Derivative financial liabilities 22,286 (28,445) (9,377) (4,642) (14,426) -<br />
7,204,812 (8,785,048) (2,804,588) (1,137,289) (2,652,664) (2,190,507)<br />
2012<br />
At December 31, 2012, the Group has a concentration of bank financing with European Bank for Reconstruction and Development and<br />
Citibank N.A. of US$ 349.2 million and US$ 415.6 million, respectively.<br />
2011<br />
At December 31, 2011, the Group has a concentration of bank financing with Deutsche Bank AG and European Bank for Reconstruction<br />
and Development of US$ 560.0 million and US$ 473.0 million, respectively.<br />
2010<br />
At December 31, 2010, the Group has a concentration of bank financing with Deutsche Bank AG and European Bank for Reconstruction<br />
and Development of US$ 880.0 million and US$ 618.4 million, respectively.<br />
<strong>Severstal</strong> Annual Report and accounts 2012
company Overview Strategy Performance Sustainability Governance Financial statements Additional information<br />
179<br />
OAO <strong>Severstal</strong> and subsidiaries<br />
Notes to the consolidated financial statements<br />
for the years ended December 31, 2012, 2011 and 2010<br />
(Amounts expressed in thousands of US dollars, except as otherwise stated)<br />
Currency risk<br />
Currency risk arises when a Group entity enters into transactions and balances not denominated in its functional currency. The Group has<br />
assets and liabilities denominated in several foreign currencies. Foreign currency risk arises when the actual or forecasted assets in a<br />
foreign currency are either greater or less than the liabilities in that currency.<br />
The Group’s exposure to foreign currency risk was as follows based on notional amounts:<br />
December 31, 2012<br />
Euro USD GBP RUB CAD NOK<br />
Held-to-maturity securities - 24,621 - - - -<br />
Loans and receivables 154,816 1,270,082 - 11,659 3,693 2,186<br />
Cash and cash equivalents 201,895 1,156,546 - 44 - -<br />
Derivative financial assets - 34,808 - - - -<br />
Debt finance (2,047,611) (4,135,921) - (21,559) (3,671) -<br />
Trade and other payables (188,811) (156,424) (92) (126) - (4)<br />
Net exposure (1,879,711) (1,806,288) (92) (9,982) 22 2,182<br />
December 31, 2011<br />
Euro USD GBP RUB CAD NOK<br />
Available-for-sale financial assets - 14,349 - - - -<br />
Loans and receivables 824,868 1,738,321 24 53 49,406 1,833<br />
Cash and cash equivalents 184,146 703,401 - 4,716 - -<br />
Restricted financial assets 1,001 - - - - -<br />
Debt finance (703,474) (3,500,569) - (1,730) (49,366) -<br />
Finance lease liabilities (26) - - - - -<br />
Trade and other payables (148,425) (224,059) (45) (5) - -<br />
Derivative financial liabilities - (12,048) - - - -<br />
Net exposure 158,090 (1,280,605) (21) 3,034 40 1,833<br />
December 31, 2010<br />
Euro USD GBP RUB CHF CAD KZT NOK Other<br />
Available-for-sale financial assets - 15,582 6,920 - - - - - -<br />
Held-to-maturity securities and<br />
deposits - - - - - 690 - - -<br />
Loans and receivables 1,332,624 1,527,205 18,736 33,520 - 67,322 54,501 - 310<br />
Cash and cash equivalents 210,260 944,596 596 22 3,311 - - - 2,686<br />
Restricted financial assets 14,082 29,337 - - - - - - -<br />
Debt finance (853,446) (3,680,171) (3,435) (660) - (120,504) - (83,169) (383)<br />
Finance lease liabilities (236) (662) - - - - - - -<br />
Trade and other payables (192,984) (94,896) (175) (981) (52) (10) - - -<br />
Derivative financial liabilities - (14,039) - - - - - - -<br />
Net exposure 510,300 (1,273,048) 22,642 31,901 3,259 (52,502) 54,501 (83,169) 2,613<br />
<strong>Severstal</strong> Annual Report and accounts 2012
company Overview Strategy Performance Sustainability Governance Financial statements Additional information<br />
OAO <strong>Severstal</strong> and subsidiaries<br />
Notes to the consolidated financial statements<br />
for the years ended December 31, 2012, 2011 and 2010<br />
(Amounts expressed in thousands of US dollars, except as otherwise stated)<br />
Sensitivity analysis<br />
A 10 percent strengthening of the following currencies against the functional currency at December 31, 2012 would have increased/<br />
(decreased) profit and equity by the amounts shown below.<br />
This analysis assumes that all other variables, in particular interest rates, remain constant and no translation difference into the<br />
presentation currency is included. The analysis is performed on the same basis for 2011 and 2010.<br />
180<br />
Year ended December 31,<br />
2012 2011 2010<br />
Net profit<br />
Euro (154,348) 12,724 40,241<br />
USD (143,282) (100,897) (98,234)<br />
GBP (8) (2) 1,684<br />
CHF - - 294<br />
CAD 3 3 (3,923)<br />
RUB (902) 212 2,690<br />
KZT - - 4,103<br />
NOK 143 128 (5,988)<br />
Other - - 209<br />
A 10 percent weakening of these currencies against the functional currency at December 31, 2012 would have had the equal but<br />
opposite effect to the amounts shown above, on the basis that all other variables remain constant.<br />
Interest rate risk<br />
Interest rates on the Group’s debt finance are either fixed or variable, at a fixed spread over LIBOR, EURIBOR and MOSPRIME for the<br />
duration of each contract. Changes in interest rates impact primarily loans and borrowings by changing either their fair value (fixed rate<br />
debt) or their future cash flows (variable rate debt). Management does not have a formal policy of determining how much of the Group’s<br />
exposure should be to fixed or variable rates. However, at the time of raising new loans or borrowings management uses its judgment to<br />
decide whether it believes that a fixed or variable rate would be more favorable to the Group over the expected period until maturity.<br />
The Group’s interest-bearing financial instruments at variable rates were:<br />
December 31,<br />
2012 2011 2010<br />
Variable rate instruments<br />
Financial assets 44,219 21,091 31,386<br />
Financial liabilities (978,008) (1,942,638) (2,279,275)<br />
(933,789) (1,921,547) (2,247,889)<br />
Other Group’s interest-bearing financial instruments are at fixed rate.<br />
Fair value sensitivity analysis for fixed rate instruments<br />
The Group does not account for any fixed rate financial assets and liabilities at fair value through profit or loss. Therefore a change in<br />
interest rates would not affect profit or loss.<br />
<strong>Severstal</strong> Annual Report and accounts 2012
company Overview Strategy Performance Sustainability Governance Financial statements Additional information<br />
181<br />
OAO <strong>Severstal</strong> and subsidiaries<br />
Notes to the consolidated financial statements<br />
for the years ended December 31, 2012, 2011 and 2010<br />
(Amounts expressed in thousands of US dollars, except as otherwise stated)<br />
Cash flow sensitivity analysis for variable rate instruments<br />
A change of 100 basis points in interest rates would have increased/(decreased) profit and equity by the amounts shown below. This<br />
analysis assumes that all other variables, in particular foreign currency rates, remain constant. The analysis is performed on the same<br />
basis for 2011 and 2010.<br />
Net profit<br />
100 bp increase 100 bp decrease<br />
December 31, 2012<br />
Financial assets 442 (442)<br />
Financial liabilities (8,897) 8,897<br />
Cash flow sensitivity (net) (8,455) 8,455<br />
December 31, 2011<br />
Financial assets 28 (28)<br />
Financial liabilities (14,304) 14,304<br />
Cash flow sensitivity (net) (14,276) 14,276<br />
December 31, 2010<br />
Financial assets 251 (251)<br />
Financial liabilities (18,234) 18,234<br />
Cash flow sensitivity (net) (17,983) 17,983<br />
Fair value hierarchy<br />
The table below analyzes financial instruments carried at fair value, except financial instruments measured at amortized cost, by<br />
valuation method. The levels in the fair value hierarchy into which the fair value measurements are categorized were disclosed in<br />
accordance with IFRS.<br />
Level 1 Level 2 Level 3 Total<br />
Balance at 31 December 2012 6,078 23,306 33,762 63,146<br />
Available-for-sale financial assets 6,078 - 33,762 39,840<br />
Held-for-trading securities - 30 - 30<br />
Derivative financial assets - 34,808 - 34,808<br />
Derivative financial liabilities - (11,532) - (11,532)<br />
Balance at 31 December 2011 8,098 (34,196) 24,374 (1,724)<br />
Available-for-sale financial assets 8,098 - 24,265 32,363<br />
Held-for-trading securities - 3,984 109 4,093<br />
Derivative financial liabilities - (38,180) - (38,180)<br />
Balance at 31 December 2010 120,863 (4,051) 34,729 151,541<br />
Available-for-sale financial assets 120,748 - 34,729 155,477<br />
Held-for-trading securities 115 18,235 - 18,350<br />
Derivative financial liabilities - (22,286) - (22,286)<br />
The description of the levels is presented below:<br />
Level 1 – quoted prices in active markets for identical assets or liabilities;<br />
Level 2 – inputs other than quoted prices included within Level 1 that are observable for the asset or liability, either directly or indirectly;<br />
Level 3 – inputs for the asset or liability that are not based on observable market data.<br />
<strong>Severstal</strong> Annual Report and accounts 2012
company Overview Strategy Performance Sustainability Governance Financial statements Additional information<br />
OAO <strong>Severstal</strong> and subsidiaries<br />
Notes to the consolidated financial statements<br />
for the years ended December 31, 2012, 2011 and 2010<br />
(Amounts expressed in thousands of US dollars, except as otherwise stated)<br />
182<br />
The following table shows a reconciliation from the beginning balances to the ending balances for fair value measurement in Level 3 of<br />
the fair value hierarchy:<br />
Available-for-sale<br />
financial assets<br />
Held-for-trading<br />
securities<br />
Balance at 31 December 2012 33,762 -<br />
Issues of financial instruments 8,450 -<br />
Other movements 1,047 (109)<br />
Balance at 31 December 2011 24,265 109<br />
Gains recognized in other comprehensive income 276 -<br />
Purchases of financial instruments - 109<br />
Sales of financial instruments (3,417) -<br />
Issues of financial instruments 415 -<br />
Transfers out of Level 3 (6,942) -<br />
Other movements (796) -<br />
Balance at 31 December 2010 34,729 -<br />
Losses recognized in other comprehensive income (580) -<br />
Purchases of financial instruments 23,712 -<br />
Balance at 31 December 2009 11,597 -<br />
31. Commitments and contingencies<br />
a. For litigation, tax and other liabilities<br />
The taxation system and regulatory environment of the Russian Federation, Kazakhstan, Burkina Faso and Guinea are relatively new and<br />
characterized by numerous taxes and frequently changing legislation, which is often unclear, contradictory and subject to varying<br />
interpretations between the differing regulatory authorities and jurisdictions, who are empowered to impose significant fines, penalties<br />
and interest charges. Events during recent years suggest that the regulatory authorities within these countries are adopting a more<br />
assertive stance regarding the interpretation and enforcement of legislation. This situation creates substantial tax and regulatory risks.<br />
Management believes that it has complied in all material respects with all relevant legislation.<br />
At the reporting date, the actual and potential contingent claims for taxes, fines and penalties made by the Russian tax authorities to<br />
certain Group’s entities amounted approximately US$ 18.1 million (December 31, 2011: US$ 17.7 million made by the Russian tax<br />
authorities; December 31, 2010: US$ 113.6 million made by the Russian, Kazakhstan, Burkina Faso and Guinea tax authorities).<br />
Management does not agree with the tax authorities’ claims and believes that the Group has complied with existing legislation in all<br />
material respects. Management is unable to assess the ultimate outcome of the claims and the outflow of financial sources to settle such<br />
claims, if any. Management believes that it has made adequate provisions for other probable tax claims.<br />
b. Long-term purchase and sales contracts<br />
In the normal course of business group companies enter into long-term purchase contracts for raw materials, and long-term sales<br />
contracts. These contracts allow for periodic adjustments in prices dependent on prevailing market conditions.<br />
c. Capital commitments<br />
At the reporting date the Group had contractual capital commitments of US$ 777.0 million (December 31, 2011: US$ 1,085.9 million;<br />
December 31, 2010: US$ 1,546.6 million).<br />
d. Insurance<br />
The Group has insured major part of its property and equipment to compensate for expenses arising from accidents. In addition, certain<br />
Group’s entities have insurance for business interruption on various basis, from reimbursement of certain fixed costs to a gross profit<br />
reimbursement and/or insurance of a third party liability in respect of property or environmental damage. The Group believes that, with<br />
respect to each of its production facilities, it maintains insurance at levels generally in line with the relevant local market standards.<br />
However, the Group does not have full insurance coverage.<br />
e. Guarantees<br />
At the reporting date the Group had US$ 39.1 million (December 31, 2011: US$ 88.2 million; December 31, 2010: US$ 38.2 million) of<br />
guarantees issued, including guarantees issued for related parties, of US$ 23.0 million (December 31, 2011: US$ 74.9 million; December<br />
31, 2010: US$ 10.0 million).<br />
32. Subsequent events<br />
In January 2013, Lucchini S.p.A. officially declared insolvency. The appointed independent Extraordinary Commissioner sent a communication to<br />
all creditors informing them of the opening of the extraordinary administration proceeding. Effective that date, the Group lost its significant<br />
influence on Lucchini and started to account the respective investment at fair value. No gains or losses were recognized as a result of this event.<br />
<strong>Severstal</strong> Annual Report and accounts 2012
company Overview Strategy Performance Sustainability Governance Financial statements Additional information<br />
183<br />
Page Title
company Overview Strategy Performance Sustainability Governance Financial statements Additional information<br />
184<br />
Additional<br />
information<br />
What’s inside<br />
185 Shareholder Information<br />
187 Terms and abbreviations<br />
188 Contacts
company Overview Strategy Performance Sustainability Governance Financial statements Additional information<br />
185<br />
Shareholder information<br />
In Russia, <strong>Severstal</strong> shares are traded on Moscow<br />
Exchange (the unified MICEX-RTS stock exchange).<br />
Overseas they are circulated in the form of<br />
depositary receipts on the London Stock Exchange<br />
and through the PORTAL trading system in the US.<br />
<strong>Severstal</strong> shares/GDRs at stock exchanges<br />
Stock Exchange<br />
Moscow Exchange, MICEX-RTS<br />
LSE, London<br />
<strong>Severstal</strong> Annual Report and accounts 2012<br />
Ticker<br />
CHMF<br />
SVST<br />
<strong>Severstal</strong>’s stocks contribute to the capitalisation of major indices<br />
on the stock exchanges on which the company is listed. <strong>Severstal</strong> is<br />
a solid part of MSCI Russia and FTSE Russia IOB at LSE and makes<br />
a sizeable contribution to the MICEX and RTS indices in Russia.<br />
According to sector analysts, <strong>Severstal</strong> has remained one of<br />
preferred steel and mining stocks at the end of 2012, being<br />
endorsed based on its solid fundamentals, low leverage structure<br />
and sustainable dividend payments. In 2012 <strong>Severstal</strong><br />
outperformed its key peers with annual GDR price growth of<br />
almost 7%. According to analysts’ reports <strong>Severstal</strong> still has growth<br />
potential due to its continuous focus on improvement of<br />
efficiencies, commissioning of the new steel making facilities which<br />
will boost the company’s sales of long steel products, and<br />
continued growth of high value-added products in the company’s<br />
portfolio mix.<br />
<strong>Severstal</strong> exhibited a high daily trade volume which reflects the<br />
company’s sound liquidity position. <strong>Severstal</strong>’s GDRs average daily<br />
turnover at LSE was almost US$20 million while average daily<br />
turnover at Moscow Exchange (MICEX) exceeded US$20 million in<br />
2012.<br />
<strong>Severstal</strong> was named winner in the Best Overall Investor Relations<br />
category for large cap companies at the IR Magazine Russia & CIS<br />
awards ceremony held on July 12, 2012 at the Ritz-Carlton hotel in<br />
Moscow.<br />
The winners of the prestigious IR awards were selected by<br />
Thomson Reuters Extel, IR Magazine Russia & CIS’s research<br />
partner, as part of their independent 2012 Russia IR Survey. More<br />
than 359 respondents from 270 brokerage firms and research<br />
houses – 37% from Russia, 20% from the UK and 11% from<br />
USA – contributed to the in-depth, independent survey.<br />
This was the second significant award won by <strong>Severstal</strong> in a matter<br />
of months. In May 2012 <strong>Severstal</strong> was named winner in the Best<br />
Corporate Development Strategy category at the annual awards<br />
hosted by RCB Group and investor.ru portal. After reviewing the<br />
successful implementation of strategies presented by the<br />
nominated companies in 2011, the judges declared that <strong>Severstal</strong><br />
had been the most successful in achieving its objectives.<br />
<strong>Severstal</strong> share/GDR performance in 2012<br />
GDR price at LSE in 2012, USD<br />
20<br />
15<br />
10<br />
5<br />
0<br />
Jan-12<br />
Feb-12<br />
Mar-12<br />
Apr-12<br />
May-12<br />
Jun-12<br />
London Stock Exchange 2012 2011 2010<br />
Maximum (closing price), US$ 15.46 20.17 17.07<br />
Minimum (closing price), US$ 10.43 9.50 9.35<br />
At year open 12.35 18.07 10.12<br />
At year end 12.17 11.39 16.85<br />
Change,% (2%) (37%) 67%<br />
Turnover, US$ mln 4,928 9,029 6,373<br />
Share Price at RTS in 2012, USD<br />
20<br />
15<br />
10<br />
5<br />
0<br />
Jan-12<br />
Feb-12<br />
Mar-12<br />
Apr-12<br />
May-12<br />
Jun-12<br />
RTS 2012 2011 2010<br />
Maximum (closing price), US$ 15.35 19.86 17.10<br />
Minimum (closing price), US$ 11.00 18.00 9.65<br />
At year beginning 12.00 11.00 10.00<br />
At year end 12.22 12.50 17.10<br />
Change,% 2% (31%) 71%<br />
Turnover, US$ mln 3 6 21<br />
Jul-12<br />
Jul-12<br />
<strong>Severstal</strong> was named winner in<br />
the Best Overall Investor<br />
Relations category for large cap<br />
companies at the IR Magazine<br />
Russia & CIS awards ceremony<br />
held on July 12, 2012 at the<br />
Ritz-Carlton hotel in Moscow.<br />
Aug-12<br />
Aug-12<br />
Sep-12<br />
Sep-12<br />
Oct-12<br />
Oct-12<br />
Nov-12<br />
Nov-12<br />
Dec-12<br />
Dec-12
company Overview Strategy Performance Sustainability Governance Financial statements Additional information<br />
186<br />
Share Price at MICEX in 2012, RUB<br />
500<br />
400<br />
300<br />
200<br />
100<br />
0<br />
Jan-12<br />
Feb-12<br />
Mar-12<br />
Apr-12<br />
May-12<br />
Jun-12<br />
MICEX 2012 2011 2010<br />
Maximum (closing price),<br />
Roubles 451.60 588.92 519.21<br />
Minimum (closing price),<br />
Roubles 341.30 314.50 294.85<br />
At year beginning 389.00 552.02 303.60<br />
At year end 369.10 365.10 518.19<br />
Change,% (5%) (34%) 71%<br />
Turnover, million Roubles 161,038 260,848 202,730<br />
<strong>Severstal</strong> contribution to key indices<br />
Index<br />
Weight*<br />
RTS 1.36%<br />
MICEX 1.36%<br />
MSCI Russia 0.83%<br />
FTSE Russia IOB 0.93%<br />
FTSE BRIC 50 Index 0.21%<br />
* By February 2013<br />
Source: Bloomberg, Moscow Exchange<br />
Jul-12<br />
Aug-12<br />
Sep-12<br />
Oct-12<br />
Nov-12<br />
Dec-12<br />
Dividends<br />
Our dividend policy can be found on our website at:<br />
http://www.severstal.com/eng/about/corporate_governance/<br />
dividends/index.phtml<br />
The following dividends per share and per GDR have been<br />
approved by the Board of Directors:<br />
3m 2012<br />
6m 2012<br />
9m 2012<br />
4.07 roubles (US$0.12)<br />
1.52 roubles (US$0.05)<br />
3.18 roubles (US$0.10)<br />
On February 28, 2013 the Board of Directors also recommended a<br />
dividend of 1.89 roubles (approximately US$0.06) per share for the<br />
12 months ended 31 December 2012. The dividend is to be<br />
approved at the AGM on 13 June 2013. If approved, the dividend<br />
amount for all the quarters of 2012 will total 10.66 roubles.<br />
Financial calendar<br />
31 January 2012 Full year 2012 Operational results<br />
5 March 2013 Full year 2012 IFRS financial statements<br />
April 2013<br />
Q1 2013 Operational results<br />
20 May 2013 Q1 2013 IFRS financial statements<br />
13 June 2013 Shareholders’ Annual General Meeting<br />
July 2013<br />
H1 & Q2 2013 Operational results<br />
29 August 2013 H1 2013 IFRS financial statements<br />
September-October 2013 <strong>Severstal</strong>’s Balakovo mini mill analysts site visit<br />
October 2013<br />
9M & Q3 2013 Operational results<br />
November 2013<br />
<strong>Severstal</strong>’s Capital Markets day<br />
14 November 2013 9M 2013 IFRS financial statements<br />
Credit ratings<br />
In 2012 S&P upgraded <strong>Severstal</strong>’s rating to BB+/Stable, Moody’s –<br />
to Ba1/Stable, Fitch – to BB/Stable<br />
Credit rating<br />
(Long-term, foreign currency)<br />
Moody’s<br />
Standard &<br />
Poor’s<br />
Fitch<br />
Ba1 BB+ BB<br />
Latest update 07.06.2012 21.06.2012 06.08.2012<br />
<strong>Severstal</strong> Annual Report and accounts 2012
company Overview Strategy Performance Sustainability Governance Financial statements Additional information<br />
187<br />
Terms and abbreviations<br />
CRC – cold-rolled coil<br />
CSP – Compact strip process<br />
Fe – Ferrum<br />
GCal/t – Giga calories per metric tonne of product<br />
GDP – Gross domestic product<br />
GDR – Global depositary receipt<br />
HDGA steel – Hot-dipped galvanneal steel<br />
HDGI steel – Hot-dipped galvanized steel<br />
HDGL – Hot Dip Galvanizing Line<br />
HRC – hot-rolled coil<br />
HVA products – High value-added products<br />
Kt – Thousand tonnes<br />
LTIFR – Lost time injury frequency rate<br />
Mt – Million tonnes<br />
Mtpa – Million tonnes per annum<br />
MW – Megawatt<br />
NGO – Non-governmental organisation<br />
PLTCM – Pickle Line Tandem Cold Mill<br />
Tonnes – metric tonnes<br />
WTO – World Trade Organisation<br />
<strong>Severstal</strong> Annual Report and accounts 2012
company Overview Strategy Performance Sustainability Governance Financial statements Additional information<br />
Contacts<br />
188<br />
OAO <strong>Severstal</strong><br />
Legal address:<br />
30 Mira Street,<br />
Cherepovets, Vologda Region, 162608, Russia<br />
Postal address:<br />
2 K. Tsetkin Street<br />
Moscow, 127299, Russia<br />
Tel: +7 (495) 926 7766<br />
Fax: +7 (495) 926 7761<br />
www.severstal.com<br />
Corporate Secretary<br />
Oleg Tsvetkov<br />
Tel: +7 (8202) 53 0900<br />
Fax: +7 (8202) 53 2159<br />
Email: corporate_secretary@severstal.com<br />
Public Relations<br />
Elena Kovaleva<br />
Tel/Fax: +7 (495) 926 77 66<br />
Email: elena.kovaleva@severstal.com<br />
Investor Relations<br />
Vladimir Zaluzhsky<br />
Tel/Fax: +7 (495) 926 77 66<br />
Email: vladimir.zaluzhsky@severstal.com<br />
Human Resources<br />
Natalia Bachinskaya<br />
Tel: +7 (495) 926 77 61<br />
Email: natalia.bachinskaya@severstal.com<br />
Corporate Social Responsibility<br />
Natalia Poppel<br />
Tel/Fax: +7 (495) 926 77 66<br />
Email: na.poppel@severstal.com<br />
Auditor<br />
ZAO KPMG<br />
10, Presnenskaya Naberezhnaya,<br />
Block C, floor 31, Moscow, 123317, Russia<br />
Tel: +7 (495) 937 4477<br />
Fax: +7 (495) 937 4499<br />
Registrar<br />
ZAO Partnyor<br />
Address: 22, Pobedy Avenue, Cherepovets<br />
162606, Vologda Region, Russia<br />
Tel: +7 (8202) 53 6021<br />
Fax: +7 (8202) 55 3335<br />
Licence no.: 10-000-1-00287<br />
Date of issue: 04.04.2003 r.<br />
Expiry date: no expiry date<br />
Issued by: FSFM of Russia<br />
<strong>Severstal</strong> Annual Report and accounts 2012