A Comparative Survey of PSD Estimation Methods for EEG Signal ...
A Comparative Survey of PSD Estimation Methods for EEG Signal ...
A Comparative Survey of PSD Estimation Methods for EEG Signal ...

You also want an ePaper? Increase the reach of your titles
YUMPU automatically turns print PDFs into web optimized ePapers that Google loves.
1<br />
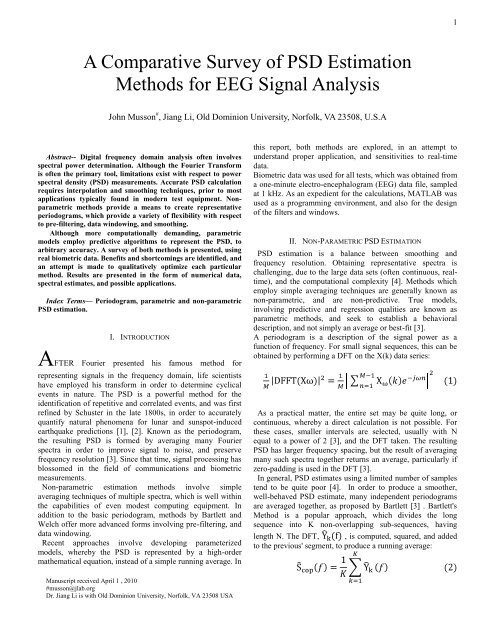
A <strong>Comparative</strong> <strong>Survey</strong> <strong>of</strong> <strong>PSD</strong> <strong>Estimation</strong><br />
<strong>Methods</strong> <strong>for</strong> <strong>EEG</strong> <strong>Signal</strong> Analysis<br />
John Musson # , Jiang Li, Old Dominion University, Norfolk, VA 23508, U.S.A<br />
Abstract-- Digital frequency domain analysis <strong>of</strong>ten involves<br />
spectral power determination. Although the Fourier Trans<strong>for</strong>m<br />
is <strong>of</strong>ten the primary tool, limitations exist with respect to power<br />
spectral density (<strong>PSD</strong>) measurements. Accurate <strong>PSD</strong> calculation<br />
requires interpolation and smoothing techniques, prior to most<br />
applications typically found in modern test equipment. Nonparametric<br />
methods provide a means to create representative<br />
periodograms, which provide a variety <strong>of</strong> flexibility with respect<br />
to pre-filtering, data windowing, and smoothing.<br />
Although more computationally demanding, parametric<br />
models employ predictive algorithms to represent the <strong>PSD</strong>, to<br />
arbitrary accuracy. A survey <strong>of</strong> both methods is presented, using<br />
real biometric data. Benefits and shortcomings are identified, and<br />
an attempt is made to qualitatively optimize each particular<br />
method. Results are presented in the <strong>for</strong>m <strong>of</strong> numerical data,<br />
spectral estimates, and possible applications.<br />
Index Terms— Periodogram, parametric and non-parametric<br />
<strong>PSD</strong> estimation.<br />
I. INTRODUCTION<br />
AFTER Fourier presented his famous method <strong>for</strong><br />
representing signals in the frequency domain, life scientists<br />
have employed his trans<strong>for</strong>m in order to determine cyclical<br />
events in nature. The <strong>PSD</strong> is a powerful method <strong>for</strong> the<br />
identification <strong>of</strong> repetitive and correlated events, and was first<br />
refined by Schuster in the late 1800s, in order to accurately<br />
quantify natural phenomena <strong>for</strong> lunar and sunspot-induced<br />
earthquake predictions [1], [2]. Known as the periodogram,<br />
the resulting <strong>PSD</strong> is <strong>for</strong>med by averaging many Fourier<br />
spectra in order to improve signal to noise, and preserve<br />
frequency resolution [3]. Since that time, signal processing has<br />
blossomed in the field <strong>of</strong> communications and biometric<br />
measurements.<br />
Non-parametric estimation methods involve simple<br />
averaging techniques <strong>of</strong> multiple spectra, which is well within<br />
the capabilities <strong>of</strong> even modest computing equipment. In<br />
addition to the basic periodogram, methods by Bartlett and<br />
Welch <strong>of</strong>fer more advanced <strong>for</strong>ms involving pre-filtering, and<br />
data windowing.<br />
Recent approaches involve developing parameterized<br />
models, whereby the <strong>PSD</strong> is represented by a high-order<br />
mathematical equation, instead <strong>of</strong> a simple running average. In<br />
this report, both methods are explored, in an attempt to<br />
understand proper application, and sensitivities to real-time<br />
data.<br />
Biometric data was used <strong>for</strong> all tests, which was obtained from<br />
a one-minute electro-encephalogram (<strong>EEG</strong>) data file, sampled<br />
at 1 kHz. As an expedient <strong>for</strong> the calculations, MATLAB was<br />
used as a programming environment, and also <strong>for</strong> the design<br />
<strong>of</strong> the filters and windows.<br />
II. NON-PARAMETRIC <strong>PSD</strong> ESTIMATION<br />
<strong>PSD</strong> estimation is a balance between smoothing and<br />
frequency resolution. Obtaining representative spectra is<br />
challenging, due to the large data sets (<strong>of</strong>ten continuous, realtime),<br />
and the computational complexity [4]. <strong>Methods</strong> which<br />
employ simple averaging techniques are generally known as<br />
non-parametric, and are non-predictive. True models,<br />
involving predictive and regression qualities are known as<br />
parametric methods, and seek to establish a behavioral<br />
description, and not simply an average or best-fit [3].<br />
A periodogram is a description <strong>of</strong> the signal power as a<br />
function <strong>of</strong> frequency. For small signal sequences, this can be<br />
obtained by per<strong>for</strong>ming a DFT on the X(k) data series:<br />
As a practical matter, the entire set may be quite long, or<br />
continuous, whereby a direct calculation is not possible. For<br />
these cases, smaller intervals are selected, usually with N<br />
equal to a power <strong>of</strong> 2 [3], and the DFT taken. The resulting<br />
<strong>PSD</strong> has larger frequency spacing, but the result <strong>of</strong> averaging<br />
many such spectra together returns an average, particularly if<br />
zero-padding is used in the DFT [3].<br />
In general, <strong>PSD</strong> estimates using a limited number <strong>of</strong> samples<br />
tend to be quite poor [4]. In order to produce a smoother,<br />
well-behaved <strong>PSD</strong> estimate, many independent periodograms<br />
are averaged together, as proposed by Bartlett [3] . Bartlett's<br />
Method is a popular approach, which divides the long<br />
sequence into K non-overlapping sub-sequences, having<br />
length N. The DFT, , is computed, squared, and added<br />
to the previous' segment, to produce a running average:<br />
Manuscript received April 1 , 2010<br />
#musson@jlab.org<br />
Dr. Jiang Li is with Old Dominion University, Norfolk, VA 23508 USA
2<br />
where multiple spectra, pertaining to smaller data slices, are<br />
averaged together.<br />
Bartlett's method improves signal to noise by factor K, but<br />
results in a loss <strong>of</strong> resolution <strong>of</strong> K/N, where N is the original<br />
size <strong>of</strong> the data set [3]. It is possible to show that, <strong>for</strong> large<br />
numbers <strong>of</strong> K, the estimate improves, and the variance tends<br />
to zero [3]. For simple estimates, this method achieves good<br />
results with minimal computation.<br />
A. Windowing<br />
To create the Bartlett sub-sequence, the data is effectively<br />
multiplied by a rectangular function, or time-windowed. From<br />
signal theory, multiplication in the time domain is equivalent<br />
to convolution in the frequency domain [5]. In Bartlett's<br />
example, the rectangular window results in a sinc(f) frequency<br />
spectrum, which is then squared to obtain the <strong>PSD</strong>. The<br />
resulting window frequency spectrum is sinc(f) convolved<br />
with itself, producing a triangular window, shown in Figure 1<br />
[5]:<br />
Fig. 2. Various window functions displaying different<br />
bandwidths. These were used in the simulation.<br />
supress out-<strong>of</strong>-band signals by ~ 25 dB [4]. Numerically,<br />
Welch's method is similar to Bartlett's, but with an additional<br />
index, and scaling factor:<br />
Fig. 1. A rectangular window used to select sub-sequence data<br />
<strong>for</strong> Bartlett's method has a sinc frequency response.<br />
This window, when finally convolved with the signal<br />
spectrum, distorts the original by smearing the narrow spectral<br />
components, possibly eliminating them, altogether [4]. This<br />
effect is remedied by extending the observation period (N) [3].<br />
Improvement is possible by careful selection <strong>of</strong> windows,<br />
which all have the basic trade<strong>of</strong>f between main lobe width,<br />
and sidelobe supression. Several windows are demonstrated in<br />
Figure 2.<br />
B. Welch's Method<br />
As was noted with windowing, energy from sidelobes leaks<br />
into the desired spectrum, creating fluctuations in the<br />
periodogram. Similar to Bartlett's Method, Welch computes<br />
periodograms <strong>of</strong> length N, and averages the spectra. However,<br />
two additional parameters permit the use <strong>of</strong> overlapping<br />
segments, and freedom to use any window [6]. The result is<br />
control over the amount <strong>of</strong> smoothing, as well as improving<br />
resolution by reducing energy leakage from excessive<br />
sidelobes. For example, a rectangular window is only able to<br />
Where S(ω) is the windowed DFT, I xx is the spectral estimate,<br />
and U is the normalizing factor, based on the particular<br />
windowing function, w(n) [3,6].<br />
The provision <strong>for</strong> adjustment <strong>of</strong> the two parameters is an<br />
attractive element, and adaptable to many analysis<br />
applications.<br />
C. <strong>EEG</strong> <strong>PSD</strong> <strong>Estimation</strong><br />
Welch's Method<br />
In order to evaluate each <strong>of</strong> the various estimation methods,<br />
actual biometric data was used to gain qualitative insight into<br />
the behaviors and limitations. The data set was obtained from<br />
60 seconds <strong>of</strong> electroencephalogram (<strong>EEG</strong>) measurements,<br />
whereby a subject was asked to per<strong>for</strong>m a series <strong>of</strong> tasks while<br />
driving [7]. The sample rate was fixed at 1 kHz, and includes<br />
artifacts as well as noise. Figure 3 depicts the raw data.<br />
As an expedient <strong>for</strong> the calculations, MATLAB was used as a<br />
programming environment, easily facilitating all <strong>of</strong> the<br />
necessary <strong>for</strong>mulas and computations.
3<br />
Welch's Method requires an extra 5 seconds <strong>of</strong> data, the raw<br />
data file was appended with the first 5 seconds, permitting the<br />
<strong>PSD</strong> window to “run-out” past the 60-second mark. The<br />
remaining 5 seconds were disregarded.<br />
Fig. 3. 60 seconds <strong>of</strong> Raw <strong>EEG</strong> data, sampled at 1 kHz.<br />
Pre-Filtering<br />
As a preliminary step to the <strong>PSD</strong> estimation, the entire data<br />
set was pre-filtered, using a 50 Hz Butterworth lowpass filter<br />
(LPF). Several orders <strong>of</strong> filter were tried, resulting in narrow<br />
transition bands. Although the selection was subjective, other<br />
literature suggests using lower-order filters to minimize phase<br />
distortion, caused by steep filter skirts, as well as possible<br />
quantization effects [8]. Ultimately, a 4-pole filter was<br />
designed, and is shown in Figure 4. The raw data was<br />
convolved with the filter, removing signal energy above the<br />
frequency bands <strong>of</strong> interest.<br />
D. Non-parametric Analysis<br />
For each slice, a simple periodogram was per<strong>for</strong>med on the<br />
entire 5-second interval, which resulted in a rather noisy <strong>PSD</strong><br />
estimate. Subtle features within the frequency band <strong>of</strong> interest<br />
(1 – 100 Hz) are difficult to differentiate. Bartlett and Welch<br />
<strong>Methods</strong> were per<strong>for</strong>med using N = 1000-point sub-sequences<br />
(1-second). Although smaller values <strong>of</strong> N result in more<br />
averaged spectra, frequency resolution is decreased beyond 1<br />
Hz, possibly interfering with subsequent power band<br />
measurements.<br />
Smoothing is seen with the averaging techniques, as well as<br />
some structure within the desired frequency band. Figure 5<br />
compares the three approaches, where the Welch Method<br />
employed a simple rectangular window, and 40% overlap.<br />
Fig. 5. Non-parametric <strong>PSD</strong> comparison, on single 5000-<br />
sample data slice, representing periodogram, Bartlett's<br />
method, and Welch's method (rectangular window, 40%<br />
overlap). Good agreement, and SNR improvement is<br />
demonstrated. Periodogram is slightly <strong>of</strong>fset, due to graphical<br />
effects, not numerical.<br />
Fig. 4. Magnitude response <strong>of</strong> designed 4-pole Butterworth<br />
low-pass filter, <strong>for</strong> prefiltering <strong>EEG</strong> data.<br />
The filtered data stream was first subjected to non-parametric<br />
methods, including the simple periodogram, Bartlett's Method,<br />
and Welch's Method. The 60-second set was sub-divided into<br />
5-second slices, which were then used to analyze the models.<br />
After the window and overlap parameters were optimized, the<br />
MATLAB routine was then allowed to run, sliding the <strong>PSD</strong><br />
window by 1-second increments through the data set. Since<br />
Many trials were run, with changes made to both the window<br />
type and amount <strong>of</strong> overlap. Subjectively, it was determined<br />
that a 50% overlap and Kaiser windowing produced the best<br />
result with the Welch Method. The trade<strong>of</strong>fs in dynamic range<br />
tracking are evident in Figure 6, particularly with respect to<br />
the endpoints at the higher frequencies. This is likely a result<br />
<strong>of</strong> the energy leak associated with Bartlett’s default square<br />
window, and highlights the benefit <strong>of</strong> Welch’s flexibility with<br />
respect to window function selection. In-band structure is<br />
accurately reproduced by all <strong>of</strong> the models.
4<br />
For extreme values, the three models show excellent<br />
agreement, with only miniscule differences. Peaking at 50 Hz<br />
is evident in all cases, as this represents the most<br />
distinguishable feature <strong>of</strong> the <strong>PSD</strong>. Figure 8 compares the<br />
periodogram and parametric cases <strong>for</strong> n=29, Hamming<br />
window.<br />
Fig. 6. Non-parametric comparison, employing 50% overlap<br />
and Kaiser windowing <strong>for</strong> Welch. Again, slight highfrequency<br />
shift in periodogram is due to graphic alignment,<br />
and not a numeric artifact. Good agreement is demonstrated.<br />
III. PARAMETRIC <strong>PSD</strong> ESTIMATION<br />
Much greater time was needed to evaluate and understand the<br />
parametric models, due to the complexity and amount <strong>of</strong><br />
additional computation time. As be<strong>for</strong>e, the three popular<br />
parametric models, Yule-Walker, Burg, and Least-squares was<br />
applied to each 5-second data slice, and adjusted <strong>for</strong> best<br />
qualitative fit. The order <strong>of</strong> the model proved to be somewhat<br />
sensitive, with an exact value difficult to ascertain. Previous<br />
reports indicate rather high values <strong>for</strong> n, ranging from 100-<br />
1000 [9]. Although these values were tried, extreme<br />
computation times and instabilities were observed.<br />
Other studies <strong>of</strong> biometric data suggested values from 10-60<br />
were sufficient <strong>for</strong> similar-sized data sets, and proved to be a<br />
better guide <strong>for</strong> this study [10]. Adhering to this range, many<br />
trials were per<strong>for</strong>med using the various windows and values<br />
<strong>for</strong> n. Very low values produced poor results, suggesting the<br />
model is unable to accurately predict the nuances <strong>of</strong> the <strong>PSD</strong>,<br />
as demonstrated in Figure 7.<br />
Fig. 8. Parametric model comparison <strong>for</strong> n=29, and Hamming<br />
window. Excellent agreement with periodogram is shown, as<br />
well as model-to-model consistency.<br />
After analysis was per<strong>for</strong>med on a slice-by-slice basis, some<br />
overall parameters were selected <strong>for</strong> all models, and the<br />
simulation allowed to run to completion. The entire 60-second<br />
data set was processed non-parametrically, using a 50%<br />
overlap and Hamming window <strong>for</strong> Welch. Hamming was<br />
chosen as it most closely mimicked the Gaussian window, but<br />
without the computational overhead. The resulting <strong>PSD</strong><br />
estimate demonstrates good smoothing, while retaining some<br />
<strong>of</strong> the structure evident in the averaged periodogram.<br />
Frequency resolution was retained at 1 Hz, sufficient <strong>for</strong> the<br />
subsequent power band measurements. The resulting <strong>PSD</strong> is<br />
shown in Figure 9, demonstrating solid agreement with the<br />
periodogram, and consistency between all three methods.<br />
Fig. 7. Parametric model comparison <strong>of</strong> full minute data set,<br />
displaying inadequate <strong>PSD</strong> prediction <strong>for</strong> low order (n=3). For<br />
n =15, the three models begin to converge, with only slight<br />
variance at the 50 Hz LPF corner frequency<br />
Fig. 9. Fully-processed data set, utilizing non-parametric<br />
estimation (50% overlap, Hamming window). SNR<br />
improvement and model consistency are excellent.<br />
Periodogram high-frequency shift is an artifact.
5<br />
Parametric models were also allowed to run the entire data<br />
set, after selecting a Kaiser window, and an n=50 <strong>for</strong> order.<br />
As was depicted in the slice-analysis, excellent agreement is<br />
evident, as well as model consistency. Although lacking the<br />
fine detail <strong>of</strong> the simple averaging methods, the predictions<br />
appear to be solid, and extendable past the edges, in the event<br />
extrapolation is required. Although the computation time took<br />
tens <strong>of</strong> seconds, this is well within the acceptable bounds <strong>of</strong><br />
modest computing equipment. Figure 10 compares the three<br />
models with the averaged periodogram<br />
Fig. 11. Alpha frequency-band power measurement vs time<br />
<strong>for</strong> <strong>EEG</strong> subject test, using non-parametric <strong>PSD</strong> estimation.<br />
Each 5000-sample data slice was processed, integrated and<br />
stored in a vector. Moderate agreement is demonstrated, with<br />
large improvement over simple periodogram.<br />
Fig. 10. Fully-processed data set, utilizing parametric<br />
modeling (n = 50, Kaiser window). SNR improvement and<br />
model consistency are excellent. Fine-frequency fluctuations<br />
are not present, as with the non-parametric <strong>PSD</strong>s.<br />
IV. <strong>EEG</strong> FREQUENCY BAND MEASUREMENTS<br />
Since the ultimate goal <strong>of</strong> the study was to identify changes<br />
in the spectrum resulting from brain activity, each <strong>of</strong> the three<br />
<strong>EEG</strong> frequency bands, given in Table 1, were used to extract<br />
the total integrated power from each data slice, and store in a<br />
vector to analyze over the 60-second subject test. Model<br />
parameters were identical to those depicted <strong>for</strong> the entire runs,<br />
in the previous section.<br />
Reasonable agreement is apparent between the averaged<br />
spectra, as well as improvement in frequency resolution over<br />
the averaged periodogram. Due to overlap, Welch appears to<br />
better identify persistent background frequencies, while<br />
Bartlett responds to instantaneous events (evidenced by the<br />
smoothing at 55 seconds). Both methods demonstrate finer<br />
detail in the structure with respect to the simple periodogram,<br />
despite having processed the identical data set.<br />
Similarly, Gamma activity was examined, using parametric<br />
estimation. Here, better overall estimation comes at the<br />
expense <strong>of</strong> fine-frequency fluctuations. Again, reasonable<br />
agreement with the periodogram is apparent, as well as the<br />
excellent consistency between the models, as demonstrated in<br />
Figure 12.<br />
Table 1. Frequency bands <strong>for</strong> <strong>EEG</strong> Alpha, Beta, and Gamma<br />
wave activity.<br />
Alpha Band 8 Hz 12 Hz<br />
Beta Band 16 Hz 24 Hz<br />
Gamma Band 31 Hz 43 Hz<br />
In addition, this data was saved to a file on disk, such that it<br />
might be further processed using a spreadsheet or other<br />
numerical package. Output was available <strong>for</strong> each particular<br />
method, whereby comparisons can be per<strong>for</strong>med between nonparametric<br />
and parametric estimations.<br />
Figure 11 shows the result <strong>of</strong> Alpha activity vs time, obtained<br />
using non-parametric estimation.<br />
Fig. 12. Gamma frequency-band power measurement vs time<br />
<strong>for</strong> <strong>EEG</strong> subject test, using parametric <strong>PSD</strong> modeling. Each<br />
5000-sample data slice was processed, integrated and stored in<br />
a vector. Excellent agreement and model consistency is<br />
apparent.<br />
Finally, Beta activity was analyzed using a comparison <strong>of</strong><br />
both non-parametric and parametric methods, in an ef<strong>for</strong>t to<br />
determine consistency. Figure 13 shows reasonable
6<br />
consistency between the models, as well as the periodogram.<br />
However, near the middle <strong>of</strong> the subject test, the periodogram<br />
suggests activity not displayed by either estimation method,<br />
perhaps due to the fact that the periodogram is inaccurately<br />
portraying the data, or there exists a numerical remnant. In<br />
either case, each method strongly suggests its strength and<br />
weakness, when viewed in the final analysis.<br />
Fig. 13. Beta frequency-band power measurement vs time <strong>for</strong><br />
<strong>EEG</strong> subject test, using non-parametric and parametric <strong>PSD</strong><br />
modeling. Each 5000-sample data slice was processed,<br />
integrated and stored in a vector. Moderate agreement and<br />
model consistency is apparent.<br />
ACKNOWLEDGEMENTS<br />
The author would like to thank the Thomas Jefferson<br />
National Accelerator Facility <strong>for</strong> generous academic support.<br />
Also, thank you to Dr. Elsayed-Ali and Dr. Jiang Li from<br />
ODU, <strong>for</strong> their encouragement regarding this manuscript.<br />
REFERENCES<br />
[1] Arthur Schuster, "On Lunar and Solar Periodicities <strong>of</strong> Earthquakes ",<br />
Proceedings <strong>of</strong> the Royal Society <strong>of</strong> London, Vol. 61 (1897), pp. 455–<br />
465<br />
[2] Arthur Schuster, "On the Periodicities <strong>of</strong> Sunspots", Philosophical<br />
Transactions <strong>of</strong> the Royal Society <strong>of</strong> London. Series A, Vol. 206.<br />
(1906), pp. 69-100.<br />
[3] J.G. Proakis, Manolakis, D.G., Digital <strong>Signal</strong> Processing: Principles,<br />
Algorithms, and Applications, 4 th Ed., Prentice Hall, NJ., 2007<br />
[4] S.W. Smith, The Scientist and Engineer's Guide to Digital <strong>Signal</strong><br />
Processing, 2 nd Ed., Cali<strong>for</strong>nia Technical Publishing, San Diego,<br />
CA., 1999<br />
[5] A.V. Oppenheim, A.S. Willsky, <strong>Signal</strong>s and Systems, 2 nd Ed.,<br />
Prentice Hall, NJ., 1997<br />
[6] H.C. So, Chan, Y.T., Ma, Q., Ching, P.C., “Comparison <strong>of</strong> Various<br />
Periodograms <strong>for</strong> Sinusoidal Detection and Frequency <strong>Estimation</strong>,”<br />
IEEE Trans. On Aerospace and Elec. Systems, Vol. 35, No. 3, July,<br />
1999<br />
[7] J. Li, ODU ECE 882 Project 1 Assignment, Fall, 2009<br />
[8] C.F. Hamer, Ifeachor, E.C., Jervis, B.W., “Digital Filtering <strong>of</strong><br />
Physiological <strong>Signal</strong>s with Minimal Distortion,” Medical and<br />
Biological Engineering and Computing, May, 1985<br />
[9] M.D. Krebs, et al., “Autoregressive Modeling <strong>of</strong> Analytical Sensor<br />
Data can Yield Classifiers in the Predictor Coefficient Parameter<br />
Space,” Bioin<strong>for</strong>matics Advance Access, Dec. 7, 2004.<br />
[10] Serap Aydin, “Comparison <strong>of</strong> Power Spectrum Predictors in<br />
Computing Coherence Functions <strong>for</strong> Intracortical <strong>EEG</strong> <strong>Signal</strong>s,”<br />
Annals <strong>of</strong> Biomedical Engineering, Vol. 37, No. 1, Jan. 2009, pp. 192-<br />
200.<br />
V. CONCLUSION<br />
<strong>PSD</strong> estimation is a prevalent, but difficult task in DSP.<br />
Hindered by excessive record lengths, presence <strong>of</strong> noise, as<br />
well as trade<strong>of</strong>fs involving frequency resolution and reduction<br />
<strong>of</strong> variance, proper selection and implementation is largely<br />
application-specific. Non-parametric methods are useful <strong>for</strong><br />
smoothing data, and are computationally efficient, especially<br />
when coupled with the Fast-Fourier Trans<strong>for</strong>m. Although they<br />
tend to preserve fine-frequency fluctuations, they are also<br />
subject to corruption by noise. In addition, the entire data<br />
record must ultimately be stored as a vector, which adds<br />
memory requirements to a measurement system. Many<br />
combinations <strong>of</strong> windows and overlapping were explored,<br />
each with their own attributes. As a starting point, Welch's<br />
Method, employing 50% overlap and a Hamming window<br />
produced good general results, and is recommended <strong>for</strong><br />
generic applications.<br />
Parametric model estimation is a powerful tool <strong>for</strong> <strong>PSD</strong><br />
estimation, particularly <strong>for</strong> band-data extraction. Since the<br />
result is a continuous model, little memory is required to<br />
represent the <strong>PSD</strong>. The cost is clearly computational overhead,<br />
but not excessive by modern computer metrics. Additionally,<br />
these models require additional tweaking and intervention.<br />
Undoubtedly, numerical “goodness <strong>of</strong> fit” algorithms exist <strong>for</strong><br />
these cases, but gaining a qualitative understanding <strong>of</strong> the<br />
behavior appeared to be adequate <strong>for</strong> the <strong>EEG</strong> analysis.