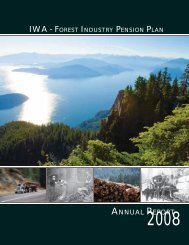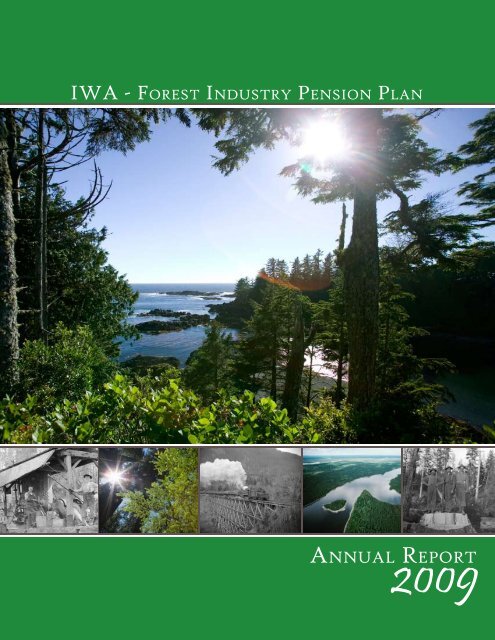
2009 Annual Report - IWA Forest Industry Pension Plan
2009 Annual Report - IWA Forest Industry Pension Plan
2009 Annual Report - IWA Forest Industry Pension Plan

Create successful ePaper yourself
Turn your PDF publications into a flip-book with our unique Google optimized e-Paper software.
<strong>IWA</strong> - Fo r e s t In d u s t r y Pe n s i o n Pl a n<br />
Ann u a l Re p o r t<br />
<strong>2009</strong>
<strong>IWA</strong> - Fo r e s t In d u s t r y Pe n s i o n Pl a n<br />
Suite 150 - 2955 Virtual Way<br />
Vancouver BC V5M 4X6<br />
Ci t y o f Va n c o u v e r Ar c h i v e s , Lo g P48 [c a . 1924]<br />
Main Switchboard: 604-433-6310<br />
Toll Free in BC: 1-800-663-4384<br />
<strong>Pension</strong> Info: 604-433-5862<br />
<strong>Pension</strong> Toll Free: 1-800-913-0022<br />
Facsimile: 604-433-0518<br />
Website: www.iwafibp.ca<br />
BLACK AND WHITE COVER PHOTOS:<br />
Ci t y o f Va n c o u v e r Ar c h i v e s<br />
Lo g P32.2 [c a . 1916]<br />
CVA 1184-2178 [b e t w e e n 1940-1948]<br />
CVA 7-69 [1911 o r 1912]
Ta b l e o f Co n t e n t s<br />
Me s s a g e f r o m t h e Tr u s t e e s 1<br />
Pr o f i l e 2<br />
A Br i e f Re v i e w of <strong>2009</strong> 3<br />
Pe n s i o n Pl a n Go v e r n a n c e 4<br />
Over view 4<br />
Go v e r n a n c e Pr a c t i ce s 4<br />
Bo a r d Co m m it t e e s 5<br />
Bo a r d Ch a n g e s 5<br />
Go v e r n a n c e St r u c t u r e 6<br />
Me m b e r s h ip 7<br />
Ac t i ve Member Pr o f il e 8<br />
Retired Member Pr o f il e 8<br />
Historical Membership Tr e n d s 9<br />
In v e s t m e n t In f o r m at i o n<br />
Assets in t h e <strong>Pension</strong> Fu n d 10<br />
Asset Mix 11<br />
Ra t e s o f Re t u r n a n d Be n c h m a r k s 12<br />
Investment Ma n a g e r s 14<br />
To p Ten Ho l d in g s 14<br />
Fi n a n c i a l In f o r m at i o n<br />
Go in g Co n c e r n Ac t u a r i al Liability 15<br />
So l v e n c y Liability 16<br />
Su m m a r iz e d Fin a n c i al St ate m e nt s f o r <strong>2009</strong> 17<br />
Benefit Pa y m e n t s 19<br />
Op e r a t in g Expenses 19<br />
Investment a n d Cu s t o d i al Fees 20<br />
An n u a l Ca s h Fl o w 20<br />
Co n t r i bu t o r y Ho u r s 21<br />
Gl o s s a r y 22
Me s s a g e f r o m t h e Tr u s t e e s<br />
We are pleased to present the <strong>IWA</strong> - <strong>Forest</strong> <strong>Industry</strong> <strong>Pension</strong> <strong>Plan</strong>’s <strong>Annual</strong> <strong>Report</strong> for <strong>2009</strong>.<br />
This past year has been an extraordinary period for financial markets and the forest industry.<br />
The financial markets in <strong>2009</strong> were dramatically different than 2008. Various stimulus measures in Canada and around the world,<br />
coupled with historically low interest rates, helped financial markets rally from the dramatic lows experienced the previous year.<br />
This rebound in financial markets, in conjunction with the <strong>Plan</strong>’s prudent approach to investing and longer term focus, led to a<br />
successful year for the fund. The <strong>Plan</strong> achieved a strong investment return in <strong>2009</strong>, earning 17.1%. This performance significantly<br />
exceeded the benchmark of 15.8% and helped to offset a great deal of the damage done in 2008, adding $233.9 million in value to<br />
the fund.<br />
While the returns for <strong>2009</strong> are encouraging, as recent years have demonstrated markets can fluctuate drastically. It is in these<br />
challenging times when we look for stability, and investment returns over a longer term assume more significance. The <strong>Plan</strong>’s tenyear<br />
annualized rate of return was 6.2%, compared to the ten-year annualized benchmark of 4.5%, a value added for this period of<br />
1.7% per year. These long-term measurements are more appropriate when gauging the performance of most pension funds.<br />
Not all the news for <strong>2009</strong> was good news. <strong>2009</strong> was not a good year for the forest industry or for many of our members. Historically<br />
low hours worked (and contributions made) have tempered the effects of the successful return on investments. In <strong>2009</strong> the <strong>Plan</strong><br />
experienced a 25% drop in contributions from the previous year, mirroring the difficulties experienced by the forest industry. One<br />
of the unique challenges of a maturing fund means the <strong>Plan</strong> pays out substantially more in benefits than it collects. In <strong>2009</strong> our ratio<br />
of active members (contributors) to retired members was only two active members for every three retirees. This is an important<br />
factor when developing investment strategies. In line with these concerns, we continue to focus on a comprehensive approach to<br />
risk management and a clear long-term investment strategy.<br />
As we look ahead, the Board has every confidence that the <strong>IWA</strong> - <strong>Forest</strong> <strong>Industry</strong> <strong>Pension</strong> <strong>Plan</strong> will continue to fulfill its mandate and<br />
meet its obligations across multiple generations of contributors and beneficiaries. The <strong>Plan</strong>’s fundamental approach to longer term<br />
investing, coupled with low costs, will aid in our efforts to meet our commitments throughout the years to come.<br />
Finally the Board wishes to acknowledge the retirement of Judith Brown, <strong>Pension</strong> Administrator for the <strong>Plan</strong> since 1995. We wish<br />
Judith a happy and prosperous retirement.<br />
to m Ge t z i e, Co-Ch a i r<br />
Bo b Ma t t e r s , Co-Ch a i r<br />
1<br />
<strong>IWA</strong> - <strong>Forest</strong> <strong>Industry</strong> <strong>Pension</strong> <strong>Plan</strong><br />
<strong>Annual</strong> <strong>Report</strong> <strong>2009</strong>
Pr o f i l e<br />
The <strong>IWA</strong> – <strong>Forest</strong> <strong>Industry</strong> <strong>Pension</strong> <strong>Plan</strong> (the “<strong>Plan</strong>”) was established in 1973 pursuant to negotiations between the I.W.A. and<br />
<strong>Forest</strong> <strong>Industry</strong> employers, to provide benefits for workers in the forest industry. In 1978 the Coast, Southern Interior and Northern<br />
Interior regional pension plans were merged to create the current <strong>Plan</strong>. In September of 2004 the I.W.A. merged with the United<br />
Steelworkers (“USW”) and now the forest industry employees are members of the USW. Today our <strong>Plan</strong> serves over 70,000 current<br />
and retired members in the industry.<br />
The <strong>Plan</strong> provides two major services: It acts as benefit administrator by collecting contributions and administering payment of<br />
benefits, and it also serves as the investment manager of the <strong>Plan</strong>’s assets (the “<strong>Pension</strong> Fund”).<br />
Ad m i n i s t r at i v e Fu n c t i o n s:<br />
Employer enrolment and collection of information.<br />
Collection of contributions from both participating employers and <strong>Plan</strong> members.<br />
Benefit calculations and processing.<br />
Providing information to members, union locals and participating employers on pension benefits.<br />
Payment of benefits.<br />
Filing of appropriate documentation for tax and pension regulatory purposes.<br />
In v e s t m e n t Fu n c t i o n s:<br />
Evaluate risk and return opportunities between the <strong>Plan</strong>’s assets and liabilities.<br />
Establish and recommend appropriate investment mix and long-term investment benchmarks.<br />
Use investment policy to review and monitor independent investment manager performance and make changes as<br />
appropriate.<br />
Use independent custodian for safekeeping of <strong>Plan</strong> assets.<br />
Use staff and independent consultants to review <strong>Plan</strong> investment strategies and ensure compliance with <strong>Plan</strong> policies<br />
and regulatory compliance.<br />
The <strong>Plan</strong> employs approximately 40 employees at our offices in Vancouver, B.C. and is governed by the provisions of the <strong>Pension</strong><br />
Benefits Standards Act of British Columbia.<br />
<strong>IWA</strong> - <strong>Forest</strong> <strong>Industry</strong> <strong>Pension</strong> <strong>Plan</strong><br />
<strong>Annual</strong> <strong>Report</strong> <strong>2009</strong><br />
2
A Br i e f Re v i e w o f <strong>2009</strong><br />
Me m b e r Se r v i c e s<br />
There were 16,439 active members in the <strong>Plan</strong> as at December 31, <strong>2009</strong>.<br />
There were 31,187 inactive members in the <strong>Plan</strong> as at December 31, <strong>2009</strong>.<br />
2,201 members retired in <strong>2009</strong>.<br />
A total of 24,399 retirees and beneficiaries received monthly pensions totalling in excess of $190,276,545 for <strong>2009</strong>.<br />
4,024 members broke service at the end of <strong>2009</strong>.<br />
The average monthly pension payment for <strong>2009</strong> was $659.27.<br />
Over 258 beneficiary claims were processed.<br />
Over 24,500 telephone calls were received in member services.<br />
4 retirement seminars were conducted across British Columbia.<br />
487 personal interview sessions were conducted with our pension counsellors at our offices in Vancouver.<br />
Over 2,068 estimates were provided to our membership.<br />
Our website reported over 550,000 hits by year end <strong>2009</strong>, with 10,474 visitors.<br />
Pl a n Hi g h l i g h t s<br />
There are currently 424 participating employers in the <strong>Plan</strong>; 19 employers began participating in the year <strong>2009</strong>.<br />
Approximately $41.7 million was contributed to the <strong>Plan</strong> by participating employers and $26.0 million by employees.<br />
There were 2,033 commuted value withdrawals from the <strong>Pension</strong> Fund at a value of $29.1 million.<br />
As of December 31, 2006 (the last filed actuarial valuation), there was a solvency liability of $3.372 billion, and a solvency<br />
ratio of 94%.<br />
As of December 31, 2006 (the last filed actuarial valuation), there was a going concern liability of $2.912 billion, and a<br />
funded ratio of 103.6%.<br />
Employee and employer contribution levels remained at $1.625 and $2.675 per hour respectively for the majority of<br />
participating employers.<br />
Our Board of Trustees met 3 times during the calendar year.<br />
15.9 million hours were reported for <strong>2009</strong> (2008 had 21 million hours).<br />
Payments to retired members and beneficiaries increased by $18.2 million from last year.<br />
In v e s t m e n t Hi g h l i g h t s<br />
The market value of the Fund increased from $2.51 billion to $2.76 billion at year-end.<br />
The annual rate of return on investments was 17.1%.<br />
3<br />
<strong>IWA</strong> - <strong>Forest</strong> <strong>Industry</strong> <strong>Pension</strong> <strong>Plan</strong><br />
<strong>Annual</strong> <strong>Report</strong> <strong>2009</strong>
Pe n s i o n Pl a n Go v e r n a n c e<br />
Ov e r v i e w<br />
A 16 member Board of Trustees equally representing both the United Steelworkers and the <strong>Forest</strong> <strong>Industry</strong> employers oversees the<br />
administration of the <strong>Plan</strong>. The <strong>Plan</strong>’s sponsors are responsible for appointing the Trustees to operate the <strong>Plan</strong> and manage the<br />
Fund in the long-term interest of the <strong>Plan</strong> membership.<br />
The appointed Trustees are responsible for determining <strong>Plan</strong> benefit levels and <strong>Plan</strong> design. They acquire and manage the services of<br />
the administrator, actuary, auditor, legal counsel, investment managers and custodian in order to ensure the security of the <strong>Pension</strong><br />
Fund and competent administration of members’ pensions. The <strong>Plan</strong> is provincially regulated and governed by the provisions of<br />
the <strong>Pension</strong> Benefits Standards Act of British Columbia.<br />
Go v e r n a n c e Pr ac t i c e s<br />
The role of a Trustee is complex and good governance practices are necessary to ensure the <strong>Plan</strong>’s goals are achieved. <strong>Pension</strong> plan<br />
governance refers to the structure and processes adopted by the Board of Trustees for overseeing, managing and administering<br />
the <strong>Plan</strong>. The objective of good governance is to optimize the <strong>Plan</strong>’s performance while ensuring that the <strong>Plan</strong> is able to meet its<br />
obligations to its members and beneficiaries.<br />
The Trustees of the <strong>Plan</strong> are required to act independently of the United Steelworkers and <strong>Forest</strong> <strong>Industry</strong> participating employers<br />
to make decisions in the best interest of our <strong>Plan</strong> members and beneficiaries. Through its ongoing commitment to good<br />
governance practices the Board has strategies in place to provide guidance, measure effectiveness and ensure accountability and<br />
transparency.<br />
Committee Terms of Reference: Reviewed and accepted guidelines for Trustee and staff roles and responsibilities as<br />
related to investment, administration, actuarial and audit issues.<br />
Committee Structure: Committees created to focus on the different roles and responsibilities of Board Trustees. Each<br />
committee meets anywhere from one to four times per year. Ad hoc committees, to deal with short term specific issues,<br />
are established on an as needed basis.<br />
Code of Conduct Policy: Developed to articulate and sustain a governance and corporate culture that reflects the<br />
Board’s principles and values, and to ensure that Trustees have a full understanding of these principles and values.<br />
Board Education and Qualification: Orientation and external training for new and existing Trustees to educate and<br />
assist them in carrying out their governance responsibilities. Comprehensive Trustee Governance Manual designed to<br />
assist Board members on current training requirements and standards of practice.<br />
Board Effectiveness Assessment Process: Self-assessment process required annually which is designed to provide<br />
Trustees with an opportunity to examine how the Board is operating and to make suggestions for improvement.<br />
Communication: The Board communicates to the union, participating employers and membership regularly through<br />
audited financial statements, actuarial valuations, this report, annual statements issued to members, our website, on<br />
site seminars and through our member services via local and toll free phone lines.<br />
<strong>IWA</strong> - <strong>Forest</strong> <strong>Industry</strong> <strong>Pension</strong> <strong>Plan</strong><br />
<strong>Annual</strong> <strong>Report</strong> <strong>2009</strong><br />
4
Pe n s i o n Pl a n Go v e r n a n c e<br />
Bo a r d Co m m it t e e s<br />
The committees are made up of Trustees with equal representation from participating <strong>Forest</strong> <strong>Industry</strong> employers and the United<br />
Steelworkers.<br />
Audit Committee<br />
The Audit Committee assists in the supervision of the <strong>Plan</strong>’s internal operations, reviews the audited financial reports, meets<br />
with external auditors, and ensures information disclosure, accuracy and efficiency thereby building confidence with <strong>Plan</strong><br />
members, <strong>Plan</strong> sponsors and regulators.<br />
Investment Committee<br />
The Investment Committee oversees the investment of the <strong>Pension</strong> Fund. It reviews and advises the Trustees as to selection<br />
of investment managers, matters of investment policy, <strong>Pension</strong> Fund asset management and any other matters relating to the<br />
investment and management of the <strong>Pension</strong> Fund.<br />
Governance Committee<br />
The Governance Committee reviews the system of governance including the mandates for the Board and committees, best<br />
practices for <strong>Plan</strong> governance and the effectiveness of the Board and its committees.<br />
Human Resources & Compensation Committee<br />
The Human Resources & Compensation Committee establishes compensation, including compensation policies and strategies,<br />
for the General Manager and the Director, Investments as well as compensation policies and strategies for employees excluded<br />
from the bargaining unit. It also reviews labour relations, strategy, succession planning and key employee development.<br />
Bo a r d Ch a n g e s<br />
There were no changes to the Board of Trustees last year.<br />
5<br />
<strong>IWA</strong> - <strong>Forest</strong> <strong>Industry</strong> <strong>Pension</strong> <strong>Plan</strong><br />
<strong>Annual</strong> <strong>Report</strong> <strong>2009</strong>
Go v e r n a n c e St r u c t u r e<br />
<strong>IWA</strong> - Fo r e s t In d u s t r y Pe n s i o n Pl a n<br />
Bo a r d o f Tr us t e e s<br />
Tom Getzie (1, 2, 3*, 4*)<br />
Co-Chair<br />
<strong>Forest</strong> Industrial Relations<br />
Bob Matters (1*, 2*, 3*, 4*)<br />
Co-Chair<br />
United Steelworkers<br />
Mike Bryce (3)<br />
CONIFER<br />
Vern Carter (2*)<br />
I.F.L.R.A.<br />
Frank Everitt (1, 2)<br />
USW<br />
Bill Routley (1)<br />
USW<br />
Donald Cadman (1*, 3, 4)<br />
CONIFER<br />
Norman Chow (1)<br />
I.F.L.R.A.<br />
Brian Harder<br />
USW<br />
Doug Singer<br />
USW<br />
Brian Cairo (2)<br />
FIR<br />
Terry Lineker<br />
FIR<br />
Monty Mearns<br />
USW<br />
Darrel Wong (1, 2, 3, 4)<br />
USW<br />
Warren Oja<br />
USW<br />
Harvey Arcand, Advisor - USW<br />
Gerry Smith, Advisor - USW<br />
Adm i n i s t r at i o n & In v e s t m e n t s<br />
Robert Bishoff<br />
General Manager<br />
Colleen Troelstrup<br />
Director, Investments<br />
Stephanie Griffith<br />
<strong>Pension</strong> Administrator<br />
Tr u s t Fu n d Cu s t o d i a n Pl a n Ac t u a r y Au d i t o r s<br />
RBC DEXIA INVESTOR SERVICES TOWERS PERRIN, INC. GRANT THORNTON LLP<br />
Ex t e r n a l Le g a l Co u n s e l<br />
LAWSON LUNDELL LLP<br />
In v e s t m e n t Co n s u lta n t<br />
MERCER (CANADA) LIMITED<br />
1 Audit Committee<br />
1* Audit Committee Co-Chair<br />
2 Investment Committee<br />
2* Investment Committee Co-Chair<br />
3 Governance Committee<br />
3* Governance Committee Co-Chair<br />
4 Human Resources & Compensation Committee<br />
4* Human Resources & Compensation Committee Co-Chair<br />
Appointing Organizations:<br />
I.F.L.R.A.<br />
Interior <strong>Forest</strong> Labour Relations Association<br />
CONIFER<br />
Council on Northern Interior <strong>Forest</strong> Employment Relations<br />
FIR<br />
<strong>Forest</strong> Industrial Relations<br />
USW<br />
United Steelworkers<br />
<strong>IWA</strong> - <strong>Forest</strong> <strong>Industry</strong> <strong>Pension</strong> <strong>Plan</strong><br />
<strong>Annual</strong> <strong>Report</strong> <strong>2009</strong><br />
6
Me m b e r s h i p<br />
The <strong>Plan</strong> holds the pension assets of over 70,000 members, from 424 participating employers and is considered the largest private<br />
sector pension plan in British Columbia.<br />
<strong>2009</strong> 2008 2007<br />
Active Members 16,439 21,361 24,256<br />
Inactive Members 31,187 29,645 28,598<br />
Retired Members 24,399 22,712 22,072<br />
Market Value of Funds (millions) $2,757.7 $2,513.2 $3,212.7<br />
Employer Contributions (millions) $41.7 $57.9 $74.4<br />
Employee Contributions (millions) $26.0 $31.7 $33.7<br />
Retirement Benefits Paid (millions) $219.4 $172.1 $162.0<br />
Value of Members Accounts transferred out of <strong>Plan</strong><br />
(millions)<br />
<strong>Annual</strong> Administrative Cost per Member<br />
(excludes investment cost)<br />
$29.1 $26.2 $21.8<br />
$60.83 $57.30 $53.22<br />
The annual administrative cost per member increased slightly last year to $60.83. This cost continues to remain relatively stable,<br />
averaging $54.36 per member over the last 5 years.<br />
Me m b e r s h ip Br e a k d o w n <strong>2009</strong> a n d 1989<br />
1989 <strong>2009</strong><br />
23%<br />
Active<br />
(16,439)<br />
63%<br />
Active<br />
(47,421)<br />
43%<br />
Inactive<br />
(31,187)<br />
20%<br />
Inactive<br />
(15,088)<br />
34%<br />
Retirees &<br />
Beneficiaries<br />
(24,399)<br />
17%<br />
Retirees &<br />
Beneficiaries<br />
(12,434)<br />
0 10,000 20,000 30,000 40,000 50,000 60,000 70,000 80,000<br />
The number of pensioners has nearly doubled in the past 20 years, while the number of active members declined by 65% - in part<br />
due to greater global competition, the rapid pace of technological change and automation within the forest industry. The market<br />
value of the Fund in this same period, however, has grown from $695 million in 1989 to $2.76 billion in <strong>2009</strong> - a growth of nearly<br />
300%. This is significant because as a mature pension plan, investment returns become more important to the future growth of<br />
the <strong>Pension</strong> Fund than contributions.<br />
7<br />
<strong>IWA</strong> - <strong>Forest</strong> <strong>Industry</strong> <strong>Pension</strong> <strong>Plan</strong><br />
<strong>Annual</strong> <strong>Report</strong> <strong>2009</strong>
Me m b e r s h i p<br />
Ac t i v e Me m b e r Pr o f i l e<br />
The statistics over the last 20 years show a slight trend towards<br />
aging workers in the forest industry. The average age of a<br />
worker in the forest industry was 45.3 on December 31, <strong>2009</strong>,<br />
up from 38.0 in 1989.<br />
Over Age 65<br />
0.6%<br />
Ac t i v e Me m b e r s b y Ag e - <strong>2009</strong><br />
Under Age 25<br />
7%<br />
Age 60-64<br />
6%<br />
Age 25-34<br />
14%<br />
Age 55-59<br />
15%<br />
Age 35-44<br />
19%<br />
Age 45-54<br />
38%<br />
Over Age 65<br />
1.9%<br />
Ag e a t Re t i r e m e n t<br />
At Normal<br />
Retirement<br />
Age (65)<br />
15.2%<br />
(o v e r l a s t 5 y e a r s)<br />
Before Normal<br />
Retirement<br />
Age (65)<br />
82.9%<br />
Members are retiring earlier and living longer than they did 20<br />
years ago. From 1985 to 1989 the average age of retirement<br />
was 62.2 with an average life expectancy of 17.4 years. The<br />
average age at retirement over the last 5 years was 60.4 with an<br />
average life expectancy of 20.9 years.<br />
Re t i r e d Me m b e r Pr o f i l e<br />
The average age of a pensioner in the <strong>Plan</strong> has risen from<br />
68.4 in 1989 to 71.2 in <strong>2009</strong>; an increase of 4% over the past<br />
20 years.<br />
There are more than 3,500 pensioners over the age of 80,<br />
with approximately 430 being over the age of 90.<br />
Pe n s i o n e r s b y Ag e - <strong>2009</strong><br />
Age 60-64<br />
16.8%<br />
Age 65-69<br />
22.5%<br />
Fo r m s of Pe n s i o n<br />
Beneficiaries Beneficiaries<br />
Pre-retirement Death Post-retirement<br />
3% Death<br />
<strong>Pension</strong>ers<br />
12%<br />
Subsidized<br />
Early Retirement<br />
55%<br />
<strong>Pension</strong>ers<br />
Vested<br />
Deferred<br />
21%<br />
Limited Members<br />
1%<br />
Age 90+<br />
2.1%<br />
Under Age 60<br />
6.4%<br />
<strong>Pension</strong>ers<br />
Normal (at age 65)<br />
8%<br />
Age 80-89<br />
15.4%<br />
Age 70-79<br />
36.7%<br />
55% of our pensioners are receiving subsidized early retirement<br />
pensions.<br />
Survivor benefits make up over 15% of our pensions in payment<br />
(both “pre” and “post” retirement beneficiaries).<br />
<strong>IWA</strong> - <strong>Forest</strong> <strong>Industry</strong> <strong>Pension</strong> <strong>Plan</strong><br />
<strong>Annual</strong> <strong>Report</strong> <strong>2009</strong><br />
8
Me m b e r s h i p<br />
Hi s t o r i c a l Mem b e r s h ip Tr e n d s<br />
The number of active <strong>Plan</strong> members in the forest industry has declined considerably over the past twenty years in response to<br />
greater global competition, the rapid pace of technological change, automation within the forest industry and environmental<br />
concerns. This decline has in turn led to an increase in our inactive membership and pensioners.<br />
80,000<br />
Hi s t o r i c a l Me m b e r s h ip Tr e n d s (1999 - <strong>2009</strong>)<br />
70,000<br />
60,000<br />
Inactive Members<br />
Inactive Members<br />
50,000<br />
40,000<br />
<strong>Pension</strong>ers & Beneficiaries<br />
30,000<br />
20,000<br />
10,000<br />
Active Members<br />
0<br />
1999<br />
2000<br />
2001<br />
2002<br />
2003<br />
2004<br />
2005<br />
2006<br />
2007<br />
2008<br />
<strong>2009</strong><br />
Ci t y o f Va n c o u v e r Ar c h i v e s , LP 255..4 [b e t w e e n 1910 a n d 1914]<br />
9<br />
<strong>IWA</strong> - <strong>Forest</strong> <strong>Industry</strong> <strong>Pension</strong> <strong>Plan</strong><br />
<strong>Annual</strong> <strong>Report</strong> <strong>2009</strong>
As s e t s in t h e Pe n s i o n Fu n d<br />
The <strong>Pension</strong> Fund has grown from $58 million in 1977 to $2.76 billion at the end of <strong>2009</strong>. During <strong>2009</strong>, like 2008, ALL investors – both<br />
institutional and individuals – again witnessed unusual stock, bond and real estate market volatility. The <strong>Pension</strong> Fund is balanced<br />
and broadly diversified. It is balance – diversification across asset classes, regions and currencies - that is the key to weathering<br />
the ups and downs like investors saw during 2008 and <strong>2009</strong>. Further, it is important to keep in mind that long-term performance<br />
is most significant for pension plans because they pay benefits to members over very long periods of time. Be assured that the<br />
<strong>Plan</strong>’s investment policies are sound and the <strong>Plan</strong>’s trustees, staff and investment managers continue to work diligently to ensure<br />
the <strong>Plan</strong>’s long-term investment objectives are met.<br />
3.5<br />
Ma r k e t Va l u e As s e t Gro w t h (20 y e a r s)<br />
3.0<br />
3.180<br />
3.213<br />
$2.76 billion<br />
Asset Value ($billions)<br />
2.5<br />
2.0<br />
1.5<br />
1.0<br />
0.5<br />
0.695<br />
0.682<br />
0.785<br />
0.806<br />
0.0<br />
1989<br />
1990<br />
1991<br />
1992<br />
1993<br />
1994<br />
1995<br />
1996<br />
1997<br />
1998<br />
1999<br />
2000<br />
2001<br />
2002<br />
2003<br />
2004<br />
2005<br />
2006<br />
2007<br />
2008<br />
<strong>2009</strong><br />
1.6<br />
1.4<br />
1.2<br />
1.0<br />
0.8<br />
0.6<br />
0.4<br />
0.2<br />
0.0<br />
1989<br />
1990<br />
1991<br />
1992<br />
1993<br />
1994<br />
1995<br />
1996<br />
1997<br />
1998<br />
1999<br />
2000<br />
2001<br />
2002<br />
2003<br />
2004<br />
2005<br />
2006<br />
2007<br />
2008<br />
<strong>2009</strong><br />
0.989<br />
1.039<br />
1.263<br />
1.511<br />
1.698<br />
1.814<br />
1.953<br />
2.110<br />
2.079<br />
1.950<br />
2.216<br />
2.451<br />
2.800<br />
2.513<br />
Contributions from both members and employers add to <strong>Plan</strong> assets, as do investment returns. As the <strong>Plan</strong> matures,<br />
however, contributions are expected to make up less of total cash inflows while investment returns will make up relatively<br />
more. While hourly contributions have risen over the past 20 years, total contributions continue to decline as hours worked<br />
decline. This means that should hours worked and total contributions not increase, the <strong>Plan</strong> will become more reliant<br />
on investment returns in the future. The graph below shows the downward trend of contributions relative to pension<br />
payments.<br />
Ra t i o of Co n t r i b u t i o n s t o Pe n s i o n Pa y m e n t s (20 y e a r s)<br />
<strong>IWA</strong> - <strong>Forest</strong> <strong>Industry</strong> <strong>Pension</strong> <strong>Plan</strong><br />
<strong>Annual</strong> <strong>Report</strong> <strong>2009</strong><br />
10
As s e t Mix<br />
The <strong>Plan</strong>’s long-term asset mix is set as a result of the evaluation of the <strong>Plan</strong>’s liability structure (the payment schedule of<br />
pension benefits over time) and the funding of the <strong>Plan</strong> (expected contributions plus investment returns). The final asset<br />
mix is the “best” trade-off of risk and return that comes from evaluating the many possible outcomes and risks associated<br />
with investments. Consequently, the <strong>Plan</strong>’s investments are diversified across asset class, region and currency in stocks,<br />
bonds and real estate. Professional staff and investment managers manage these investments and regularly report on their<br />
activities to the <strong>Plan</strong>’s Investment Committee.<br />
The <strong>Plan</strong>’s equity portfolio is further diversified according to investment style by using managers who follow value, growth and<br />
core investment styles. However, overall, the <strong>Plan</strong>‘s equity portfolio is managed with a value bias. The value style of investing tends<br />
to provide the portfolio with better protection when markets are not performing well while producing attractive returns over the<br />
longer-term.<br />
The <strong>Plan</strong>’s asset mix as at year-end <strong>2009</strong> was as follows:<br />
As s e t Div e r s i f i c at i o n a s a t De c e m b e r 31, <strong>2009</strong><br />
As s e t Al l o c a t i o n<br />
As s e t Cl a s s Va l u e<br />
Real Estate and<br />
Infrastructure<br />
8.3%<br />
$800.0<br />
$700.0<br />
$600.0<br />
Bonds<br />
25.6%<br />
Foreign Equities<br />
36.9%<br />
Asset Value ($millions)<br />
$500.0<br />
$400.0<br />
$300.0<br />
$200.0<br />
Cash<br />
1.6%<br />
Mortgages<br />
1.6%<br />
Canadian Equities<br />
26.0%<br />
$100.0<br />
$-<br />
Cash<br />
Canadian Bonds - Universe<br />
Canadian Bonds - Long<br />
Canadian Mortgages<br />
Real Estate & Infrastructure<br />
Canadian Equities<br />
US Equities<br />
Global Equities<br />
Non-North American (EAFE) Equities<br />
Emerging Market Equities<br />
11<br />
<strong>IWA</strong> - <strong>Forest</strong> <strong>Industry</strong> <strong>Pension</strong> <strong>Plan</strong><br />
<strong>Annual</strong> <strong>Report</strong> <strong>2009</strong>
Ra t e s o f Re t u r n a n d Be n c h m a r k s<br />
A benchmark is a standard for comparison. At the investment manager or asset class level, it is an index chosen because it best<br />
reflects the risk and return of a particular investment approach. A benchmark helps answer the basic question of “How are the <strong>Plan</strong>’s<br />
investments performing?”<br />
The total <strong>Plan</strong> benchmark is a weighted combination of the individual benchmarks of each asset class. The weighting reflects the<br />
<strong>Plan</strong>’s long-term allocation to each asset class.<br />
For the year ended December 31, <strong>2009</strong>, the <strong>Plan</strong>’s return was 17.1% against the benchmark of 15.8%. <strong>Plan</strong> returns have been positive<br />
in 27 of the last 31 years. Further, <strong>Plan</strong> returns have beat the benchmark in 12 of the last 19 years.<br />
Market performance in 2008 and <strong>2009</strong> has reminded all investors that any one year is unpredictable and can be volatile. It is<br />
important therefore, to keep in mind that long-term performance is most significant for a pension plan because benefits are paid<br />
to members over very long periods of time. Over the last ten years, for example, the <strong>Plan</strong>’s investment returns have averaged 6.2%<br />
versus a benchmark of 4.5%. During that ten year period, however, returns reached as high as 17.1% and as low as -18.4%.<br />
The <strong>Plan</strong>’s investment returns need to be interpreted with care. <strong>Plan</strong> performance should not be evaluated over short-term periods.<br />
<strong>Annual</strong> review periods are too short and are included to demonstrate how short-term results can be very volatile. This is especially<br />
important as the <strong>Plan</strong> has and will continue to experience both strong and weak market environments over time. The chart below<br />
shows actual annual rates of return for the <strong>Plan</strong> and the <strong>Plan</strong>’s benchmark since 1991.<br />
25%<br />
Ra t e s of Re t u r n v s . Be n c h m a r k s<br />
20%<br />
15%<br />
10%<br />
5%<br />
0%<br />
-5%<br />
1991 1992 1993 1994 1995 1996 1997 1998 1999 2000 2003 2004 2005 2006 2007 <strong>2009</strong><br />
2001 2002<br />
2008<br />
-10%<br />
-15%<br />
-20%<br />
<strong>Plan</strong> Return (%) <strong>Plan</strong> Benchmark (%)<br />
<strong>IWA</strong> - <strong>Forest</strong> <strong>Industry</strong> <strong>Pension</strong> <strong>Plan</strong><br />
<strong>Annual</strong> <strong>Report</strong> <strong>2009</strong><br />
12
Ra t e s o f Re t u r n a n d Be n c h m a r k s<br />
The Board regularly monitors the <strong>Plan</strong>’s assets, liabilities, investment policies and returns. Although short-term performance<br />
is important, our funding objective is long-term; to deliver pension benefits to members over decades. The chart below<br />
provides a relevant comparison of results over five and ten year periods.<br />
7.0%<br />
Ra t e s of Re t u r n v s . Be n c h m a r k (An n u a l i z e d)<br />
5-year annualized value added = 0.6%<br />
10-year annualized value added = 1.7%<br />
6.0%<br />
5.0%<br />
4.0%<br />
5.7%<br />
5.1%<br />
6.2%<br />
4.5%<br />
3.0%<br />
2.0%<br />
1.0%<br />
0.0%<br />
2005 - <strong>2009</strong> 2000 - <strong>2009</strong><br />
<strong>Plan</strong> Return (%) <strong>Plan</strong> Benchmark (%)<br />
Achieving performance above the benchmark of 0.5% is significant and difficult for many pension plans to accomplish. The <strong>Plan</strong><br />
has beat the benchmark by 1.7% over the last ten years. Over time, value-added performance accumulates like compound interest<br />
and can be a significant contributor to <strong>Plan</strong> performance.<br />
13<br />
<strong>IWA</strong> - <strong>Forest</strong> <strong>Industry</strong> <strong>Pension</strong> <strong>Plan</strong><br />
<strong>Annual</strong> <strong>Report</strong> <strong>2009</strong>
In v e s t m e n t Ma n a g e r s as a t De c e m b e r 31, <strong>2009</strong><br />
Manager Mandate % of Assets<br />
Managed<br />
TD Asset Management Canadian Equities 11.6<br />
Phillips Hager & North Canadian Equities 9.0<br />
Beutel Goodman Canadian Equities 5.4<br />
TD Asset Management Canadian Bonds 12.8<br />
Phillips Hager & North Canadian Bonds 9.9<br />
Beutel Goodman Canadian Bonds 4.5<br />
JP Morgan Asset Management US Equities 5.3<br />
Aronson + Johnson + Oritz US Equities 5.2<br />
Alliance Bernstein Global Equities 8.6<br />
Capital Guardian Global Equities 4.1<br />
Oechsle Non-North American (EAFE) Equities 5.4<br />
Sprucegrove Non-North American (EAFE) Equities 5.1<br />
Capital Guardian Emerging Market Equities 3.2<br />
Various Real Estate and Infrastructure 8.3<br />
Internal Cash 1.6<br />
To p Te n Ho l d i n g s as a t De c e m b e r 31, <strong>2009</strong><br />
Security Issuer Type of Security Holding as a %<br />
of Total Assets<br />
1 Concert Real Estate Corporation Real Estate 2.2<br />
2 Toronto Dominion Bank Canadian Bank Stock 1.6<br />
3 Royal Bank of Canada Canadian Bank Stock 1.3<br />
4 Canadian Imperial Bank of Commerce Canadian Bank Stock 1.2<br />
5 Canadian Government Canadian Government Bond - 5% Coupon<br />
1.2<br />
Maturity June 1, 2037<br />
6 Ontario Government Provincial Government Bond - 7.6% Coupon<br />
1.1<br />
Maturity June 2, 2027<br />
7 Manulife Financial Corporation Canadian Financial Company Stock 1.0<br />
8 Suncor Energy Corporation Canadian Energy Company Stock 1.0<br />
9 Barrick Gold Corporation Canadian Gold Company Stock 0.9<br />
10 Canadian Government Canadian Government Bond - 4% Coupon<br />
Maturity June 1, 2041<br />
0.9<br />
<strong>IWA</strong> - <strong>Forest</strong> <strong>Industry</strong> <strong>Pension</strong> <strong>Plan</strong><br />
<strong>Annual</strong> <strong>Report</strong> <strong>2009</strong><br />
14
Pl a n ’s Fi n a n c i a l Po s i t i o n<br />
Go i n g Co n c e r n Ac t u a r i a l Liability<br />
Going concern is an actuarial method used to measure <strong>Plan</strong> funding which assumes an entity remains in existence for the<br />
foreseeable future. The going concern actuarial liability provides an estimate of the obligations of the <strong>Plan</strong>, assuming that the<br />
<strong>Plan</strong> continues indefinitely.<br />
The assumptions used to determine the going concern actuarial liability are the best estimate of each assumption, including<br />
a margin for adverse deviation. These assumptions change over time, as economic conditions change. Each year, ongoing<br />
pension accruals add to the <strong>Plan</strong>’s liabilities and benefits paid reduce the <strong>Plan</strong>’s assets, while potential investment returns and<br />
contributions add to the <strong>Plan</strong>’s assets.<br />
In accordance with the <strong>Pension</strong> Benefits Standards Act of British Columbia and the Income Tax Act (Canada) and Regulations, an<br />
actuarial valuation is required to be filed at least every three years to estimate the <strong>Plan</strong>’s surplus or deficit, and to determine the<br />
<strong>Plan</strong>’s funding requirement. The last filed actuarial valuation, December 31, 2006, disclosed actuarial assets of $3,015,558,000, with<br />
accrued pension liabilities of $2,911,940,000, resulting in a surplus of $103,618,000.<br />
The key actuarial assumption included in this valuation is an assumed long-term investment return of 6.5% per year. When the<br />
going concern actuarial liability is larger than the <strong>Plan</strong>’s actuarial value of assets, the shortfall must be paid into the <strong>Plan</strong> over a<br />
period not exceeding 15 years.<br />
The ratio of the <strong>Plan</strong>’s market value of assets to its actuarial liability was estimated at 103.6% at December 31, 2006, up from 87.7%<br />
two years earlier.<br />
120%<br />
Hi s t o r i c a l Fu n d e d Ra t i o<br />
100%<br />
80%<br />
60%<br />
40%<br />
This chart indicates the historical relationship<br />
between the <strong>Plan</strong>’s Market Value of Assets and the<br />
Going Concern Actuarial Liability.<br />
20%<br />
0%<br />
1985<br />
1986<br />
1987<br />
1988<br />
1989<br />
1990<br />
1991<br />
1992<br />
1993<br />
1994<br />
1995<br />
1996<br />
1997<br />
1998<br />
1999<br />
2000<br />
2001<br />
2002<br />
2003<br />
2004<br />
2005<br />
2006<br />
15<br />
<strong>IWA</strong> - <strong>Forest</strong> <strong>Industry</strong> <strong>Pension</strong> <strong>Plan</strong><br />
<strong>Annual</strong> <strong>Report</strong> <strong>2009</strong>
Pl a n ’s Fi n a n c i a l Po s i t i o n<br />
So lv e n c y Liability<br />
Solvency is the ability of an entity to pay future financial obligations. The <strong>Pension</strong> Benefits Standards Act of British Columbia regulates<br />
pension plans for solvency requirements. “Solvency valuations” are filed every three years with the Financial Institutions Commission<br />
of BC. The solvency valuation provides an estimate of the ability to pay the obligations of the <strong>Plan</strong> assuming that the <strong>Plan</strong> is wound<br />
up on the valuation date.<br />
The assumptions used to determine the solvency liabilities are developed based on the manner in which benefits would likely be<br />
settled if the <strong>Plan</strong> was wound up on the valuation date. For this purpose, it is assumed that all members under age 55 would receive<br />
a commuted value and that all members age 55 and over would have an annuity purchased on their behalf. These assumptions<br />
change over time, as economic conditions change.<br />
The key assumption is the interest rate used to calculate the solvency liability. The interest rate is determined based on yields on<br />
long-term bonds and is mandated by the government and the actuarial profession. The Trustees have no control over the selection<br />
of this assumption. When the interest rate declines, the solvency liability increases. Conversely, when the interest rate rises, the<br />
solvency liability decreases. From 1997 to 2006 the interest rate declined by over 3%, from 8% to 4.5%. This decline in long-term<br />
interest rates alone has increased the solvency liability by nearly $1 billion.<br />
When the solvency liability is larger than the <strong>Plan</strong>’s current market value of assets, the shortfall must be paid into the <strong>Plan</strong> over a<br />
period of five years, or the benefit payments must be reduced.<br />
As of the last filed actuarial valuation, December 31, 2006, the ratio of the <strong>Plan</strong>’s market value of assets to solvency liabilities was<br />
estimated at 94.0% at year-end, up from 89.4% two years earlier. This solvency ratio indicates that the <strong>Plan</strong> currently does not have<br />
sufficient assets to cover all the benefits that had been promised as of that date. The valuation is, however, within the limits of the<br />
<strong>Pension</strong> Benefits Standards Act for solvency requirements.<br />
120%<br />
Hi s t o r i c a l So lv e n c y Ra t i o<br />
100%<br />
80%<br />
60%<br />
40%<br />
This chart indicates the historical relationship<br />
between the <strong>Plan</strong>’s Market Value of Assets and<br />
the Solvency Liability.<br />
20%<br />
0%<br />
1987<br />
1988<br />
1989<br />
1990<br />
1991<br />
1992<br />
1993<br />
1994<br />
1995<br />
1996<br />
1997<br />
1998<br />
1999<br />
2000<br />
2001<br />
2002<br />
2003<br />
2004<br />
2005<br />
2006<br />
<strong>IWA</strong> - <strong>Forest</strong> <strong>Industry</strong> <strong>Pension</strong> <strong>Plan</strong><br />
<strong>Annual</strong> <strong>Report</strong> <strong>2009</strong><br />
16
Sum m a r i z e d Fi n a n c i a l St a t e m e n t s f o r <strong>2009</strong><br />
<strong>IWA</strong> - Fo r e s t In d u s t r y Pe n s i o n Pl a n<br />
St a t e m e n t o f Ne t As s e t s Ava i l a b l e f o r Me m b e r s<br />
Year Ended <strong>2009</strong> 2008<br />
ASSETS<br />
Cash $ 26,550,085 $ 21,235,525<br />
Investment income receivable 3,736,545 4,968,101<br />
Contributions and other receivable 6,155,317 7,635,606<br />
Investments 2,765,499,421 2,523,879,933<br />
2,801,941,368 2,557,719,165<br />
LIABILITIES<br />
Payables and accruals 2,663,708 2,496,351<br />
Commuted values payable 5,238,238 4,679,501<br />
Mortgages payable 36,285,174 37,313,580<br />
44,187,120 44,489,432<br />
Net assets available for members $ 2,757,754,248 $ 2,513,229,733<br />
17<br />
<strong>IWA</strong> - <strong>Forest</strong> <strong>Industry</strong> <strong>Pension</strong> <strong>Plan</strong><br />
<strong>Annual</strong> <strong>Report</strong> <strong>2009</strong>
Sum m a r i z e d Fi n a n c i a l St a t e m e n t s f o r <strong>2009</strong><br />
<strong>IWA</strong> - Fo r e s t In d u s t r y Pe n s i o n Pl a n<br />
St a t e m e n t o f Ch a n g e s in Ne t As s e t s Ava i l a b l e f o r Me m b e r s<br />
Year Ended <strong>2009</strong> 2008<br />
REVENUE<br />
Investment Income $ 98,561,363 $ 141,840,602<br />
Loss on sale of investments (59,520,551) (97,209,368)<br />
Unrealized gain (loss) on investments 367,940,542 (624,648,473)<br />
406,981,354 (580,017,239)<br />
CONTRIBUTIONS<br />
Employer 41,742,509 57,871,718<br />
Employee 26,023,256 31,662,202<br />
474,747,119 (490,483,319)<br />
EXPENSES<br />
Benefit payments 219,378,549 198,291,734<br />
Administrative 3,991,548 3,819,578<br />
Non-administrative 6,852,507 6,880,495<br />
230,222,604 208,991,807<br />
Increase (decrease) in net assets available for members 244,524,515 (699,475,126)<br />
Net assets available for members<br />
Beginning of year 2,513,229,733 3,212,704,859<br />
End of year $ 2,757,754,248 $ 2,513,229,733<br />
<strong>IWA</strong> - <strong>Forest</strong> <strong>Industry</strong> <strong>Pension</strong> <strong>Plan</strong><br />
<strong>Annual</strong> <strong>Report</strong> <strong>2009</strong><br />
18
Ben e f i t Pa y m e n t s<br />
Benefits under the <strong>Plan</strong>, held in Trust, are provided from the <strong>Pension</strong> Fund. The <strong>Plan</strong> paid a total of $219.4 million to members and<br />
beneficiaries in <strong>2009</strong>. This number includes $190.3 million to retired members and their beneficiaries and $29.1 million in commuted<br />
value payments for inactive members under the age of 55 and death benefits paid on behalf of deceased <strong>Plan</strong> members.<br />
Pe n s i o n Pa y m e n t s<br />
To Re t i r e d Me m b e r s a n d t h e i r Be n e f i c i a r i e s<br />
$200<br />
30,000<br />
<strong>Annual</strong> <strong>Pension</strong> Payments ($millions)<br />
$180<br />
$160<br />
$140<br />
$120<br />
$100<br />
$80<br />
$60<br />
$40<br />
$20<br />
25,000<br />
20,000<br />
15,000<br />
10,000<br />
5,000<br />
# of Retired Members/Beneficiaries<br />
$0<br />
1989<br />
1990<br />
1991<br />
1992<br />
1993<br />
1994<br />
1995<br />
1996<br />
1997<br />
1998<br />
1999<br />
2000<br />
2001<br />
2002<br />
2003<br />
2004<br />
2005<br />
2006<br />
2007<br />
2008<br />
<strong>2009</strong><br />
0<br />
Op e r a t i n g Ex p e n s e s<br />
In <strong>2009</strong>, the <strong>IWA</strong> - <strong>Forest</strong> <strong>Industry</strong> <strong>Pension</strong> <strong>Plan</strong> had an administrative cost of $60.83 per member. This number has remained relatively<br />
stable for the past 5 years as detailed in the next table. The <strong>Plan</strong>’s total operating costs (including Investment and Custodial Fees)<br />
for <strong>2009</strong> totalled $10,844,055.<br />
<strong>2009</strong> 2008 2007 2006 2005<br />
Administrative Expenses $3,991,548 $3,819,578 $3,611,058 $3,624,579 $3,242,892<br />
Actuarial & Consulting Fees 210,921 258,936 243,177 212,929 281,694<br />
Audit & Accounting Fees 89,159 105,489 90,660 91,122 59,804<br />
Legal Fees 14,334 19,641 22,278 12,992 41,696<br />
Registration Fees 75,332 20,308 20,315 20,315 20,294<br />
TOTAL ADMINISTRATIVE COST $4,381,294 $4,223,952 $3,978,488 $3,961,937 $3,646,380<br />
Total Number of Members 72,025 73,718 74,926 76,991 74,488<br />
Administrative Cost per Member $60.83 $57.30 $53.22 $51.46 $48.98<br />
Each year the <strong>Plan</strong> measures cost performance by using a pool of major Canadian pension plans to benchmark overall administrative<br />
cost per member. This pool covers over one million pension plan members. The average administrative cost for this pool for 2008<br />
was $159 per member. Three of the plans used in this comparison had membership totals very close to our <strong>Plan</strong> (approximately<br />
75,000). The average administrative cost for this group was $219 per member.<br />
19<br />
<strong>IWA</strong> - <strong>Forest</strong> <strong>Industry</strong> <strong>Pension</strong> <strong>Plan</strong><br />
<strong>Annual</strong> <strong>Report</strong> <strong>2009</strong>
In v e s t m e n t & Cu s t o d i a l Ex p e n s e s<br />
The Investment Fees for <strong>2009</strong> totalled $5,851,323. Custodial Fees for the year totalled $611,438. This computes to 0.2343% of the<br />
Market Value of the Fund. Investment management fees can vary greatly and are a product of the size and type of asset being<br />
managed. Investment and Custodial Fees are usually calculated as an annual percentage of the average total net asset value of<br />
the fund. In some cases, additional investment manager fees are netted against asset values and performance based fees may be<br />
payable, and therefore are not included in the table below.<br />
The following table illustrates the last five years of the <strong>Plan</strong>’s Investment and Custodial Fees:<br />
<strong>2009</strong> 2008 2007 2006 2005<br />
Investment Fees $5,851,323 $5,950,940 $6,171,084 $5,722,314 $5,386,648<br />
Custodial Fees 611,438 525,181 556,902 541,647 469,035<br />
TOTAL $6,462,761 $6,476,121 $6,727,986 $6,236,961 $5,855,683<br />
Market Value of Fund $2,757,754,248 $2,513,229,733 $3,219,782,032 $3,179,965,696 $2,800,303,008<br />
% of Market Value of Fund 0.2343% 0.2577% 0.2090% 0.1970% 0.2091%<br />
An n u a l Ca s h Fl o w<br />
The <strong>Plan</strong> had a total net income of $474,747,119 in <strong>2009</strong>, which includes an increase from employer and employee contributions of<br />
$67,765,765 and an investment gain of $406,981,354. The benefit payments and expenses totalled $230,222,604. The value of the<br />
<strong>Pension</strong> Fund therefore increased by $244,524,515 during <strong>2009</strong>.<br />
In v e s t m e n t In c o m e & Co n t r i b u t i o n s v s . Be n e f i t Pa y m e n t s & Ex p e n s e s<br />
$600.0<br />
$400.0<br />
$200.0<br />
($millions)<br />
$-<br />
$-400.0<br />
$-600.0<br />
1989<br />
1990<br />
1991<br />
1992<br />
1993<br />
1994<br />
1995<br />
1996<br />
1997<br />
1998<br />
1999<br />
2000<br />
2001<br />
2002<br />
2003<br />
2004<br />
2005<br />
2006<br />
2007<br />
2008<br />
<strong>2009</strong><br />
Investment Income Contributions Benefit Payments & Total Expenses<br />
<strong>IWA</strong> - <strong>Forest</strong> <strong>Industry</strong> <strong>Pension</strong> <strong>Plan</strong><br />
<strong>Annual</strong> <strong>Report</strong> <strong>2009</strong><br />
20
Co n t r i b u t o r y Ho u r s<br />
The <strong>Plan</strong> had a total of 15,915,669 hours reported for <strong>2009</strong>. The forest industry has undergone many challenges in the last few<br />
years. On the heels of the softwood lumber dispute and the destruction caused by the mountain pine beetle, the current market<br />
conditions have been challenging for the industry, ultimately resulting in a steady decline in contributions.<br />
As the industry is restructured, the hours reported have declined substantially in the last 10 years by approximately 63%.<br />
70.0<br />
60.0<br />
1989<br />
59,442,959 hours reported<br />
Co n t r i b u t o r y Ho u r s Re p o r t e d (20 y e a r s)<br />
(millions)<br />
50.0<br />
40.0<br />
30.0<br />
<strong>2009</strong><br />
15,915,669 hours reported<br />
73% decrease<br />
20.0<br />
10.0<br />
0.0<br />
1989<br />
1990<br />
1991<br />
1992<br />
1993<br />
1994<br />
1995<br />
1996<br />
1997<br />
1998<br />
1999<br />
2000<br />
2001<br />
2002<br />
2003<br />
2004<br />
2005<br />
2006<br />
2007<br />
2008<br />
<strong>2009</strong><br />
21<br />
<strong>IWA</strong> - <strong>Forest</strong> <strong>Industry</strong> <strong>Pension</strong> <strong>Plan</strong><br />
<strong>Annual</strong> <strong>Report</strong> <strong>2009</strong>
Gl o s s a r y<br />
Active Member - A member of a participating employer who maintains continuous employment. For the purpose of the<br />
<strong>Plan</strong>, continuous employment means that the member does not incur a break-in-service or maintains 350 qualifying hours,<br />
as defined by the <strong>Plan</strong> Text, in two consecutive calendar years.<br />
Actuarial Liability - An estimate of the <strong>Plan</strong>’s financial obligations, which uses actuarial assumptions (economic and<br />
demographic) and assumes that the <strong>Plan</strong> continues indefinitely.<br />
Actuarial Valuation - Examination of a pension plan by an actuary to assess the solvency of the plan and determine the<br />
level of contributions required to maintain or improve its solvency (solvency valuation). Also included is a going concern<br />
valuation used to determine the value of a plan assuming it will continue to operate indefinitely as a going concern.<br />
Actuarial Value of Assets - The theoretical value of the <strong>Plan</strong> assets as of a given date, determined by applying a set of<br />
actuarial assumptions (economic and demographic). The actuarial value of assets smooths the gains and losses of the<br />
market value of assets over a four-year period.<br />
Actuary - A trained specialist in the pension field responsible for determining pension plan liabilities. In Canada, full<br />
professional recognition requires membership in the Canadian Institute of Actuaries.<br />
Annuity - A series of equal payments made at intervals to an individual from a lump sum investment either for life or for a<br />
specified period of time.<br />
Benchmark - An “Investment Benchmark” is the index representative of the asset class against which a portfolio manager’s<br />
investment performance is evaluated.<br />
Beneficiary - A person designated by a <strong>Plan</strong> member to receive benefits.<br />
Board of Trustees or Trustees - Those persons appointed under the Trust Agreement acting as fiduciaries, holding the<br />
assets and administering the <strong>Plan</strong> for the members’ and beneficiaries’ benefit.<br />
Bond - A certificate of debt issued by a government or corporation guaranteeing payment of the original investment plus<br />
interest by a specified future date. Also referred to as a fixed-interest security.<br />
Commuted Value - The actuarial present value of the pension benefits to which a <strong>Plan</strong> member or former <strong>Plan</strong> member<br />
may be entitled to, calculated in accordance with the <strong>Pension</strong> Benefits Standards Act of British Columbia which takes into<br />
account several variables such as life expectancies and interest rates relevant at the time.<br />
Custodian - A financial institution or trust company that holds in custody and for safekeeping, the securities and other<br />
assets of a trust fund.<br />
Early Retirement - Retirement prior to a member’s “normal” retirement date (65 years of age). Members of the <strong>IWA</strong> - <strong>Forest</strong><br />
<strong>Industry</strong> <strong>Pension</strong> <strong>Plan</strong> can commence their pension anytime after age 55 with the appropriate actuarial reductions.<br />
Emerging Markets - the financial markets of developing economies.<br />
Equity or Equities - Refers to the ownership of property, usually in the form of common stocks, as opposed to fixed<br />
income bearing securities such as bonds or mortgages.<br />
Going Concern - Refers to the assumption that the <strong>Plan</strong> will continue indefinitely, people will retire, terminate, and die in<br />
the normal patterns.<br />
<strong>IWA</strong> - <strong>Forest</strong> <strong>Industry</strong> <strong>Pension</strong> <strong>Plan</strong><br />
<strong>Annual</strong> <strong>Report</strong> <strong>2009</strong><br />
22
Gl o s s a r y<br />
Inactive Member - Often referred to as “vested deferred” member. Member has a break-in-service or has failed to maintain<br />
350 qualifying hours, as defined by the <strong>Plan</strong> Text, in two consecutive calendar years.<br />
Investment Fee - The service fee of the investment managers. Varies depending on the size of the fund and rate of<br />
return.<br />
Long Bonds - Bonds with a term to maturity of more than 10 years.<br />
Market Value - The current price at which a security or commodity is trading as indicated by current market conditions.<br />
Member Services - <strong>Plan</strong> staff available to members to answer questions and provide forms.<br />
Normal Retirement Date - Age 65 is the normal age of retirement in this <strong>Plan</strong>. It is the age at which a <strong>Plan</strong> member can<br />
retire and receive full unreduced pension. However, because of a special <strong>Plan</strong> provision, active members can retire with a<br />
fully subsidized pension at age 60.<br />
<strong>Pension</strong> Fund (“Fund”) - The account where monies received by the Trustees, including employer and employee<br />
contributions and investment income are held in Trust.<br />
<strong>Plan</strong> Member (“Member”) - A person who has become covered by the <strong>Plan</strong> and continues to be covered under the <strong>Plan</strong>.<br />
<strong>Plan</strong> Sponsor - <strong>Plan</strong> sponsor means an employer, association or any other entity providing a benefit plan. For this <strong>Plan</strong>, the<br />
<strong>Plan</strong> sponsors are the United Steelworkers and the employer associations: FIR, I.F.L.R.A., CONIFER and other independent<br />
employers.<br />
<strong>Plan</strong> Text - The document which sets out the eligibility requirements to become a member of the <strong>Plan</strong> and the amount of<br />
benefits that will be paid to <strong>Plan</strong> members and beneficiaries.<br />
Portfolio - A compilation of investments held by an institution or individual.<br />
Solvency - The capacity of an entity to pay future benefits or claims that have been promised; calculated in terms of a<br />
specific date.<br />
Solvency Valuation - The valuation of the liabilities and assets of a pension plan determined as if the plan had been<br />
wound up on the valuation date using methods and actuarial assumptions in accordance with generally accepted actuarial<br />
principles and practices appropriate for such determination.<br />
Subsidized Early Retirement Reduction - A benefit that allows active members of the <strong>Plan</strong> to retire early with little or no<br />
reduction to their pension (55-59 marginal reduction, 60+ no reduction).<br />
Trust - The property held by the Trustees for the benefit of another under a fiduciary relationship to be used only for the<br />
purposes set out in the Trust Agreement.<br />
Trust Agreement - The agreement entered into by the union and employer association groups that established the <strong>Pension</strong><br />
Trust and <strong>Pension</strong> <strong>Plan</strong>.<br />
Wind Up / Wound Up - Discontinuation of a pension plan as regulated by law. The plan is essentially shut down as of a<br />
given date and the pensions are paid out according to the solvency calculated on the specific date.<br />
23<br />
<strong>IWA</strong> - <strong>Forest</strong> <strong>Industry</strong> <strong>Pension</strong> <strong>Plan</strong><br />
<strong>Annual</strong> <strong>Report</strong> <strong>2009</strong>
No t e s<br />
<strong>IWA</strong> - <strong>Forest</strong> <strong>Industry</strong> <strong>Pension</strong> <strong>Plan</strong><br />
<strong>Annual</strong> <strong>Report</strong> <strong>2009</strong><br />
24
No t e s<br />
25<br />
<strong>IWA</strong> - <strong>Forest</strong> <strong>Industry</strong> <strong>Pension</strong> <strong>Plan</strong><br />
<strong>Annual</strong> <strong>Report</strong> <strong>2009</strong>
No t e s<br />
<strong>IWA</strong> - <strong>Forest</strong> <strong>Industry</strong> <strong>Pension</strong> <strong>Plan</strong><br />
<strong>Annual</strong> <strong>Report</strong> <strong>2009</strong><br />
26
Ci t y o f Va n c o u v e r Ar c h i v e s , Lo g P32.2 [c a . 1916]<br />
Ci t y o f Va n c o u v e r Ar c h i v e s , CVA 371-1366, [C. 190-?]
<strong>IWA</strong> - <strong>Forest</strong> In d u s t r y <strong>Pension</strong> Pl a n<br />
150 - 2955 Virtual Way<br />
Vancouver BC V5M 4X6<br />
Main Switchboard: 604-433-6310<br />
Toll Free in BC: 1-800-663-4384<br />
<strong>Pension</strong> Information: 604-433-5862<br />
<strong>Pension</strong> Toll Free: 1-800-913-0022<br />
Facsimile: 604-433-0518<br />
®<br />
Website: www.iwafibp.ca