2009 Annual Report - IWA Forest Industry Pension Plan
2009 Annual Report - IWA Forest Industry Pension Plan
2009 Annual Report - IWA Forest Industry Pension Plan

Create successful ePaper yourself
Turn your PDF publications into a flip-book with our unique Google optimized e-Paper software.
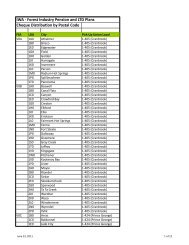
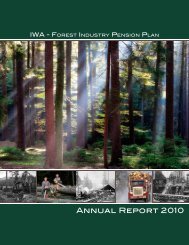
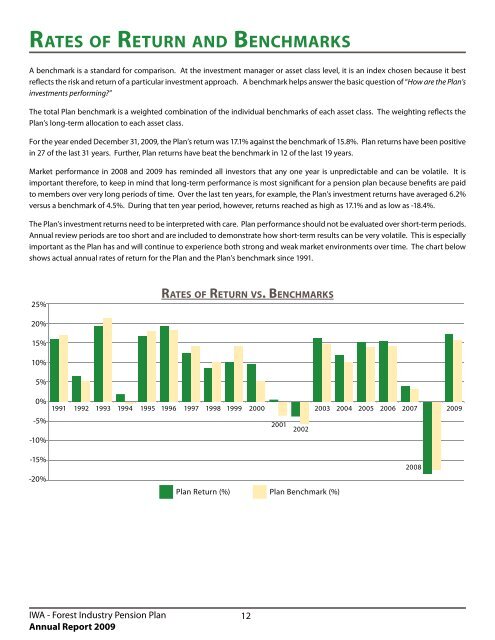
Ra t e s o f Re t u r n a n d Be n c h m a r k s<br />
A benchmark is a standard for comparison. At the investment manager or asset class level, it is an index chosen because it best<br />
reflects the risk and return of a particular investment approach. A benchmark helps answer the basic question of “How are the <strong>Plan</strong>’s<br />
investments performing?”<br />
The total <strong>Plan</strong> benchmark is a weighted combination of the individual benchmarks of each asset class. The weighting reflects the<br />
<strong>Plan</strong>’s long-term allocation to each asset class.<br />
For the year ended December 31, <strong>2009</strong>, the <strong>Plan</strong>’s return was 17.1% against the benchmark of 15.8%. <strong>Plan</strong> returns have been positive<br />
in 27 of the last 31 years. Further, <strong>Plan</strong> returns have beat the benchmark in 12 of the last 19 years.<br />
Market performance in 2008 and <strong>2009</strong> has reminded all investors that any one year is unpredictable and can be volatile. It is<br />
important therefore, to keep in mind that long-term performance is most significant for a pension plan because benefits are paid<br />
to members over very long periods of time. Over the last ten years, for example, the <strong>Plan</strong>’s investment returns have averaged 6.2%<br />
versus a benchmark of 4.5%. During that ten year period, however, returns reached as high as 17.1% and as low as -18.4%.<br />
The <strong>Plan</strong>’s investment returns need to be interpreted with care. <strong>Plan</strong> performance should not be evaluated over short-term periods.<br />
<strong>Annual</strong> review periods are too short and are included to demonstrate how short-term results can be very volatile. This is especially<br />
important as the <strong>Plan</strong> has and will continue to experience both strong and weak market environments over time. The chart below<br />
shows actual annual rates of return for the <strong>Plan</strong> and the <strong>Plan</strong>’s benchmark since 1991.<br />
25%<br />
Ra t e s of Re t u r n v s . Be n c h m a r k s<br />
20%<br />
15%<br />
10%<br />
5%<br />
0%<br />
-5%<br />
1991 1992 1993 1994 1995 1996 1997 1998 1999 2000 2003 2004 2005 2006 2007 <strong>2009</strong><br />
2001 2002<br />
2008<br />
-10%<br />
-15%<br />
-20%<br />
<strong>Plan</strong> Return (%) <strong>Plan</strong> Benchmark (%)<br />
<strong>IWA</strong> - <strong>Forest</strong> <strong>Industry</strong> <strong>Pension</strong> <strong>Plan</strong><br />
<strong>Annual</strong> <strong>Report</strong> <strong>2009</strong><br />
12