Master Plan Re-exam - July 2012 - Marlboro Township, NJ
Master Plan Re-exam - July 2012 - Marlboro Township, NJ
Master Plan Re-exam - July 2012 - Marlboro Township, NJ

You also want an ePaper? Increase the reach of your titles
YUMPU automatically turns print PDFs into web optimized ePapers that Google loves.
the township of marlboro master plan re<strong>exam</strong>ination report - july <strong>2012</strong><br />
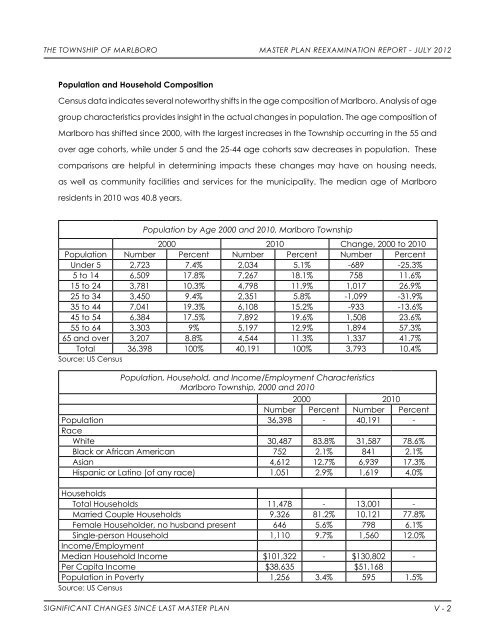
Population and Household Composition<br />
Census data indicates several noteworthy shifts in the age composition of <strong>Marlboro</strong>. Analysis of age<br />
group characteristics provides insight in the actual changes in population. The age composition of<br />
<strong>Marlboro</strong> has shifted since 2000, with the largest increases in the <strong>Township</strong> occurring in the 55 and<br />
over age cohorts, while under 5 and the 25-44 age cohorts saw decreases in population. These<br />
comparisons are helpful in determining impacts these changes may have on housing needs,<br />
as well as community facilities and services for the municipality. The median age of <strong>Marlboro</strong><br />
residents in 2010 was 40.8 years.<br />
Population by Age 2000 and 2010, <strong>Marlboro</strong> <strong>Township</strong><br />
2000 2010 Change, 2000 to 2010<br />
Population Number Percent Number Percent Number Percent<br />
Under 5 2,723 7.4% 2,034 5.1% -689 -25.3%<br />
5 to 14 6,509 17.8% 7,267 18.1% 758 11.6%<br />
15 to 24 3,781 10.3% 4,798 11.9% 1,017 26.9%<br />
25 to 34 3,450 9.4% 2,351 5.8% -1,099 -31.9%<br />
35 to 44 7,041 19.3% 6,108 15.2% -933 -13.6%<br />
45 to 54 6,384 17.5% 7,892 19.6% 1,508 23.6%<br />
55 to 64 3,303 9% 5,197 12.9% 1,894 57.3%<br />
65 and over 3,207 8.8% 4,544 11.3% 1,337 41.7%<br />
Total 36,398 100% 40,191 100% 3,793 10.4%<br />
Source: US Census<br />
Population, Household, and Income/Employment Characteristics<br />
<strong>Marlboro</strong> <strong>Township</strong>, 2000 and 2010<br />
2000 2010<br />
Number Percent Number Percent<br />
Population 36,398 - 40,191 -<br />
Race<br />
White 30,487 83.8% 31,587 78.6%<br />
Black or African American 752 2.1% 841 2.1%<br />
Asian 4,612 12.7% 6,939 17.3%<br />
Hispanic or Latino (of any race) 1,051 2.9% 1,619 4.0%<br />
Households<br />
Total Households 11,478 - 13,001 -<br />
Married Couple Households 9,326 81.2% 10,121 77.8%<br />
Female Householder, no husband present 646 5.6% 798 6.1%<br />
Single-person Household 1,110 9.7% 1,560 12.0%<br />
Income/Employment<br />
Median Household Income $101,322 - $130,802 -<br />
Per Capita Income $38,635 $51,168<br />
Population in Poverty 1,256 3.4% 595 1.5%<br />
Source: US Census<br />
significant changes since last master plan V - 2