White TSH - New Line Medical
White TSH - New Line Medical
White TSH - New Line Medical

You also want an ePaper? Increase the reach of your titles
YUMPU automatically turns print PDFs into web optimized ePapers that Google loves.
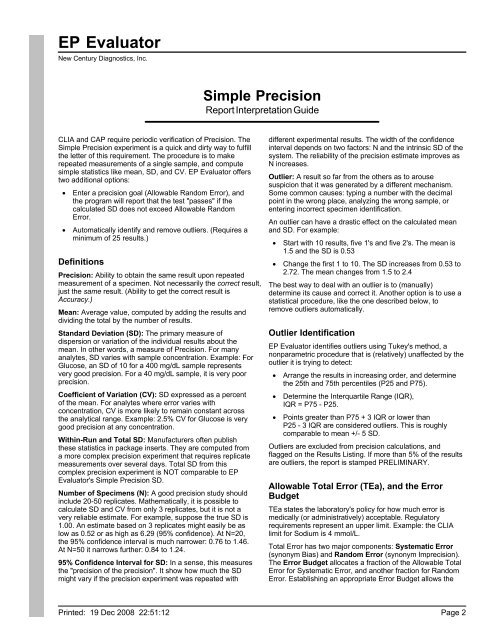
EP Evaluator<br />
<strong>New</strong> Century Diagnostics, Inc.<br />
Simple Precision<br />
Report Interpretation Guide<br />
CLIA and CAP require periodic verification of Precision. The<br />
Simple Precision experiment is a quick and dirty way to fulfill<br />
the letter of this requirement. The procedure is to make<br />
repeated measurements of a single sample, and compute<br />
simple statistics like mean, SD, and CV. EP Evaluator offers<br />
two additional options:<br />
• Enter a precision goal (Allowable Random Error), and<br />
the program will report that the test "passes" if the<br />
calculated SD does not exceed Allowable Random<br />
Error.<br />
• Automatically identify and remove outliers. (Requires a<br />
minimum of 25 results.)<br />
Definitions<br />
Precision: Ability to obtain the same result upon repeated<br />
measurement of a specimen. Not necessarily the correct result,<br />
just the same result. (Ability to get the correct result is<br />
Accuracy.)<br />
Mean: Average value, computed by adding the results and<br />
dividing the total by the number of results.<br />
Standard Deviation (SD): The primary measure of<br />
dispersion or variation of the individual results about the<br />
mean. In other words, a measure of Precision. For many<br />
analytes, SD varies with sample concentration. Example: For<br />
Glucose, an SD of 10 for a 400 mg/dL sample represents<br />
very good precision. For a 40 mg/dL sample, it is very poor<br />
precision.<br />
Coefficient of Variation (CV): SD expressed as a percent<br />
of the mean. For analytes where error varies with<br />
concentration, CV is more likely to remain constant across<br />
the analytical range. Example: 2.5% CV for Glucose is very<br />
good precision at any concentration.<br />
Within-Run and Total SD: Manufacturers often publish<br />
these statistics in package inserts. They are computed from<br />
a more complex precision experiment that requires replicate<br />
measurements over several days. Total SD from this<br />
complex precision experiment is NOT comparable to EP<br />
Evaluator's Simple Precision SD.<br />
Number of Specimens (N): A good precision study should<br />
include 20-50 replicates. Mathematically, it is possible to<br />
calculate SD and CV from only 3 replicates, but it is not a<br />
very reliable estimate. For example, suppose the true SD is<br />
1.00. An estimate based on 3 replicates might easily be as<br />
low as 0.52 or as high as 6.29 (95% confidence). At N=20,<br />
the 95% confidence interval is much narrower: 0.76 to 1.46.<br />
At N=50 it narrows further: 0.84 to 1.24.<br />
95% Confidence Interval for SD: In a sense, this measures<br />
the "precision of the precision". It show how much the SD<br />
might vary if the precision experiment was repeated with<br />
different experimental results. The width of the confidence<br />
interval depends on two factors: N and the intrinsic SD of the<br />
system. The reliability of the precision estimate improves as<br />
N increases.<br />
Outlier: A result so far from the others as to arouse<br />
suspicion that it was generated by a different mechanism.<br />
Some common causes: typing a number with the decimal<br />
point in the wrong place, analyzing the wrong sample, or<br />
entering incorrect specimen identification.<br />
An outlier can have a drastic effect on the calculated mean<br />
and SD. For example:<br />
• Start with 10 results, five 1's and five 2's. The mean is<br />
1.5 and the SD is 0.53<br />
• Change the first 1 to 10. The SD increases from 0.53 to<br />
2.72. The mean changes from 1.5 to 2.4<br />
The best way to deal with an outlier is to (manually)<br />
determine its cause and correct it. Another option is to use a<br />
statistical procedure, like the one described below, to<br />
remove outliers automatically.<br />
Outlier Identification<br />
EP Evaluator identifies outliers using Tukey's method, a<br />
nonparametric procedure that is (relatively) unaffected by the<br />
outlier it is trying to detect:<br />
• Arrange the results in increasing order, and determine<br />
the 25th and 75th percentiles (P25 and P75).<br />
• Determine the Interquartile Range (IQR),<br />
IQR = P75 - P25.<br />
• Points greater than P75 + 3 IQR or lower than<br />
P25 - 3 IQR are considered outliers. This is roughly<br />
comparable to mean +/- 5 SD.<br />
Outliers are excluded from precision calculations, and<br />
flagged on the Results Listing. If more than 5% of the results<br />
are outliers, the report is stamped PRELIMINARY.<br />
Allowable Total Error (TEa), and the Error<br />
Budget<br />
TEa states the laboratory's policy for how much error is<br />
medically (or administratively) acceptable. Regulatory<br />
requirements represent an upper limit. Example: the CLIA<br />
limit for Sodium is 4 mmol/L.<br />
Total Error has two major components: Systematic Error<br />
(synonym Bias) and Random Error (synonym Imprecision).<br />
The Error Budget allocates a fraction of the Allowable Total<br />
Error for Systematic Error, and another fraction for Random<br />
Error. Establishing an appropriate Error Budget allows the<br />
Printed: 19 Dec 2008 22:51:12<br />
Page 2