A Study of the Arterial Stiffness Index in Diabetes ... - Vital-Age GmbH
A Study of the Arterial Stiffness Index in Diabetes ... - Vital-Age GmbH
A Study of the Arterial Stiffness Index in Diabetes ... - Vital-Age GmbH

You also want an ePaper? Increase the reach of your titles
YUMPU automatically turns print PDFs into web optimized ePapers that Google loves.
A <strong>Study</strong> <strong>of</strong> <strong>the</strong> <strong>Arterial</strong> <strong>Stiffness</strong> <strong>Index</strong> <strong>in</strong> <strong>Diabetes</strong> Patients:<br />
Trial <strong>of</strong> a New Non-Invasive <strong>Arterial</strong> Hardness Estimation Procedure that Uses an<br />
Oscillometric Method<br />
Third Department <strong>of</strong> Internal Medic<strong>in</strong>e, Tokyo Medical University School <strong>of</strong> Medic<strong>in</strong>e 1 ,<br />
Kyor<strong>in</strong> University School <strong>of</strong> Health Sciences 2 , Department <strong>of</strong> General Medic<strong>in</strong>e, Kyor<strong>in</strong> University School <strong>of</strong><br />
Medic<strong>in</strong>e 3 , Tokyo Metropolitan Toshima Hospital, Department <strong>of</strong> Internal Medic<strong>in</strong>e 4 , National Public Service<br />
personnel mutual Aid Associations Federation Tachikawa Hospital, Health Medic<strong>in</strong>e Center 5<br />
Kazuhiro Hiram<strong>in</strong>e 1 , Takashi Miwa 1 , Keiichiro Harashima 2 , Toshiaki Takeichi 3 , Naoko Iwahashi 1 ,<br />
Rie Kubota 4 , Rokurou Ito 4 , Masao Kanazawa 1 , Yoko Notoya 1 , Hideaki Sato 5 , Hideaki Shimazu 2 ,<br />
Ju<strong>in</strong>chi Hayashi 3 , Toru Hayashi 1<br />
Presented at <strong>the</strong> Japan <strong>Diabetes</strong> Society, May 2002<br />
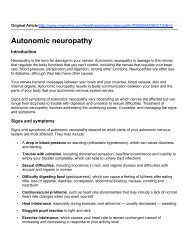
Introduction:<br />
The CardioVision Model MS-2000 (distributed by IMDP Corporation USA) system<br />
applies <strong>the</strong> oscillometric method to measure arterial stiffness, which is quantified by<br />
<strong>the</strong> <strong>Arterial</strong> <strong>Stiffness</strong> <strong>Index</strong> (ASI). Us<strong>in</strong>g this device, we compared arterial stiffness <strong>in</strong><br />
diabetes and non-diabetes patients.<br />
Subjects and Method:<br />
202 outpatients with Type 2 diabetes participated <strong>in</strong> this study. 54 regular medical<br />
checkup patients participated as a control group. ASI measurement was<br />
conducted with <strong>the</strong> subject <strong>in</strong> a sitt<strong>in</strong>g position and rested state and was repeated<br />
for each subject 3 to 5 times.<br />
Result:<br />
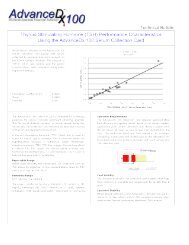
The diabetes patients’ ASI <strong>of</strong> 104 was significantly higher than <strong>the</strong> non-diabetes<br />
patients’ ASI <strong>of</strong> 41. A strong correlation with age, blood pressure, and BMI was also<br />
noted. When we categorized diabetes subjects by general danger factors, those<br />
patients who also had high blood pressure demonstrated a prom<strong>in</strong>ent <strong>in</strong>creased<br />
ASI score.<br />
Observations:<br />
<strong>Diabetes</strong> patients demonstrated significantly <strong>in</strong>creased arterial stiffness. As data<br />
accumulates, we expect that <strong>the</strong> ASI system will emerge as a new non-<strong>in</strong>vasive<br />
standard for measur<strong>in</strong>g arterial stiffness.
Slide 11<br />
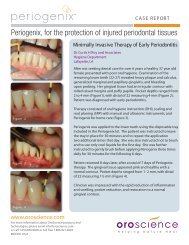
健 常 者 と 糖 尿 病 患 者 のASI<br />
200<br />
160<br />
(∗) P
Slide 12<br />
健 常 者 と 糖 尿 病 患 者 のASI<br />
240<br />
200<br />
160<br />
120<br />
80<br />
40<br />
0<br />
42 55<br />
健 常 者<br />
DM<br />
(∗<br />
)<br />
(∗)P
Slide 15<br />
○1<br />
ASI 正 常 ・ 異 常 群 の 各 指 標<br />
○2<br />
ASI正 常 群<br />
ASI異 常 群<br />
○3<br />
○4<br />
収 縮 期 血 圧<br />
140±22<br />
162±23<br />
P
Slide 1<br />
550<br />
450<br />
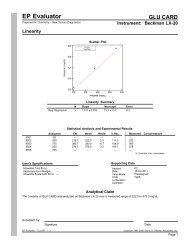
ASIと 各 臨 床 指 標 の 相 関<br />
血 糖<br />
収 縮 期 血 圧<br />
測 定 者 全 員 のデータ<br />
T-cho<br />
550<br />
550<br />
Y = 73.31 + .135 * X; R^2 = .007<br />
Y = -224.898 + 2.192 * X; R^2 = .299<br />
Y = 54.661 + .197 * X; R^2 = .006<br />
450<br />
450<br />
350<br />
350<br />
350<br />
ASI<br />
250<br />
ASI<br />
250<br />
ASI<br />
250<br />
150<br />
150<br />
150<br />
50<br />
50<br />
50<br />
-50<br />
0 50 100 150 200 250 300 350 400 450 500<br />
[mg/dl]<br />
-50<br />
60 80 100 120 140 160 180 200 220 240<br />
[mmHg]<br />
-50<br />
50 100 150 200 250 300 350 400<br />
[mg/dl]<br />
550<br />
HbA1c<br />
Y = 83.531 + 1.531 * X; R^2 = .001<br />
550<br />
拡 張 期 血 圧<br />
Y = 97.9 - .047 * X; R^2 = 3.813E-5<br />
550<br />
LDL-cho<br />
Y = 70.369 + .199 * X; R^2 = .005<br />
450<br />
450<br />
450<br />
350<br />
350<br />
350<br />
ASI<br />
250<br />
ASI<br />
250<br />
ASI<br />
250<br />
150<br />
150<br />
150<br />
50<br />
50<br />
50<br />
-50<br />
2 4 6 8 10 12 14 16 18<br />
-50<br />
20 30 40 50 60 70 80 90 100 110 120 130<br />
-50<br />
0 50 100 150 200 250 300<br />
[%]<br />
[mmHg]<br />
[mg/dl]<br />
○1 ○2 ○3 ○4 ○5<br />
English<br />
○1 Correlation between ASI and each cl<strong>in</strong>ical <strong>in</strong>dex<br />
○2 Blood sugar<br />
○3 Systolic blood pressure<br />
○4 Diastolic blood pressure<br />
○5<br />
Data for all measurement recipients
Slide 2<br />
550<br />
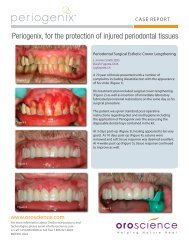
ASIと 各 臨 床 指 標 の 相 関<br />
今 回 使 用 したDM 患 者 のみのデータ<br />
血 糖<br />
収 縮 期 血 圧<br />
T-cho<br />
550<br />
550<br />
Y = 90.542 + .045 * X; R^2 = .001<br />
Y = -226.834 + 2.208 * X; R^2 = .304<br />
Y = 27.411 + .345 * X; R^2 = .017<br />
450<br />
450<br />
450<br />
350<br />
350<br />
350<br />
ASI<br />
250<br />
ASI<br />
250<br />
ASI<br />
250<br />
150<br />
150<br />
150<br />
50<br />
50<br />
50<br />
-50<br />
0 50 100 150 200 250 300 350 400 450 500<br />
[mg/dl]<br />
550<br />
HbA1c<br />
Y = 89.864 + 1.108 * X; R^2 = 3.853E-4<br />
-50<br />
80 100 120 140 160 180 200 220 240<br />
[mmHg]<br />
拡 張 期 血 圧<br />
550<br />
Y = 70.116 + .373 * X; R^2 = .002<br />
-50<br />
50 100 150 200 250 300 350 400<br />
[mg/dl]<br />
LDL-cho<br />
550<br />
Y = 55.526 + .34 * X; R^2 = .014<br />
450<br />
450<br />
450<br />
350<br />
350<br />
350<br />
ASI<br />
250<br />
ASI<br />
250<br />
ASI<br />
250<br />
150<br />
150<br />
150<br />
50<br />
50<br />
50<br />
-50<br />
4 6 8 10 12 14 16 18<br />
[%]<br />
-50<br />
20 30 40 50 60 70 80 90 100 110 120<br />
[mmHg]<br />
-50<br />
0 25 50 75 100 125 150 175 200 225 250<br />
[mg/dl]<br />
○1 ○2 ○3 ○4 ○5<br />
English<br />
○1 Correlation between ASI and each cl<strong>in</strong>ical <strong>in</strong>dex<br />
○2 Blood sugar<br />
○3 Systolic blood pressure<br />
○4 Diastolic blood pressure<br />
○5<br />
The data for DM patients used (<strong>in</strong> this study)