White TSH - New Line Medical
White TSH - New Line Medical
White TSH - New Line Medical

Create successful ePaper yourself
Turn your PDF publications into a flip-book with our unique Google optimized e-Paper software.
EP Evaluator<br />
<strong>New</strong> Century Diagnostics, Inc.<br />
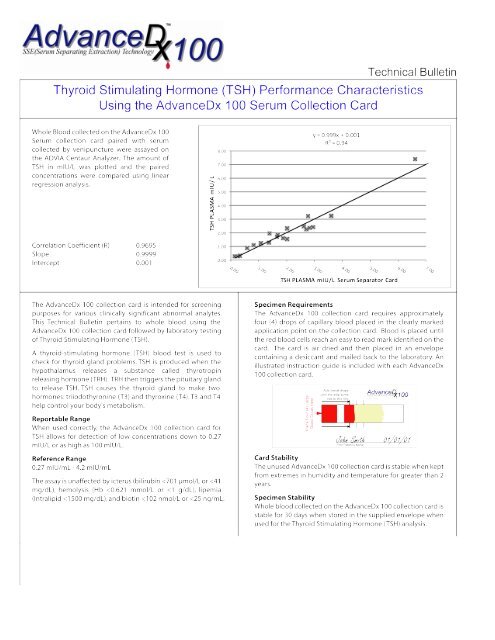
<strong>TSH</strong><br />
Instrument: Centaur<br />
Sample Name: LOW<br />
Simple Precision<br />
Precision Statistics<br />
Mean<br />
0.0982 mIU/L<br />
Standard Deviation (SD) 0.0107<br />
95% Confidence for SD 0.0075 to 0.0187<br />
Coefficient of Variation (CV) 10.9%<br />
95% Confidence for Mean 0.0910 to 0.1053<br />
2 SD Range 0.0768 to 0.1195<br />
Number of Specimens (N) 11 of 11<br />
Number of Outliers --<br />
Precision Plot<br />
Supporting Data<br />
Analyst:<br />
mp<br />
Expt. Date: 26 Nov 2008<br />
Units:<br />
mIU/L<br />
Screen for Outliers? No<br />
Comment:<br />
Precision Data<br />
Index<br />
Results<br />
Index<br />
Results<br />
Index<br />
Results<br />
Index<br />
Results<br />
1 .101<br />
2 .107<br />
3 .106<br />
4 .103<br />
5 .085<br />
6 .100<br />
7 .110<br />
8 .082<br />
9 .109<br />
10 .095<br />
11 .082<br />
Accepted by:<br />
Signature<br />
Date<br />
<strong>TSH</strong> Printed: 19 Dec 2008 22:45:11<br />
Page 1
EP Evaluator<br />
<strong>New</strong> Century Diagnostics, Inc.<br />
Simple Precision<br />
Report Interpretation Guide<br />
CLIA and CAP require periodic verification of Precision. The<br />
Simple Precision experiment is a quick and dirty way to fulfill<br />
the letter of this requirement. The procedure is to make<br />
repeated measurements of a single sample, and compute<br />
simple statistics like mean, SD, and CV. EP Evaluator offers<br />
two additional options:<br />
• Enter a precision goal (Allowable Random Error), and<br />
the program will report that the test "passes" if the<br />
calculated SD does not exceed Allowable Random<br />
Error.<br />
• Automatically identify and remove outliers. (Requires a<br />
minimum of 25 results.)<br />
Definitions<br />
Precision: Ability to obtain the same result upon repeated<br />
measurement of a specimen. Not necessarily the correct result,<br />
just the same result. (Ability to get the correct result is<br />
Accuracy.)<br />
Mean: Average value, computed by adding the results and<br />
dividing the total by the number of results.<br />
Standard Deviation (SD): The primary measure of<br />
dispersion or variation of the individual results about the<br />
mean. In other words, a measure of Precision. For many<br />
analytes, SD varies with sample concentration. Example: For<br />
Glucose, an SD of 10 for a 400 mg/dL sample represents<br />
very good precision. For a 40 mg/dL sample, it is very poor<br />
precision.<br />
Coefficient of Variation (CV): SD expressed as a percent<br />
of the mean. For analytes where error varies with<br />
concentration, CV is more likely to remain constant across<br />
the analytical range. Example: 2.5% CV for Glucose is very<br />
good precision at any concentration.<br />
Within-Run and Total SD: Manufacturers often publish<br />
these statistics in package inserts. They are computed from<br />
a more complex precision experiment that requires replicate<br />
measurements over several days. Total SD from this<br />
complex precision experiment is NOT comparable to EP<br />
Evaluator's Simple Precision SD.<br />
Number of Specimens (N): A good precision study should<br />
include 20-50 replicates. Mathematically, it is possible to<br />
calculate SD and CV from only 3 replicates, but it is not a<br />
very reliable estimate. For example, suppose the true SD is<br />
1.00. An estimate based on 3 replicates might easily be as<br />
low as 0.52 or as high as 6.29 (95% confidence). At N=20,<br />
the 95% confidence interval is much narrower: 0.76 to 1.46.<br />
At N=50 it narrows further: 0.84 to 1.24.<br />
95% Confidence Interval for SD: In a sense, this measures<br />
the "precision of the precision". It show how much the SD<br />
might vary if the precision experiment was repeated with<br />
different experimental results. The width of the confidence<br />
interval depends on two factors: N and the intrinsic SD of the<br />
system. The reliability of the precision estimate improves as<br />
N increases.<br />
Outlier: A result so far from the others as to arouse<br />
suspicion that it was generated by a different mechanism.<br />
Some common causes: typing a number with the decimal<br />
point in the wrong place, analyzing the wrong sample, or<br />
entering incorrect specimen identification.<br />
An outlier can have a drastic effect on the calculated mean<br />
and SD. For example:<br />
• Start with 10 results, five 1's and five 2's. The mean is<br />
1.5 and the SD is 0.53<br />
• Change the first 1 to 10. The SD increases from 0.53 to<br />
2.72. The mean changes from 1.5 to 2.4<br />
The best way to deal with an outlier is to (manually)<br />
determine its cause and correct it. Another option is to use a<br />
statistical procedure, like the one described below, to<br />
remove outliers automatically.<br />
Outlier Identification<br />
EP Evaluator identifies outliers using Tukey's method, a<br />
nonparametric procedure that is (relatively) unaffected by the<br />
outlier it is trying to detect:<br />
• Arrange the results in increasing order, and determine<br />
the 25th and 75th percentiles (P25 and P75).<br />
• Determine the Interquartile Range (IQR),<br />
IQR = P75 - P25.<br />
• Points greater than P75 + 3 IQR or lower than<br />
P25 - 3 IQR are considered outliers. This is roughly<br />
comparable to mean +/- 5 SD.<br />
Outliers are excluded from precision calculations, and<br />
flagged on the Results Listing. If more than 5% of the results<br />
are outliers, the report is stamped PRELIMINARY.<br />
Allowable Total Error (TEa), and the Error<br />
Budget<br />
TEa states the laboratory's policy for how much error is<br />
medically (or administratively) acceptable. Regulatory<br />
requirements represent an upper limit. Example: the CLIA<br />
limit for Sodium is 4 mmol/L.<br />
Total Error has two major components: Systematic Error<br />
(synonym Bias) and Random Error (synonym Imprecision).<br />
The Error Budget allocates a fraction of the Allowable Total<br />
Error for Systematic Error, and another fraction for Random<br />
Error. Establishing an appropriate Error Budget allows the<br />
Printed: 19 Dec 2008 22:45:11<br />
Page 2
EP Evaluator<br />
<strong>New</strong> Century Diagnostics, Inc.<br />
Simple Precision<br />
Report Interpretation Guide<br />
lab to control accuracy and precision separately, with<br />
reasonable confidence that Total Error will also remain in<br />
control. Recommended ranges of values are 25-50% for the<br />
Systematic Error Budget and 16-25% for the Random Error<br />
Budget.<br />
Pass or Fail?<br />
The objective is to determine whether precision is<br />
acceptable, so the standard of comparison is Allowable<br />
Random Error. The test passes if the computed SD does not<br />
exceed Allowable Random Error.<br />
Example: Suppose Allowable Total Error for Sodium is 4<br />
mmol/L, with a Random Error Budget of 25%. Allowable<br />
Random Error is 25% x 4 or 1 mmol/L. The precision test<br />
passes when the computed SD is at or below 1 mmol/L.<br />
Preliminary Report<br />
The word PRELIMINARY printed diagonally across the<br />
report indicates that the data is incomplete, and the report is<br />
not acceptable as a final report. Some or all of the statistics<br />
may be missing. Causes:<br />
• Less than 3 unexcluded results.<br />
• More than 5% of the results are outliers.<br />
Chart Interpretation<br />
Levey-Jennings Chart: A scatter plot of Standard Deviation<br />
Index (SDI) on the Y-axis vs. specimen index on the X-axis.<br />
Specimen index reflects the order in which the results were<br />
typed into the program. SDI = (Result - mean) / SD.<br />
Precision Goal: This chart appears only when Allowable<br />
Random Error is provided. It diagrams the SD and its 95%<br />
confidence interval in relation to allowable random error (the<br />
goal). The wide bar represents the SD. The fence marks<br />
above and below the SD bar show the 95% confidence<br />
limits.<br />
• The report calls the test a "pass" if the SD (top of the<br />
wide bar) does not exceed the goal. The bar is green if<br />
the test passes, or red if it fails.<br />
• If you consider all points within the 95% confidence<br />
interval to be statistically identical, you might consider<br />
the test at least marginally acceptable if the lower<br />
confidence limit does not exceed the goal.<br />
• The ideal situation is when the upper 95% confidence<br />
limit does not exceed the goal.<br />
Printed: 19 Dec 2008 22:45:11<br />
Page 3
EP Evaluator<br />
<strong>New</strong> Century Diagnostics, Inc.<br />
<strong>TSH</strong><br />
Instrument: Centaur<br />
Sample Name: LOW<br />
Alternate Precision<br />
Within<br />
Run<br />
Precision Estimate<br />
User's Concentration: 0.1038<br />
Between<br />
Run<br />
Between<br />
Day<br />
Total<br />
Std. Dev 0.0097 0.0000 0.0000 0.0097<br />
% CV 9.4 0.0 0.0 9.4<br />
df 18 -- -- 29<br />
Precision Plot<br />
Outlier Rejection Criteria<br />
SD<br />
0.0127 (calculated)<br />
Multiplier 5.5<br />
Max difference<br />
between duplicates 0.06985<br />
SD Index<br />
Preliminary estimate of precision<br />
Mean 0.0977<br />
SD 0.0127<br />
CV 13.0%<br />
N 10<br />
Results:<br />
.101 .107 .106 .103 .085<br />
.100 .110 .082 .109 .074<br />
Upper 95% tolerance limit for 95% of user estimates<br />
df for user's<br />
experiment<br />
within run<br />
SD<br />
total<br />
SD<br />
10 0.0131 0.0131<br />
20 0.0122 0.0122<br />
30 0.0117 0.0117<br />
40 0.0115 0.0115<br />
50 0.0113 0.0113<br />
60 0.0112 0.0112<br />
70 0.0111 0.0111<br />
80 0.0110 0.0110<br />
90 0.0109 0.0109<br />
100 0.0108 0.0108<br />
Day Number<br />
This table provides<br />
data for a manufacturer<br />
to include in<br />
published materials<br />
for users.<br />
Supporting Data<br />
Analyst<br />
mp<br />
Analysis Date 17 Jul 2008 to 17 Dec 2008<br />
Days (total/excl) 6 / 0<br />
Runs per Day 1<br />
Reps per Run 4<br />
Critical Value 95%<br />
Reagent BioRAD, Lot 40201<br />
Calibrator<br />
SAME, Lot SAME<br />
Units<br />
mIU/L<br />
Verify Mode Establish Claim<br />
Allowable Total Error --<br />
Random Error Budget --<br />
Allowable Rand Error --<br />
Comment<br />
Accepted by:<br />
Signature<br />
Date<br />
<strong>TSH</strong> Printed: 19 Dec 2008 21:15:17<br />
Page 1
EP Evaluator<br />
<strong>New</strong> Century Diagnostics, Inc.<br />
<strong>TSH</strong><br />
Instrument: Centaur<br />
Sample Name: LOW<br />
Alternate Precision<br />
Experimental Results<br />
Date Run Results Mean SD %CV<br />
1. 17 Jul 2008 1 .107 .103 .110 .087 0.1018 0.0102 10.1%<br />
2. 22 Jul 2008 1 .118 .099 .103 .097 0.1043 0.0095 9.1%<br />
3. 29 Jul 2008 1 .111 .108 .084 .100 0.1008 0.0121 12.0%<br />
4. 31 Jul 2008 1 .109 .094 .095 .110 0.1020 0.0087 8.5%<br />
5. 06 Aug 2008 1 .110 .101 .108 .097 0.1040 0.0061 5.8%<br />
6. 17 Dec 2008 1 .125 .106 .110 .100 0.1102 0.0107 9.7%<br />
'X' indicates an excluded run, 'O' indicates an outlier run, and 'S' indicates a day that does not<br />
have a full complement of results. In all of these cases, the entire day is excluded from the calculations.<br />
<strong>TSH</strong> Printed: 19 Dec 2008 21:15:17<br />
Page 2
EP Evaluator<br />
<strong>New</strong> Century Diagnostics, Inc.<br />
Complex Precision<br />
Report Interpretation Guide<br />
The Complex Precision Module is used in three situations:<br />
• A manufacturer wants a statistically rugged procedure<br />
recognized in the industry to determine precision to be<br />
included in official documents for submission to<br />
regulatory bodies.<br />
• A user wants to determine whether an instrument meets<br />
the manufacturer's claim for precision using a<br />
statistically valid approach.<br />
• A user wants to determine both within-run and total<br />
precision.<br />
Experiment Procedure<br />
• Define the number of replicates per run, runs per day,<br />
and number of days for the experiment. CLSI EP5<br />
recommends 2 replicates per run, 1 or 2 runs per day,<br />
for a minimum of 20 days.<br />
• Collect data for a preliminary run of 8-20 results. The<br />
preliminary run is used to detect outliers. This step is<br />
optional, but strongly recommended. (It is required for<br />
EP5 compliance.)<br />
• Collect data for the full duration of the experiment. The<br />
number of replicates per run and runs per day must be<br />
the same for all days.<br />
Definitions<br />
Precision. Ability to obtain the same result upon repeated<br />
measurement of a specimen.<br />
User's Concentration. Grand mean, computed by adding<br />
the results (across all days, replicates, and runs) and<br />
dividing the total by the number of results.<br />
Claim Concentration. Concentration at which the<br />
manufacturer's SD claims were determined. Laboratorians<br />
often think of precision in terms of CV, which is somewhat<br />
constant across concentrations. However, the statistical<br />
calculations in this module are intended to verify SD. Thus<br />
the sample tested should be at approximately the<br />
manufacturer's claim concentration.<br />
Standard Deviation (SD). SD is the primary measure of<br />
Precision (variation of the individual results about the mean).<br />
The point of the Complex Precision experiment is either 1) to<br />
determine whether the SD meets the manufacturer's claim,<br />
or 2) to compute within-run and total SDs to establish such a<br />
claim.<br />
SD Components: The experimental results are analyzed by<br />
a random-effects Analysis of Variance (ANOVA) procedure<br />
to partition the SD into separate components. The two<br />
components usually cited in precision claims are within-run<br />
and total SD. The intent of the following definition of the<br />
components is to be intuitive. NOT to be mathematically<br />
correct.<br />
• Within-run SD. Measures the "average" SD computed<br />
over replicates that occur within the same run<br />
• Between-run SD. SD computed from the means of the<br />
individual runs.<br />
• Between-day SD. SD computed from the means of the<br />
individual days.<br />
• Total SD. Composite of within-run, between-run, and<br />
between-day SD. NOT the answer you would get if you<br />
computed an ordinary SD on all the data, ignoring<br />
replicate number, day number, and run number.<br />
Claim Value (of SD). Two kinds of claims may be verified:<br />
Manufacturer's claims and <strong>Medical</strong> Requirements. A<br />
manufacturer will typically provide separate values for<br />
within-run and total SD. A medical requirement is for Total<br />
SD only.<br />
Verification Value. You can pass the precision test even if<br />
your measured SD is greater than the claim, as long as the<br />
difference is not statistically significant. The Verification<br />
Value is the largest SD that is not significantly different from<br />
the claim. It varies with sample size -- the larger the sample,<br />
the closer the Verification Value is to the claim value.<br />
The precision test passes if the computed SD does not<br />
exceed the Verification Value.<br />
Critical Value. The confidence level on which the<br />
Verification Value is based. Normally the Critical Value is<br />
95%. This means that the Verification Value is equivalent to<br />
a 95% confidence limit -- the observed SD meets the<br />
manufacturer's claim if its lower 95% confidence limit does<br />
not exceed the claim value.<br />
Coefficient of Variation (CV). SD expressed as a percent<br />
of the mean.<br />
Degrees of Freedom (df). df is like an "effective N" for an<br />
SD component. As df gets larger the confidence limit around<br />
the computed SD narrows, and the verification value gets<br />
closer to the claimed value.<br />
Outlier. A result so far from the others as to arouse<br />
suspicion that it was generated by a different mechanism.<br />
Outlier Rejection<br />
The program first calculates the SD of the preliminary run.<br />
This preliminary SD is multiplied by a user-defined Multiplier<br />
(usually 5.5) to compute the Maximum Acceptable<br />
Difference between Replicates. Any run whose range<br />
exceeds this maximum is declared an outlier, and the entire<br />
Printed: 19 Dec 2008 21:15:17<br />
Page 3
EP Evaluator<br />
<strong>New</strong> Century Diagnostics, Inc.<br />
Complex Precision<br />
Report Interpretation Guide<br />
day is excluded from analysis.<br />
Report Labelling<br />
The Report title is "EP5 Precision" if the experiment meets<br />
all requirements of the CLSI (NCCLS) EP5 guideline.<br />
Specifically:<br />
• Two replicates per run, either one or two runs per day,<br />
for at least 20 days.<br />
• Uses a preliminary run of at least 8 results to establish a<br />
preliminary SD. Excludes a replicate pair if the<br />
difference between the duplicates exceeds 5.5 times<br />
this preliminary SD.<br />
Reports that use other numbers of replicates per run, runs<br />
per day, or duration are labeled "Alternate Precision".<br />
Pass or Fail?<br />
The Complex Precision experiment "passes" as long as<br />
neither the within-run or total SD exceeds its verification<br />
value. However, the experiment might warrent further review<br />
if more than 5% of the runs were rejected as outliers.<br />
Preliminary Report<br />
The word PRELIMINARY printed diagonally across the<br />
report indicates that the data is incomplete, and the report is<br />
not acceptable as a final report. Some or all of the statistics<br />
may be missing. Causes:<br />
• Less than 3 days.<br />
• Less than 6 runs.<br />
References<br />
1. Clinical and Laboratory Standards Institute. Evaluation of<br />
Precision Performance of Clinical Chemistry Devices;<br />
Approved Guideline. NCCLS Document EP5-A (1992). CLSI<br />
Wayne, PA.<br />
Printed: 19 Dec 2008 21:15:17<br />
Page 4
EP Evaluator<br />
<strong>New</strong> Century Diagnostics, Inc.<br />
<strong>TSH</strong><br />
Instrument: Centaur<br />
Sample Name: MED<br />
Simple Precision<br />
Precision Statistics<br />
Mean<br />
0.3197 mIU/L<br />
Standard Deviation (SD) 0.0099<br />
95% Confidence for SD 0.0070 to 0.0168<br />
Coefficient of Variation (CV) 3.1%<br />
95% Confidence for Mean 0.3134 to 0.3260<br />
2 SD Range 0.2999 to 0.3395<br />
Number of Specimens (N) 12 of 12<br />
Number of Outliers --<br />
Precision Plot<br />
Supporting Data<br />
Analyst:<br />
mp<br />
Expt. Date: 19 Dec 2008<br />
Units:<br />
mIU/L<br />
Screen for Outliers? No<br />
Comment:<br />
Precision Data<br />
Index<br />
Results<br />
Index<br />
Results<br />
Index<br />
Results<br />
Index<br />
Results<br />
1 .322<br />
2 .307<br />
3 .313<br />
4 .326<br />
5 .314<br />
6 .343<br />
7 .318<br />
8 .329<br />
9 .308<br />
10 .315<br />
11 .320<br />
12 .321<br />
Accepted by:<br />
Signature<br />
Date<br />
<strong>TSH</strong> Printed: 19 Dec 2008 22:51:12<br />
Page 1
EP Evaluator<br />
<strong>New</strong> Century Diagnostics, Inc.<br />
Simple Precision<br />
Report Interpretation Guide<br />
CLIA and CAP require periodic verification of Precision. The<br />
Simple Precision experiment is a quick and dirty way to fulfill<br />
the letter of this requirement. The procedure is to make<br />
repeated measurements of a single sample, and compute<br />
simple statistics like mean, SD, and CV. EP Evaluator offers<br />
two additional options:<br />
• Enter a precision goal (Allowable Random Error), and<br />
the program will report that the test "passes" if the<br />
calculated SD does not exceed Allowable Random<br />
Error.<br />
• Automatically identify and remove outliers. (Requires a<br />
minimum of 25 results.)<br />
Definitions<br />
Precision: Ability to obtain the same result upon repeated<br />
measurement of a specimen. Not necessarily the correct result,<br />
just the same result. (Ability to get the correct result is<br />
Accuracy.)<br />
Mean: Average value, computed by adding the results and<br />
dividing the total by the number of results.<br />
Standard Deviation (SD): The primary measure of<br />
dispersion or variation of the individual results about the<br />
mean. In other words, a measure of Precision. For many<br />
analytes, SD varies with sample concentration. Example: For<br />
Glucose, an SD of 10 for a 400 mg/dL sample represents<br />
very good precision. For a 40 mg/dL sample, it is very poor<br />
precision.<br />
Coefficient of Variation (CV): SD expressed as a percent<br />
of the mean. For analytes where error varies with<br />
concentration, CV is more likely to remain constant across<br />
the analytical range. Example: 2.5% CV for Glucose is very<br />
good precision at any concentration.<br />
Within-Run and Total SD: Manufacturers often publish<br />
these statistics in package inserts. They are computed from<br />
a more complex precision experiment that requires replicate<br />
measurements over several days. Total SD from this<br />
complex precision experiment is NOT comparable to EP<br />
Evaluator's Simple Precision SD.<br />
Number of Specimens (N): A good precision study should<br />
include 20-50 replicates. Mathematically, it is possible to<br />
calculate SD and CV from only 3 replicates, but it is not a<br />
very reliable estimate. For example, suppose the true SD is<br />
1.00. An estimate based on 3 replicates might easily be as<br />
low as 0.52 or as high as 6.29 (95% confidence). At N=20,<br />
the 95% confidence interval is much narrower: 0.76 to 1.46.<br />
At N=50 it narrows further: 0.84 to 1.24.<br />
95% Confidence Interval for SD: In a sense, this measures<br />
the "precision of the precision". It show how much the SD<br />
might vary if the precision experiment was repeated with<br />
different experimental results. The width of the confidence<br />
interval depends on two factors: N and the intrinsic SD of the<br />
system. The reliability of the precision estimate improves as<br />
N increases.<br />
Outlier: A result so far from the others as to arouse<br />
suspicion that it was generated by a different mechanism.<br />
Some common causes: typing a number with the decimal<br />
point in the wrong place, analyzing the wrong sample, or<br />
entering incorrect specimen identification.<br />
An outlier can have a drastic effect on the calculated mean<br />
and SD. For example:<br />
• Start with 10 results, five 1's and five 2's. The mean is<br />
1.5 and the SD is 0.53<br />
• Change the first 1 to 10. The SD increases from 0.53 to<br />
2.72. The mean changes from 1.5 to 2.4<br />
The best way to deal with an outlier is to (manually)<br />
determine its cause and correct it. Another option is to use a<br />
statistical procedure, like the one described below, to<br />
remove outliers automatically.<br />
Outlier Identification<br />
EP Evaluator identifies outliers using Tukey's method, a<br />
nonparametric procedure that is (relatively) unaffected by the<br />
outlier it is trying to detect:<br />
• Arrange the results in increasing order, and determine<br />
the 25th and 75th percentiles (P25 and P75).<br />
• Determine the Interquartile Range (IQR),<br />
IQR = P75 - P25.<br />
• Points greater than P75 + 3 IQR or lower than<br />
P25 - 3 IQR are considered outliers. This is roughly<br />
comparable to mean +/- 5 SD.<br />
Outliers are excluded from precision calculations, and<br />
flagged on the Results Listing. If more than 5% of the results<br />
are outliers, the report is stamped PRELIMINARY.<br />
Allowable Total Error (TEa), and the Error<br />
Budget<br />
TEa states the laboratory's policy for how much error is<br />
medically (or administratively) acceptable. Regulatory<br />
requirements represent an upper limit. Example: the CLIA<br />
limit for Sodium is 4 mmol/L.<br />
Total Error has two major components: Systematic Error<br />
(synonym Bias) and Random Error (synonym Imprecision).<br />
The Error Budget allocates a fraction of the Allowable Total<br />
Error for Systematic Error, and another fraction for Random<br />
Error. Establishing an appropriate Error Budget allows the<br />
Printed: 19 Dec 2008 22:51:12<br />
Page 2
EP Evaluator<br />
<strong>New</strong> Century Diagnostics, Inc.<br />
Simple Precision<br />
Report Interpretation Guide<br />
lab to control accuracy and precision separately, with<br />
reasonable confidence that Total Error will also remain in<br />
control. Recommended ranges of values are 25-50% for the<br />
Systematic Error Budget and 16-25% for the Random Error<br />
Budget.<br />
Pass or Fail?<br />
The objective is to determine whether precision is<br />
acceptable, so the standard of comparison is Allowable<br />
Random Error. The test passes if the computed SD does not<br />
exceed Allowable Random Error.<br />
Example: Suppose Allowable Total Error for Sodium is 4<br />
mmol/L, with a Random Error Budget of 25%. Allowable<br />
Random Error is 25% x 4 or 1 mmol/L. The precision test<br />
passes when the computed SD is at or below 1 mmol/L.<br />
Preliminary Report<br />
The word PRELIMINARY printed diagonally across the<br />
report indicates that the data is incomplete, and the report is<br />
not acceptable as a final report. Some or all of the statistics<br />
may be missing. Causes:<br />
• Less than 3 unexcluded results.<br />
• More than 5% of the results are outliers.<br />
Chart Interpretation<br />
Levey-Jennings Chart: A scatter plot of Standard Deviation<br />
Index (SDI) on the Y-axis vs. specimen index on the X-axis.<br />
Specimen index reflects the order in which the results were<br />
typed into the program. SDI = (Result - mean) / SD.<br />
Precision Goal: This chart appears only when Allowable<br />
Random Error is provided. It diagrams the SD and its 95%<br />
confidence interval in relation to allowable random error (the<br />
goal). The wide bar represents the SD. The fence marks<br />
above and below the SD bar show the 95% confidence<br />
limits.<br />
• The report calls the test a "pass" if the SD (top of the<br />
wide bar) does not exceed the goal. The bar is green if<br />
the test passes, or red if it fails.<br />
• If you consider all points within the 95% confidence<br />
interval to be statistically identical, you might consider<br />
the test at least marginally acceptable if the lower<br />
confidence limit does not exceed the goal.<br />
• The ideal situation is when the upper 95% confidence<br />
limit does not exceed the goal.<br />
Printed: 19 Dec 2008 22:51:12<br />
Page 3
EP Evaluator<br />
<strong>New</strong> Century Diagnostics, Inc.<br />
<strong>TSH</strong><br />
Instrument: Centaur<br />
Sample Name: MED<br />
Alternate Precision<br />
Within<br />
Run<br />
Precision Estimate<br />
User's Concentration: 0.3719<br />
Between<br />
Run<br />
Between<br />
Day<br />
Total<br />
Std. Dev 0.0224 0.0000 0.0202 0.0302<br />
% CV 6.0 0.0 5.4 8.1<br />
df 18 -- -- 13<br />
Precision Plot<br />
Outlier Rejection Criteria<br />
SD<br />
0.0328 (calculated)<br />
Multiplier 5.5<br />
Max difference<br />
between duplicates 0.1804<br />
SD Index<br />
Preliminary estimate of precision<br />
Mean 0.3681<br />
SD 0.0328<br />
CV 8.9%<br />
N 12<br />
Results:<br />
.334 .393 .352 .359 .357<br />
.332 .365 .333 .416 .347<br />
.416 .413<br />
Upper 95% tolerance limit for 95% of user estimates<br />
df for user's<br />
experiment<br />
within run<br />
SD<br />
total<br />
SD<br />
10 0.0303 0.0407<br />
20 0.0280 0.0377<br />
30 0.0269 0.0362<br />
40 0.0265 0.0356<br />
50 0.0260 0.0350<br />
60 0.0258 0.0347<br />
70 0.0256 0.0344<br />
80 0.0253 0.0341<br />
90 0.0251 0.0338<br />
100 0.0249 0.0335<br />
Day Number<br />
This table provides<br />
data for a manufacturer<br />
to include in<br />
published materials<br />
for users.<br />
Supporting Data<br />
Analyst<br />
mp<br />
Analysis Date 22 Jul 2008 to 17 Dec 2008<br />
Days (total/excl) 6 / 0<br />
Runs per Day 1<br />
Reps per Run 4<br />
Critical Value 95%<br />
Reagent BioRAD, Lot 40202<br />
Calibrator<br />
SAME, Lot SAME<br />
Units<br />
mIU/L<br />
Verify Mode Establish Claim<br />
Allowable Total Error --<br />
Random Error Budget --<br />
Allowable Rand Error --<br />
Comment<br />
Accepted by:<br />
Signature<br />
Date<br />
<strong>TSH</strong> Printed: 19 Dec 2008 21:37:54<br />
Page 1
EP Evaluator<br />
<strong>New</strong> Century Diagnostics, Inc.<br />
<strong>TSH</strong><br />
Instrument: Centaur<br />
Sample Name: MED<br />
Alternate Precision<br />
Experimental Results<br />
Date Run Results Mean SD %CV<br />
1. 22 Jul 2008 1 .332 .359 .359 .352 0.3505 0.0128 3.6%<br />
2. 29 Jul 2008 1 .336 .391 .348 .355 0.3575 0.0237 6.6%<br />
3. 31 Jul 2008 1 .374 .341 .421 .400 0.3840 0.0345 9.0%<br />
4. 06 Aug 2008 1 .340 .363 .317 .382 0.3505 0.0282 8.0%<br />
5. 10 Oct 2008 1 .382 .393 .389 .358 0.3805 0.0157 4.1%<br />
6. 17 Dec 2008 1 .416 .413 .398 .406 0.4083 0.0080 2.0%<br />
'X' indicates an excluded run, 'O' indicates an outlier run, and 'S' indicates a day that does not<br />
have a full complement of results. In all of these cases, the entire day is excluded from the calculations.<br />
<strong>TSH</strong> Printed: 19 Dec 2008 21:37:54<br />
Page 2
EP Evaluator<br />
<strong>New</strong> Century Diagnostics, Inc.<br />
Complex Precision<br />
Report Interpretation Guide<br />
The Complex Precision Module is used in three situations:<br />
• A manufacturer wants a statistically rugged procedure<br />
recognized in the industry to determine precision to be<br />
included in official documents for submission to<br />
regulatory bodies.<br />
• A user wants to determine whether an instrument meets<br />
the manufacturer's claim for precision using a<br />
statistically valid approach.<br />
• A user wants to determine both within-run and total<br />
precision.<br />
Experiment Procedure<br />
• Define the number of replicates per run, runs per day,<br />
and number of days for the experiment. CLSI EP5<br />
recommends 2 replicates per run, 1 or 2 runs per day,<br />
for a minimum of 20 days.<br />
• Collect data for a preliminary run of 8-20 results. The<br />
preliminary run is used to detect outliers. This step is<br />
optional, but strongly recommended. (It is required for<br />
EP5 compliance.)<br />
• Collect data for the full duration of the experiment. The<br />
number of replicates per run and runs per day must be<br />
the same for all days.<br />
Definitions<br />
Precision. Ability to obtain the same result upon repeated<br />
measurement of a specimen.<br />
User's Concentration. Grand mean, computed by adding<br />
the results (across all days, replicates, and runs) and<br />
dividing the total by the number of results.<br />
Claim Concentration. Concentration at which the<br />
manufacturer's SD claims were determined. Laboratorians<br />
often think of precision in terms of CV, which is somewhat<br />
constant across concentrations. However, the statistical<br />
calculations in this module are intended to verify SD. Thus<br />
the sample tested should be at approximately the<br />
manufacturer's claim concentration.<br />
Standard Deviation (SD). SD is the primary measure of<br />
Precision (variation of the individual results about the mean).<br />
The point of the Complex Precision experiment is either 1) to<br />
determine whether the SD meets the manufacturer's claim,<br />
or 2) to compute within-run and total SDs to establish such a<br />
claim.<br />
SD Components: The experimental results are analyzed by<br />
a random-effects Analysis of Variance (ANOVA) procedure<br />
to partition the SD into separate components. The two<br />
components usually cited in precision claims are within-run<br />
and total SD. The intent of the following definition of the<br />
components is to be intuitive. NOT to be mathematically<br />
correct.<br />
• Within-run SD. Measures the "average" SD computed<br />
over replicates that occur within the same run<br />
• Between-run SD. SD computed from the means of the<br />
individual runs.<br />
• Between-day SD. SD computed from the means of the<br />
individual days.<br />
• Total SD. Composite of within-run, between-run, and<br />
between-day SD. NOT the answer you would get if you<br />
computed an ordinary SD on all the data, ignoring<br />
replicate number, day number, and run number.<br />
Claim Value (of SD). Two kinds of claims may be verified:<br />
Manufacturer's claims and <strong>Medical</strong> Requirements. A<br />
manufacturer will typically provide separate values for<br />
within-run and total SD. A medical requirement is for Total<br />
SD only.<br />
Verification Value. You can pass the precision test even if<br />
your measured SD is greater than the claim, as long as the<br />
difference is not statistically significant. The Verification<br />
Value is the largest SD that is not significantly different from<br />
the claim. It varies with sample size -- the larger the sample,<br />
the closer the Verification Value is to the claim value.<br />
The precision test passes if the computed SD does not<br />
exceed the Verification Value.<br />
Critical Value. The confidence level on which the<br />
Verification Value is based. Normally the Critical Value is<br />
95%. This means that the Verification Value is equivalent to<br />
a 95% confidence limit -- the observed SD meets the<br />
manufacturer's claim if its lower 95% confidence limit does<br />
not exceed the claim value.<br />
Coefficient of Variation (CV). SD expressed as a percent<br />
of the mean.<br />
Degrees of Freedom (df). df is like an "effective N" for an<br />
SD component. As df gets larger the confidence limit around<br />
the computed SD narrows, and the verification value gets<br />
closer to the claimed value.<br />
Outlier. A result so far from the others as to arouse<br />
suspicion that it was generated by a different mechanism.<br />
Outlier Rejection<br />
The program first calculates the SD of the preliminary run.<br />
This preliminary SD is multiplied by a user-defined Multiplier<br />
(usually 5.5) to compute the Maximum Acceptable<br />
Difference between Replicates. Any run whose range<br />
exceeds this maximum is declared an outlier, and the entire<br />
Printed: 19 Dec 2008 21:37:54<br />
Page 3
EP Evaluator<br />
<strong>New</strong> Century Diagnostics, Inc.<br />
Complex Precision<br />
Report Interpretation Guide<br />
day is excluded from analysis.<br />
Report Labelling<br />
The Report title is "EP5 Precision" if the experiment meets<br />
all requirements of the CLSI (NCCLS) EP5 guideline.<br />
Specifically:<br />
• Two replicates per run, either one or two runs per day,<br />
for at least 20 days.<br />
• Uses a preliminary run of at least 8 results to establish a<br />
preliminary SD. Excludes a replicate pair if the<br />
difference between the duplicates exceeds 5.5 times<br />
this preliminary SD.<br />
Reports that use other numbers of replicates per run, runs<br />
per day, or duration are labeled "Alternate Precision".<br />
Pass or Fail?<br />
The Complex Precision experiment "passes" as long as<br />
neither the within-run or total SD exceeds its verification<br />
value. However, the experiment might warrent further review<br />
if more than 5% of the runs were rejected as outliers.<br />
Preliminary Report<br />
The word PRELIMINARY printed diagonally across the<br />
report indicates that the data is incomplete, and the report is<br />
not acceptable as a final report. Some or all of the statistics<br />
may be missing. Causes:<br />
• Less than 3 days.<br />
• Less than 6 runs.<br />
References<br />
1. Clinical and Laboratory Standards Institute. Evaluation of<br />
Precision Performance of Clinical Chemistry Devices;<br />
Approved Guideline. NCCLS Document EP5-A (1992). CLSI<br />
Wayne, PA.<br />
Printed: 19 Dec 2008 21:37:54<br />
Page 4
EP Evaluator<br />
<strong>New</strong> Century Diagnostics, Inc.<br />
<strong>TSH</strong><br />
Instrument: Centaur<br />
Sample Name: High<br />
Simple Precision<br />
Precision Statistics<br />
Mean<br />
1.5966 mIU/L<br />
Standard Deviation (SD) 0.1036<br />
95% Confidence for SD 0.0734 to 0.1758<br />
Coefficient of Variation (CV) 6.5%<br />
95% Confidence for Mean 1.5308 to 1.6624<br />
2 SD Range 1.3895 to 1.8037<br />
Number of Specimens (N) 12 of 12<br />
Number of Outliers --<br />
Precision Plot<br />
Supporting Data<br />
Analyst:<br />
mp<br />
Expt. Date: 26 Nov 2008<br />
Units:<br />
mIU/L<br />
Screen for Outliers? No<br />
Comment:<br />
Precision Data<br />
Index<br />
Results<br />
Index<br />
Results<br />
Index<br />
Results<br />
Index<br />
Results<br />
1 1.569<br />
2 1.695<br />
3 1.536<br />
4 1.543<br />
5 1.506<br />
6 1.735<br />
7 1.728<br />
8 1.460<br />
9 1.582<br />
10 1.753<br />
11 1.487<br />
12 1.565<br />
Accepted by:<br />
Signature<br />
Date<br />
<strong>TSH</strong> Printed: 19 Dec 2008 23:05:39<br />
Page 1
EP Evaluator<br />
<strong>New</strong> Century Diagnostics, Inc.<br />
Simple Precision<br />
Report Interpretation Guide<br />
CLIA and CAP require periodic verification of Precision. The<br />
Simple Precision experiment is a quick and dirty way to fulfill<br />
the letter of this requirement. The procedure is to make<br />
repeated measurements of a single sample, and compute<br />
simple statistics like mean, SD, and CV. EP Evaluator offers<br />
two additional options:<br />
• Enter a precision goal (Allowable Random Error), and<br />
the program will report that the test "passes" if the<br />
calculated SD does not exceed Allowable Random<br />
Error.<br />
• Automatically identify and remove outliers. (Requires a<br />
minimum of 25 results.)<br />
Definitions<br />
Precision: Ability to obtain the same result upon repeated<br />
measurement of a specimen. Not necessarily the correct result,<br />
just the same result. (Ability to get the correct result is<br />
Accuracy.)<br />
Mean: Average value, computed by adding the results and<br />
dividing the total by the number of results.<br />
Standard Deviation (SD): The primary measure of<br />
dispersion or variation of the individual results about the<br />
mean. In other words, a measure of Precision. For many<br />
analytes, SD varies with sample concentration. Example: For<br />
Glucose, an SD of 10 for a 400 mg/dL sample represents<br />
very good precision. For a 40 mg/dL sample, it is very poor<br />
precision.<br />
Coefficient of Variation (CV): SD expressed as a percent<br />
of the mean. For analytes where error varies with<br />
concentration, CV is more likely to remain constant across<br />
the analytical range. Example: 2.5% CV for Glucose is very<br />
good precision at any concentration.<br />
Within-Run and Total SD: Manufacturers often publish<br />
these statistics in package inserts. They are computed from<br />
a more complex precision experiment that requires replicate<br />
measurements over several days. Total SD from this<br />
complex precision experiment is NOT comparable to EP<br />
Evaluator's Simple Precision SD.<br />
Number of Specimens (N): A good precision study should<br />
include 20-50 replicates. Mathematically, it is possible to<br />
calculate SD and CV from only 3 replicates, but it is not a<br />
very reliable estimate. For example, suppose the true SD is<br />
1.00. An estimate based on 3 replicates might easily be as<br />
low as 0.52 or as high as 6.29 (95% confidence). At N=20,<br />
the 95% confidence interval is much narrower: 0.76 to 1.46.<br />
At N=50 it narrows further: 0.84 to 1.24.<br />
95% Confidence Interval for SD: In a sense, this measures<br />
the "precision of the precision". It show how much the SD<br />
might vary if the precision experiment was repeated with<br />
different experimental results. The width of the confidence<br />
interval depends on two factors: N and the intrinsic SD of the<br />
system. The reliability of the precision estimate improves as<br />
N increases.<br />
Outlier: A result so far from the others as to arouse<br />
suspicion that it was generated by a different mechanism.<br />
Some common causes: typing a number with the decimal<br />
point in the wrong place, analyzing the wrong sample, or<br />
entering incorrect specimen identification.<br />
An outlier can have a drastic effect on the calculated mean<br />
and SD. For example:<br />
• Start with 10 results, five 1's and five 2's. The mean is<br />
1.5 and the SD is 0.53<br />
• Change the first 1 to 10. The SD increases from 0.53 to<br />
2.72. The mean changes from 1.5 to 2.4<br />
The best way to deal with an outlier is to (manually)<br />
determine its cause and correct it. Another option is to use a<br />
statistical procedure, like the one described below, to<br />
remove outliers automatically.<br />
Outlier Identification<br />
EP Evaluator identifies outliers using Tukey's method, a<br />
nonparametric procedure that is (relatively) unaffected by the<br />
outlier it is trying to detect:<br />
• Arrange the results in increasing order, and determine<br />
the 25th and 75th percentiles (P25 and P75).<br />
• Determine the Interquartile Range (IQR),<br />
IQR = P75 - P25.<br />
• Points greater than P75 + 3 IQR or lower than<br />
P25 - 3 IQR are considered outliers. This is roughly<br />
comparable to mean +/- 5 SD.<br />
Outliers are excluded from precision calculations, and<br />
flagged on the Results Listing. If more than 5% of the results<br />
are outliers, the report is stamped PRELIMINARY.<br />
Allowable Total Error (TEa), and the Error<br />
Budget<br />
TEa states the laboratory's policy for how much error is<br />
medically (or administratively) acceptable. Regulatory<br />
requirements represent an upper limit. Example: the CLIA<br />
limit for Sodium is 4 mmol/L.<br />
Total Error has two major components: Systematic Error<br />
(synonym Bias) and Random Error (synonym Imprecision).<br />
The Error Budget allocates a fraction of the Allowable Total<br />
Error for Systematic Error, and another fraction for Random<br />
Error. Establishing an appropriate Error Budget allows the<br />
Printed: 19 Dec 2008 23:05:39<br />
Page 2
EP Evaluator<br />
<strong>New</strong> Century Diagnostics, Inc.<br />
Simple Precision<br />
Report Interpretation Guide<br />
lab to control accuracy and precision separately, with<br />
reasonable confidence that Total Error will also remain in<br />
control. Recommended ranges of values are 25-50% for the<br />
Systematic Error Budget and 16-25% for the Random Error<br />
Budget.<br />
Pass or Fail?<br />
The objective is to determine whether precision is<br />
acceptable, so the standard of comparison is Allowable<br />
Random Error. The test passes if the computed SD does not<br />
exceed Allowable Random Error.<br />
Example: Suppose Allowable Total Error for Sodium is 4<br />
mmol/L, with a Random Error Budget of 25%. Allowable<br />
Random Error is 25% x 4 or 1 mmol/L. The precision test<br />
passes when the computed SD is at or below 1 mmol/L.<br />
Preliminary Report<br />
The word PRELIMINARY printed diagonally across the<br />
report indicates that the data is incomplete, and the report is<br />
not acceptable as a final report. Some or all of the statistics<br />
may be missing. Causes:<br />
• Less than 3 unexcluded results.<br />
• More than 5% of the results are outliers.<br />
Chart Interpretation<br />
Levey-Jennings Chart: A scatter plot of Standard Deviation<br />
Index (SDI) on the Y-axis vs. specimen index on the X-axis.<br />
Specimen index reflects the order in which the results were<br />
typed into the program. SDI = (Result - mean) / SD.<br />
Precision Goal: This chart appears only when Allowable<br />
Random Error is provided. It diagrams the SD and its 95%<br />
confidence interval in relation to allowable random error (the<br />
goal). The wide bar represents the SD. The fence marks<br />
above and below the SD bar show the 95% confidence<br />
limits.<br />
• The report calls the test a "pass" if the SD (top of the<br />
wide bar) does not exceed the goal. The bar is green if<br />
the test passes, or red if it fails.<br />
• If you consider all points within the 95% confidence<br />
interval to be statistically identical, you might consider<br />
the test at least marginally acceptable if the lower<br />
confidence limit does not exceed the goal.<br />
• The ideal situation is when the upper 95% confidence<br />
limit does not exceed the goal.<br />
Printed: 19 Dec 2008 23:05:39<br />
Page 3
EP Evaluator<br />
<strong>New</strong> Century Diagnostics, Inc.<br />
<strong>TSH</strong><br />
Instrument: Centaur<br />
Sample Name: HIGH<br />
Alternate Precision<br />
Within<br />
Run<br />
Precision Estimate<br />
User's Concentration: 1.7466<br />
Between<br />
Run<br />
Between<br />
Day<br />
Total<br />
Std. Dev 0.1203 0.0000 0.1203 0.1701<br />
% CV 6.9 0.0 6.9 9.7<br />
df 18 -- -- 12<br />
Precision Plot<br />
Outlier Rejection Criteria<br />
SD<br />
0.1139 (calculated)<br />
Multiplier 5.5<br />
Max difference<br />
between duplicates 0.62645<br />
SD Index<br />
Preliminary estimate of precision<br />
Mean 1.5954<br />
SD 0.1139<br />
CV 7.1%<br />
N 9<br />
Results:<br />
1.543 1.506 1.735 1.728 1.460<br />
1.582 1.753 1.487 1.565<br />
Upper 95% tolerance limit for 95% of user estimates<br />
df for user's<br />
experiment<br />
within run<br />
SD<br />
total<br />
SD<br />
10 0.1624 0.2296<br />
20 0.1503 0.2126<br />
30 0.1443 0.2041<br />
40 0.1419 0.2007<br />
50 0.1395 0.1973<br />
60 0.1383 0.1956<br />
70 0.1371 0.1939<br />
80 0.1359 0.1922<br />
90 0.1347 0.1905<br />
100 0.1335 0.1888<br />
Day Number<br />
This table provides<br />
data for a manufacturer<br />
to include in<br />
published materials<br />
for users.<br />
Supporting Data<br />
Analyst<br />
mp<br />
Analysis Date 17 Jul 2008 to 10 Oct 2008<br />
Days (total/excl) 6 / 0<br />
Runs per Day 1<br />
Reps per Run 4<br />
Critical Value 95%<br />
Reagent BioRAD, Lot 40203<br />
Calibrator<br />
SAME, Lot SAME<br />
Units<br />
mIU/L<br />
Verify Mode Establish Claim<br />
Allowable Total Error --<br />
Random Error Budget --<br />
Allowable Rand Error --<br />
Comment<br />
Accepted by:<br />
Signature<br />
Date<br />
<strong>TSH</strong> Printed: 19 Dec 2008 21:55:56<br />
Page 1
EP Evaluator<br />
<strong>New</strong> Century Diagnostics, Inc.<br />
<strong>TSH</strong><br />
Instrument: Centaur<br />
Sample Name: HIGH<br />
Alternate Precision<br />
Experimental Results<br />
Date Run Results Mean SD %CV<br />
1. 17 Jul 2008 1 1.664 1.825 1.627 1.695 1.7027 0.0861 5.1%<br />
2. 22 Jul 2008 1 1.62 1.66 1.58 1.58 1.6100 0.0383 2.4%<br />
3. 29 Jul 2008 1 1.83 1.746 1.548 1.838 1.7405 0.1349 7.8%<br />
4. 31 Jul 2008 1 1.504 1.672 1.847 1.698 1.6803 0.1405 8.4%<br />
5. 06 Aug 2008 1 1.726 1.816 1.604 1.830 1.7440 0.1041 6.0%<br />
6. 10 Oct 2008 1 1.751 2.041 2.117 2.100 2.0023 0.1706 8.5%<br />
'X' indicates an excluded run, 'O' indicates an outlier run, and 'S' indicates a day that does not<br />
have a full complement of results. In all of these cases, the entire day is excluded from the calculations.<br />
<strong>TSH</strong> Printed: 19 Dec 2008 21:55:56<br />
Page 2
EP Evaluator<br />
<strong>New</strong> Century Diagnostics, Inc.<br />
Complex Precision<br />
Report Interpretation Guide<br />
The Complex Precision Module is used in three situations:<br />
• A manufacturer wants a statistically rugged procedure<br />
recognized in the industry to determine precision to be<br />
included in official documents for submission to<br />
regulatory bodies.<br />
• A user wants to determine whether an instrument meets<br />
the manufacturer's claim for precision using a<br />
statistically valid approach.<br />
• A user wants to determine both within-run and total<br />
precision.<br />
Experiment Procedure<br />
• Define the number of replicates per run, runs per day,<br />
and number of days for the experiment. CLSI EP5<br />
recommends 2 replicates per run, 1 or 2 runs per day,<br />
for a minimum of 20 days.<br />
• Collect data for a preliminary run of 8-20 results. The<br />
preliminary run is used to detect outliers. This step is<br />
optional, but strongly recommended. (It is required for<br />
EP5 compliance.)<br />
• Collect data for the full duration of the experiment. The<br />
number of replicates per run and runs per day must be<br />
the same for all days.<br />
Definitions<br />
Precision. Ability to obtain the same result upon repeated<br />
measurement of a specimen.<br />
User's Concentration. Grand mean, computed by adding<br />
the results (across all days, replicates, and runs) and<br />
dividing the total by the number of results.<br />
Claim Concentration. Concentration at which the<br />
manufacturer's SD claims were determined. Laboratorians<br />
often think of precision in terms of CV, which is somewhat<br />
constant across concentrations. However, the statistical<br />
calculations in this module are intended to verify SD. Thus<br />
the sample tested should be at approximately the<br />
manufacturer's claim concentration.<br />
Standard Deviation (SD). SD is the primary measure of<br />
Precision (variation of the individual results about the mean).<br />
The point of the Complex Precision experiment is either 1) to<br />
determine whether the SD meets the manufacturer's claim,<br />
or 2) to compute within-run and total SDs to establish such a<br />
claim.<br />
SD Components: The experimental results are analyzed by<br />
a random-effects Analysis of Variance (ANOVA) procedure<br />
to partition the SD into separate components. The two<br />
components usually cited in precision claims are within-run<br />
and total SD. The intent of the following definition of the<br />
components is to be intuitive. NOT to be mathematically<br />
correct.<br />
• Within-run SD. Measures the "average" SD computed<br />
over replicates that occur within the same run<br />
• Between-run SD. SD computed from the means of the<br />
individual runs.<br />
• Between-day SD. SD computed from the means of the<br />
individual days.<br />
• Total SD. Composite of within-run, between-run, and<br />
between-day SD. NOT the answer you would get if you<br />
computed an ordinary SD on all the data, ignoring<br />
replicate number, day number, and run number.<br />
Claim Value (of SD). Two kinds of claims may be verified:<br />
Manufacturer's claims and <strong>Medical</strong> Requirements. A<br />
manufacturer will typically provide separate values for<br />
within-run and total SD. A medical requirement is for Total<br />
SD only.<br />
Verification Value. You can pass the precision test even if<br />
your measured SD is greater than the claim, as long as the<br />
difference is not statistically significant. The Verification<br />
Value is the largest SD that is not significantly different from<br />
the claim. It varies with sample size -- the larger the sample,<br />
the closer the Verification Value is to the claim value.<br />
The precision test passes if the computed SD does not<br />
exceed the Verification Value.<br />
Critical Value. The confidence level on which the<br />
Verification Value is based. Normally the Critical Value is<br />
95%. This means that the Verification Value is equivalent to<br />
a 95% confidence limit -- the observed SD meets the<br />
manufacturer's claim if its lower 95% confidence limit does<br />
not exceed the claim value.<br />
Coefficient of Variation (CV). SD expressed as a percent<br />
of the mean.<br />
Degrees of Freedom (df). df is like an "effective N" for an<br />
SD component. As df gets larger the confidence limit around<br />
the computed SD narrows, and the verification value gets<br />
closer to the claimed value.<br />
Outlier. A result so far from the others as to arouse<br />
suspicion that it was generated by a different mechanism.<br />
Outlier Rejection<br />
The program first calculates the SD of the preliminary run.<br />
This preliminary SD is multiplied by a user-defined Multiplier<br />
(usually 5.5) to compute the Maximum Acceptable<br />
Difference between Replicates. Any run whose range<br />
exceeds this maximum is declared an outlier, and the entire<br />
Printed: 19 Dec 2008 21:55:56<br />
Page 3
EP Evaluator<br />
<strong>New</strong> Century Diagnostics, Inc.<br />
Complex Precision<br />
Report Interpretation Guide<br />
day is excluded from analysis.<br />
Report Labelling<br />
The Report title is "EP5 Precision" if the experiment meets<br />
all requirements of the CLSI (NCCLS) EP5 guideline.<br />
Specifically:<br />
• Two replicates per run, either one or two runs per day,<br />
for at least 20 days.<br />
• Uses a preliminary run of at least 8 results to establish a<br />
preliminary SD. Excludes a replicate pair if the<br />
difference between the duplicates exceeds 5.5 times<br />
this preliminary SD.<br />
Reports that use other numbers of replicates per run, runs<br />
per day, or duration are labeled "Alternate Precision".<br />
Pass or Fail?<br />
The Complex Precision experiment "passes" as long as<br />
neither the within-run or total SD exceeds its verification<br />
value. However, the experiment might warrent further review<br />
if more than 5% of the runs were rejected as outliers.<br />
Preliminary Report<br />
The word PRELIMINARY printed diagonally across the<br />
report indicates that the data is incomplete, and the report is<br />
not acceptable as a final report. Some or all of the statistics<br />
may be missing. Causes:<br />
• Less than 3 days.<br />
• Less than 6 runs.<br />
References<br />
1. Clinical and Laboratory Standards Institute. Evaluation of<br />
Precision Performance of Clinical Chemistry Devices;<br />
Approved Guideline. NCCLS Document EP5-A (1992). CLSI<br />
Wayne, PA.<br />
Printed: 19 Dec 2008 21:55:56<br />
Page 4