Appendices - San Francisco Planning Department
Appendices - San Francisco Planning Department
Appendices - San Francisco Planning Department

Create successful ePaper yourself
Turn your PDF publications into a flip-book with our unique Google optimized e-Paper software.
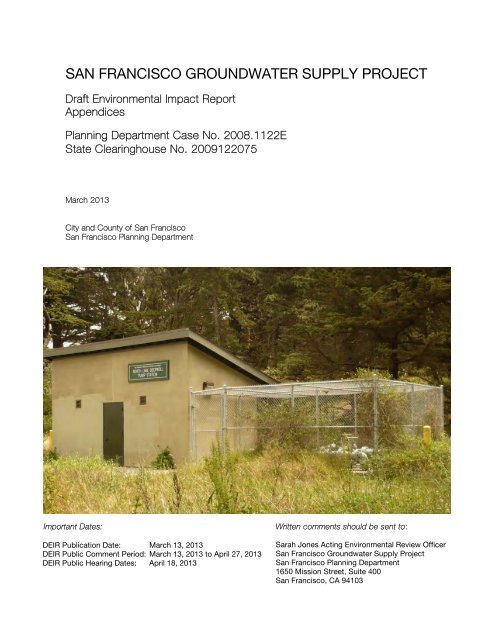
SAN FRANCISCO GROUNDWATER SUPPLY PROJECT<br />
Draft Environmental Impact Report<br />
<strong>Appendices</strong><br />
<strong>Planning</strong> <strong>Department</strong> Case No. 2008.1122E<br />
State Clearinghouse No. 2009122075<br />
March 2013<br />
City and County of <strong>San</strong> <strong>Francisco</strong><br />
<strong>San</strong> <strong>Francisco</strong> <strong>Planning</strong> <strong>Department</strong><br />
Important Dates:<br />
DEIR Publication Date: March 13, 2013<br />
DEIR Public Comment Period: March 13, 2013 to April 27, 2013<br />
DEIR Public Hearing Dates: April 18, 2013<br />
Written comments should be sent to:<br />
Sarah Jones Acting Environmental Review Officer<br />
<strong>San</strong> <strong>Francisco</strong> Groundwater Supply Project<br />
<strong>San</strong> <strong>Francisco</strong> <strong>Planning</strong> <strong>Department</strong><br />
1650 Mission Street, Suite 400<br />
<strong>San</strong> <strong>Francisco</strong>, CA 94103
SAN FRANCISCO GROUNDWATER SUPPLY PROJECT<br />
Draft Environmental Impact Report<br />
<strong>Appendices</strong><br />
<strong>Planning</strong> <strong>Department</strong> Case No. 2008.1122E<br />
State Clearinghouse No. 2009122075<br />
March 2013<br />
City and County of <strong>San</strong> <strong>Francisco</strong><br />
<strong>San</strong> <strong>Francisco</strong> <strong>Planning</strong> <strong>Department</strong><br />
Important Dates:<br />
DEIR Publication Date: March 13, 2013<br />
DEIR Public Comment Period: March 13, 2013 to<br />
April 27, 2013<br />
DEIR Public Hearing Dates: April 18, 2013<br />
Written comments should be sent to:<br />
Sarah Jones Acting Environmental Review Officer<br />
<strong>San</strong> <strong>Francisco</strong> Groundwater Supply Project<br />
<strong>San</strong> <strong>Francisco</strong> <strong>Planning</strong> <strong>Department</strong><br />
1650 Mission Street, Suite 400<br />
<strong>San</strong> <strong>Francisco</strong>, CA 94103
TABLE OF CONTENTS<br />
<strong>Appendices</strong><br />
A. Scoping Reports A‐1<br />
A‐1 2009 Scoping Report A.1‐1<br />
A‐2 2011 Scoping Report A.2‐1<br />
B. WSIP PEIR Consistency Analysis and Mitigation Measures, Applicability to the<br />
Proposed Project B‐1<br />
C. Vegetation Change Analysis Methodology C‐1<br />
D. Hydrology and Water Quality Supporting Material D‐1<br />
D‐1 Historic Groundwater Levels D.1‐1<br />
D‐2 Groundwater Quality Data D.2‐1<br />
D‐3 Lake Merced Water Quality Data D.3‐1<br />
D‐4 Lake Merced Water Quality Graphs D.4‐1<br />
D‐5 Task 10.1 Technical Memorandum, Groundwater Modeling Analysis for<br />
the Regional Groundwater Storage and Recovery Project and<br />
<strong>San</strong> <strong>Francisco</strong> Groundwater Supply Project<br />
D.5‐1<br />
D‐6 Task 10.3 Technical Memorandum, Assessment of Potential Seawater<br />
Intrusion for the Regional Groundwater Storage and Recovery Project<br />
and the <strong>San</strong> <strong>Francisco</strong> Groundwater Supply Project<br />
D.6‐1<br />
D‐7 Task 10.2 Technical Memorandum, Assessment of Groundwater‐Surface<br />
Water Interactions for the Regional Groundwater Storage and<br />
Recovery Project and the <strong>San</strong> <strong>Francisco</strong> Groundwater Supply Project D.7‐1<br />
SFPUC <strong>San</strong> <strong>Francisco</strong> Groundwater Supply Project Draft EIR i March 2013<br />
Case No. 2008.1122E
APPENDIX A<br />
Scoping Reports<br />
SFPUC <strong>San</strong> <strong>Francisco</strong> Groundwater Supply Project Draft EIR A‐1 March 2013<br />
Case No. 2008.1122E
Appendix A<br />
Scoping Reports<br />
APPENDIX A‐1<br />
2009 Scoping Report<br />
SFPUC <strong>San</strong> <strong>Francisco</strong> Groundwater Supply Project Draft EIR A.1‐1 March 2013<br />
Case No. 2008.1122E
Appendix A<br />
Scoping Reports<br />
This page intentionally left blank<br />
SFPUC <strong>San</strong> <strong>Francisco</strong> Groundwater Supply Project Draft EIR A.1‐2 March 2013<br />
Case No. 2008.1122E
<strong>San</strong> <strong>Francisco</strong> Public Utilities Commission<br />
<strong>San</strong> <strong>Francisco</strong> Groundwater Supply Project<br />
Environmental Impact Report<br />
Final<br />
Scoping Report<br />
April 2010<br />
Prepared for the <strong>San</strong> <strong>Francisco</strong> <strong>Planning</strong> <strong>Department</strong><br />
Prepared by ESA<br />
A.1-3
This page intentionally left blank<br />
A.1-4
TABLE OF CONTENTS<br />
<strong>San</strong> <strong>Francisco</strong> Public Utilities Commission<br />
<strong>San</strong> <strong>Francisco</strong> Groundwater Supply Project<br />
Environmental Impact Report<br />
Scoping Report<br />
1.0 Introduction and Background....................................................................................1<br />
1.1 Introduction..........................................................................................................1<br />
1.2 Notice of Preparation ...........................................................................................1<br />
1.3 <strong>San</strong> <strong>Francisco</strong> Groundwater Supply Project ........................................................1<br />
2.0. Purpose of the Scoping Process...............................................................................2<br />
3.0 Notification of Scoping...............................................................................................3<br />
4.0 Scoping Meeting .........................................................................................................4<br />
5.0 Overview of Comments Received .............................................................................5<br />
6.0 Summary of Comments by Subject Area..................................................................6<br />
Page<br />
<strong>Appendices</strong><br />
A. Notice of Preparation (NOP) and NOP Notice of Availability .................................... A-1<br />
B. Scoping Meeting Materials........................................................................................ B-1<br />
C. Scoping Meeting Transcripts ....................................................................................C-1<br />
D. Comments Received During EIR Scoping Process ..................................................D-1<br />
List of Tables<br />
1. Number of Recipients on Mailing List for NOP and Notice of Scoping Meeting ............4<br />
2. Index of Written Comments ..........................................................................................5<br />
3. Index of Verbal Comments ...........................................................................................6<br />
4. Summary of Comments by Commenter........................................................................7<br />
<strong>San</strong> <strong>Francisco</strong> Groundwater Supply Project i April 2010<br />
Case No. 2008.1122E<br />
A.1-5
This page intentionally left blank<br />
A.1-6
Scoping Report<br />
1.0 Introduction and Background<br />
1.1 Introduction<br />
The <strong>San</strong> <strong>Francisco</strong> <strong>Planning</strong> <strong>Department</strong> is the lead agency for implementation of California<br />
Environmental Quality Act (CEQA) requirements for all projects sponsored by the City and County<br />
of <strong>San</strong> <strong>Francisco</strong> (CCSF) or conducted within <strong>San</strong> <strong>Francisco</strong>. The <strong>San</strong> <strong>Francisco</strong> <strong>Planning</strong><br />
<strong>Department</strong> is preparing a Draft Environmental Impact Report (EIR) for the <strong>San</strong> <strong>Francisco</strong> Public<br />
Utilities Commission’s (SFPUC’s) proposed <strong>San</strong> <strong>Francisco</strong> Groundwater Supply Project (project or<br />
proposed project). The Draft EIR, which will assess the potential impacts of the project on the<br />
physical environment, is being prepared in accordance with CEQA. CEQA requires the preparation<br />
of an EIR when a proposed project could significantly affect the physical environment.<br />
As part of the Draft EIR process, the <strong>San</strong> <strong>Francisco</strong> <strong>Planning</strong> <strong>Department</strong> conducted a public<br />
scoping effort in January 2010, soliciting comments from interested parties, State and natural<br />
resource agencies, and the public to help determine the scope of the Draft EIR. This report<br />
describes the scoping process and summarizes the public and regulatory agencies’ comments<br />
received during the scoping period.<br />
1.2 Notice of Preparation<br />
The <strong>San</strong> <strong>Francisco</strong> <strong>Planning</strong> <strong>Department</strong> published a Notice of Preparation (NOP) on December<br />
30, 2009, announcing the preparation of the Draft EIR for the project under CEQA. The NOP<br />
summarized the project objectives and provided a description of the proposed project. The NOP<br />
also described the scoping process and included information on the public scoping meeting. The<br />
scoping process, notification procedures, and outcome of the scoping meeting are described<br />
below, following a brief description of the proposed project.<br />
1.3 <strong>San</strong> <strong>Francisco</strong> Groundwater Supply Project<br />
The purpose of the proposed project is to provide an average of four million gallons per day<br />
(mgd) of groundwater to <strong>San</strong> <strong>Francisco</strong>’s municipal water supply. Groundwater would be blended<br />
with <strong>San</strong> <strong>Francisco</strong>’s existing municipal water supply for distribution within <strong>San</strong> <strong>Francisco</strong>. The<br />
groundwater would be pumped from the North Westside Groundwater Basin, which is located<br />
within the larger Westside Groundwater Basin underlying parts of <strong>San</strong> <strong>Francisco</strong> and <strong>San</strong> Mateo<br />
Counties. Facilities required to implement the project, including groundwater production well<br />
facilities, would be located on the western side of the city of <strong>San</strong> <strong>Francisco</strong> on property owned by<br />
the CCSF, and managed by the SFPUC or the <strong>San</strong> <strong>Francisco</strong> Recreation and Park <strong>Department</strong>.<br />
As part of the proposed project, the SFPUC would construct and operate six potable groundwater<br />
production well facilities. Although nine locations are currently under consideration for the<br />
groundwater production well facilities, only six facilities would be constructed—two that would<br />
be converted from existing irrigation well facilities, and four new well facilities. Each well<br />
facility would include a groundwater production well and a pump station. The SFPUC would also<br />
<strong>San</strong> <strong>Francisco</strong> Groundwater Supply Project 1 April 2010<br />
Case No. 2008.1122E<br />
A.1-7
Scoping Report<br />
construct a distribution system (including pipelines and connection points) that would connect<br />
five of the well facilities to Sunset Reservoir; the sixth well would connect to the existing Lake<br />
Merced Pump Station, and would require a short length of distribution piping to make this<br />
connection. The project would be implemented in two phases: (1) construction and operation of<br />
the four new well facilities to supply an annual average of approximately 2.5 mgd of<br />
groundwater, and conversion of two existing irrigation well facilities to potable water well<br />
facilities; and (2) operation of the converted irrigation wells to provide an additional annual<br />
average of approximately 1.5 mgd of groundwater.<br />
The project is a component of the SFPUC’s Water System Improvement Program (WSIP), which<br />
includes facility improvement projects designed to: (1) maintain high-quality water; (2) reduce<br />
vulnerability to earthquakes; (3) increase delivery reliability and improve the ability to maintain<br />
the system; (4) meet customer purchase requests in nondrought and drought periods; (5) enhance<br />
sustainability in all system activities; and (6) achieve a cost-effective, fully operational system.<br />
Implementation of the project, as a component of the WSIP, would contribute to meeting the<br />
overall WSIP goals and objectives, by diversifying water supply options during drought and<br />
non-drought periods and improving the use of new water sources and drought management.<br />
2.0 Purpose of the Scoping Process<br />
The purpose of the scoping process is to solicit input from the public, interested parties, and<br />
agencies with discretionary authority over the project on the appropriate scope, focus, and content<br />
of the Draft EIR. The <strong>San</strong> <strong>Francisco</strong> <strong>Planning</strong> <strong>Department</strong> will consider all of the input received<br />
during the scoping process in the preparation of the Draft EIR.<br />
The Draft EIR will describe the existing environmental conditions of the area that could be<br />
affected by the proposed project and evaluate the potential effects of the project on the<br />
environment in accordance with CEQA. The comments provided by the public and agencies<br />
during scoping will help the <strong>San</strong> <strong>Francisco</strong> <strong>Planning</strong> <strong>Department</strong> identify pertinent issues,<br />
methods of analyses, and level of detail that should be addressed in the Draft EIR. The scoping<br />
comments will also provide the input for development of a reasonable range of feasible<br />
alternatives to be evaluated in the Draft EIR.<br />
The scoping comments will augment the information developed by the EIR project team, which<br />
includes specialists in each of the environmental subject areas covered in the EIR. This combined<br />
input will result in an EIR that is both comprehensive and responsive to issues raised by the<br />
public and regulatory agencies, and that meets CEQA requirements. The Draft EIR is scheduled<br />
to be available for public comment in early 2011.<br />
In addition to facilitating public and regulatory agency input on the scope and focus of the Draft<br />
EIR, scoping allows the <strong>San</strong> <strong>Francisco</strong> <strong>Planning</strong> <strong>Department</strong> to explain the EIR process to the<br />
public and to identify additional opportunities for public comment and public involvement during<br />
the EIR process.<br />
<strong>San</strong> <strong>Francisco</strong> Groundwater Supply Project 2 April 2010<br />
Case No. 2008.1122E<br />
A.1-8
Scoping Report<br />
3.0 Notification of Scoping<br />
The scoping period began on December 30, 2009, with the issuance of the NOP. The <strong>San</strong><br />
<strong>Francisco</strong> <strong>Planning</strong> <strong>Department</strong> held a scoping meeting on January 20, 2010, and accepted written<br />
comments through January 30, 2010. The following methods were used to notify agencies and the<br />
public about the availability of the NOP, the scoping meeting dates and locations, and details on<br />
the comment process:<br />
<br />
<br />
Mailing List. A mailing list was compiled, including approximately 3,700 contacts for<br />
federal, state, regional, and local agencies; federal, state, regional, and local elected<br />
officials; regional and local interest groups; member agencies of the Bay Area Water<br />
Supply and Conservation Agency; other potentially affected water districts; SFPUC<br />
Community Advisory Committee members; information repositories; media contacts; and<br />
property owners and residents 300 feet within the proposed project limits.<br />
Notice of Preparation of an EIR and Notice of Public Scoping Meeting. Copies of the<br />
NOP were distributed via certified mail to responsible and trustee agencies and 15 copies<br />
were delivered to the State Clearinghouse (See Appendix A for a copy of the NOP and<br />
NOP Notice of Availability). In addition, a notice of availability of the NOP was<br />
distributed via first-class mail to the entire mailing list (approximately 3,700 addressees):<br />
- Locations to obtain a copy of the NOP. The NOP was posted to the <strong>San</strong> <strong>Francisco</strong><br />
<strong>Planning</strong> <strong>Department</strong>’s website (http://mea.sfplanning.org). A printed copy of the<br />
NOP was also provided to anyone who requested it from the <strong>San</strong> <strong>Francisco</strong> <strong>Planning</strong><br />
<strong>Department</strong>.<br />
<br />
Meeting Notification. Notice of the scoping meeting was provided to individuals and the<br />
general public through the following means:<br />
- Notice to entire mailing list. Notifications of the scoping meeting, including<br />
information on the project EIR and the scoping process, and instructions on how to<br />
obtain a copy of the NOP and provide public comment were mailed to the entire<br />
project mailing list approximately three weeks prior to the scoping meeting.<br />
- Legal notices. Notices of the scoping meeting and information on how to obtain a<br />
copy of the NOP and provide public comment were placed in the legal classified<br />
section of the <strong>San</strong> <strong>Francisco</strong> Chronicle (12/30/09).<br />
Table 1 presents an itemized list of mailings.<br />
<strong>San</strong> <strong>Francisco</strong> Groundwater Supply Project 3 April 2010<br />
Case No. 2008.1122E<br />
A.1-9
Scoping Report<br />
TABLE 1<br />
NUMBER OF RECIPIENTS ON MAILING LIST FOR NOP AND NOTICE OF SCOPING MEETING<br />
Category<br />
Number of NOP Recipients<br />
Number of NOP Notice of<br />
Availability Recipients<br />
Owners and Occupants 0 3,145<br />
Wholesale Customers 3 48<br />
Responsible and Trustee Agencies, Other Agencies 24 93<br />
SFPUC Citizen's Advisory Committee 0 13<br />
Interested Parties 6 347<br />
Local and Bordering Jurisdictions 0 10<br />
Media, Libraries, and Individuals 13 6<br />
TOTAL 46 3,662<br />
4.0 Scoping Meeting<br />
The <strong>San</strong> <strong>Francisco</strong> <strong>Planning</strong> <strong>Department</strong> held a public scoping meeting on January 20, 2010 at<br />
the Golden Gate Senior Center (6101 Fulton Street, <strong>San</strong> <strong>Francisco</strong>), approximately three weeks<br />
after publication of the NOP. The objective of the meeting was to solicit input from the public on<br />
potential environmental impacts of the proposed project, the appropriate scope of the EIR,<br />
potential mitigation measures, and potential alternatives to the proposed project.<br />
The total attendance for the scoping meeting was 30 (based on the meeting sign-in sheets and<br />
excluding CCSF and EIR consultant staff). Meeting attendees primarily consisted of private<br />
property owners residing near the proposed project area. A total of six participants provided<br />
verbal comments at the meeting. The scoping meeting was recorded by a certified court reporter<br />
who provided verbatim written transcripts of the proceedings. The transcripts can be found in<br />
Appendix C of this report.<br />
The meeting included presentations on the environmental review process and the proposed<br />
project, followed by a formal public comment period. Attendees interested in presenting verbal<br />
comments submitted speaker cards and were allowed sufficient time to speak. The meeting<br />
concluded with closing remarks. Appendix B includes copies of the scoping meeting presentation,<br />
handouts, comment/speaker cards, and sign-in sheets.<br />
Prior to the CEQA scoping meeting, SFPUC held a project open house where attendees were<br />
invited to review project display boards and ask questions of the SFPUC project team.<br />
<strong>San</strong> <strong>Francisco</strong> Groundwater Supply Project 4 April 2010<br />
Case No. 2008.1122E<br />
A.1-10
Scoping Report<br />
5.0 Overview of Comments Received<br />
Agencies and members of the public utilized several different methods of providing input: verbal<br />
comments during the scoping meeting, written comments submitted at the scoping meeting or<br />
sent via U.S. mail, email and fax. Table 2 lists agencies and other parties that provided written<br />
comments in response to the NOP, listed by comment letter number. Table 3 lists individuals that<br />
commented at the scoping meeting, listed in alphabetical order by last name. Copies of comment<br />
letters and emails are located in Appendix D, while scoping meeting transcripts are located in<br />
Appendix C.<br />
TABLE 2<br />
INDEX OF WRITTEN COMMENTS<br />
Comment<br />
Letter No.<br />
Commenter<br />
1. Agencies<br />
None<br />
2. Organizations<br />
2A Golden Gate Audubon Society (Dan Murphy)<br />
2B Sierra Club <strong>San</strong> <strong>Francisco</strong> Group (Howard Strassner)<br />
3. Individuals<br />
3A<br />
3B<br />
3C<br />
3D<br />
3E<br />
3F<br />
3G<br />
3H<br />
3I<br />
3J<br />
3K<br />
3L<br />
3M<br />
3N<br />
3O<br />
Gerald Colvin<br />
Dennis Huey<br />
Eileen Kho<br />
Michael P. Laughlin<br />
Steve Lawrence<br />
Steve Lawrence<br />
Steve Lawrence<br />
Steve Lawrence<br />
Steve Lawrence<br />
Maureen Maggiolo<br />
Dick Morten<br />
Jim Spahr<br />
William Wanner<br />
Chunyao Xia<br />
LC Yim<br />
<strong>San</strong> <strong>Francisco</strong> Groundwater Supply Project 5 April 2010<br />
Case No. 2008.1122E<br />
A.1-11
Scoping Report<br />
TABLE 3<br />
INDEX OF VERBAL COMMENTS<br />
Verbal<br />
Comment No. Commenter Organization Name (if applicable)<br />
4A Andrew Chan NA<br />
4B Joan Girardot NA<br />
4C Nicole Iroz-Elardo NA<br />
4D Joyce Law NA<br />
4E Steve Lawrence NA<br />
4F Dan Murphy Golden Gate Audubon Society<br />
NA = Not Applicable<br />
6.0 Summary of Comments by Subject Area<br />
This section summarizes the issues raised in written and verbal comments during the scoping<br />
period. Table 4 provides a summary of scoping comments by commenter. (<strong>Appendices</strong> B and D<br />
also contain all of the commenter correspondence and copies of the scoping meeting transcripts.)<br />
<strong>San</strong> <strong>Francisco</strong> Groundwater Supply Project 6 April 2010<br />
Case No. 2008.1122E<br />
A.1-12
Scoping Report<br />
TABLE 4<br />
SUMMARY OF COMMENTS BY COMMENTER<br />
Commenter Page, Paragraph Summary of Comment CEQA Subject Area<br />
Comments Not Applicable to<br />
CEQA or the Proposed Project<br />
2A<br />
Golden Gate Audubon<br />
Society<br />
Page 1, Paragraph 1 Discuss surface water impacts Hydrology (Impacts on Surface Water)<br />
2A<br />
Golden Gate Audubon<br />
Society<br />
Page 1, Paragraph 2 Develop an adaptive management plan to<br />
address potential surface water impacts and<br />
impacts to the groundwater basin<br />
Project Description<br />
Hydrology (Impacts on Surface Water)<br />
2A<br />
Golden Gate Audubon<br />
Society<br />
Page 1, Paragraph 3 Address groundwater recharge<br />
Project Description<br />
Hydrology (Groundwater Recharge)<br />
2A<br />
Golden Gate Audubon<br />
Society<br />
Page 2, Paragraph 1 Expresses concern about <strong>San</strong> <strong>Francisco</strong><br />
Recreation and Parks <strong>Department</strong> (SFRPD)<br />
conversion of playing fields to synthetic turf<br />
and potential impacts to aquifer recharge<br />
amounts and quality<br />
Project Description<br />
Hydrology (Groundwater Recharge and<br />
Quality)<br />
Cumulative Impacts<br />
A.1-13<br />
2A<br />
Golden Gate Audubon<br />
Society<br />
Page 2, Paragraph 2 Discuss aquifer recharge and quantify<br />
diversion of groundwater to the sewage<br />
system as a result of increased impermeable<br />
surfaces<br />
Hydrology (Groundwater Recharge and<br />
Quality)<br />
Cumulative Impacts<br />
Quantification of changes to impermeable<br />
surfaces as the result of other projects and<br />
related changes in aquifer recharge are not<br />
proposed by the project proponent<br />
2A<br />
Golden Gate Audubon<br />
Society<br />
Page 2, Paragraph 3 Address strategies and infrastructure to<br />
maximize aquifer recharge<br />
Implementation of other projects that would<br />
increase aquifer recharge are not proposed by<br />
the project proponent<br />
2B<br />
Sierra Club <strong>San</strong><br />
<strong>Francisco</strong> Group<br />
Page 1, Paragraph 1 Clarify the purpose of the project Project Objectives<br />
2B<br />
Sierra Club <strong>San</strong><br />
<strong>Francisco</strong> Group<br />
Page 1, Paragraph 2 Address saltwater intrusion and existing<br />
salinity conditions in the groundwater basin<br />
Project Description<br />
Hydrology (Groundwater Quality)<br />
2B<br />
Sierra Club <strong>San</strong><br />
<strong>Francisco</strong> Group<br />
Page 1, Paragraph 2 Address groundwater basin recharge<br />
Project Description<br />
Hydrology (Groundwater Recharge)<br />
2B<br />
Sierra Club <strong>San</strong><br />
<strong>Francisco</strong> Group<br />
Page 1, Paragraph 2 Address provisions to increase groundwater<br />
recharge<br />
Implementation of other projects not under the<br />
purview of the project proponent<br />
2B<br />
Sierra Club <strong>San</strong><br />
<strong>Francisco</strong> Group<br />
Page 1, Paragraph 3 Address impacts to Lake Merced water levels<br />
Project Description<br />
Hydrology (Impacts on Surface Water)<br />
2B<br />
Sierra Club <strong>San</strong><br />
<strong>Francisco</strong> Group<br />
Page 1, Paragraph 4 Include a cost analysis of the proposed<br />
pumping requirements in comparison to the<br />
cost of delivering surface water supplies<br />
Not applicable to CEQA<br />
<strong>San</strong> <strong>Francisco</strong> Groundwater Supply Project 7 April 2010<br />
Case No. 2008.1122E
Scoping Report<br />
TABLE 4 (Continued)<br />
SUMMARY OF COMMENTS BY COMMENTER<br />
Commenter Page, Paragraph Summary of Comment CEQA Subject Area<br />
Comments Not Applicable to<br />
CEQA or the Proposed Project<br />
A.1-14<br />
2B<br />
3A<br />
Sierra Club<br />
<strong>San</strong> <strong>Francisco</strong> Group<br />
Colvin, Gerald (Sierra<br />
Club <strong>San</strong> <strong>Francisco</strong>)<br />
3B Huey, Dennis Page 1,<br />
Paragraphs 2-6<br />
Page 1, Paragraph 4 Discuss greenhouse gas emissions<br />
associated with project operations<br />
Page 1, Paragraph 1 Expresses interest in the status of Lake<br />
Merced and impacts that the WSIP will have<br />
on Lake Merced due to groundwater pumping<br />
Expresses concern about soil stability along a<br />
portion of the proposed pipeline route and<br />
related construction impacts on adjacent<br />
homes<br />
3B Huey, Dennis Page 1, Paragraph 7 Expresses concern about potential pipeline<br />
rupture or failure in the event of an earthquake<br />
due to soil conditions along a portion of the<br />
proposed pipeline<br />
3B Huey, Dennis Page 1, Paragraph 8 Requests that soil surveys be performed to<br />
determine soil stability prior to finalizing<br />
pipeline routes<br />
3C Kho, Eileen Page 1,<br />
Paragraphs 2-4<br />
Expresses concern about impacts associated<br />
with pipeline rupture or failure that could be<br />
worsened due to existing unstable soils<br />
conditions<br />
3C Kho, Eileen Page 1, Paragraph 5 Expresses preference that the pipeline route<br />
be moved from 40th Avenue<br />
3D Laughlin, Michael P. Page 1, Paragraph 1 Requests information about where the EIR<br />
and related studies will be available<br />
3D Laughlin, Michael P. Page 1, Paragraph 2 Analyze secondary impacts of groundwater<br />
pumping such as ground subsidence and<br />
saltwater intrusion<br />
3D Laughlin, Michael P. Page 1, Paragraph 2 Consider strategies for increased groundwater<br />
recharge<br />
3D Laughlin, Michael P. Page 1, Paragraph 3 Requests information about location and sizes<br />
of production wells and pipeline alignments,<br />
and trench depths<br />
Greenhouse Gas Emissions<br />
Hydrology (Impacts on Surface Water)<br />
Cumulative Impacts<br />
Project Location<br />
Geology and Soils<br />
Alternatives<br />
Project Location<br />
Geology and Soils<br />
Alternatives<br />
Project Description<br />
Project Location<br />
Geology and Soils<br />
Project Location<br />
Alternatives<br />
Notice of Availability<br />
Introduction and Background<br />
Hydrology (Groundwater Recharge and<br />
Quality)<br />
Geology and Soils<br />
Project Description<br />
Project Location<br />
Project Description<br />
Geology and Soils<br />
Implementation of other projects not under the<br />
purview of the project proponent<br />
<strong>San</strong> <strong>Francisco</strong> Groundwater Supply Project 8 April 2010<br />
Case No. 2008.1122E
Scoping Report<br />
TABLE 4 (Continued)<br />
SUMMARY OF COMMENTS BY COMMENTER<br />
Commenter Page, Paragraph Summary of Comment CEQA Subject Area<br />
Comments Not Applicable to<br />
CEQA or the Proposed Project<br />
3D Laughlin, Michael P. Page 1, Paragraph 3 Requests information about the project<br />
construction schedule<br />
3E Lawrence, Steve Page 1, Paragraph 2 Describe Lake Merced lake functions and<br />
project relationship to the Lake Merced Pump<br />
Station<br />
Construction Schedule<br />
Project Description<br />
Hydrology and Water Quality<br />
A.1-15<br />
3E Lawrence, Steve Page 1, Paragraph 2 Clarify the purpose of the project and<br />
proposed water service areas<br />
Project Objectives<br />
Project Description<br />
3E Lawrence, Steve Page 1, Paragraph 3 Address the timing of groundwater pumping Project Description<br />
3E Lawrence, Steve Page 1, Paragraph 4 Address the percentage of groundwater being Project Description<br />
blended with the regional water supply<br />
3E Lawrence, Steve Page 1, Paragraph 5 Address potential land subsidence as a result<br />
of groundwater pumping<br />
Hydrology<br />
Geology and Soils<br />
3E Lawrence, Steve Page 1, Paragraph 6 Include information about groundwater storage Project Description<br />
and disinfection.<br />
3F Lawrence, Steve Page 1, Paragraph 2 Address groundwater blending with the<br />
regional water supply<br />
Project Description<br />
3F Lawrence, Steve Page 1, Paragraph 3 Address duration and timing of groundwater<br />
pumping<br />
Project Description<br />
3F Lawrence, Steve Page 1, Paragraph 4 Address groundwater quality Project Description<br />
Hydrology (Groundwater Quality)<br />
3F Lawrence, Steve Page 1, Paragraph 4 Address potential seawater intrusion Project Description<br />
3F Lawrence, Steve Page 1, Paragraph 5 Include a description of the relationship<br />
between the proposed project and other WSIP<br />
groundwater projects<br />
3F Lawrence, Steve Page 1, Paragraph 6 Requests information regarding financial<br />
agreements between project proponent and<br />
Recreation and Parks <strong>Department</strong><br />
3F Lawrence, Steve Page 1, Paragraph 7 Requests transcript of the public NOP scoping<br />
meeting<br />
Hydrology (Groundwater Supply)<br />
Cumulative Impacts<br />
EIR <strong>Appendices</strong><br />
Not applicable to CEQA<br />
<strong>San</strong> <strong>Francisco</strong> Groundwater Supply Project 9 April 2010<br />
Case No. 2008.1122E
Scoping Report<br />
TABLE 4 (Continued)<br />
SUMMARY OF COMMENTS BY COMMENTER<br />
Commenter Page, Paragraph Summary of Comment CEQA Subject Area<br />
Comments Not Applicable to<br />
CEQA or the Proposed Project<br />
A.1-16<br />
3G Lawrence, Steve Page 1,<br />
Paragraphs 2, 3,10;<br />
Page 2, Paragraph 1<br />
3G Lawrence, Steve Page 1,<br />
Paragraphs 4<br />
through10<br />
Address the percentage of groundwater being<br />
blended with the regional water supply and<br />
groundwater quality<br />
Requests regular testing of groundwater<br />
quality and publication of testing results<br />
3G Lawrence, Steve Page 2, Paragraph 2 Address alternative water supply in the event<br />
groundwater does not meet regulatory<br />
standards<br />
3G Lawrence, Steve Page 2, Paragraph 3 Address disinfection processes and facilities<br />
for groundwater during normal and emergency<br />
uses<br />
3H Lawrence, Steve Page 1, Paragraph 2 Address recycled water intrusion into the<br />
groundwater aquifer, and affects on water<br />
quality<br />
3H Lawrence, Steve Page 1, Paragraph 3 Address conversion of playing fields to<br />
synthetic turf and impacts to groundwater<br />
quality<br />
Project Description<br />
Hydrology (Groundwater Quality)<br />
Project Description<br />
Hydrology (Groundwater Quality)<br />
Project Description<br />
Alternatives<br />
Project Description<br />
Project Description<br />
Cumulative Impacts<br />
Project Description<br />
Hydrology (Groundwater Recharge and<br />
Quality)<br />
Cumulative Impacts<br />
3H Lawrence, Steve Page 1, Paragraph 4 Address groundwater quality and testing Project Description<br />
Hydrology (Groundwater Quality)<br />
3I Lawrence, Steve Page 1, Paragraph 1 Address impacts on Lake Merced water levels<br />
associated with groundwater pumping<br />
Hydrology (Impacts on Surface Water)<br />
3J Maggiolo, Maureen Page 1,<br />
Paragraphs 2, 3<br />
Concern regarding pipeline location due to<br />
traffic impacts and existing soil conditions<br />
3J Maggiolo, Maureen Page 1, Paragraph 5 Address construction-related vibration impacts<br />
on structures<br />
3K Morten, Dick Page 1, Paragraph 2 Use the hydrological model developed by Daly<br />
City in its groundwater analysis<br />
Project Location<br />
Transportation and Circulation<br />
Geology and Soils<br />
Alternatives<br />
Noise<br />
Project Description<br />
Cumulative Impacts<br />
<strong>San</strong> <strong>Francisco</strong> Groundwater Supply Project 10 April 2010<br />
Case No. 2008.1122E
Scoping Report<br />
TABLE 4 (Continued)<br />
SUMMARY OF COMMENTS BY COMMENTER<br />
Commenter Page, Paragraph Summary of Comment CEQA Subject Area<br />
Comments Not Applicable to<br />
CEQA or the Proposed Project<br />
A.1-17<br />
3K Morten, Dick Page 1, Paragraph 3 Address saltwater intrusion impacts and<br />
implement a program to monitor saltwater<br />
intrusion<br />
3K Morten, Dick Page 1,<br />
Paragraphs 4, 5<br />
3L Spahr, Jim Page 1,<br />
Paragraphs 1, 6<br />
3L Spahr, Jim Page 1,<br />
Paragraphs 2-5<br />
3M Wanner, William Page 1,<br />
Paragraphs 2-5;<br />
Page 2,<br />
Paragraphs 1-4<br />
3M Wanner, William Page 2,<br />
Paragraphs 5-6<br />
Suggests groundwater for emergency use -<br />
fire fighting and potable drinking water; and<br />
coordination of the proposed improvements<br />
with the Auxiliary and Portable Water Supply<br />
System<br />
Requests that construction effects on nearby<br />
land uses be considered<br />
Describes concerns regarding past CCSF<br />
construction activities<br />
Address existing ground subsidence along<br />
proposed pipeline route and provide measures<br />
to mitigate construction impacts<br />
Residences should have notice of all<br />
construction activities<br />
3M Wanner, William Page 2, Paragraph 7 Requests notification of availability for<br />
additional project documents and meetings<br />
3N Xia, Chunyao Page 1, Paragraph 1 Expresses concern about construction-related<br />
effects on adjacent structures<br />
3O Yim, LC Page 1, Paragraph 2 Address potential impacts of pipeline rupture<br />
or failure, related to existing soil conditions<br />
Project Description<br />
Hydrology (Groundwater Quality)<br />
Project Description<br />
Public Services<br />
Transportation and Circulation<br />
Noise<br />
Air Quality<br />
Cumulative Impacts<br />
Geology and Soils<br />
Construction Schedule<br />
Transportation and Circulation<br />
Noise<br />
Air Quality<br />
Notice of Availability<br />
Introduction and Background<br />
Noise<br />
Geology and Soils<br />
Project Location<br />
Geology and Soils<br />
<strong>San</strong> <strong>Francisco</strong> Groundwater Supply Project 11 April 2010<br />
Case No. 2008.1122E
Scoping Report<br />
TABLE 4 (Continued)<br />
SUMMARY OF COMMENTS BY COMMENTER<br />
Commenter Page, Paragraph Summary of Comment CEQA Subject Area<br />
Comments Not Applicable to<br />
CEQA or the Proposed Project<br />
A.1-18<br />
3O Yim, LC Page 1, Paragraph 2 Address potential construction impacts on<br />
adjacent land uses<br />
3O Yim, LC Page 1, Paragraph 3 Expresses preference regarding the wellsite<br />
and pipeline alignment locations<br />
4A Andrew Chan Page 20,<br />
Paragraph 1<br />
4A Andrew Chan Page 20,<br />
Paragraph 2<br />
4A Andrew Chan Page 20,<br />
Paragraph 3<br />
4A Andrew Chan Page 20,<br />
Paragraph 4<br />
4B Joan Girardot Page 24,<br />
Paragraphs 4-6;<br />
Page 25,<br />
Paragraph 2<br />
4B Joan Girardot Page 24,<br />
Paragraph 4<br />
4B Joan Girardot Page 25,<br />
Paragraph 3<br />
4B Joan Girardot Page 25,<br />
Paragraph 4;<br />
Page 25,<br />
Paragraph 1<br />
Expresses concern about scoping meeting<br />
location<br />
Requests information regarding the project<br />
construction start date and schedule<br />
Include a maintenance program for the<br />
proposed pipeline<br />
Expresses preference regarding pipeline<br />
alignment<br />
Address alternative water supply to the<br />
proposed project<br />
Provide a description of the existing aquifer,<br />
past groundwater pumping, and the ability of<br />
the basin to serve the proposed project<br />
Address potential construction impacts on<br />
adjacent land uses<br />
Address potential groundwater contamination<br />
from proposed artificial turf soccer fields<br />
Land Use<br />
Transportation and Circulation<br />
Noise<br />
Air Quality<br />
Project Location<br />
Alternatives<br />
Introduction and Background<br />
Construction Schedule<br />
Project Description<br />
Project Location<br />
Alternatives<br />
Alternatives<br />
Project Description<br />
Hydrology (Groundwater Supply)<br />
Land Use<br />
Transportation and Circulation<br />
Noise<br />
Air Quality<br />
Hydrology (Groundwater Supply)<br />
Cumulative Impacts<br />
<strong>San</strong> <strong>Francisco</strong> Groundwater Supply Project 12 April 2010<br />
Case No. 2008.1122E
Scoping Report<br />
TABLE 4 (Continued)<br />
SUMMARY OF COMMENTS BY COMMENTER<br />
Commenter Page, Paragraph Summary of Comment CEQA Subject Area<br />
Comments Not Applicable to<br />
CEQA or the Proposed Project<br />
4C Nicole Iroz-Elardo Page 27,<br />
Paragraph 7<br />
Address collective management of the overall<br />
groundwater basin, to ensure the proposed<br />
project is not affected by groundwater<br />
contamination that could occur south of <strong>San</strong><br />
<strong>Francisco</strong><br />
Project Description<br />
Hydrology (Groundwater Quality)<br />
Cumulative Impacts<br />
4C Nicole Iroz-Elardo Page 28,<br />
Paragraph 1<br />
Address groundwater recharge and consider<br />
replacing impervious surfaces with permeable<br />
surfaces following construction of pipelines<br />
Project Description<br />
Hydrology (Groundwater Recharge and<br />
Quality)<br />
4D Joyce Law Page 27,<br />
Paragraphs 1-3<br />
Expresses concern about pipeline leaks<br />
Project Description<br />
Geology and Soils<br />
A.1-19<br />
4E Steve Lawrence Page 20,<br />
Paragraph 5;<br />
Page 21,<br />
Paragraphs 1-2<br />
4E Steve Lawrence Page 21,<br />
Paragraph 3;<br />
Page 22,<br />
Paragraph 1<br />
Address groundwater blending with the<br />
regional water supply<br />
Requests information regarding financial<br />
agreements between project proponent and<br />
Recreation and Parks <strong>Department</strong><br />
Project Description<br />
Hydrology (Groundwater Quality)<br />
Not applicable to CEQA<br />
4E Steve Lawrence Page 22,<br />
Paragraphs 3-4<br />
Address groundwater quality and water supply<br />
availability, should groundwater quality exceed<br />
standards for potable use<br />
Project Description<br />
Hydrology (Groundwater Quality)<br />
Alternatives<br />
4F<br />
Dan Murphy, Golden<br />
Gate Audubon Society<br />
Page 23,<br />
Paragraph 2<br />
Recommends that an adaptive management<br />
plan be included as part of the proposed<br />
project<br />
Project Description<br />
4F<br />
Dan Murphy, Golden<br />
Gate Audubon Society<br />
Page 23,<br />
Paragraph 3<br />
Address impacts to Lake Merced and Pine<br />
Lake, including habitat effects<br />
Hydrology (Impacts on Surface Water)<br />
Biological Resources<br />
4F<br />
Dan Murphy, Golden<br />
Gate Audubon Society<br />
Page 20,<br />
Paragraphs 4, 5<br />
Address groundwater recharge<br />
Project Description<br />
Hydrology (Groundwater Recharge)<br />
<strong>San</strong> <strong>Francisco</strong> Groundwater Supply Project 13 April 2010<br />
Case No. 2008.1122E
This page intentionally left blank<br />
A.1-20
APPENDICES<br />
A. Notice of Preparation (NOP) and NOP Notice of Availability<br />
B. Scoping Meeting Materials<br />
C. Scoping Meeting Transcripts<br />
D. Comments Received During EIR Scoping Process<br />
<strong>San</strong> <strong>Francisco</strong> Groundwater Supply Project April 2010<br />
Case No. 2008.2211E<br />
A.1-21
This page intentionally left blank<br />
A.1-22
APPENDIX A<br />
Notice of Preparation and NOP Notice of<br />
Availability<br />
<strong>San</strong> <strong>Francisco</strong> Groundwater Supply Project A-1 April 2010<br />
Case No. 2008.1122E<br />
A.1-23
This page intentionally left blank<br />
A.1-24
December 30, 2009<br />
TO:<br />
RE:<br />
Responsible Agencies, Trustee Agencies, and Interested Parties<br />
CASE NO. 2008.1122E – SAN FRANCISCO GROUNDWATER SUPPLY PROJECT<br />
NOTICE OF PREPARATION OF AN ENVIRONMENTAL IMPACT REPORT AND<br />
NOTICE OF PUBLIC SCOPING MEETING<br />
A Notice of Preparation (NOP) of an Environmental Impact Report (EIR) for the above‐referenced<br />
project, described below, has been issued by the <strong>Planning</strong> <strong>Department</strong>. The NOP and Notice of Public<br />
Scoping Meeting is either attached or is available upon request from Jamie Dean, who may be reached<br />
at (415) 575‐9028 or jamie.dean@sfgov.org, or by mail at the above address. It is also available online<br />
at http://mea.sfplanning.org. This notice is being sent to you because you have been identified as<br />
potentially having an interest in the project or the project area.<br />
Project Description:<br />
The purpose of the <strong>San</strong> <strong>Francisco</strong> Groundwater Supply Project (project or proposed project) is to<br />
provide an average of four million gallons per day (mgd) of groundwater to <strong>San</strong> <strong>Francisco</strong>’s<br />
municipal water supply. Groundwater would be blended with <strong>San</strong> <strong>Francisco</strong>’s existing municipal<br />
water supply for distribution within <strong>San</strong> <strong>Francisco</strong>. The groundwater would be pumped from the<br />
North Westside Groundwater Basin, which is located within the larger Westside Groundwater Basin<br />
and underlies parts of <strong>San</strong> <strong>Francisco</strong> and <strong>San</strong> Mateo Counties. Facilities required to implement the<br />
project, including groundwater production well facilities, would be located on the western side of the<br />
city of <strong>San</strong> <strong>Francisco</strong> on property owned by the City and County of <strong>San</strong> <strong>Francisco</strong>, and managed by<br />
the <strong>San</strong> <strong>Francisco</strong> Public Utilities Commission (SFPUC) or the <strong>San</strong> <strong>Francisco</strong> Recreation and Park<br />
<strong>Department</strong>.<br />
Under the proposed project, the SFPUC would construct and operate six potable groundwater<br />
production well facilities. Although nine locations are currently under consideration for the<br />
groundwater production well facilities, only six facilities would be constructed—two that would be<br />
converted from existing irrigation well facilities, and four new well facilities. Each well facility would<br />
include a groundwater production well and a pump station. The SFPUC would also construct a<br />
distribution system (including pipelines and connection points) that would connect five of the well<br />
facilities to Sunset Reservoir; the sixth well would connect to the existing Lake Merced Pump Station,<br />
and would require a short length of distribution piping to make this connection. The project would be<br />
implemented in two phases: (1) construction and operation of the four new well facilities to supply an<br />
annual average of approximately 2.5 mgd of groundwater, and construction of well facilities required to<br />
convert two existing irrigation well facilities to potable water well facilities; and (2) operation of the<br />
converted irrigation wells to provide an additional annual average of approximately 1.5 mgd of<br />
groundwater.<br />
The project is a component of the SFPUC’s Water System Improvement Program (WSIP), which<br />
includes facility improvement projects designed to: (1) maintain high‐quality water; (2) reduce<br />
vulnerability to earthquakes; (3) increase delivery reliability and improve the ability to maintain the<br />
system; (4) meet customer purchase requests in nondrought and drought periods; (5) enhance<br />
sustainability in all system activities; and (6) achieve a cost‐effective, fully operational system.<br />
Implementation of the project, as a component of the WSIP, would contribute to meeting the overall<br />
www.sfplanning.org<br />
A.1-25
WSIP goals and objectives, by diversifying water supply options during drought and nondrought<br />
periods and improving the use of new water sources and drought management.<br />
Pursuant to the NOP, the <strong>San</strong> <strong>Francisco</strong> <strong>Planning</strong> <strong>Department</strong> has determined that an EIR must be<br />
prepared for the project prior to any final decision by the SFPUC regarding whether to approve and<br />
implement the project. The purpose of the EIR is to provide information about potentially significant<br />
adverse environmental effects of the project, to identify possible ways to minimize any potentially<br />
significant adverse effects, and to describe and analyze feasible alternatives to the project. Preparation of<br />
a NOP or EIR does not indicate a decision by the City of <strong>San</strong> <strong>Francisco</strong> to approve or to disapprove the<br />
project, and prior to making any such decision, the SFPUC must review and consider the information<br />
contained in the EIR.<br />
The <strong>San</strong> <strong>Francisco</strong> <strong>Planning</strong> <strong>Department</strong> will hold a PUBLIC SCOPING MEETING at the location,<br />
date, and time listed below. The purpose of this meeting is to receive oral comments to assist the<br />
<strong>Planning</strong> <strong>Department</strong> in reviewing the scope and content of the environmental impact analysis and<br />
information to be contained in the EIR. The <strong>Planning</strong> <strong>Department</strong> also will accept written comments<br />
at the meeting or by mail, email, or fax until the close of business (5:00 p.m.) on January 30, 2010.<br />
Written comments should be sent by mail to <strong>San</strong> <strong>Francisco</strong> <strong>Planning</strong> <strong>Department</strong>, Attn: Bill Wycko,<br />
Environmental Review Officer, <strong>San</strong> <strong>Francisco</strong> Groundwater Supply Project Scoping Comments,<br />
1650 Mission Street, Suite 400, <strong>San</strong> <strong>Francisco</strong>, CA 94103‐2479; by fax to (415) 558‐6409; or by e‐mail to<br />
jamie.dean@sfgov.org.<br />
PUBLIC SCOPING MEETING LOCATION, DATE, AND TIME:<br />
Golden Gate Park Senior Center – <strong>San</strong> <strong>Francisco</strong><br />
Wednesday, January 20, 2010<br />
7:00 PM (starting promptly)<br />
6101 Fulton Street (at 37th Avenue)<br />
If you work for an agency that is a Responsible or a Trustee Agency, we need to know the views of<br />
your agency as to the scope and content of the environmental information that is relevant to your<br />
agency’s statutory responsibilities in connection with the proposed project. Your agency may need to<br />
use the EIR when considering a permit or other approval for this proposed project. We will also need<br />
the name of the contact person for your agency. If you have questions concerning environmental<br />
review of the proposed project under CEQA, please contact Jamie Dean at (415) 575‐9028 or<br />
jamie.dean@sfgov.org.<br />
A.1-26<br />
2
Notice of Preparation of an Environmental Impact Report<br />
Date: December 30, 2009<br />
Case No.: 2008.1122E<br />
Project Title: <strong>San</strong> <strong>Francisco</strong> Groundwater Supply Project<br />
Location: The project is located in the North Westside Groundwater<br />
Basin, which is within the larger Westside Groundwater Basin<br />
underlying parts of <strong>San</strong> <strong>Francisco</strong> and <strong>San</strong> Mateo Counties.<br />
Project facilities would be constructed in the Sunset District of<br />
<strong>San</strong> <strong>Francisco</strong> and in Golden Gate Park.<br />
BPA Nos.: N/A<br />
Zoning:<br />
N/A<br />
Block/Lot: N/A<br />
Lot Size:<br />
Various<br />
Project Sponsor Jeff Gilman, <strong>San</strong> <strong>Francisco</strong> Public Utilities Commission<br />
(415) 551‐2952<br />
Lead Agency: <strong>San</strong> <strong>Francisco</strong> <strong>Planning</strong> <strong>Department</strong><br />
Staff Contact: Jamie Dean – (415) 575‐9028; jamie.dean@sfgov.org<br />
PROJECT DESCRIPTION<br />
The purpose of the <strong>San</strong> <strong>Francisco</strong> Groundwater Supply Project (project or proposed project) is to<br />
provide an average of four million gallons per day (mgd) of groundwater to <strong>San</strong> <strong>Francisco</strong>’s<br />
municipal water supply. Groundwater would be blended with <strong>San</strong> <strong>Francisco</strong>’s existing<br />
municipal water supply for distribution within <strong>San</strong> <strong>Francisco</strong>. The groundwater would be<br />
pumped from the North Westside Groundwater Basin, which is located within the larger<br />
Westside Groundwater Basin that underlies parts of <strong>San</strong> <strong>Francisco</strong> and <strong>San</strong> Mateo Counties.<br />
Facilities required to implement the project, including groundwater production well facilities,<br />
would be located on the western side of the city of <strong>San</strong> <strong>Francisco</strong> on property owned by the City<br />
and County of <strong>San</strong> <strong>Francisco</strong> (CCSF), and managed by the <strong>San</strong> <strong>Francisco</strong> Public Utilities<br />
Commission (SFPUC) or the <strong>San</strong> <strong>Francisco</strong> Recreation and Park <strong>Department</strong>.<br />
Under the proposed project, the SFPUC would construct and operate six potable groundwater<br />
production well facilities. Although nine locations are currently under consideration for the<br />
groundwater production well facilities, only six facilities would be constructed—two that would<br />
be converted from existing irrigation well facilities and four new well facilities. Each facility<br />
would include a groundwater production well and a pump station. The SFPUC would also<br />
construct a distribution system (including pipelines and connection points) that would connect<br />
five of the well facilities to Sunset Reservoir; the sixth well would connect to the existing Lake<br />
Merced Pump Station, and would require a short length of distribution piping to make this<br />
connection. The project would be implemented in two phases: (1) construction and operation of<br />
the four new well facilities to supply an annual average of approximately 2.5 mgd of<br />
groundwater, and construction of well facilities required to convert the two existing irrigation<br />
www.sfplanning.org<br />
A.1-27
Notice of Preparation of an EIR<br />
December 30, 2009<br />
Case No.2008.1122E<br />
<strong>San</strong> <strong>Francisco</strong> Groundwater Supply Project<br />
well facilities to potable water well facilities; and (2) operation of the converted irrigation wells to<br />
provide an additional annual average of approximately 1.5 mgd of groundwater.<br />
The project is a component of the SFPUC's Water System Improvement Program (WSIP), which<br />
includes facility improvement projects designed to: (1) maintain high-quality water; (2) reduce<br />
vulnerability to earthquakes; (3) increase delivery reliability and improve the ability to maintain<br />
the system; (4) meet customer purchase requests in nondrought and drought periods; (5) enhance<br />
sustainability in all system activities; and (6) achieve a cost-effective, fully operational system.<br />
Implementation of the project, as a component of the WSIP, would contribute to meeting the<br />
overall WSIP goals and objectives by diversifying water supply options during drought and<br />
nondrought periods and improving the use of new water sources and drought management.<br />
FINDING<br />
This project may have a significant effect on the environment and an Environmental Impact<br />
Report is required. This determination is based upon the criteria of the State CEQA Guidelines,<br />
Sections 15063 (Initial Study), 15064 (Determining Significant Effect), and 15065 (Mandatory<br />
Findings of Significance) and for the reasons documented in the attached project description and<br />
description of potential environmental effects.<br />
PUBLIC SCOPING PROCESS<br />
Pursuant to the State of California Public Resources Code Section 21083.9 and California<br />
Environmental Quality Act Guidelines Section 15206, a public scoping meeting will be held to<br />
receive oral comments concerning the scope of the EIR. The meeting will be held on January 20,<br />
2010, 7:00 PM (starting promptly) at the Golden Gate Park Senior Center, 6101 Fulton Street (at<br />
37th Avenue), <strong>San</strong> <strong>Francisco</strong>, CA 94121. Written comments wil also be accepted at this meeting<br />
and until the close of business on January 30, 2010. Written comments should be sent to by mail<br />
to the <strong>San</strong> <strong>Francisco</strong> <strong>Planning</strong> <strong>Department</strong>, Attn: Bill Wycko, Environmental Review Officer, <strong>San</strong><br />
<strong>Francisco</strong> Groundwater Supply Project Scoping Comments, 1650 Mission Street, Suite 400, <strong>San</strong><br />
<strong>Francisco</strong>, CA 94103; by fax to (415) 558-6409; or bye-mail to jamie.dean@sfgov.org.<br />
If you work for a Responsible or Trustee Agency, we need to know the views of your agency<br />
regarding the scope and content of the environmental information that is germane to your<br />
agency's statutory responsibilities in connection with the proposed project. Your agency may<br />
need to use the EIR when considering a permit or other approval for this project. Please include<br />
the name of a contact person in your agency.<br />
(<br />
~-11;:2007 ¿'--/f~'<br />
Date<br />
7<br />
Bill Wycko .<br />
Environmental Review Officer<br />
SAN fRANCISCO<br />
PLANNING DEPARTMENT 2<br />
A.1-28
NOTICE OF PREPARATION<br />
<strong>San</strong> <strong>Francisco</strong> Groundwater Supply Project<br />
Case No. 2008.1122E<br />
1.0 Overview<br />
The <strong>San</strong> <strong>Francisco</strong> Public Utilities Commission (SFPUC) is proposing the <strong>San</strong> <strong>Francisco</strong><br />
Groundwater Supply Project (project or proposed project). To meet California Environmental<br />
Quality Act (CEQA) requirements, the <strong>San</strong> <strong>Francisco</strong> <strong>Planning</strong> <strong>Department</strong>’s Major<br />
Environmental Analysis (MEA) Division will prepare and distribute an environmental impact<br />
report (EIR) to describe and analyze the environmental effects of the proposed project. This<br />
Notice of Preparation (NOP) describes the proposed project and potential environmental effects,<br />
and announces the date of a scoping meeting for public comments.<br />
The project would provide an average of four million gallons per day (mgd) of groundwater to<br />
<strong>San</strong> <strong>Francisco</strong>’s municipal water supply. Groundwater would be blended with <strong>San</strong> <strong>Francisco</strong>’s<br />
existing municipal water supply for distribution within <strong>San</strong> <strong>Francisco</strong>. The groundwater would be<br />
pumped from the North Westside Groundwater Basin, which is located within the larger Westside<br />
Groundwater Basin, which underlies parts of <strong>San</strong> <strong>Francisco</strong> and <strong>San</strong> Mateo Counties. Facilities<br />
required to implement the project, including groundwater production well facilities, would be<br />
located on the western side of the city of <strong>San</strong> <strong>Francisco</strong> (see Figure 1), on property owned by the<br />
City and County of <strong>San</strong> <strong>Francisco</strong>, and managed by the SFPUC or the <strong>San</strong> <strong>Francisco</strong> Recreation<br />
and Park <strong>Department</strong> (SFRPD).<br />
As illustrated on Figure 1, nine locations are under consideration for the groundwater production<br />
well facilities; however, only six potable groundwater well facilities would be constructed—two<br />
that would be converted from existing irrigation well facilities and four new facilities. Each<br />
facility would include a groundwater production well and a pump station. The SFPUC also<br />
proposes the construction of a distribution system (including pipelines and connection points) that<br />
would connect five of the well facilities to Sunset Reservoir; the sixth well would connect to the<br />
existing Lake Merced Pump Station, and would require a short length of distribution piping to<br />
make this connection.<br />
The project is a component of the SFPUC’s Water System Improvement Program (WSIP), which<br />
includes facility improvement projects designed to maintain high-quality water; reduce<br />
vulnerability to earthquakes; increase delivery reliability and improve the ability to maintain the<br />
system; meet customer purchase requests in nondrought and drought periods; enhance<br />
sustainability in all system activities; and achieve a cost-effective, fully operational system.<br />
<strong>San</strong> <strong>Francisco</strong> Groundwater Supply Project 1 December 2009<br />
Case No. 2008.1122E<br />
A.1-29
1<br />
GEARY BLVD<br />
36TH AVE<br />
0 2,000 4,000 Feet<br />
CHAIN OF<br />
LAKES DR<br />
4<br />
JOHN F KENNEDY DR<br />
M<br />
5<br />
7<br />
ARTIN LU THER KING JR DR<br />
FULTON ST<br />
6<br />
8<br />
MIDDLE DR W<br />
9<br />
TRANSVERSE DR<br />
LINCOLN WAY<br />
Golden Gate Park<br />
PACIFIC<br />
OCEAN<br />
North W estside<br />
Groundwater B asin<br />
9TH AVE<br />
24TH AVE<br />
GREAT HWY (HWY 1)<br />
QUINTARA<br />
ST<br />
41ST AVE<br />
SUNSET BLVD<br />
3<br />
ORTEGA ST<br />
Sunset<br />
Reservoir<br />
Sutro<br />
Reservoir<br />
40TH AVE<br />
Legend<br />
Proposed Groundwater Well Facility<br />
Existing Groundwater Well Facility<br />
(Proposed for Modification)<br />
Alternative Groundwater Well Facility<br />
1 - Lake Merced Site<br />
2 - South Sunset Site<br />
3 - West Sunset Site<br />
4 – South Windmill Deepwell Site<br />
5 – North Lake Deepwell Site<br />
6 - Polo Field Site<br />
7 - Spreckels Lake Site<br />
8 - Urban Forestry Center Site<br />
9 - Central Pump Station Site<br />
WAWONA ST<br />
SF Zoo<br />
2<br />
SLOAT BLVD<br />
Lake<br />
Merced<br />
Harding Park<br />
Pine Lake<br />
LAKE MERCED BLVD<br />
1<br />
Stern<br />
Grove<br />
Merced<br />
Manor<br />
Reservoir<br />
BROTHERHOOD<br />
<strong>San</strong> Fr<br />
ancisco<br />
WAY<br />
<strong>San</strong> <strong>Francisco</strong> Co.<br />
<strong>San</strong> Mateo Co.<br />
I-280<br />
Proposed Groundwater Pipeline Routes<br />
Daly City<br />
Lake<br />
Groundwater Basin Boundary<br />
[Source: CA Dept.of Water<br />
Resources, Bulletin 118 (2003),<br />
modified by Gus Yates, 2003]<br />
South W estside<br />
Groundwater B asin<br />
SOURCE: SFPUC, 2009<br />
<strong>San</strong> <strong>Francisco</strong> Groundwater Supply Project<br />
Figure 1<br />
Project Location<br />
A.1-30
Notice of Preparation<br />
To address the potential environmental impacts of the WSIP, the <strong>San</strong> <strong>Francisco</strong> <strong>Planning</strong><br />
<strong>Department</strong> prepared a Program EIR on the proposed WSIP, which was certified by the <strong>San</strong><br />
<strong>Francisco</strong> <strong>Planning</strong> Commission on October 30, 2008 and the WSIP was approved by the SFPUC<br />
on that same day (<strong>San</strong> <strong>Francisco</strong> <strong>Planning</strong> <strong>Department</strong>, 2008 and SFPUC, 2008). Implementation<br />
of the project, as a component of the WSIP, would contribute to meeting the overall WSIP goals<br />
and objectives by diversifying water supply options during drought and nondrought periods and<br />
improving the use of new water sources and drought management.<br />
2.0 Environmental Review Process<br />
As described above, the <strong>San</strong> <strong>Francisco</strong> <strong>Planning</strong> Commission certified the WSIP Program EIR in<br />
October 2008. The Program EIR addressed the potential environmental impacts of the WSIP<br />
facilities on a programmatic level and evaluated regional water supply alternatives. The Program<br />
EIR is available on the <strong>San</strong> <strong>Francisco</strong> <strong>Planning</strong> <strong>Department</strong> website at: http://mea.sfplanning.org.<br />
The Program EIR evaluated the environmental effects of the proposed project at a programmatic<br />
level of detail. The <strong>San</strong> <strong>Francisco</strong> <strong>Planning</strong> <strong>Department</strong> will now prepare a project-specific EIR to<br />
evaluate the environmental effects of the proposed project in detail. The EIR will be prepared in<br />
compliance with CEQA Guidelines Section 15161, and will address project-specific construction<br />
and operational impacts.<br />
The first step in the environmental review process is the formal public scoping process, for which<br />
this NOP has been prepared and will be circulated for a 30-day public review period. Following the<br />
public scoping phase, a Draft EIR will be prepared and circulated for a 45-day public review period.<br />
Public comments on the Draft EIR will be accepted in writing during the review period or verbally<br />
at the formal public hearing to be held by the <strong>San</strong> <strong>Francisco</strong> <strong>Planning</strong> Commission. The <strong>San</strong><br />
<strong>Francisco</strong> <strong>Planning</strong> <strong>Department</strong> will then prepare a Comments and Responses document, which will<br />
respond to comments on environmental issues raised during the public review period. This<br />
document will be considered by the <strong>San</strong> <strong>Francisco</strong> <strong>Planning</strong> Commission, along with the Draft EIR<br />
and any revisions to the draft based on the response to comments, for certification as the Final EIR.<br />
Once the Final EIR is certified, the SFPUC will consider project approval.<br />
3.0 Public Scoping Meeting<br />
The <strong>San</strong> <strong>Francisco</strong> <strong>Planning</strong> <strong>Department</strong> will hold a scoping meeting following release of this<br />
NOP as follows:<br />
Golden Gate Park Senior Center – <strong>San</strong> <strong>Francisco</strong><br />
Wednesday, January 20, 2010<br />
7:00 PM (starting promptly)<br />
6101 Fulton Street (at 37th Avenue)<br />
<strong>San</strong> <strong>Francisco</strong> Groundwater Supply Project 3 December 2009<br />
Case No. 2008.1122E<br />
A.1-31
Notice of Preparation<br />
The public will have the opportunity to verbally comment or submit written comments at the<br />
scoping meeting. In addition, the <strong>San</strong> <strong>Francisco</strong> <strong>Planning</strong> <strong>Department</strong> will accept written<br />
comments by mail, email, or fax until close of business (5:00 p.m.) on January 30, 2010. The<br />
comments received will assist the <strong>Planning</strong> <strong>Department</strong> with its review of the proposed scope and<br />
content of the EIR as summarized in this NOP.<br />
Written comments may be mailed to the <strong>San</strong> <strong>Francisco</strong> <strong>Planning</strong> <strong>Department</strong>, Attn: Bill Wycko,<br />
Environmental Review Officer, <strong>San</strong> <strong>Francisco</strong> Groundwater Supply Project Scoping Comments,<br />
1650 Mission Street, Suite 400, <strong>San</strong> <strong>Francisco</strong>, CA 94103; sent by fax to (415) 558-6409; or<br />
submitted by email to jamie.dean@sfgov.org.<br />
4.0 Project Description<br />
4.1 Project Goals and Objectives<br />
The proposed project would provide an average of approximately four mgd of groundwater to <strong>San</strong><br />
<strong>Francisco</strong>’s municipal water supply from the North Westside Groundwater Basin, which would:<br />
• Increase the use of local water supply sources;<br />
• Reduce dependence on imported water; and<br />
• Expand the SFPUC’s water supply portfolio to increase system reliability.<br />
In addition, the project would ensure the availability of potable groundwater for emergency<br />
supply in the event of an earthquake or other major catastrophe (SFPUC, 2009a).<br />
4.2 Proposed Project<br />
4.2.1 Summary of Proposed Project Components<br />
The proposed project consists of the following components:<br />
• Construction of six groundwater well facilities. This would involve the conversion of two<br />
existing irrigation well facilities to potable groundwater well facilities and the construction<br />
of four new groundwater well facilities. Each facility would include a groundwater<br />
production well and a pump station. Disinfection treatment would be included at the Lake<br />
Merced and West Sunset well facilities.<br />
• Construction of a distribution system (including pipelines and connection points) to<br />
connect five of the groundwater well facilities to Sunset Reservoir. The sixth groundwater<br />
well would connect to the Lake Merced Pump Station, and would require a short length of<br />
distribution piping to make this connection.<br />
The project would be implemented in two phases: (1) construction and operation of the four new<br />
groundwater well facilities to supply an annual average of approximately 2.5 mgd of groundwater,<br />
and construction of well facilities required to convert the two existing irrigation well facilities to<br />
<strong>San</strong> <strong>Francisco</strong> Groundwater Supply Project 4 December 2009<br />
Case No. 2008.1122E<br />
A.1-32
Notice of Preparation<br />
potable groundwater well facilities; and (2) operation of the converted irrigation wells to provide an<br />
additional annual average of approximately 1.5 mgd of groundwater.<br />
Implementation of the proposed project is related to the SFPUC's proposed <strong>San</strong> <strong>Francisco</strong><br />
Westside Recycled Water Project, 1 which consists of development of a new recycled water<br />
supply for non-potable irrigation uses at Golden Gate Park, Lincoln Park Golf Course, and other<br />
areas in <strong>San</strong> <strong>Francisco</strong>. The proposed <strong>San</strong> <strong>Francisco</strong> Westside Recycled Water Project would<br />
replace the existing use of two existing irrigation well facilities at Golden Gate Park with<br />
recycled water. Thus, Phase 2 of the proposed project could be implemented only if the proposed<br />
<strong>San</strong> <strong>Francisco</strong> Westside Recycled Water Project is approved and operational, as Phase 2 of the<br />
proposed project includes the use of those two well facilities for potable water. If the <strong>San</strong><br />
<strong>Francisco</strong> Westside Recycled Water Project is not implemented and a backup source of irrigation<br />
water for Golden Gate Park (i.e., other than groundwater) is not made available, the existing<br />
irrigation wells in Golden Gate Park would not be used to supply municipal water as part of the<br />
<strong>San</strong> <strong>Francisco</strong> Groundwater Supply Project. Under this scenario, the proposed project would only<br />
include operation of four potable wells which may result in some reduction in the average annual<br />
groundwater production.<br />
4.2.2 Proposed Project Component Locations<br />
Proposed Groundwater Well Facility Locations<br />
The project includes three new groundwater well facilities south of Golden Gate Park and, as<br />
described above, would convert two existing irrigation well facilities in Golden Gate Park to potable<br />
use. The project would also consider four alternative locations for one new groundwater well<br />
facility in Golden Gate Park. The proposed and alternative locations for groundwater well facilities<br />
are shown on Figure 1 and described below.<br />
Groundwater Well Facility Sites South of Golden Gate Park<br />
Lake Merced Site. The existing Lake Merced Pump Station is on Lake Merced Boulevard next to<br />
Lake Merced and south of the Harding Park Golf Course. A new well facility would be developed<br />
approximately 300 feet southeast of the existing pump station in an undeveloped area of SFPUCmanaged<br />
property. The SFPUC has an existing test well at this location. This area is restricted from<br />
public use and access.<br />
South Sunset Site. The South Sunset well facility would be developed in the corner of the South<br />
Sunset Playground, at 40th Avenue and Wawona Street, next to a SFRPD-managed public<br />
recreational field used for softball, baseball, and soccer. Residences are located across the street<br />
along 40th Avenue and Wawona Street. The well facility would be constructed within a landscaped<br />
berm adjacent to the sports field. The SFPUC has an existing test well at this location.<br />
1 The <strong>San</strong> <strong>Francisco</strong> Westside Recycled Water Project is one of the projects proposed for implementation under the<br />
WSIP, approved by the SFPUC in October, 2008. The environmental review for the <strong>San</strong> <strong>Francisco</strong> Westside<br />
Recycled Water Project (<strong>San</strong> <strong>Francisco</strong> <strong>Planning</strong> <strong>Department</strong> Case Number 2008.0091E) is proceeding<br />
independently of this project. The NOP for preparation of an EIR for the <strong>San</strong> <strong>Francisco</strong> Westside Recycled Water<br />
Project is expected to be available for public review in the spring of 2010.<br />
<strong>San</strong> <strong>Francisco</strong> Groundwater Supply Project 5 December 2009<br />
Case No. 2008.1122E<br />
A.1-33
Notice of Preparation<br />
West Sunset Site. The West Sunset well facility would be developed at the West Sunset<br />
Playground, at the intersection of 40th Avenue and Quintara Street adjacent to a SFRPD-managed<br />
public recreational field used for softball, baseball and soccer. Residences are located across the<br />
street along Quintara Street. The proposed well facility would be within a portion of the<br />
playground parking lot. The SFPUC has an existing test well at this location.<br />
Existing Well Facilities in Golden Gate Park Proposed for Conversion<br />
South Windmill Deepwell Site. The South Windmill Deepwell facility was constructed in 2001<br />
and is operated by the SFRPD. The facility is within the western area of Golden Gate Park north<br />
of Martin Luther King Jr. Drive. Under the proposed project, the SFPUC would remodel the<br />
existing building, replace the existing pump, and install new piping and valves. Upgrades to the<br />
existing electrical service could also be required.<br />
North Lake Deepwell Site. The North Lake Deepwell facility was constructed in 2001 and is<br />
operated by the SFRPD. The facility is next to Chain of Lakes Drive within the western area of<br />
Golden Gate Park, south of Fulton Street. Under the proposed project, the SFPUC would remodel<br />
the existing building, replace the existing pump, and install new piping and valves. Upgrades to<br />
the existing electrical service could also be required.<br />
Alternative Sites in Golden Gate Park for New Groundwater Well Facility<br />
Polo Field. The Polo Field site is south of John F. Kennedy Drive and Lindley Meadow and north<br />
of the Golden Gate Park Stadium and Polo Fields, near a horse corral and portable storage<br />
container.<br />
Spreckels Lake. The Spreckels Lake site is north of the Model Yacht Club building and west of<br />
36th Avenue and Spreckels Lake.<br />
Urban Forestry Center. The Urban Forestry Center site is to the south of Middle West Drive,<br />
adjacent to and west of the Urban Forestry Center. The SFRPD uses the Urban Forestry Center<br />
buildings and yard areas for park operations and maintenance activities.<br />
Central Pump Station. The Central Pump Station is part of the park’s existing irrigation system,<br />
and is located southeast of the John F. Kennedy Drive/Transverse Drive intersection. The<br />
proposed well site is to the west of the existing fenced Central Pump Station facility. The yard<br />
area at the Central Pump Station is used for the SFRPD’s wood waste storage and composting<br />
operations.<br />
Pipeline Locations<br />
As shown in Figure 1, the proposed groundwater transmission pipelines for five of the well<br />
facilities would connect groundwater well facilities with the Sunset Reservoir. The groundwater<br />
transmission pipelines would be 8 to 16 inches in diameter.<br />
<strong>San</strong> <strong>Francisco</strong> Groundwater Supply Project 6 December 2009<br />
Case No. 2008.1122E<br />
A.1-34
Notice of Preparation<br />
Groundwater drawn from the Lake Merced well facility would be transferred to the Lake Merced<br />
Pump Station via a short connector pipeline, and then conveyed to either the Sunset Reservoir or<br />
the Sutro Reservoir through the Lake Merced Pump Station’s existing pumping and distribution<br />
system.<br />
The SFPUC would install a pipeline along 40th Avenue between Wawona and Quintara Streets to<br />
connect the South Sunset and West Sunset well facilities. The pipeline would extend west along<br />
Quintara Street and northward two blocks along 41st Avenue, and then continue approximately one<br />
mile eastward along Ortega Street to 24th Avenue. The pipeline would continue southward along<br />
24th Avenue for approximately one block, where it would enter the Sunset Reservoir facility. The<br />
pipeline would branch and terminate in the north and south basins of Sunset Reservoir where<br />
groundwater would be blended with the water in storage and then distributed to local customers.<br />
Within Golden Gate Park, potable water wells would be connected to a single pipeline that would<br />
exit the park at Lincoln Way and 41st Avenue (see Figure 1). The pipeline would continue south<br />
approximately one mile along 41st Avenue and then east one block at Quintara Street to connect<br />
to the pipeline alignment at the West Sunset well facility.<br />
4.2.3 Project Construction<br />
Well Facility Construction<br />
Modification of the existing South Windmill Deepwell and North Lake Deepwell facilities could<br />
require demolition of some existing facilities to accommodate the upgraded pumping equipment<br />
and new pipeline connections. In addition, construction of a well facility at the Polo Fields site<br />
would require removal of a horse corral and metal storage container. Tree removal could be<br />
required within the construction and staging areas at several of the proposed facilities.<br />
The conversion of existing test wells and irrigation wells would be required to meet municipal<br />
well construction standards and include the installation of pumps, valves, and electrical utility<br />
connections. Pumps and pump motors would be either vertical turbine or submersible. Well<br />
facility buildings would include noise-limiting, 8- to 10-inch-thick concrete walls, 8-inch-thick<br />
concrete roofs, and small windows with acoustical louvers.<br />
Pipeline Construction<br />
Pipeline construction would require trench corridors that would generally be 10 feet wide for<br />
single pipeline routes, and 16 feet wide along the few segments where two pipelines would run<br />
along the same route (e.g., sections of 41st Avenue, near the West Sunset well facility). A 16-foot<br />
trench corridor would also be required for the Golden Gate Park well facilities that require new<br />
electrical utility connections along the proposed pipeline route (e.g., Polo Field and Spreckels<br />
Lake). Site preparation for pipeline construction could include tree removal or ground clearing of<br />
the work area, as well as grading or pavement cutting.<br />
Figure 1 shows the locations of pipeline infrastructure and connection points with the Lake<br />
Merced Pump Station and the Sunset Reservoir. The pipeline alignment would be located<br />
<strong>San</strong> <strong>Francisco</strong> Groundwater Supply Project 7 December 2009<br />
Case No. 2008.1122E<br />
A.1-35
Notice of Preparation<br />
primarily within existing roadways; after pipeline construction activities were completed,<br />
roadways would be restored to pre-construction conditions. In general, the pipeline routes would<br />
be excavated to a depth of six feet, except where the pipeline enters/exits individual well<br />
facilities. At these locations, the pipeline excavation would be at the same depth as the well<br />
facility connection.<br />
The open-cut trench method would primarily be used for the pipeline construction. This method<br />
involves excavation of the trench, placement of the pipe, backfilling of the trench, and restoration<br />
of the work surface. Typically, excavation of an approximately 4-foot-wide by 6-foot-deep trench<br />
would be required to install the pipeline. In accordance with Occupational Safety and Health<br />
Administration standards, shoring would be required for trenches over 5 feet deep to prevent the<br />
surrounding soil and adjacent structures from collapsing. Dewatering of the trench would be<br />
required if groundwater were encountered.<br />
The pipeline route would cross the Taraval MUNI light rail line at its intersection with<br />
40th Avenue and the Judah MUNI light rail line at its intersection with 41st Avenue. Jack and<br />
bore pipeline (pipe-jacking) construction would be used to tunnel under the light rail lines<br />
without disturbing these rail lines.<br />
Spoils Disposal and Dewatering<br />
Excavated soil would be stockpiled at the construction staging area for reuse at the well facility or<br />
pipeline construction site, or would be disposed of at an appropriate landfill. Most of the spoils<br />
material is expected to be Class III non-hazardous waste.<br />
Dewatering could be required, and would involve pumping water out of the excavated area and,<br />
following appropriate onsite treatment, discharging into a nearby sewer, open channel, or over<br />
land. Dewatering must be performed in accordance with the requirements of the Statewide<br />
General Construction Permit for Stormwater Discharges Associated with Construction Activity<br />
issued by the State Water Resources Control Board, and municipal stormwater permits.<br />
Construction Staging<br />
Except for the Lake Merced site, all of the proposed groundwater well facilities would be located on<br />
SFRPD-managed properties. The SFPUC would coordinate with the SFRPD for final site selection<br />
and determination of construction/staging areas. Pipeline construction would occur within CCSF<br />
roadways, with some pipeline segments between well facilities and paved roadways over land or<br />
within existing trails in Golden Gate Park. All temporary construction easements, where applicable,<br />
would be obtained before the start of construction.<br />
Each well facility and pipeline construction site would require a staging area for equipment and<br />
materials storage (e.g., construction vehicles, building materials, pipes, fuels, lubricants). Staging<br />
areas could also be used for stockpiling excavated soil for reuse. Whenever possible, the project<br />
staging areas would be located on developed or previously disturbed areas, rights-of-way, or<br />
roadsides.<br />
<strong>San</strong> <strong>Francisco</strong> Groundwater Supply Project 8 December 2009<br />
Case No. 2008.1122E<br />
A.1-36
Notice of Preparation<br />
Staging areas would be used for up to 16 months during well facility construction. Pipeline<br />
staging would be located sequentially near the pipeline route, and each staging area would<br />
operate for a seven-week period during pipeline construction. Once a staging area is no longer<br />
needed, the area would be restored to its pre-construction condition. Unpaved roadways would be<br />
restored to pre-project conditions, and roadway pavement would be restored in accordance with<br />
local design specifications.<br />
4.2.4 Construction Schedule<br />
Table 1 provides the approximate duration of construction work necessary at each well facility<br />
and the installation rate for the proposed pipeline system. The construction of new groundwater<br />
well facilities would require approximately 16 months at each site. Construction activities would<br />
occur primarily Monday through Friday during daytime hours (7:00 a.m. to 5:00 p.m.). At some<br />
sites, construction might be necessary during weekend and evening hours to meet construction<br />
requirements. If nighttime work were required, work could be performed between 5:00 p.m. and<br />
7:00 a.m.<br />
TABLE 1<br />
CONSTRUCTION DURATION BY ACTIVITY TYPE<br />
Construction Activity<br />
Well Facility<br />
Site Clearing, Grubbing, and Preparation<br />
Foundation and Utility Connections<br />
Building Construction and Equipment Installation<br />
Start-up and Testing<br />
Total Well Facility Construction Duration<br />
Pipeline Installation (at a rate of 500 to 600 feet per week)<br />
Expected Duration<br />
1 month<br />
3 months<br />
10 months<br />
2 months<br />
16 months<br />
14 to 18 months<br />
Construction of pipelines would occur at the same time as well facility construction. In general,<br />
pipeline installation would progress at a net rate of approximately 100 feet per day for in-street<br />
areas and up to 120 feet per day in off-street areas. However, construction activities might not be<br />
continuous. For example, pipeline installation could begin several days after completion of<br />
excavation, and temporary paving could occur up to several days after completion of backfilling.<br />
Final paving of in-street areas would take place after the above activities and would progress at a<br />
rate of approximately 300 feet per day.<br />
At two locations, beneath the Taraval and Judah MUNI light rail lines, pipe-jacking (jack and<br />
bore) pipeline construction would be necessary, and the duration of this activity would be<br />
approximately three weeks.<br />
<strong>San</strong> <strong>Francisco</strong> Groundwater Supply Project 9 December 2009<br />
Case No. 2008.1122E<br />
A.1-37
Notice of Preparation<br />
4.4 Operations and Maintenance<br />
4.4.1 Operations<br />
Normal daily extraction rates from each of the six wells would be 0.6 to 0.7 mgd, for a total<br />
average of 4 mgd, and would be blended with <strong>San</strong> <strong>Francisco</strong>’s municipal water supply. However,<br />
due to water quality requirements that dictate a ceiling for blending groundwater in the <strong>San</strong><br />
<strong>Francisco</strong> municipal water system, as well as seasonal variations in water demand, production<br />
from the proposed wells could vary on a daily basis. During low-demand periods, such as winter<br />
months when surface water supplies are more abundant and water use is lower, groundwater<br />
extraction would generally be less than 4 mgd. During high-demand periods, the production rate<br />
could be greater than 4 mgd, but the total production rate would be equal to 4 mgd averaged over<br />
a year. During project operation, the SFPUC would monitor groundwater levels and groundwater<br />
quality in the Westside Groundwater Basin monitoring network. The groundwater monitoring<br />
results would be used to detect potential adverse effects of seawater intrusion, changes in water<br />
levels in surface water features (such as Lake Merced and Pine Lake, which is located to the east<br />
of the project area), land subsidence, and interference with other wells. Groundwater pumping<br />
would be balanced between the six groundwater production wells to avoid such effects.<br />
In addition to normal operations, the project would provide an available source of drinking water<br />
in the event that other imported water sources are interrupted due to earthquake damage or other<br />
emergency situations. Each well would be capable of producing up to 1 mgd (each) during a<br />
catastrophic emergency and could operate at this rate for up to 30 days, consistent with level-ofservice<br />
goals established by the SFPUC (2009b). Portable generators would provide backup<br />
power to enable use of the proposed wells during a catastrophic emergency.<br />
4.4.2 Maintenance<br />
During project operation, an operator would make daily visits by truck (of approximately<br />
30-minute duration) to check the equipment at each of the groundwater well facility sites.<br />
Standard Supervisory Control and Data Acquisition (SCADA) equipment would be installed at<br />
each site for remote monitoring of the well facility and pipeline equipment. Longer-term<br />
maintenance would include removal and repair (or replacement) of pumps, valves, and other<br />
equipment. The production wells might require rehabilitation on an infrequent basis. The<br />
estimated operational life of the proposed production wells is 50 years (or more).<br />
5.0 Permits and Approvals Required<br />
The SFPUC may be required to obtain the following permits and approvals for project<br />
construction and operation.<br />
5.1 Federal<br />
Based upon the current understanding of project activities and environmental conditions, no<br />
federal permits or approvals are expected to be required for implementation of the project. This<br />
<strong>San</strong> <strong>Francisco</strong> Groundwater Supply Project 10 December 2009<br />
Case No. 2008.1122E<br />
A.1-38
Notice of Preparation<br />
determination is contingent on the completion of EIR project description and site surveys to be<br />
conducted for analysis of impacts of the proposed project.<br />
5.2 State<br />
• California <strong>Department</strong> of Public Health, Water Supply Division permit amendments and<br />
approval of well construction and operation.<br />
• California <strong>Department</strong> of Toxic Substances Control Contaminated Soil Treatment Work<br />
Plan (required only if contaminated soil were encountered during construction).<br />
• State Water Resources Control Board Stormwater General Permit and Stormwater<br />
Pollution Prevention Plan, if more than 1 acre of land were disturbed.<br />
5.3 Local<br />
• <strong>San</strong> <strong>Francisco</strong> <strong>Planning</strong> Commission certification of the Final EIR.<br />
• <strong>San</strong> <strong>Francisco</strong> <strong>Planning</strong> Commission Coastal Development Permit.<br />
• SFPUC consideration of project approval following certification of the Final EIR, adoption<br />
of CEQA findings, and mitigation monitoring and reporting program.<br />
• <strong>San</strong> <strong>Francisco</strong> Board of Supervisors consideration of any appeals of the <strong>Planning</strong><br />
Commission’s certification of the Final EIR. The <strong>San</strong> <strong>Francisco</strong> Board of Supervisors<br />
would also appropriate funding (general obligation bond monies, annual budget<br />
appropriations) to implement the project.<br />
• Advisory Council on Historic Preservation review, if the project were to affect properties<br />
listed or eligible for listing on the National Register of Historic Places.<br />
• <strong>San</strong> <strong>Francisco</strong> Historic Preservation Commission review of local, state, and national<br />
landmarks and historical landscapes.<br />
• SFRPD determination of project consistency and approval of property use.<br />
• <strong>San</strong> <strong>Francisco</strong> Arts Commission approval of exterior design of proposed facilities.<br />
• <strong>San</strong> <strong>Francisco</strong> <strong>Department</strong> of Public Health approval of well construction and operation<br />
permits in accordance with California <strong>Department</strong> of Water Resources standards.<br />
• <strong>San</strong> <strong>Francisco</strong> <strong>Department</strong> of Public Health approval of Certified Unified Program<br />
Agencies/Hazardous Materials Business Plan for project operations.<br />
• <strong>San</strong> <strong>Francisco</strong> <strong>Department</strong> of Public Works approval of excavation permits, encroachment<br />
permits, and temporary occupancy permits for street space.<br />
• <strong>San</strong> <strong>Francisco</strong> Municipal Railway encroachment permits.<br />
<strong>San</strong> <strong>Francisco</strong> Groundwater Supply Project 11 December 2009<br />
Case No. 2008.1122E<br />
A.1-39
Notice of Preparation<br />
6.0 Environmental Analysis<br />
6.1 Environmental Issues to Be Addressed in the EIR<br />
The EIR will address all environmental issue areas required under CEQA. The EIR will discuss<br />
the environmental impacts of the proposed project due to construction and operation activities,<br />
and will propose mitigation measures for impacts considered to be potentially significant. The<br />
following paragraphs describe the key environmental issues that will be addressed in the EIR.<br />
6.1.1 Land Use and Land Use <strong>Planning</strong><br />
Project construction and operation could affect land uses at the project sites and surrounding<br />
areas. Potential impacts to be evaluated include:<br />
• Temporary and permanent disruption or displacement of existing land uses during<br />
construction—including construction impacts on sensitive land uses such as schools and<br />
residences, and potential temporary closures of some portions of Golden Gate Park, South<br />
Sunset Playground, and West Sunset Playground.<br />
6.1.2 Aesthetics<br />
Project construction and operation could affect aesthetics at the project sites and surrounding<br />
areas. Potential impacts to be evaluated include:<br />
• Impacts on scenic vistas or visual character, including potential impacts on the visual<br />
character of Golden Gate Park, Lake Merced, South Sunset Playground, and West Sunset<br />
Playground.<br />
6.1.3 Cultural Resources<br />
The project could potentially affect archaeological, historical, or paleontological resources<br />
through ground-disturbing activities during construction, or by introducing new facilities that<br />
could compromise the historical integrity of historical buildings or landscapes. Potential impacts<br />
to be evaluated include:<br />
• Impacts on archaeological and paleontological resources.<br />
• Impacts on the historical significance of a historic district, contributor to a historic district,<br />
or historic landscape. Of particular focus will be the proposed well facilities in Golden Gate<br />
Park.<br />
6.1.4 Traffic, Transportation, and Circulation<br />
Construction could have temporary impacts on traffic volumes, traffic safety, and parking in the<br />
vicinity of the groundwater pipelines, well facility sites, and the Sunset Reservoir. Potential<br />
impacts to be evaluated include:<br />
<strong>San</strong> <strong>Francisco</strong> Groundwater Supply Project 12 December 2009<br />
Case No. 2008.1122E<br />
A.1-40
Notice of Preparation<br />
• Temporary reduction in roadway capacity and increase in traffic delays, including impacts<br />
from short-term closure of one parking and/or traffic lane.<br />
• Temporary displacement of on- or off-street parking.<br />
6.1.5 Noise and Vibration<br />
Project construction noise and vibration impacts associated with facility construction would be<br />
temporary and short term. However, operation of the proposed pumps, building ventilation fans,<br />
and chemical treatment equipment could create permanent noise impacts. Potential impacts to be<br />
evaluated include:<br />
• Impacts of construction noise and vibration on sensitive receptors in the vicinity of project<br />
construction sites, especially sensitive land uses such as schools and residences.<br />
• Operational noise impacts from groundwater well facilities, including pumps, building<br />
ventilation fans, and groundwater treatment equipment.<br />
6.1.6 Air Quality<br />
Effects on air quality from the project would largely be associated with construction activities<br />
and, as such, would be temporary and short term. Potential impacts to be evaluated include:<br />
• Impacts of construction emissions, including dust and greenhouse gases.<br />
• Consistency with regional air quality plans.<br />
• Consistency with state laws regarding greenhouse gases.<br />
6.1.7 Recreation<br />
Project construction could temporarily disrupt recreational uses in the vicinity of the well facility<br />
sites as a result of noise, dust, and temporary access restrictions. The EIR will evaluate project<br />
impacts on recreational resources. Potential impacts to be evaluated include:<br />
• Temporary and permanent impacts on recreational facilities, including but not limited to<br />
closure of some portions of the South Sunset Playground, West Sunset Playground, and<br />
Golden Gate Park.<br />
6.1.8 Biological Resources<br />
Temporary impacts on biological resources could result from construction activities related to<br />
noise, vibration and dust. Potential impacts to be evaluated include:<br />
• Impacts on sensitive wildlife habitats (including wetlands), migration corridors, and<br />
protected/heritage trees.<br />
• Impacts on special-status wildlife and plant species (direct mortality and/or habitat effects).<br />
<strong>San</strong> <strong>Francisco</strong> Groundwater Supply Project 13 December 2009<br />
Case No. 2008.1122E<br />
A.1-41
Notice of Preparation<br />
6.1.9 Geology, Soils, and Seismicity<br />
Construction and operation of new well facilities and below-ground distribution pipelines could<br />
result in site-specific impacts on or from local geology and soils conditions. Potential impacts to<br />
be evaluated include:<br />
• Seismic hazards and/or increased exposure of structures to seismic hazards, including<br />
impacts from ground-shaking in the event of an earthquake on the <strong>San</strong> Andreas fault or<br />
other Bay Area faults.<br />
• Increased exposure of structures to geologic hazards (such as liquefaction, poor soil<br />
conditions, or unstable slopes) from construction in geologic hazard zones.<br />
• Soil erosion potential from construction activities.<br />
• Potential for land subsidence from decreases in groundwater level elevations (drawdown)<br />
in the groundwater aquifer.<br />
6.1.10 Hydrology and Water Quality<br />
Project construction could affect surface and groundwater water quality in the project area.<br />
Project operation could affect groundwater levels and quality in the project area and in the<br />
Westside Groundwater Basin. Potential impacts to be evaluated include:<br />
• Changes in local groundwater quality and levels within the project area and the Westside<br />
Groundwater Basin.<br />
• Depletion of groundwater supplies or interference with groundwater recharge such that<br />
production rates of preexisting wells in the Westside Groundwater Basin would drop to a<br />
level that would not support existing or planned land uses, seawater intrusion would occur,<br />
or land subsidence would result.<br />
• Changes in surface water bodies or other surface water features, such as Lake Merced, due<br />
to changes in groundwater levels in the Westside Groundwater Basin.<br />
• Changes in drinking water quality due to blending of treated groundwater with the<br />
imported treated surface water supply.<br />
• Alteration of drainage patterns and increase in stormwater flows due to increase in the<br />
amount of impervious surfaces.<br />
• Degradation of surface and groundwater water quality as a result of erosion and<br />
sedimentation, hazardous materials release during construction, and construction<br />
dewatering discharges.<br />
6.1.11 Other Environmental Issues<br />
Other environmental issues that will be evaluated in the EIR include the project’s potential<br />
impacts on population and housing; wind and shadow; utilities and service systems; public<br />
services, including the project’s beneficial effect on water supply; hazards, including the potential<br />
<strong>San</strong> <strong>Francisco</strong> Groundwater Supply Project 14 December 2009<br />
Case No. 2008.1122E<br />
A.1-42
Notice of Preparation<br />
hazards from chemical storage at the well sites; mineral and energy resources; and agricultural<br />
resources.<br />
The EIR will evaluate any potential growth-inducing impacts that could result from<br />
implementation of the proposed project. The EIR will also address whether the project could<br />
result in impacts that would be significant when combined with the impacts of other SFPUC or<br />
non-SFPUC projects occurring concurrently within the same geographic area.<br />
6.2 Alternatives<br />
CEQA requires that an EIR evaluate a reasonable range of feasible alternatives to the project, or<br />
to the project location that would attain most of the project objectives but avoid or substantially<br />
lessen any of the significant effects of the project. The EIR will identify the potentially significant<br />
impacts of the proposed project. The findings of the EIR impact analysis will guide the<br />
refinement of an appropriate range of alternatives to be evaluated in the EIR that would avoid or<br />
substantially lessen significant impacts, while still meeting project objectives. Alternatives<br />
suggested during the public scoping period will also be considered. The EIR will also discuss<br />
impacts associated with the No Project Alternative.<br />
7.0 References<br />
<strong>San</strong> <strong>Francisco</strong> <strong>Planning</strong> <strong>Department</strong>, Program Environmental Impact Report on the <strong>San</strong> <strong>Francisco</strong><br />
Public Utilities Commission's Water System Improvement Program, October 2008.<br />
<strong>San</strong> <strong>Francisco</strong> Public Utilities Commission (SFPUC), Water System Improvement Program<br />
California Environmental Quality Act Findings: Findings of Fact, Evaluation of Mitigation<br />
Measures and Alternatives, and Statement of Overriding Considerations, October 2008<br />
(Attachment A to SFPUC Resolution No. 08-0200, adopted October 30, 2008).<br />
<strong>San</strong> <strong>Francisco</strong> Public Utilities Commission (SFPUC), CUW 30102 – North Westside Basin Local<br />
Supply (Groundwater Project B), CER Checklist for Environmental Review (Project<br />
Description Requirements), March 25, 2009a.<br />
<strong>San</strong> <strong>Francisco</strong> Public Utilities Commission (SFPUC), Operation Plans for Environmental Review<br />
Purposes – WSIP Groundwater Projects, June 30, 2009b.<br />
<strong>San</strong> <strong>Francisco</strong> Groundwater Supply Project 15 December 2009<br />
Case No. 2008.1122E<br />
A.1-43
This page intentionally left blank<br />
A.1-44
APPENDIX B<br />
Scoping Meeting Materials<br />
<strong>San</strong> <strong>Francisco</strong> Groundwater Supply Project B-1 April 2010<br />
Case No. 2008.1122E<br />
Administrative Draft – Subject to Change<br />
A.1-45
This page intentionally left blank<br />
A.1-46
SAN FRANCISCO PLANNING DEPARTMENT<br />
Public Scoping Meeting<br />
Proposed <strong>San</strong> <strong>Francisco</strong> Groundwater Supply Project<br />
Golden Gate Park Senior Center, <strong>San</strong> <strong>Francisco</strong> – January 20, 2010<br />
AGENDA<br />
Starting promptly at 7:00 PM<br />
Introductions – Jamie Dean, <strong>San</strong> <strong>Francisco</strong> <strong>Planning</strong> <strong>Department</strong><br />
Environmental Review Process Overview – Jamie Dean, <strong>San</strong> <strong>Francisco</strong> <strong>Planning</strong> <strong>Department</strong><br />
Project Overview – Jeff Gilman, <strong>San</strong> <strong>Francisco</strong> Public Utilities Commission<br />
Public Comment<br />
Closing Remarks – Jamie Dean, <strong>San</strong> <strong>Francisco</strong> <strong>Planning</strong> <strong>Department</strong><br />
MEA: Major Environmental Analysis Division, <strong>San</strong> <strong>Francisco</strong> <strong>Planning</strong> <strong>Department</strong><br />
SFPUC: <strong>San</strong> <strong>Francisco</strong> Public Utilities Commission<br />
Glossary<br />
CEQA: California Environmental Quality Act<br />
EIR: Environmental Impact Report<br />
WSIP: Water System Improvement Program<br />
Documents Currently<br />
Available<br />
The following documents are available online at http://mea.sfplanning.org or<br />
by calling 415.575.9028:<br />
- Project Notice of Preparation<br />
- Program EIR for the SFPUC Water System Improvement Program<br />
For More Information<br />
<strong>Planning</strong> <strong>Department</strong> Web Site: http://mea.sfplanning.org<br />
SFPUC Web Site: www.sfwater.org<br />
For EIR: Jamie Dean at SF <strong>Planning</strong>, (415) 575-9030 or jamie.dean@sfgov.org<br />
For Project: Michelle Liapes at SFPUC, (415) 554-3211 or mliapes@sfwater.org<br />
A.1-47
Scoping Meeting Agenda<br />
<strong>San</strong> <strong>Francisco</strong> <strong>Planning</strong> <strong>Department</strong><br />
Major Environmental Analysis Division<br />
SCOPING MEETING<br />
SAN FRANCISCO GROUNDWATER SUPPLY PROJECT<br />
Environmental Impact Report<br />
JANUARY 20, 2010<br />
• Introductions<br />
• Presentation<br />
<br />
<br />
Overview of Environmental Review Process<br />
Overview of <strong>San</strong> <strong>Francisco</strong> Groundwater<br />
Supply Project<br />
• Public Comments<br />
• Closing Remarks<br />
A.1-48<br />
Scoping Meeting Purpose<br />
Scoping Meeting Reminders<br />
• Hear your comments on the proposed scope<br />
and focus of environmental review of the<br />
proposed <strong>San</strong> <strong>Francisco</strong> Groundwater Supply<br />
Project<br />
• Help identify the following to be analyzed<br />
in depth:<br />
Range of alternatives<br />
Environmental effects<br />
Methods of assessment<br />
Mitigation measures<br />
• Sign in at the table near the entrance.<br />
• Pick up copies of meeting materials.<br />
• If you would like to speak during tonight’s<br />
hearing, fill out a speaker card.<br />
• To make written comments, pick up comment<br />
cards.<br />
Drop off at the end of the meeting<br />
Mail or fax later<br />
• Please hold all comments until the end of the<br />
presentation.
Project Team Introductions<br />
California Environmental Quality Act<br />
• <strong>San</strong> <strong>Francisco</strong> <strong>Planning</strong> <strong>Department</strong><br />
(Lead Agency under CEQA)<br />
Jamie Dean, Environmental Planner<br />
• <strong>San</strong> <strong>Francisco</strong> Public Utilities Commission<br />
(Project Sponsor)<br />
<br />
<br />
<br />
<br />
<br />
Jeff Gilman, C.HG., Project Manager<br />
YinLan Zhang, Environmental Project Manager<br />
Michele Liapes, Communications<br />
Debra Temple, P.E., Project Engineer (<strong>Department</strong> of<br />
Public Works)<br />
Alan R. Wong, P.E., Water Quality Division<br />
Proposed projects require environmental<br />
review under the California Environmental<br />
Quality Act (CEQA) before they can be<br />
considered for approval<br />
For SFPUC projects, CEQA is implemented by<br />
the <strong>San</strong> <strong>Francisco</strong> <strong>Planning</strong> <strong>Department</strong><br />
A.1-49<br />
CEQA Objectives<br />
ENVIRONMENTAL<br />
REVIEW PROCESS<br />
• Present environmental impacts of proposed<br />
projects<br />
• Identify ways to avoid or reduce environmental<br />
impacts<br />
• Support the agency decision-making process<br />
• Encourage public participation<br />
• Enhance interagency coordination
What will the EIR do?<br />
SFPUC <strong>San</strong> <strong>Francisco</strong> Municipal<br />
Water System<br />
• Provide a detailed description of the project and<br />
the existing environment<br />
• Identify potential environmental impacts<br />
• Identify ways to avoid or reduce significant<br />
environmental effects through mitigation or<br />
alternatives to the proposed project<br />
A.1-50<br />
Water System Improvement Program (WSIP)<br />
• Bond-funded program approved by voters in<br />
November 2002<br />
PROPOSED SAN FRANCISCO<br />
GROUNDWATER SUPPLY<br />
PROJECT<br />
• Approximately 85 projects to:<br />
repair, replace and seismically upgrade key water<br />
system facilities<br />
add new, redundant facilities to insure system<br />
reliability<br />
develop new sources of groundwater and<br />
recycled water<br />
• October 2008 – the WSIP Program EIR was<br />
certified, and the WSIP was adopted
Need for the Project<br />
Westside Basin Aquifer<br />
• WSIP requires 10 million gallons per day<br />
(mgd) of new local water supply<br />
• Combination of sources to meet 10 mgd goal:<br />
Conservation<br />
Recycled Water<br />
New Groundwater<br />
Existing Groundwater (convert irrigation use)<br />
• SF Groundwater Supply Project is part of<br />
portfolio of new sources<br />
North Westside<br />
Basin (SF part of<br />
aquifer system)<br />
Mainly used for<br />
irrigation for past<br />
50+ years<br />
Municipal and<br />
irrigation use in<br />
northern <strong>San</strong><br />
Mateo County<br />
A.1-51<br />
What is Groundwater?<br />
• Water-saturated geologic deposits<br />
• Aquifer (underground reservoir)<br />
Potential Well Locations<br />
• 9 potential well sites advanced for<br />
environmental analysis<br />
• 6 well facilities would be developed<br />
• “well facility” = production well + pump<br />
station<br />
• size of well facilities<br />
Length – 20 to 30 feet Width – 40 to 60 feet<br />
Height – 12 to 16 feet
Groundwater Quality<br />
• Groundwater samples analyzed from test<br />
wells and existing Golden Gate Park<br />
irrigation wells<br />
• Groundwater meets all health- based<br />
drinking water standards (US EPA and CA<br />
DPH)<br />
• Groundwater is safe to drink even before<br />
blending<br />
• Groundwater monitoring program<br />
A.1-52<br />
How Would the Project Work?<br />
Operation of the Well Facilities<br />
• Produce 4 mgd of groundwater (on average)<br />
from 6 wells<br />
• Disinfect groundwater per CA Dept. of<br />
Public Health requirements<br />
• Pipe groundwater to Sunset Reservoir and<br />
Lake Merced Pump Station for blending and<br />
distribution in <strong>San</strong> <strong>Francisco</strong><br />
• Why blend the groundwater?<br />
Maintain consistency in taste for customers<br />
Avoid adding other water treatment chemicals<br />
• Normal Operation<br />
Wells would operate daily<br />
Average annual groundwater production 4 mgd<br />
Variations in production in response to overall<br />
SF water demand<br />
• Emergency Operation<br />
Each well capable of producing up to 1 mgd<br />
during a catastrophic emergency<br />
North Lake and West Sunset well facilities<br />
designed to operate using emergency power<br />
supply
Environmental Review Schedule<br />
Comment Session Ground Rules<br />
• Notice of Preparation – December 30, 2009<br />
• Public Scoping Meeting – January 20, 2010<br />
• Scoping Period Ends – January 29, 2010<br />
• Public Review of Draft EIR – Winter 2011<br />
• Release of Final EIR – Fall 2011<br />
• Certification of Final EIR – Fall 2011<br />
• Submit speaker cards to speak<br />
• Wait until your name is called<br />
• Speak into the microphone and state your<br />
name<br />
• Summarize comments verbally and provide<br />
more detail in writing<br />
• Use comment forms for more extensive<br />
input<br />
A.1-53<br />
PUBLIC COMMENT<br />
CLOSING REMARKS
Where to Send Comments<br />
Scoping comments accepted through January 29, 2010<br />
Send by email to: jamie.dean@sfgov.org<br />
Send by fax to: (415) 558- 6409<br />
Send by U.S. mail to:<br />
<strong>San</strong> <strong>Francisco</strong> <strong>Planning</strong> Dept<br />
Attn: Bill Wycko, ERO<br />
<strong>San</strong> <strong>Francisco</strong> Groundwater Supply Project<br />
1650 Mission Street, Suite 400<br />
<strong>San</strong> <strong>Francisco</strong>, CA 94103<br />
A.1-54<br />
For More Information<br />
About the Environmental Review Process:<br />
Jamie Dean, <strong>San</strong> <strong>Francisco</strong> <strong>Planning</strong> <strong>Department</strong>,<br />
Major Environmental Analysis Division<br />
(415) 575-9028, jamie.dean@sfgov.org<br />
The Notice of Preparation is available online at<br />
http://mea.sfplanning.org<br />
About the <strong>San</strong> <strong>Francisco</strong> Groundwater Supply<br />
Project<br />
Michele Liapes, SFPUC Communications<br />
(415) 554-3211, mliapes@sfwater.org
SAN FRANCISCO PLANNING DEPARTMENT<br />
Public Scoping Meeting<br />
<strong>San</strong> <strong>Francisco</strong> Groundwater Supply Project<br />
Location: Golden Gate Park Senior Center Date: January 20, 2010<br />
SPEAKER CARD<br />
CONTACT INFORMATION<br />
Name:<br />
Affiliation:<br />
Street Address:<br />
City, State, Zip:<br />
Phone:<br />
Email:<br />
A.1-55
SAN FRANCISCO PLANNING DEPARTMENT<br />
Public Scoping Meeting<br />
<strong>San</strong> <strong>Francisco</strong> Groundwater Supply Project<br />
January 20, 2010<br />
Thank you for participating in tonight’s Public Scoping Meeting on the <strong>San</strong> <strong>Francisco</strong> Groundwater Supply Project. Your comments on the scope and<br />
focus of the environmental review are encouraged. The <strong>San</strong> <strong>Francisco</strong> <strong>Planning</strong> <strong>Department</strong> will accept written comments until the close of business<br />
on January 30, 2010.<br />
Name (please print):<br />
Affiliation (if applicable):<br />
Phone:<br />
Email:<br />
Address:<br />
City, State, Zip:<br />
COMMENTS<br />
CONTINUED ON BACK<br />
Mail comments to: Bill Wycko, <strong>San</strong> <strong>Francisco</strong> <strong>Planning</strong> <strong>Department</strong> <strong>San</strong> <strong>Francisco</strong> Groundwater Supply Project,<br />
1650 Mission Street, Suite 400, <strong>San</strong> <strong>Francisco</strong>, CA 94103<br />
Fax: (415) 558-6409 Email: jamie.dean@sfgov.org<br />
For more information on the SFPUC’s project, contact Michelle Liapes, SFPUC Communications Division, mliapes@sfwater.org and 415-554-3211<br />
A.1-56
COMMENTS (Continued)<br />
A.1-57
A.1-58
A.1-59
A.1-60
A.1-61
A.1-62
A.1-63
A.1-64
A.1-65
A.1-66
APPENDIX C<br />
Scoping Meeting Transcripts<br />
<strong>San</strong> <strong>Francisco</strong> Groundwater Supply Project C-1 April 2010<br />
Case No. 2008.1122E<br />
Administrative Draft – Subject to Change<br />
A.1-67
This page intentionally left blank<br />
A.1-68
1<br />
2<br />
3 SAN FRANCISCO PLANNING DEPARTMENT<br />
4 SCOPING MEETING<br />
5 SAN FRANCISCO GROUNDWATER SUPPLY PROJECT<br />
6 ENVIRONMENTAL IMPACT REPORT<br />
7<br />
8 Wednesday, January 20, 2010<br />
9<br />
10 Golden Gate Senior Center<br />
11 6101 Fulton Street<br />
12 <strong>San</strong> <strong>Francisco</strong>, California<br />
13<br />
14<br />
15<br />
16<br />
17<br />
18<br />
19<br />
20<br />
21<br />
22<br />
23<br />
24<br />
25 REPORTED BY: DEBORAH FUQUA, CSR #12948<br />
1<br />
A.1-69
1<br />
2 APPEARANCES<br />
3<br />
4 SAN FRANCISCO PLANNING DEPARTMENT<br />
(Lead Agency under CEQA)<br />
5<br />
JAMIE DEAN, Environmental Planner,<br />
6<br />
7 SAN FRANCISCO PUBLIC UTILITIES COMMISSION<br />
(Project Sponsor)<br />
8<br />
JEFF GILMAN, C.HG., Project Manager<br />
9<br />
YINLAN ZHANG, Environmental Project Manager<br />
10<br />
MICHELE LIAPES, Communications<br />
11<br />
DEBRA TEMPLE, P.E., Project Engineer (<strong>Department</strong><br />
12 of Public Works)<br />
13 ALAN R. WONG, P.E., Water Quality Division<br />
14<br />
15 ---o0o---<br />
16<br />
17 PUBLIC COMMENTS: PAGE NUMBER<br />
18 Andrew Chan.............................19<br />
19 Steve Lawrence..........................20<br />
20 Dan Murphy..............................23<br />
21 Joan Girardot...........................24<br />
22 Joyce Law...............................26<br />
23 Nicole Iroz-Elardo......................27<br />
24 Kathy Symkowick.................(NO RESPONSE)<br />
25<br />
2<br />
A.1-70
1 Wednesday, January 20, 2010 7:01 o'clock p.m.<br />
2 ---o0o---<br />
3 P R O C E E D I N G S<br />
4 JAMIE DEAN: Hello and good evening. My name is<br />
5 Jamie Dean, and I'm with the <strong>San</strong> <strong>Francisco</strong> <strong>Planning</strong><br />
6 <strong>Department</strong>. Welcome to this evening's scoping meeting<br />
7 on the <strong>San</strong> <strong>Francisco</strong> Groundwater Supply Project.<br />
8 So just to go over the purpose for this<br />
9 evening's meeting, the reason that we're all here is to<br />
10 hear from you and to receive your comments on the scope<br />
11 and focus on the environmental review for the proposed<br />
12 project. Your comments will assist the <strong>Planning</strong><br />
13 <strong>Department</strong>, by sharing any information that you have,<br />
14 in completing the environmental impact report, or EIR,<br />
15 for the proposed project. Your comments can assist us<br />
16 in providing information on the range of project<br />
17 alternatives, the environmental effects on the proposed<br />
18 project, the methods of assessment, as well as<br />
19 developing mitigation measures to address potential<br />
20 project impacts.<br />
21 So after I introduce the folks that are with<br />
22 us this evening, I will provide a brief overview on the<br />
23 environmental review process. And then the <strong>San</strong><br />
24 <strong>Francisco</strong> Public Utilities Commission, who is the<br />
25 project sponsor, will provide an overview of the<br />
3<br />
A.1-71
1<br />
project characteristics.<br />
2 Following these presentations, we will then<br />
3 open the meeting to hear from you and to receive your<br />
4 comments on the proposed environmental review.<br />
5 I would also like to point out that we do have<br />
6 a court reporter here this evening that will be taking<br />
7 a transcript of this meeting that will go into the<br />
8 environmental review record.<br />
9 Just a few reminders: We do ask that you<br />
10 please sign in at the back table so that we can keep in<br />
11 touch with you as we move through the environmental<br />
12 review process. We also have quite a few meeting<br />
13 materials at the back table that you're welcome to pick<br />
14 up. If you do wish to make comments tonight, we ask<br />
15 that you please complete a speaker card, and we will be<br />
16 calling names as we receive them. If you don't wish to<br />
17 speak tonight, or you wish to augment your verbal<br />
18 comments with written comments, you're welcome to do so<br />
19 by completing the comment cards that we have in the<br />
20 back of the room. And we'll accept those both this<br />
21 evening as well as through the scoping period, which<br />
22 will extend through the end of this month.<br />
23 Just to let you know, the restrooms are<br />
24 located behind me, behind this screen. And we do ask<br />
25 that you please turn off your cell phone ringers and,<br />
4<br />
A.1-72
1<br />
if you do need to make a call, that you please step<br />
2 outside.<br />
3 So as I mentioned, my name is Jamie Dean, and<br />
4 I'm here representing the <strong>San</strong> <strong>Francisco</strong> <strong>Planning</strong><br />
5 <strong>Department</strong>. We also have a number of people here<br />
6 representing the <strong>San</strong> <strong>Francisco</strong> Public Utilities<br />
7 Commission. We have Jeff Gilman, who is the project<br />
8 manager; YinLan Zhang, who is the environmental project<br />
9 manager; Michele Liapes, who is with the communications<br />
10 department; and we have Debra Temple, who is here with<br />
11 the public works department; and we have Allen R. Wong,<br />
12 who is with the water quality commission for the SFPUC.<br />
13 Now I'll take a moment to provide an overview<br />
14 on the environmental review process. The California<br />
15 Environmental Quality Act, or CEQA, requires that a<br />
16 proposed project undergo the environmental review<br />
17 process before it can be considered for project<br />
18 approval.<br />
19 Under CEQA, essentially, a document is<br />
20 providing information on the environmental effects of<br />
21 the project and disclosing this information both to the<br />
22 public as well as decision makers. For projects<br />
23 sponsored by or within the City and County of <strong>San</strong><br />
24 <strong>Francisco</strong>, the <strong>San</strong> <strong>Francisco</strong> <strong>Planning</strong> <strong>Department</strong> is the<br />
25 lead agency pursuant to CEQA.<br />
5<br />
A.1-73
1<br />
The objectives of CEQA are to present the<br />
2 environmental effects of the proposed project. The<br />
3 documents that are proposed under CEQA also identify<br />
4 ways to reduce or avoid project impacts. And this is<br />
5 through the identification of mitigation measures or<br />
6 through project alternatives. CEQA is also intended to<br />
7 support the agency decision-making process and<br />
8 encourage public participation as well as enhance<br />
9 interagency coordination.<br />
10 So just to go over what the environmental<br />
11 impact report will do, the EIR will do a number of<br />
12 things. First off, it will describe the proposed<br />
13 project in detail. It will also provide an overview of<br />
14 the existing conditions or the existing physical<br />
15 environment that could be affected by the proposed<br />
16 project.<br />
17 The EIR will also disclose the potential<br />
18 environmental effects that are associated with the<br />
19 proposed project and identify ways to avoid or mitigate<br />
20 those potential impacts.<br />
21 So next I'd like to turn the presentation over<br />
22 to Jeff, who will go over the project characteristics.<br />
23 JEFF GILMAN: Good evening. I'm Jeff Gilman. I'm<br />
24 a project manager with the <strong>San</strong> <strong>Francisco</strong> Public<br />
25 Utilities Commission, and I'm also a certified<br />
6<br />
A.1-74
1<br />
hydrogeologist, which means that I am a licensed<br />
2 professional, licensed to practice hydrogeology or<br />
3 groundwater -- to work on groundwater projects in the<br />
4 State of California.<br />
5 I want to thank everybody for coming out on<br />
6 this rainy week to our scoping meeting. And I do have<br />
7 to say, though, it's times like this, seeing all that<br />
8 rain, that make hydrogeologists very excited because we<br />
9 see all this recharge going down into our groundwater<br />
10 basin.<br />
11 First, I want to start by showing you an<br />
12 overview of our Hetch Hetchy Water System. This may be<br />
13 common knowledge to a lot of you, but I think it helps<br />
14 explain, you know, where <strong>San</strong> <strong>Francisco</strong> is within this<br />
15 system and why we actually need this groundwater<br />
16 project.<br />
17 The <strong>San</strong> <strong>Francisco</strong> Municipal Water System is<br />
18 actually a separately permitted system by the State of<br />
19 California. And it sits at what I consider to be the<br />
20 tail end of the Hetch Hetchy Regional System.<br />
21 So our regional system has several reservoirs.<br />
22 The biggest is the Hetch Hetchy Reservoir in Yosemite<br />
23 National Park. And the water basically is flowing by<br />
24 gravity from the mountains down to <strong>San</strong> <strong>Francisco</strong> and<br />
25 the <strong>San</strong> <strong>Francisco</strong> peninsula. We have some reservoirs<br />
7<br />
A.1-75
1<br />
in the East Bay -- <strong>San</strong> Antonio and Calaveras. And then<br />
2 we have some reservoirs on the Peninsula -- the Crystal<br />
3 Springs and <strong>San</strong> Andreas Reservoirs. But it isn't until<br />
4 the very tail end, that is where the <strong>San</strong> <strong>Francisco</strong><br />
5 Municipal Water System lies.<br />
6 So when you think about it, <strong>San</strong> <strong>Francisco</strong> has<br />
7 to import all of its drinking water. And of that<br />
8 imported water, about 85 percent of that comes from the<br />
9 Hetch Hetchy Reservoir and about 15 percent from what<br />
10 we consider the local reservoirs in the East Bay and on<br />
11 the Peninsula.<br />
12 The proposed <strong>San</strong> <strong>Francisco</strong> Groundwater Supply<br />
13 Project that I'm going to talk about is part of the<br />
14 larger Water System Improvement Program currently being<br />
15 undertaken by the <strong>San</strong> <strong>Francisco</strong> PUC. The Water System<br />
16 Improvement Program, we usually call WSIP or W-S-I-P<br />
17 for short. And this is a bond-funded program. It was<br />
18 approved by the voters in 2002. And among the goals --<br />
19 well, I should say that it consists of approximately 85<br />
20 separate projects of different goals.<br />
21 Among these goals are to repair, replace, and<br />
22 seismically upgrade key water system facilities; to add<br />
23 new redundant facilities to ensure system reliability;<br />
24 and part of the objectives is to develop new sources of<br />
25 groundwater and recycled water, so new supplies for our<br />
8<br />
A.1-76
1<br />
water system.<br />
2 In October 2008, the WSIP Program<br />
3 Environmental Impact Report or Program EIR was<br />
4 certified by the <strong>San</strong> <strong>Francisco</strong> <strong>Planning</strong> <strong>Department</strong>, and<br />
5 the WSIP was adopted.<br />
6 As part of that program that was adopted by<br />
7 Public Utilities Commission and certified by the<br />
8 <strong>Planning</strong> <strong>Department</strong>, it requires that the <strong>San</strong> <strong>Francisco</strong><br />
9 regional system has to develop 10 million gallons a day<br />
10 of new local water supply sources. And we have come up<br />
11 with a combination of things to try to meet that<br />
12 10-million-gallons-a-day goal.<br />
13 One of the items is conservation. There has<br />
14 been lots of conservation in <strong>San</strong> <strong>Francisco</strong>, but this is<br />
15 a more aggressive program to do more conservation. We<br />
16 also have a Westside Recycled Water Project. And we're<br />
17 looking into more recycled water opportunities on the<br />
18 east side of <strong>San</strong> <strong>Francisco</strong>.<br />
19 And then what I'm going to talk about tonight<br />
20 is new groundwater sources, so groundwater in <strong>San</strong><br />
21 <strong>Francisco</strong> that currently is not being utilized, as well<br />
22 as existing groundwater that is being utilized for<br />
23 irrigation and other non-potable uses. But if we can<br />
24 find other sources to take the place for non-potable<br />
25 use, then we can use that groundwater for municipal<br />
9<br />
A.1-77
1<br />
supply.<br />
2 And so the -- just want to summarize this<br />
3 point by saying the <strong>San</strong> <strong>Francisco</strong> Groundwater Supply<br />
4 Project is part of this portfolio of new water supply<br />
5 projects.<br />
6 Before getting into the detailed description<br />
7 of the project, I just want to make sure I explain what<br />
8 groundwater is. And it really is a pretty simple<br />
9 definition. It is water-saturated geologic deposits.<br />
10 And if you think about going down to the beach, Ocean<br />
11 Beach, sticking your feet in the sand and when you<br />
12 burrow down a little bit, all of a sudden you see that<br />
13 water that was stored in between the little particles<br />
14 of sand; you see it come up to the surface. That is<br />
15 water-saturated deposits.<br />
16 And if we have a large underground area of<br />
17 those water-saturated deposits and that material is<br />
18 permeable enough to where we can actually tap into that<br />
19 with wells and pump it and use it, we call it an<br />
20 aquifer. Or another name for an aquifer is an<br />
21 underground reservoir. And much like the PUC manages<br />
22 its surface-water reservoirs, we can manage and we have<br />
23 to manage a groundwater reservoir or an aquifer.<br />
24 The aquifer that we are planning to use or<br />
25 proposing to use for the <strong>San</strong> <strong>Francisco</strong> Groundwater<br />
10<br />
A.1-78
1<br />
Supply Project is called the Westside Basin Aquifer.<br />
2 And that is actually one of seven aquifers that<br />
3 underlie the city and county of <strong>San</strong> <strong>Francisco</strong>.<br />
4 And this map shows those seven different<br />
5 basins, groundwater basins or aquifers, in different<br />
6 colors. And I'll just point out the Westside Basin.<br />
7 So that is in the western part of <strong>San</strong> <strong>Francisco</strong>. It<br />
8 extends from a little bit north of Golden Gate Park<br />
9 down through the Sunset District, through Lake Merced.<br />
10 And the Westside Basin actually extends down into <strong>San</strong><br />
11 Mateo County, through Daly City, and then it trends<br />
12 southeastward and ends up coming out by <strong>San</strong> <strong>Francisco</strong><br />
13 Airport in the Millbrae and Burlingame area.<br />
14 And the reason we are targeting that Westside<br />
15 Basin is it's the largest aquifer in <strong>San</strong> <strong>Francisco</strong>.<br />
16 It's in the area where there's been the least amount of<br />
17 industrial or other types of development where we might<br />
18 have to worry about the water quality of that aquifer.<br />
19 And it actually has been used on a limited basis for<br />
20 water supply -- not for drinking water supply but for<br />
21 irrigation water supply -- for over 50 years for<br />
22 watering Golden Gate Park, for supplying non-potable<br />
23 uses at <strong>San</strong> <strong>Francisco</strong> Zoo, and then there are a few<br />
24 other small private irrigation uses of that aquifer.<br />
25 Another point that's important is that the<br />
11<br />
A.1-79
1<br />
Westside Basin does continue south of the<br />
2 <strong>San</strong> <strong>Francisco</strong>-<strong>San</strong> Mateo county line. North of that<br />
3 line, we usually refer to that as the North Westside<br />
4 Basin and south of the line as South Westside Basin.<br />
5 But in <strong>San</strong> Mateo County, the aquifer has been used for<br />
6 municipal supply by Daly City, South <strong>San</strong> <strong>Francisco</strong>, <strong>San</strong><br />
7 Bruno. It also has been used for irrigation, for<br />
8 watering cemeteries and golf courses. So it's used --<br />
9 sorry. It's been used in <strong>San</strong> Mateo County for, I would<br />
10 say, 60 or more years for both municipal and for<br />
11 irrigation and other non-potable uses.<br />
12 So turning now to the proposed <strong>San</strong> <strong>Francisco</strong><br />
13 Groundwater Supply Project, the infrastructure, the<br />
14 physical facilities that we would use for that project,<br />
15 we're proposing six well facilities and then pipelines<br />
16 that will connect those well facilities to a couple of<br />
17 our existing water supply reservoirs in <strong>San</strong> <strong>Francisco</strong>.<br />
18 In the environmental analysis, in the project<br />
19 description, we're actually showing nine potential well<br />
20 facility locations. And these are numbered 1 through 9<br />
21 on this map. And then there is a larger version of<br />
22 this map right over on that side of the room. Feel<br />
23 free, after the formal presentation, to come up and<br />
24 take a closer look at that.<br />
25 Four of the well sites we consider to be<br />
12<br />
A.1-80
1<br />
the -- we consider those to be proposed well locations,<br />
2 you know, the best -- some of the most preferred<br />
3 locations we can come up with. And those are 1, 2 and<br />
4 3, which are in the Sunset District -- 1, down near<br />
5 Lake Merced; 2, which is at the corner of South Sunset<br />
6 Playground; 3, at the corner of West Sunset Playground.<br />
7 Then we have two more wells in Golden Gate<br />
8 Park, 4 and 5, which are actually existing irrigation<br />
9 wells. And what our project proposes to do is that,<br />
10 when recycled water becomes available to use for<br />
11 irrigation in Golden Gate Park, then we will be able to<br />
12 convert those wells and use them for municipal use.<br />
13 Then of the remaining one well that we need<br />
14 for our project, we're currently looking at four<br />
15 different alternatives -- 6, 7, 8 and 9 in Golden Gate<br />
16 Park.<br />
17 We have come up with the term "well facility."<br />
18 When you hear that term, what we mean by that is, it is<br />
19 a well, and it is a building that houses the well, the<br />
20 pump the electrical equipment. And at two of our<br />
21 proposed locations, we will also have some chemical<br />
22 treatment equipment for disinfecting the groundwater.<br />
23 The size of these well facilities varies,<br />
24 depending on whether we're proposing to do a simple<br />
25 rectangular building or whether the building will be<br />
13<br />
A.1-81
1<br />
L-shaped. They can range -- they will range or propose<br />
2 to range anywhere from about 20 feet by 40 feet for the<br />
3 simple rectangular building to -- where that building<br />
4 requires the disinfection equipment, it will add about<br />
5 another 20-foot length to the building.<br />
6 The proposed project also consists of about<br />
7 four miles of pipelines. I mentioned that pipelines<br />
8 are needed to connect the wells to two different<br />
9 reservoirs in our current <strong>San</strong> <strong>Francisco</strong> Water Supply<br />
10 System. The pipelines are shown in blue on the map.<br />
11 And they will be connecting -- five of the wells will<br />
12 connect via the pipelines to Sunset Reservoir. And the<br />
13 well down near Lake Merced will connect with a pretty<br />
14 short pipeline to the Lake Merced pump station. And<br />
15 the water will -- from Lake Merced pump station will<br />
16 either be pumped up to Sunset Reservoir or to Sutro<br />
17 Reservoir.<br />
18 How we're proposing to operate the project is<br />
19 to pump approximately 4 million gallons a day on an<br />
20 annual average from the six wells that I described.<br />
21 Then all of that groundwater would be disinfected, and<br />
22 then it would be pumped to the two reservoirs I<br />
23 mentioned, where it would be blended with the existing<br />
24 municipal supply.<br />
25 And the reasons for blending are that<br />
14<br />
A.1-82
1<br />
currently we serve very high-quality water in <strong>San</strong><br />
2 <strong>Francisco</strong>. And we don't want that taste, that<br />
3 perception of that high-quality water to change. So we<br />
4 feel that by blending a fairly small percentage of<br />
5 groundwater, that no one will notice a difference in<br />
6 taste when they drink that water out of their tap.<br />
7 The other main reason for blending is that we<br />
8 don't want to have to add some other water treatment<br />
9 chemicals because, actually, the groundwater would have<br />
10 an effect of diluting some of the things we already<br />
11 have to add to the water before we can serve it, such<br />
12 as fluoride. We also have to maintain a certain pH of<br />
13 the water so that we avoid corrosion of the pipes.<br />
14 So if we were to blend too much water, then we would<br />
15 have to add those other chemicals to meet those<br />
16 requirements.<br />
17 So the reason for blending is not because<br />
18 there are contaminants in the water. We have tested<br />
19 both monitoring wells and test wells, and the<br />
20 groundwater that we are planning to serve meets all<br />
21 health-based drinking water standards.<br />
22 So I think I pretty much covered the points on<br />
23 the slide, but just to reiterate that we have<br />
24 undertaken a program of sampling a number of what we<br />
25 call monitoring wells throughout the north Westside<br />
15<br />
A.1-83
1<br />
Basin from the existing wells in Golden Gate Park;<br />
2 we've tested them through everything that's required by<br />
3 the California <strong>Department</strong> of Public Health, and that<br />
4 water meets all health-based drinking water standards.<br />
5 Now, there will be two main ways in which the<br />
6 wells will operate, which I call "normal operation" and<br />
7 "emergency operation." And I would say probably 99.9<br />
8 percent of the time we will be operating under normal<br />
9 operation of the groundwater. As I mentioned before,<br />
10 we're proposing to pump an average of 4 million gallons<br />
11 a day from the six wells. The wells would operate<br />
12 daily, and their actual pumping rates or production<br />
13 from the wells will probably vary in response to the<br />
14 overall demand in <strong>San</strong> <strong>Francisco</strong> for water throughout<br />
15 the year so that, during the wetter times when, like<br />
16 today, nobody is irrigating or should be irrigating,<br />
17 there's probably less overall demand in <strong>San</strong> <strong>Francisco</strong>.<br />
18 And then, in the dryer months, that demand goes up.<br />
19 So that number of 4-, while we don't know<br />
20 exactly, it might vary between 3 1/2- and 4 1/2 million<br />
21 gallons per day based on looking at how the overall<br />
22 demand has varied over the course of the year.<br />
23 So this normal operation will use groundwater,<br />
24 blended in a fairly small percentage as part of the<br />
25 everyday <strong>San</strong> <strong>Francisco</strong> groundwater supply. And by<br />
16<br />
A.1-84
1<br />
serving it -- or by sending it to these two different<br />
2 reservoirs, the Sunset Reservoir and the Sutro<br />
3 Reservoir, it would serve over half of <strong>San</strong> <strong>Francisco</strong>.<br />
4 The other important use for the wells would be<br />
5 emergency operation. And each well by itself is<br />
6 capable of producing 1 million gallons a day or more<br />
7 right at the well. So if we wanted to turn on the well<br />
8 and open up the throttle, you know, to use an analogy,<br />
9 we could pump up to 1 million gallons a day.<br />
10 And in a catastrophic emergency, like a severe<br />
11 earthquake which could possibly disrupt other sources<br />
12 of supply, we would operate the wells that way. There<br />
13 are actually two well facilities that we are<br />
14 specifically proposing to equip for emergency<br />
15 operations. One of them is the North Lake Well, which<br />
16 I believe is No. 5. It's kind of the top, west end of<br />
17 Golden Gate Park. And the other one is West Sunset<br />
18 Playground, which is No. 3, which is in the middle of<br />
19 the Sunset District.<br />
20 And for those, we will equip them to be able<br />
21 to use portable generators so they can operate off of<br />
22 portable electrical supply if there should be some<br />
23 disruption of our regular power grid.<br />
24 Also, we'll have disinfection available at<br />
25 West Sunset Playground and the ability to bring in<br />
17<br />
A.1-85
1<br />
portable disinfection on a trailer to disinfectant at<br />
2 the North Lake Well station.<br />
3 I'd like to give the floor back to Jamie, who<br />
4 will continue with the presentation.<br />
5 Thank you very much.<br />
6 JAMIE DEAN: Thank you, Jeff.<br />
7 So I'd like to take a moment to go over the<br />
8 environmental review schedule for the <strong>San</strong> <strong>Francisco</strong><br />
9 Groundwater Supply Project. It's anticipated to extend<br />
10 over the next year or two. We did publish the notice<br />
11 of preparation at the end of December, and this evening<br />
12 we have our scoping meeting. The scoping period ends<br />
13 the end of January. And we request that you please<br />
14 submit any comments on the environmental review before<br />
15 the close of this period so we can make sure that your<br />
16 input is incorporated into the EIR.<br />
17 The public review of the Draft EIR is<br />
18 anticipated for winter of 2011. And publication of the<br />
19 Final EIR as well as the EIR certification would be<br />
20 anticipated in fall 2011.<br />
21 So now we would like to hear from you. Please<br />
22 remember that we're here tonight to receive your<br />
23 comments on the scope and focus of the environmental<br />
24 issues that we incorporated into the environmental<br />
25 impact report. This is not anticipated to be a<br />
18<br />
A.1-86
1<br />
question-and-answer session, but rather, we would like<br />
2 to hear from you.<br />
3 Just a few ground rules before we get started.<br />
4 Please do complete a speaker card. And you can hand<br />
5 those to Alisa and Cherie if you do wish to speak. And<br />
6 also when you do come up to the microphone, if you<br />
7 could please state your name before getting started<br />
8 with your comments, we would appreciate that for the<br />
9 record.<br />
10 In the interest of time, we do ask that you<br />
11 please keep your comments to approximately three<br />
12 minutes. I understand that you may have more to share<br />
13 than three minutes will allow. But please consider<br />
14 your verbal comments a summary of your primary point.<br />
15 You're welcome to augment those verbal comments with<br />
16 written comments that you can submit either later this<br />
17 evening or before the close of the scoping period.<br />
18 So we'll start with Kathy Symkowick. Is Kathy<br />
19 still here?<br />
20 (No response)<br />
21 JAMIE DEAN: Okay.<br />
22 Andrew Chan.<br />
23 ANDREW CHAN: Okay. I have building --<br />
24 JAMIE DEAN: Excuse me. If you wouldn't mind<br />
25 coming up to the microphone.<br />
19<br />
A.1-87
1<br />
ANDREW CHAN: Sure.<br />
2 First, I just want to raise, why meeting<br />
3 location would be on this side instead at Sunset side?<br />
4 That's all the people might not even able to make it to<br />
5 this place.<br />
6 When you think the project is going to start?<br />
7 That's my question.<br />
8 Then I have a couple other issues. How about<br />
9 this: After the project finish, what is the preventive<br />
10 maintenance program? I really don't have any faith --<br />
11 sorry, somebody from Public Works <strong>Department</strong>. And few<br />
12 years ago, they make a dam in -- at the junction of --<br />
13 near 39th. Up to now, nobody even take a look. Okay?<br />
14 And I just don't understand why, down the road, this<br />
15 pipeline would impact the residential area.<br />
16 And from the drawing, for me to look at it,<br />
17 why the pipeline is not straight, only one. Want to go<br />
18 up and down the hills? Why don't we build the pipeline<br />
19 all the way against the Great Highway.<br />
20 That's my comment. Thank you.<br />
21 JAMIE DEAN: Steve Lawrence?<br />
22 STEVE LAWRENCE: Generally I support the project<br />
23 and the idea of the project supplying more water. I do<br />
24 have questions. I had understood that there would be<br />
25 be blending to either one part in ten -- 10 percent,<br />
20<br />
A.1-88
1<br />
perhaps one part groundwater, nine parts Hetchy water,<br />
2 and that that would be a limitation.<br />
3 It was my understanding that there was<br />
4 manganese in the groundwater, and this was part of the<br />
5 reason for the blending. But earlier it was said that<br />
6 that wasn't a part of the reason.<br />
7 And my question has to do with, well, if<br />
8 you're going to serve this primarily to the west side<br />
9 via the Sunset Reservoir, there is that possibility of<br />
10 maybe one MGD, that would be a quarter of it, going off<br />
11 to the Sutro Reservoir, then it seems to me that that<br />
12 might be less than half the city, although I'm<br />
13 guessing. And if you're going to blend in three MGD or<br />
14 maybe a little more at times, groundwater to, you know,<br />
15 half the city, the west side, isn't that going to at<br />
16 least approach and possibly exceed the 10 percent limit<br />
17 on blending? I don't quite understand the arithmetic<br />
18 and would like for somebody to go through it with me.<br />
19 The other concern that I have is that Park &<br />
20 Rec is going to be paid for, you know, siting these<br />
21 wells on their property. And isn't this just a way of<br />
22 distributing money from the ratepayer to, basically,<br />
23 the general fund? You know, this is another way that<br />
24 we distribute money from the ratepayer, the water<br />
25 ratepayer, to the general fund.<br />
21<br />
A.1-89
1<br />
There are others. For instance, the City paid<br />
2 $2 for its new headquarters building. And you all, the<br />
3 ratepayers, will pay $9.9 million for that same<br />
4 property. That is another way of distributing<br />
5 ratepayer money into the general fund, which we all<br />
6 objected to about a decade ago.<br />
7 Those are the major concerns.<br />
8 I ask also, what happens if the groundwater<br />
9 is, in future, found to be bad? Will we simply do<br />
10 without that amount of water? Because we've signed a<br />
11 new water sales agreement with our wholesale customers<br />
12 where we've agreed to take a lesser amount of Hetchy<br />
13 water, partly in anticipation of developing this<br />
14 groundwater source, which, while it's a good idea, it's<br />
15 an idea that has not yet come to pass. In other words,<br />
16 we haven't actually implemented it successfully, nor<br />
17 have we implemented the recycled water successfully.<br />
18 And therefore, we're a little ahead of ourselves.<br />
19 What happens if it doesn't work out, if we get<br />
20 saltwater intrusion, or there is some future problem<br />
21 with the water that prevents us from taking all that?<br />
22 Will there be a way to get back some of the water that<br />
23 we've forgone from Hetch Hetchy Reservoir and that<br />
24 system?<br />
25 Thank you.<br />
22<br />
A.1-90
1<br />
JAMIE DEAN: Dan Murphy?<br />
2 DAN MURPHY: I'm Dan Murphy, and I represent<br />
3 Golden Gate Audubon Society. I want to thank the<br />
4 <strong>Department</strong> for incorporating some of the notes we made<br />
5 in a letter on June 5th, 2009, particularly regarding<br />
6 Lake Merced, and incorporating dealing with surface<br />
7 manifestations of this project. I'm glad to see that<br />
8 they're in the notice of preparation.<br />
9 However, we want to be certain that -- as the<br />
10 previous gentleman said, that there is an adaptive<br />
11 management plan in place for things that go wrong.<br />
12 If Lake Merced or Pine Lake or something else<br />
13 goes down, our interest is in habitat. We want to see<br />
14 that there's a plan in place to preserve habitat if<br />
15 there is, you know, some kind of an impact.<br />
16 Further, we have an ongoing concern about<br />
17 paving our city. We're losing water going into the<br />
18 aquifer. Today, we lost a ton of it because there's<br />
19 more and more pavements. It's going on in our streets,<br />
20 our backyards, everywhere -- and our parks. We are now<br />
21 paving playing fields. We are losing water. How are<br />
22 we going to recharge the aquifer?<br />
23 That's something that needs to be addressed.<br />
24 Aquifer recharge is critical if this is going to be a<br />
25 successful plan. It needs to be dealt with in the EIR.<br />
23<br />
A.1-91
1 Thank you very much.<br />
2 JAMIE DEAN: Is there anyone else who would like<br />
3 to speak? Okay. If you wouldn't mind completing a<br />
4 speaker card.<br />
5 JOAN GIRARDOT: Before I speak or after?<br />
6 JAMIE DEAN: You can do it after, in the interest<br />
7 of time.<br />
8 JOAN GIRARDOT: Yes. My name is Joan Girardot,<br />
9 and I would like the description of alternatives to the<br />
10 project to be clearly laid out. If we don't -- I don't<br />
11 see any alternative to the Groundwater Program stated<br />
12 so far. And if we were unable, for any reason, to<br />
13 produce the 4-MGD average, annual MGD, then what would<br />
14 the consequences of that be on our total water supply?<br />
15 Mr. Lawrence mentioned the recent contract<br />
16 with the suburbs whereby we have agreed to limit<br />
17 Hetch Hetchy Water System water to 81 MGD, and our<br />
18 demand will most likely be higher than that. So we're<br />
19 dependant upon the Groundwater Program to help us<br />
20 provide for future growth and development in the city.<br />
21 So I -- I don't see any alternative stated<br />
22 here.<br />
23 Secondly, I would like to have a clear<br />
24 description in the document regarding the current<br />
25 status of the Westside aquifer from the pumping that<br />
24<br />
A.1-92
1<br />
has gone on for 50 years by some of our suburban<br />
2 communities and the impacts to the aquifer that could<br />
3 be a downside effect from this pumping and, if that<br />
4 effect would come to pass, where the 4 MGD would come<br />
5 from because it's clear that we need a groundwater<br />
6 program to provide for the future population increases<br />
7 in <strong>San</strong> <strong>Francisco</strong>.<br />
8 Conservation won't do it alone because <strong>San</strong><br />
9 Franciscans are already down to, I believe, 54 gallons<br />
10 per capita per day, which is the lowest in the state of<br />
11 California. And it's debatable how much lower the<br />
12 conservation can go, since we are in the process of<br />
13 huge new developments in the city -- 10,500 housing<br />
14 units at Candlestick Point, Hunters Point,<br />
15 8,000 at Treasure Island, 5,700 additional at Park<br />
16 Merced, a possible 10,500 additional in the<br />
17 Market-Octavia Plan, not to mention the existing<br />
18 development in the pipeline.<br />
19 And then, I would like a clear description of<br />
20 what mitigations would be available to the residents<br />
21 nearby from noise, that is, how you are going to<br />
22 mitigate that.<br />
23 And I would like to know also the well that is<br />
24 currently in operation in the southwest corner of<br />
25 Golden Gate Park -- I forget the number of that well --<br />
25<br />
A.1-93
1<br />
No. 4. If there would be -- if the artificial turf<br />
2 that's going into the soccer fields there, I understand<br />
3 that the drainage -- there would be an impermeable<br />
4 barrier, so there would be no negative impact or<br />
5 cross-contamination when the artificial turf is<br />
6 watered -- or is cleaned -- I'm sorry -- with recycled<br />
7 water. You're putting the recycled and the groundwater<br />
8 in the same area. So you should describe clearly the<br />
9 barriers to any kind of cross-contamination.<br />
10 All right. Thank you.<br />
11 JAMIE DEAN: Thank you.<br />
12 Is there anyone else who would like to make<br />
13 any verbal comments? Okay. Then I will move on and<br />
14 close --<br />
15 JOYCE LAW: Wait.<br />
16 Hi. My name is Joyce, and I'm a resident on<br />
17 40th Avenue. And I've lived on 40th for -- gosh, over<br />
18 15 years. So this project is very important to me.<br />
19 Unfortunately, I'm strongly against this<br />
20 project. I have to be honest with you. I have no<br />
21 faith in the City at all. I mean, just today, in the<br />
22 newspaper, there were two articles on City projects,<br />
23 and you're failing. I mean, you can read the Examiner<br />
24 on the two articles. I just don't see that this is<br />
25 going to go well at all.<br />
26<br />
A.1-94
1<br />
My neighbor is here with me tonight. And he<br />
2 had asked about leaks. And someone had responded, "Oh,<br />
3 don't worry. There wouldn't be any leaks."<br />
4 Well, my question is, in the likely event that<br />
5 there will be leaks, since my homeowners insurance<br />
6 doesn't cover groundwater, and I doubt if any of your<br />
7 homeowners insurance will cover groundwater, where do I<br />
8 send the claim forms to?<br />
9 I have a feeling the City's going to do what<br />
10 the City going to want to do. And I just want to make<br />
11 sure that we get coverage in the event you fail.<br />
12 So that's all. Thank you.<br />
13 JAMIE DEAN: Is there anyone else that would like<br />
14 to make a comment?<br />
15 NICOLE IROZ-ELARDO: My name is Nicole<br />
16 Iroz-Elardo. I'm also a resident of the Sunset<br />
17 District, on 43rd.<br />
18 There's two things that have been touched upon<br />
19 that I want to see clarified in the process. The first<br />
20 is that we know that the Westside Groundwater Basin<br />
21 does go into the southern suburbs. How is that managed<br />
22 collectively? Particularly, how are we going to make<br />
23 sure that the groundwater is not contaminated by future<br />
24 developments in the southern suburbs? So that's<br />
25 important.<br />
27<br />
A.1-95
1<br />
And then the other is, this is a part of a<br />
2 larger effort to also recycle and reuse water. It<br />
3 seems to me that, if you're going to do an open-cut<br />
4 trench method of laying this pipe, that we ought to be<br />
5 considering putting down some sort of pervious surface<br />
6 on top of that down 41st, down 40th so that we can<br />
7 increase the recharge to the groundwater that we will<br />
8 be using.<br />
9 That's it.<br />
10 JAMIE DEAN: Is there anyone else that would like<br />
11 to make any comments?<br />
12 (No response)<br />
13 JAMIE DEAN COURT: So I would like to go ahead and<br />
14 close the public comment portion of this evening's<br />
15 meeting. And just a few reminders: The comments that<br />
16 you submit this evening as well as the written comments<br />
17 that we receive throughout the scoping period will be<br />
18 addressed and reflected in the draft EIR. We will not,<br />
19 however, be producing written responses to your<br />
20 comments.<br />
21 Also, just a reminder that, as I showed you on<br />
22 the environmental review schedule slide, there will be<br />
23 additional opportunities for your input. And that<br />
24 would be at the Draft EIR stage. And by providing your<br />
25 contact information on the sign-in sheets, we will be<br />
28<br />
A.1-96
1<br />
able to keep you apprised of further environmental<br />
2 notices as they become available.<br />
3 And here, again, is the slide on where you can<br />
4 submit comments, either through e-mail, fax, or regular<br />
5 mail. And this information is also listed on the<br />
6 notices at the table in the back of the room.<br />
7 Just one final slide of more information. If<br />
8 you do have questions on the environmental review<br />
9 process, you're welcome to contact me. And if you have<br />
10 questions specifically about the project<br />
11 characteristics, I would refer you to the <strong>San</strong> <strong>Francisco</strong><br />
12 Public Utilities Commission. And that would be<br />
13 Michele.<br />
14 So thank you again for your participation this<br />
15 evening, and thanks for coming through the rain to come<br />
16 and see us.<br />
17 (Whereupon, the proceedings concluded<br />
18 at 7:47 o'clock p.m.)<br />
19<br />
20<br />
21<br />
22<br />
23<br />
24<br />
25<br />
29<br />
A.1-97
1 STATE OF CALIFORNIA )<br />
) ss.<br />
2 COUNTY OF MARIN )<br />
3 I, DEBORAH FUQUA, a Certified Shorthand<br />
4 Reporter of the State of California, duly authorized to<br />
5 administer oaths pursuant to Section 8211 of the<br />
6 California Code of Civil Procedure, do hereby certify<br />
7 that the foregoing proceedings were reported by me, a<br />
8 disinterested person, and thereafter transcribed under<br />
9 my direction into typewriting and is a true and correct<br />
10 transcription of said proceedings.<br />
11 I further certify that I am not of counsel or<br />
12 attorney for either or any of the parties in the<br />
13 foregoing proceeding and caption named, nor in any way<br />
14 interested in the outcome of the cause named in said<br />
15 caption.<br />
16 Dated the 29th day of January, 2010.<br />
17<br />
18<br />
19 DEBORAH FUQUA<br />
20 CSR NO. 12948<br />
21<br />
22<br />
23<br />
24<br />
25<br />
30<br />
A.1-98
APPENDIX D<br />
Comments Received During EIR Scoping<br />
Process<br />
<strong>San</strong> <strong>Francisco</strong> Groundwater Supply Project D-1 April 2010<br />
Case No. 2008.1122E<br />
Administrative Draft – Subject to Change<br />
A.1-99
This page intentionally left blank<br />
A.1-100
2A<br />
2945 Ulloa St.<br />
<strong>San</strong> <strong>Francisco</strong>, CA 94116<br />
January 29, 2010<br />
<strong>San</strong> <strong>Francisco</strong> <strong>Planning</strong> Dept.<br />
Bill Wycko, Environmental Review Officer<br />
<strong>San</strong> <strong>Francisco</strong> Groundwater Supply Project Scoping Comments<br />
1650 Mission St, Suite 400<br />
<strong>San</strong> <strong>Francisco</strong>, CA 94103-2479<br />
Re: Case No. 2008.1122E<br />
<strong>San</strong> <strong>Francisco</strong> Groundwater Supply Project Scoping Comments<br />
Dear Mr. Wycko:<br />
The Golden Gate Audubon Society (GGAS) is concerned with some elements of<br />
the <strong>San</strong> <strong>Francisco</strong> Groundwater Supply Project (the project) that are not included<br />
in the Notice of Preparation (NOP). We also wish to acknowledge the positive<br />
response to our comment of June 5, 2009, that the EIR must address potential<br />
impacts to surface manifestations of the Westside Aquifer (6.1.10 Hydrology and<br />
Water Quality, 3 rd bullet).<br />
There remain other issues of which we remain very concerned and that we think<br />
should be considered in the Environmental Impact Report (EIR). The first is<br />
related to potential impacts on surface manifestations of the project. We believe it<br />
is critical to develop an adaptive management plan that anticipates impacts to<br />
Lake Merced, Pine Lake and other surface manifestations of the aquifer. That<br />
plan should provide courses of action that will be taken if unanticipated problems<br />
with the project develop. It would seem prudent to develop a much broader<br />
adaptive management plan that anticipates a series of problems that may impact<br />
the ground water basin. Examples might include a failure of the aquifer to<br />
recharge, salt water and pollutants entering the aquifer, and impacts of sea level<br />
rise during the projected life of the project. Adaptive management scenarios<br />
should include actions that might be taken up to and including closing down the<br />
project should the impacts be dire.<br />
We also remain concerned that the matter of groundwater recharge is not<br />
discussed in the NOP. Our concern is based on two ongoing problems in <strong>San</strong><br />
<strong>Francisco</strong>. First is the rapid and uncontrolled expansion of impermeable<br />
footprints around residential and commercial structures. As more and more<br />
ground is covered, we are reducing aquifer recharge at an unknown rate, and at<br />
the same time over charging our sewage system. The plan and the EIR must<br />
address that issue.<br />
A.1-101
2A<br />
The related concern is that the <strong>San</strong> <strong>Francisco</strong> Recreation and Park <strong>Department</strong><br />
is in the process of converting ball fields to synthetic turf. We understand that<br />
because of the way these fields are constructed, water that once went into the<br />
ground is now channeled into the sewage system, thus further over-taxing that<br />
system while preventing a significant amount of water from entering the aquifer.<br />
To compound the problem, infrastructure is in place to permit run-off to be used<br />
for aquifer recharge, but since it is unknown if the water is toxic or if it carries<br />
pollutants that could impact the aquifer, that system is not in use. A further<br />
problem is that we understand the Recreation and Park <strong>Department</strong> plans to<br />
convert as many as 80 fields to synthetic turf. This action is being carried out<br />
piecemeal, so a much needed Environmental Assessment and Environmental<br />
Impact Report has been avoided.<br />
Aquifer recharge is critical if the plan becomes operational. To ignore it is<br />
unconscionable. It would seem prudent for an element of the EIR to determine<br />
how much groundwater is being diverted to the sewage system by increased<br />
concrete and paved footprints and how much is being diverted by the synthetic<br />
playing fields. We urge the PUC to incorporate specific proposals and projects<br />
that will assure groundwater recharge in the Westside Groundwater Basin.<br />
Those proposals must include mitigation for any development, either public or<br />
private that reduces aquifer recharge. It is likely it will be necessary to not only<br />
eliminate further loss of groundwater recharge, it is probable we must increase<br />
recharge if we will meet the goal of pumping 4 million gallons per day.<br />
Strategies to assure adequate groundwater recharge are a necessary part of this<br />
project if it is to be complete and inclusive. We urge the PUC to include specific<br />
strategies and infrastructure in the EIR to accomplish this goal. The strategies<br />
might define where infrastructure should be placed to maximize recharge.<br />
Specific infrastructure that should be discussed in the EIR process include<br />
vegetated roofs, rainwater harvesting, bioretention, infiltration trenches,<br />
detention ponds, constructed wetlands, tree basins, creek daylighting, and<br />
permeable pavement.<br />
It is clearly necessary the EIR for the groundwater plan must address the matter<br />
of potential impacts on surface water features, it needs to incorporate an<br />
adaptive management plan, and it must present a plan of action to assure<br />
groundwater recharge can sustain the rate of pumping called for in the plan.<br />
Very truly yours,<br />
Dan Murphy<br />
Golden Gate Audubon<br />
Conservation Committee<br />
Golden Gate Audubon Society<br />
Page 2 of 3<br />
A.1-102
2A<br />
Golden Gate Audubon Society<br />
Page 3 of 3<br />
A.1-103
SIERRA CLUB<br />
SAN FRANCISCO GROUP<br />
85 Second Street, Box SFG, <strong>San</strong> <strong>Francisco</strong>, CA 94105<br />
2B<br />
January 8, 2010<br />
Bill Wycko, Environmental Review Officer<br />
<strong>Planning</strong> <strong>Department</strong> .<br />
1660 Mission Street, FAX 558-6409<br />
<strong>San</strong> <strong>Francisco</strong> CA 94103-2414<br />
Re: Case 2008.1122E – Ground Water Supply Project - Scoping Comments<br />
Dear Mr. Wycko,<br />
Thank you for allowing the Sierra Club to provide EIR Scoping comments for the subject<br />
project:<br />
1) The EIR should clearly state the purpose or purposes of the project. Is the project proposed to<br />
increase the total water supply for <strong>San</strong> <strong>Francisco</strong> and other Hetch-Hetchy water consumers? Is<br />
the project to increase the flow of water in the Tuolumne River for endangered fish?<br />
2) The EIR should discuss the impacts of possible salt water intrusion. What is the current salt<br />
water contamination of the upper and lower aquifers? The EIR should include a rainwater budget<br />
for the aquifers. What provisions will be made to increase rainfall flow into the aquifers? How<br />
many square feet of concrete will be removed to provide replacement water flow? How will this<br />
be accomplished?<br />
3) The EIR should consider the impacts to the water level of Lake Merced. Shutting down<br />
nearby irrigation pumps has allowed the lake level to increase toward previous levels. Will water<br />
be pumped from the lower or upper aquifer?<br />
4) The EIR should consider the additional cost of pumping versus the mostly gravity flow Hetch-<br />
Hetchy water. This information will be necessary to properly price water sales outside <strong>San</strong><br />
<strong>Francisco</strong>. The EIR should also consider the additional global warming gases emitted to produce<br />
the additional pumping energy required. Since this is a new energy requirement the EIR should<br />
show the total climate change gas emissions based on the net energy requirement based on<br />
producing the energy in coal fired power plants. This is reasonable because by the time this<br />
project operates we will be consuming as much renewable and low carbon fuels as possible to<br />
produce our current power needs. On the other hand because this view of the generation of new<br />
energy is an advanced concept the emissions should also be based on average California power<br />
generation emissions,<br />
Very truly yours,<br />
Howard Strassner, Secretary<br />
419 Vicente, <strong>San</strong> <strong>Francisco</strong> CA 94116, 661-8786, (h,w) email: ruthow@dslextreme.com<br />
A.1-104
3A<br />
Dudegerry@aol.com<br />
12/29/2009 03:00 PM<br />
To<br />
cc<br />
bcc<br />
Subject<br />
jamie.dean@sfgov.org<br />
RE: Groundwater Supply Proj.<br />
History:<br />
This message has been replied to.<br />
This is to notify your organization of the continuing interest of the Sierra Club in the status of Lake<br />
Merced. When there is more data available regarding the consequences to Lake Merced resulting from<br />
the proposed SFPUC's Water System Improvement Program please convey that to me. We fear there will<br />
be an adverse result to the lake when water is taken from the aquifer which feeds it.<br />
A.1-105
3A<br />
Dudegerry@aol.com<br />
02/01/2010 03:06 PM<br />
To<br />
cc<br />
bcc<br />
Subject<br />
Jamie.Dean@sfgov.org<br />
Re: Groundwater Supply Proj.<br />
History:<br />
This message has been replied to.<br />
Thanks. Gerald Colvin<br />
14 Wilshire Ct.<br />
Daly City, CA 94015<br />
A.1-106
January 29, 2010<br />
3B<br />
<strong>San</strong> <strong>Francisco</strong> <strong>Planning</strong> <strong>Department</strong><br />
1650 Mission Street<br />
Suite 400<br />
<strong>San</strong> <strong>Francisco</strong>, CA, 94103<br />
Attention: Mr. Bill Wycko, Environmental Review Officer<br />
Subject: <strong>San</strong> <strong>Francisco</strong> Groundwater Supply Project Scoping Comments Case No. 2008.1122E<br />
This is in reference to the proposed project to develop underground water for supplementing the<br />
potable water supply in the Sunset District. The project scope includes the construction of a new<br />
groundwater well in the West Sunset Playground and South Sunset Playground and the<br />
construction of a water delivery pipeline connecting both wells along 40 th Avenue.<br />
I want to bring attention to you that there might be soil instability concerns along portions the<br />
proposed 40 th Avenue pipeline alignment.<br />
The soil along 40 th Avenue between <strong>San</strong>tiago and Rivera Streets has been very unstable and has<br />
caused the settling of the roadway and sidewalk as well as causing the front of the homes &<br />
driveways to settle and crack over the last 20 years. Many homes along this portion of 40 th<br />
Avenue have major structural work performed on their foundations and driveways to correct the<br />
problem.<br />
The roadway & sidewalk as well as homes are continuing to settle. Utility poles along this area<br />
are leaning due to ground movement with one pole leaning at least 10 degrees from vertical.<br />
About 5 years ago, the <strong>Department</strong> of Public Works surveyed the street and roadway to monitor<br />
the settlement problem and installed storm water catch basins at the low points along 40 th Avenue<br />
to drain large pools of accumulated rainwater.<br />
Pipeline construction work involving trenching and excavation along the roadway may aggravate<br />
the soil settlement problem along the roadway & street; and may undermine the homes with<br />
foundations that already are showing signs of cracking and settling.<br />
In addition, if this project is to improve the reliability of the water supply after an earthquake or<br />
catastrophe, placing the pipeline through unstable soil may:<br />
Cause the pipeline & water supply to fail during an earthquake;<br />
May subject any installed pipeline to ground movement from the shifting soil and cause<br />
future pipeline breaks or joint separation.<br />
Since the project is still in the planning stage, please investigate and do site surveys along 40 th<br />
Avenue and analyze whether soil instability will adversely affect the project before finalizing the<br />
pipeline alignment.<br />
Regards,<br />
Dennis Huey<br />
A.1-107
By Certified Mail<br />
Return Receipt Reguested<br />
3C<br />
January 12,2010<br />
<strong>San</strong> <strong>Francisco</strong> <strong>Planning</strong> <strong>Department</strong><br />
1650 Mission Street<br />
Suite 400<br />
<strong>San</strong> <strong>Francisco</strong>, CA 94103-2479<br />
Attn: Mr. Bill Wycko<br />
Environmental Review Offcer<br />
<strong>San</strong> <strong>Francisco</strong> Groundwater Supply Project Scoping Comments<br />
Dear Sir,<br />
Re: Case No. 2008.1122E - <strong>San</strong> <strong>Francisco</strong> Groundwater Supply Project<br />
Notice of Preparation of an Environmental Impact Report and<br />
Notice of Public Scoping Meeting<br />
We are home owners and residents of 2227 40th Avenue, <strong>San</strong> <strong>Francisco</strong>, CA 94116. We are writing<br />
to show our deep concern that the <strong>San</strong> <strong>Francisco</strong> <strong>Planning</strong> <strong>Department</strong> is proposing to lay an<br />
underground water pipeline along 40th Avenue between Wawona Street and Quintara Street.<br />
All houses in the Sunset and Parkside are built on sand and most of<br />
them were built in the 40s and<br />
50s. The foundation of our houses is weak at best. If the proposed pipeline along 40th Avenue<br />
leaks or burst due to either poor maintenance, age, earthquakes or accidentally damaged by careless<br />
workmen working on the road, water will flood the affected area and this will cause the ground to<br />
subside. The foundation of our homes will be destroyed.<br />
All you need to do is to send an expert to 40th Avenue, to the area between <strong>San</strong>tiago and Rivera<br />
Streets. The houses at Nos. 2246, 2250, 2254, 2258, 2262, 2266, 2270, 2274, 2278 had already<br />
been affected by ground subsidence. Six of<br />
these houses were leaning so badly they had to have<br />
their foundation jacked up or repaired in recent years. The most recent being last year. Part of<br />
this<br />
area had already subsided below street leveL. The City had sent people to survey this particular<br />
stretch of the road several times and had drilled holes to the depth of twelve feet and found evidence<br />
of liquefaction and rotted wood. Some of our old-time neighbors say there was once a stream<br />
running along this area before houses were built. Ground subsidence can also be caused by draining<br />
of water from the groundwater aquifer by the City's proposed water supply project.<br />
Unlike other streets in the Sunset and Parkside, for the past 20 years the stretch of 40th Avenue<br />
between <strong>San</strong>tiago and Rivera has never been dug up and repaved by the <strong>San</strong> <strong>Francisco</strong> <strong>Department</strong><br />
of Public Works. This is because they have been unable to find a solution to deal with the<br />
undulating road surface and for fear of endangering the houses on both sides of<br />
the road.<br />
The <strong>San</strong> <strong>Francisco</strong> <strong>Planning</strong> <strong>Department</strong> and the Public Utilities Commission should find an<br />
alternate underground water pipeline location that does not endanger the homes of the residents.<br />
Eileen Kho ¿~~ \<br />
Irene Kho -I~ ,f)<br />
2227 40th Avenue ~<br />
<strong>San</strong> <strong>Francisco</strong>, CA 94116<br />
A.1-108
3C<br />
<strong>San</strong> <strong>Francisco</strong> Public Utilties Commission<br />
Benefits of<br />
Groundwater<br />
<strong>San</strong> <strong>Francisco</strong> residents<br />
enjoy some of the nation's<br />
highest-quality drinking<br />
water. The <strong>San</strong> <strong>Francisco</strong><br />
Public Utilities Commission's<br />
(SFPUC) Regional Water<br />
System delivers pristine<br />
Sierra snowmelt from the<br />
Heteh Hetchy Reservoir,<br />
and water from protected<br />
local reservoirs, directly<br />
to our customers' taps. To<br />
supplement our primary<br />
supplies and ensure reliable,<br />
high quality drinking water<br />
in the event of a major<br />
earthquake, drought, or<br />
decline in the snowpack.<br />
the SFPUC is planning to<br />
diversify <strong>San</strong> <strong>Francisco</strong>'s<br />
water supplies and increase<br />
the usc of available local<br />
groundwater sources.<br />
What is Groundwater?<br />
Groundwater-also known as well \vater-is a naturally occurring source of<br />
local, renewable, fresh water located underground. As rai n water seeps into the<br />
ground, it moves downward between soil particles and collects in an underground<br />
geologic reservoir (see below). When such a reservoir can readily yield water to<br />
springs or wells. it is called an aquifer and is a potential source of drinking water.<br />
',,<br />
.,.,<br />
!iiff<br />
"('''''"l"..,,i~.hi;i,.''''''-'''' ".. .<br />
Unsaturated Zone .<br />
rain clouds<br />
..<br />
,,'\ ...\.<br />
'~.\":':'.<br />
"-~,,~,,~_"~,,,d~ ~<br />
((((IIC" .<br />
reT'<br />
Groundwater<br />
Well<br />
Groundwater Is a Vital Drinking Water Source<br />
Groundwater is all or part of the drinking water supply for many communities<br />
throughout California, and it provides approximately 40% of the entire State's<br />
drinking water. The cities of South <strong>San</strong> <strong>Francisco</strong>, Daly City, and <strong>San</strong> Bruno have been<br />
pumping groundwater from the WesL'iide Groundwater Basin (an aquifer extending<br />
from Golden Gate Park in <strong>San</strong> <strong>Francisco</strong> southward through <strong>San</strong> Bruno) for drinking<br />
water and other uses for more than 50 years.<br />
Approximately i 00 years ago, groundwater was a major source of <strong>San</strong> rrancisco's<br />
drinking water supply. with over 500 wells and springs in use by residents. businesses.<br />
hospital'S. the Presidio and city parks. The usc of groundwater for irrigation and<br />
lake fìlling in (Ìolden Gate Park began in the IX70s and continues today. As part of<br />
SFPUC's proposed Westside Recycled Water Project, recycled water will replace<br />
groundwater for these non-potable uses in Golden Gate Park, allowing groundwater to<br />
be conserved for potable uses.<br />
<strong>San</strong> <strong>Francisco</strong> Groundwater Supply Project<br />
As part of the <strong>San</strong> <strong>Francisco</strong> Groundwatcr Supply Project. the SFPUC proposes<br />
the construction of up to six wells and associated facilities in the western part of<br />
<strong>San</strong> <strong>Francisco</strong>. The wells would extract up to 4 million gallons per day of waler<br />
from the Westside Groundwater Basin. The extracted groundwater, which would<br />
be used both for regular and emergency water supply purpses, would be blended<br />
with imported surface water before entering the municipal drinking water system<br />
for distri butiol1 to areas in both the west and east sides of the city. The pr~iect would<br />
provide a ne\v source of water and improve reliability during system maintenance<br />
and drought conditions. (Continued on Page 2)<br />
FALL 2009<br />
A.1-109
L<br />
LEGEND<br />
Proposed Production Wells<br />
è' Primary Locations<br />
1 Lake Merced Pump Station<br />
2 South Sunset<br />
3 West Sunset<br />
4 South Windmil Replacement<br />
5 North Lake<br />
A!temate Locations<br />
6 NE of Polo Field<br />
7 West of Spreckels Lake<br />
8 Urban Forestry Center<br />
9 GGP Central Pump Station<br />
.. Groundwater Pipeline<br />
(proposed alignments)<br />
- Sulro Pipeline (existing)<br />
. Reservoir<br />
Groundwater Use in<br />
the Bay Area<br />
3C<br />
Groundwater from the Westside Basin<br />
aquifer has been blended with water<br />
from the SFPUC's Regional Water System<br />
in Daly City. South <strong>San</strong> <strong>Francisco</strong><br />
and <strong>San</strong> Bruno for more than 50 years.<br />
This map shows the proposed project facilities including wells and pipelines<br />
<strong>San</strong> <strong>Francisco</strong> Groundwater Supply Project<br />
(From Page 1)<br />
The project would be implemented in two phases. Phase one includes:<br />
· Building three new groundwater wells at the Lake Merced Pump<br />
Station, West Sunset Playground and South Sunset Playground.<br />
· Installing piping to connect the new well stations to the Sunset<br />
Reservoir and the Lake Merced Pump Station.<br />
Phase two includes:<br />
· Modifying two existing irrigation wells and building a 11':\\ \\c11 \\ithin<br />
Golden Gate Park.<br />
Installing piping to connect the well stations to the Sunset Reservoir.<br />
Groundwater production within <strong>San</strong> <strong>Francisco</strong> is expected to begin in 2013.<br />
Groundwater Safety and Quality<br />
The Westside Groundwater Basin otTers a locaL. reliable and satc source<br />
of drinking water to <strong>San</strong> <strong>Francisco</strong> residents. Pumped groundwater<br />
would be treated as necessary to comply with the California <strong>Department</strong><br />
of Public Health requirements betore entering the municipal drinking<br />
vv'ater system. It would then be blended in small quantities witli<br />
imported surtace water to ensure that the high quality of <strong>San</strong> hancisco's<br />
drinking water is maintained. No change in taste, color or odor is<br />
anticipated after the water is blended.<br />
Communities in the Bay Area currently<br />
drinking a blend of groundwater and<br />
surface water are shown above.<br />
Key Project Steps<br />
Environmental Review: 2009 to 2011<br />
Design: 2009 to 2011<br />
Construction: 2011 to 2013<br />
Dates subjeCt /0 cnange<br />
~~PCJc:<br />
,~ Qa<br />
H ETCH H ETCHY<br />
WATER SYSTEM<br />
WATER<br />
WASTEWATER<br />
POWER<br />
IMPROVEMENT<br />
PROGRAM<br />
Contact Information<br />
Michele Liapes, Communications<br />
415-554-3211 mliapes@sfwater.org<br />
ww.sfwater.org/groundwater<br />
A.1-110
3D<br />
Michael and Carol-Ann<br />
Laughlin<br />
<br />
01/06/2010 01:46 PM<br />
To<br />
cc<br />
bcc<br />
Subject<br />
jamie.dean@sfgov.org<br />
Case 2008.1122E - SF Groundwater Suppy Project<br />
A.1-111
3E<br />
"Steve Lawrence"<br />
<br />
12/30/2009 10:53 PM<br />
To<br />
cc<br />
bcc<br />
Subject<br />
"Jamie Dean" <br />
Groundwater Supply Project: comment to Draft EIR's NOP<br />
Please accept this as a comment or comments to the above pursuant to the notice of December 30,<br />
2009.<br />
a) Please better describe the project as it relates to Lake Merced. Is Lake Merced a potable drinking<br />
source? I believe it has not been used as such since the 1930s; is that wrong? The sixth well would<br />
connect to the Lake Merced Pump Station; does that station pump water into Lake Merced, or does it<br />
connect to some other body which is part of the potable water system? The purpose of the project is said<br />
to be to provide an average of four mgd to the municipal water supply, which is potable water, is it not?<br />
The project is part of WSIP, which protects drinking water. Please clarify whether all 4 mgd of<br />
groundwater goes to our drinking water system, and if not, then how much goes elsewhere, and where.<br />
b) Is this water to be provided year around or during certain seasons? If seasonal, when?<br />
c) Groundwater is to be blended with regional water system water so the blend meets manganese<br />
standards. But facilities are to connect to Sunset Reservoir, which holds only a portion of the city's water.<br />
The city will be receiving some amount from the RWS, say 75 mgd. What portion of that does Sunset<br />
receive? Blending is to keep groundwater to what percentage; ten percent? Four mgd is about five<br />
percent of the total city usage; if Sunset contains less than half of the city's total, then it would seem hard<br />
or impossible to keep blending to under ten percent. Explain how blending will work to keep water served<br />
by Sunset equally to the quality customers now enjoy, or better, within manganese standards, and, if ten<br />
percent is the goal, within ten percent or less of water served by Sunset.<br />
d) Pumping groundwater has lowered ground elevations in other parts of the state, notably (notoriously)<br />
in the Central Valley. Will that happen here? What effect will it have on the environment?<br />
e) The project description omits storage and disinfection. Are these not needed? What steps will be taken<br />
to ensure that the groundwater is fit to drink?<br />
Steve Lawrence<br />
A.1-112
3F<br />
"Steve Lawrence"<br />
<br />
01/11/2010 02:55 PM<br />
To<br />
cc<br />
bcc<br />
Subject<br />
"Jamie Dean" <br />
"Michele Liapes" <br />
1/20 groundwater supply meeting<br />
History:<br />
This message has been forwarded.<br />
Jamie,<br />
I'm unavailable for the groundwater supply meeting on 1/20, unfortunately, but I would like to add my<br />
questions, if possible:<br />
a) There is manganese in the groundwater at levels higher than recommended. To avoid elevated levels<br />
of manganese, I've heard that groundwater will be blended with regional water at 9:1 or 10:1, so that no<br />
more than one part in ten is groundwater. But I've also heard that groundwater will be blended in at<br />
Sunset--west side; makes sense. But Sunset is only one major city reservoir; I don't know what<br />
percentage it serves. 3.5 mgd of groundwater is to be used. The city is using maybe 75 mgd of water. If<br />
3.5 were blended equally with all city water, groundwater would be 4.667% of total water used in city. If<br />
Sunset serves 40% of the city, and if all groundwater goes to Sunset, then more than eleven percent of<br />
Sunset water will be groundwater. That exceeds the assurance (ten percent as I have it). Please explain.<br />
b) Will 3.5 mgd be pumped out equally throughout the year? If groundwater will be pumped at higher<br />
rates during say September - November, won't this skew the ratio of groundwater to regional water even<br />
more?<br />
c) What happens if groundwater is found to be bad? Do we do without that amount of water? Do we treat<br />
somehow? how? where? What ways might it be bad? (Salty is one that occurs to me--should the ocean<br />
somehow intrude and pollute the groundwater basin.)<br />
d) Compare and contrast the other groundwater project, which stores groundwater for a non-rainy<br />
day--for a drought. Then, 7.2 mgd will be available to supplement regional water system supplies for up to<br />
something like 7 years should the "design drought" come to pass. Does that water suffer from a<br />
manganese surfeit, or some other problem, and if it does, how will that problem be met and overcome?<br />
What percentage, at max, of the Westside's water will be groundwater (from both projects' basins)?<br />
e) Is Park & Rec being to be paid for siting wells in "their" park, and if so why is this not a backdoor<br />
transfer of ratepayer funds to the general fund (-ed Rec & Park)?<br />
Finally, will their be a recording or other record of the meeting so I can learn answers to the above?<br />
Steve Lawrence<br />
A.1-113
3G<br />
"Steve Lawrence"<br />
<br />
01/21/2010 09:38 AM<br />
To<br />
cc<br />
bcc<br />
Subject<br />
"Jamie Dean" <br />
<br />
SF Groundwater project<br />
Ms. Dean:<br />
The Scoping Meeting raised serious questions about groundwater. Would you please consider these<br />
along with those I submitted earlier, including that email of 1-11-10.<br />
At the Scoping Meeting the Project Manager asserted that groundwater had no difficulty meeting<br />
drinking water standards, and was not to be blended for health. This line is inconsistent with past writing.<br />
In the past it was acknowedged that groundwater did have more manganese than desirable (or allowed,<br />
I'm unsure which). In the past groundwater was to be blended to reduce the overall concentration of<br />
manganese. Last night that was very clearly not the case. Also, last night there were no assurances that<br />
groundwater would comprise no more than one part in ten; in the past there were such assurances.<br />
SFPUC has changed course. No longer can the public believe that manganese in its water will be kept<br />
less than EPA recommended levels. No longer can the public believe that groundwater will be no more<br />
than one part in ten. Groundwater is more important, as it may make up a greater percentage of drinking<br />
water--at least for those of us served by Sunset Reservoir.<br />
As a result of these changes, transparency is more essential. Groundwater should be regularly tested,<br />
and results should be posted on the SFPUC website. Only in this way will public acceptance of this new<br />
water source be optimized.<br />
There will be concerns other than manganese. Pharmaceuticals are an emerging issue. Already last<br />
evening citizens asked about recycled water trickling from park fields irrigated with recycled water down<br />
into the groundwater aquifer, and whether the water of the aquifer would become polluted. As more of our<br />
citizens use ever more pharmaceuticals, some of which may remain even after tertiary treatment of<br />
wastewater, there is sure to be concern about the effect of those substances on the development of a<br />
child's brain and body. SFPUC should be proactive about this, and should maximize transparency about<br />
the groundwater it will serve so that citizens can choose to drink from the tap or not. Whichever way they<br />
choose, they must feel that they are given accurate and full information. It is unacceptable to merely<br />
assert that "groundwater is safe". People wish to choose for themselves, confident that they are given all<br />
relevant facts.<br />
Last evenings meeting was troublesome because 1) course was changed, and 2) issues were avoided<br />
or left unaddressed. Examples are: manganese, the intrusion of recycled water into the aquifer, and the<br />
proportion of water served to Westside customers that will or may be groundwater. The feeling that<br />
transparency is a prime value was not assured last evening.<br />
Finally, there are concerns about sufficiency of water in <strong>San</strong> <strong>Francisco</strong>.<br />
1. How will the groundwater be tested, and how will results be made public?<br />
2. Will manganese levels be tested?<br />
3. Will groundwater be tested for pharmaceuticals, even if not required by state or federal authorities? It<br />
has been said that SF's water would exceed minimum requirements, would be cleaner and better, as has<br />
been customary to date; how will that policy be continued and advanced?<br />
4. Will groundwater be limited to some portion of water served (except during emergencies), such as no<br />
more than one part in ten, and what maximum will that be? In non-emergency times, what portion<br />
groundwater, at maximum, may Westside drinking water be? (Example answer: one part in ten; 11%.)<br />
A.1-114
3G<br />
5. According to the project Project Manager at the scoping meeting, groundwater will not be blended for<br />
health reasons, but will only be blended for taste. Taste seems subjective. How will taste be determined?<br />
(Is this a real or illusory limitation? Convince us it is real.)<br />
6. If groundwater tests bad, what will happen? Rationing? Or are there options available to replace<br />
groundwater with some other supply? With the 2018 Variant's system limitation (to take no more than 265<br />
mgd), with the Water Sales Agreement (of 2009)'s agreement that <strong>San</strong> <strong>Francisco</strong> will limit its draw of<br />
regional water, and with rapid growth and development planned for <strong>San</strong> <strong>Francisco</strong> (Including Treasure<br />
Island, Candlestick/Hunters Pt, Park Merced, and possibly Octavia corridor and more), there is concern<br />
that groundwater is absolutely necessary to meet demand for water. Yet it could prove insufficient in<br />
quantity, or could fall short in quality. What alternative options are available?<br />
7. One of the disinfection facilities is planned to be mobile, and perhaps for emergency use only. Would<br />
you explain how disinfection will be accomplished in non-emergency times, and where? Will there be<br />
filtration? If not, is there a waiver?<br />
Should I have failed to make myself clear, above, please communicate. Thank you for taking these<br />
matters into consideration.<br />
Steve Lawrence<br />
PS I merely guessed at Mr. Gillman's spelling and email address; if wrong, would you forward this on?<br />
A.1-115
3H<br />
"Steve Lawrence"<br />
<br />
01/25/2010 07:31 PM<br />
To<br />
cc<br />
bcc<br />
Subject<br />
"Jamie Dean" <br />
SF Groundwater scoping (fourth submission)<br />
Ms. Dean,<br />
Sorry to dribble these in, but I have one more (or two):<br />
Recycled water is to be used to irrigate Golden Gate Park. That water will percolate down into the aquifer<br />
from which groundwater is to be taken. The question, then, is whether the less than pure recycled water<br />
will pollute the groundwater such that levels of harmful substances rise to unacceptable levels. It could<br />
take time.<br />
A subsidiary question is: playing fields will or may be converted to the new synthetic soccer field artificial<br />
grass. Is this surface permeable? Does water (probably recycled water as well as rain) percolate through<br />
the artificial grass, and if it does not all go into the sewer system, will that water, when it reaches the<br />
aquifer, pollute the groundwater?<br />
Regular testing of extracted groundwater seems more important given the above concerns. While regular<br />
testing would be good, it would be well to try to answer the questions. We do not want to invest money<br />
and hopes in something that goes sour in a few years due to a build up of harmful substances. Nor,<br />
perhaps in 2018 or so, do we want to have to devise unanticipated treatments for groundwater in order to<br />
use it. The decision to develop groundwater should be made, so far as possible, with eyes wide open to<br />
what may go wrong, and what it will cost to extract, treat and deliver potable groundwater.<br />
Thank you. Steve Lawrence<br />
A.1-116
3I<br />
"Steve Lawrence"<br />
<br />
01/29/2010 03:53 PM<br />
To<br />
cc<br />
bcc<br />
Subject<br />
"Jamie Dean" <br />
Groundwater NOP<br />
One more: Will groundwater pumping affect the level of Lake Merced? If not, why not?<br />
Steve Lawrence<br />
A.1-117
maureen maggiolo <br />
01/29/2010 09:04 PM<br />
To<br />
cc<br />
jamie.dean@sfgov.org<br />
3J<br />
bcc<br />
Subject<br />
40th ave project<br />
Dear Jamie,<br />
I was unable to make last weeks meeting and I have some concerns about the project.<br />
1. 40th ave between Taraval and Wawona is a very high traffic area. Walgreens, St Gabriel School and Sunset Supermarket.The kids get dropped off on 40th and<br />
get picked up on 41st from school.<br />
2. What about the ponds or lakes on 40th between <strong>San</strong>tiago and Rivera St. Thats why they did'nt put the sewer project on 42nd ave years ago,plus my father used<br />
to swim in them when he was a boy.<br />
3.why can't they put it down Sunset Blvd.instead.<br />
4. Are you going to pay for cracks created by the vibrations from the machinery?<br />
I just had a very expensive paint job inside my house and had all the cracks repaired .<br />
I live on 40th ave near Walgreens.<br />
Maureen Maggiolo<br />
A.1-118
3K<br />
Morten <br />
01/18/2010 10:17 AM<br />
To mliapes@sfwater.org<br />
cc Tom Doudiet , Dick Morten , David Massen<br />
, Suzanne Gautier , Patrick Sweetland ,<br />
jamie.dean@sfgov.org, Dick Allen , Jerry Cadagan , Dan Murphy<br />
bcc<br />
Subject Ground water supply project EIR<br />
I will be unable to attend the scoping meeting on the 20th due to meeting conflicts.<br />
The project EIR should discuss:<br />
Daly City, in cooperation with the PUC and other Westside Basin water users, has developed a hydrological model. The model was designed to analyze water inputs, outputs and various<br />
uses of basin water resources. It is critical that the model be applied to the proposed Groundwater Supply Project.<br />
Coastal saltwater intrusion has negatively impacted many water supplies. The PUC has installed several saltwater intrusion monitoring units along Ocean Beach. A program to use these<br />
units to monitor and manage ground water extraction is required. The plan should be identified prior to beginning of pumping.<br />
A.1-119<br />
The use of the water from the proposed pumps for emergency fire fighting water and potable drinking water is essential. As I mentioned in previous communication, the pumps must be<br />
fitted with diesel pumps with multi-day fuel supply and fittings to allow immediate fire department emergency/disaster access to water without waiting for PUC staff support. The PUCK<br />
should store drinking water manifolds that can be attached easily.<br />
The proposed improvements to the Auxiliary and Portable Water Supply Systems and the Groundwater Supply Project are critical elements of emergency/disaster water supply. The PUC,<br />
SFFD and Capital <strong>Planning</strong> should design and implement the projects in a coordinated manner.<br />
Dick Morten, 566-4351
3L<br />
"Jim Spahr"<br />
<br />
01/12/2010 08:37 AM<br />
Please respond to<br />
<br />
To<br />
cc<br />
bcc<br />
Subject<br />
<br />
Case No. 2008.1122E-Groundwater Project<br />
Bill Wycko<br />
Environmental Review Office<br />
SF Groundwater Supply Project<br />
Scoping Comments<br />
Dear Mr. Wycko,<br />
Thank you for the opportunity to comment on the upcoming project. As a resident of <strong>San</strong> <strong>Francisco</strong> and a<br />
neighbor to the Sunset Reservoir I know firsthand how hard the SFPUC works to maintain our safe<br />
drinking water supply. I commend the SFPUC for their planning and foresight to make sure they are<br />
ready for any contingency or emergency. With the upcoming project I ask that the <strong>Department</strong> make a<br />
better effort at being a good neighbor out here in the Sunset.<br />
Over the past 6 plus years we’ve lived with the pipeline extension, the hill stabilization, and the north<br />
basin expansion projects. The solar panels project is scheduled to begin any month now as well. In a way<br />
it’s like living next to an airport: always under construction. In the past the <strong>Department</strong> has been long on<br />
excuses and promises and well short on fulfillment.<br />
During the pipeline extension project full and empty trailers were stored on our streets for weeks at a time<br />
attracting garbage and graffiti. One would think with the vast property holdings of the SFPUC in <strong>San</strong><br />
<strong>Francisco</strong> and <strong>San</strong> Mateo, that more suitable storage locations could be found for equipment and material.<br />
During the hillside stabilization project, we lived with workers and equipment waking us up every<br />
morning. I’ve worked on many construction projects where great care is taken not to disturb families in<br />
residential areas. This seemed a foreign concept to the <strong>Department</strong>.<br />
During the north basin expansion project all semblance of neighborly consideration was tossed aside by<br />
the <strong>Department</strong>. Streets were posted ‘no parking’ in the morning, and cars were towed within an hour of<br />
posting. 30 to 40 concrete trucks delivered on a daily basis with limited or no traffic control. For a time it<br />
was like living on a dirt road. Dirt and dust would come off the project and settle on our homes and cars.<br />
You could not leave windows open during the day or night on any side facing the reservoir. Cars and<br />
trucks would drive by the homes and dust would be thrown into the air. Requests for a simple solution<br />
like a water truck or street cleaning seemed beyond the <strong>Department</strong>’s or Contractor’s comprehension.<br />
Why it would be difficult for the Water <strong>Department</strong> to provide a water truck is a great unanswered<br />
question. Verbal promises of mitigation in the form of window cleaning or car washes were made, but<br />
never fulfilled. To use water we had to pay for to clean the <strong>Department</strong>’s mess also seemed an excessive<br />
tax on the neighbors of the Sunset Reservoir. The Sunset Reservoir is used by the old and young alike and<br />
many times sidewalks were left in an unsafe state with no barriers or warning signs.<br />
While my neighbors and I welcome what the SFPUC is trying to do to maintain a safe and clean water<br />
supply, we also ask that the <strong>Department</strong> act like a good neighbor. Is this too much to ask, again?<br />
Sincerely,<br />
A.1-120
3L<br />
Jim Spahr<br />
2079 28 th Ave<br />
<strong>San</strong> <strong>Francisco</strong>, CA<br />
A.1-121
3M<br />
January 27, 2010<br />
<strong>San</strong> <strong>Francisco</strong> <strong>Planning</strong> <strong>Department</strong><br />
Attn: Bill Wycko, Environmental Review Officer<br />
<strong>San</strong> <strong>Francisco</strong> Groundwater Supply Project<br />
Scoping Comments<br />
1650 Mission Street, Suite 400<br />
<strong>San</strong> <strong>Francisco</strong>, CA 94103-2479<br />
Subject: Comments on Notice of Preparation (NOP) for the Draft EIR for the <strong>San</strong><br />
<strong>Francisco</strong> Groundwater Project, Case No. 2008.1122E<br />
Mr. Wycko,<br />
My name is William Wanner and I am the owner of property on 40 th Avenue in<br />
<strong>San</strong> <strong>Francisco</strong>. I want to respond to the NOP for the groundwater project noted<br />
above. My comments mainly pertain to the water line that is proposed to connect<br />
the two groundwater wells located at both South Sunset and West Sunset<br />
playgrounds. I want to state that overall I am not opposed to the use of<br />
groundwater to supplement the City’s water supply. I am concerned with the<br />
potential for significant impacts to residents along 40 th Avenue with the<br />
construction and operation of the connecting water line. The following<br />
environmental issues should be addressed in the DEIR.<br />
1. The cause of subsidence to portions of the street and specific residences on<br />
40 th Avenue between Rivera and <strong>San</strong>tiago Streets should be determined and<br />
analyzed.<br />
For years, calls to <strong>San</strong> <strong>Francisco</strong> <strong>Planning</strong> and Public Works departments<br />
have resulted in various explanations for the sinking street and homes. The<br />
answers provided by the City ranged from “well it’s just shifting sand”, to<br />
“underground springs”, and “the location may have been an unofficial dump<br />
site in the 1920’s and 1930’s”. Although it is an existing condition, the DEIR<br />
should determine the cause and provide an analysis and possible mitigation<br />
measures for future construction related activities on the street. In addition,<br />
the project provides an opportunity to create a permanent fix to the problem,<br />
and provide a street that will no longer be subjected to ground subsidence.<br />
2. Construction impacts pertaining to the installation of the water line on this<br />
portion of 40 th Avenue (between Rivera and <strong>San</strong>tiago) should be analyzed.<br />
If the cause of the ground subsidence is underground springs, I am<br />
concerned that construction work may result in additional ground failure in the<br />
impacted area. The DEIR should examine the potential for construction<br />
related intrusion into the underground spring(s), or the water table, resulting in<br />
A.1-122
Comments on NOP for DEIR<br />
SF Groundwater Project – 2008.112E<br />
January 27, 2010<br />
3M<br />
the spreading of water leading to ground subsidence to residences on the<br />
street where there currently has not been ground failure. Appropriate<br />
construction mitigation measures should be provided. Obviously, it would not<br />
be acceptable to create a more widespread area of ground subsidence with<br />
this project.<br />
3. Operation and maintenance of the water line should be examined in the<br />
DEIR.<br />
The DEIR should analyze the potential for water line breaks due to<br />
subsidence or in the case of a seismic event in conjunction with ground<br />
subsidence. The DEIR should examine and propose regular maintenance<br />
schedules to monitor ground subsidence and possible water leaks and pipe<br />
breakage.<br />
Since 40 th Avenue is not a flat street running between the proposed wells, I<br />
assume that the water will be pumped from each location to a point where it<br />
will be pumped to the reservoir. Pumping velocity should be examined in<br />
relation to the potential for damage to the street and residences in the event<br />
of a break or leak in the water line. Mitigation in the form of monitoring and<br />
automatic shut-off should be provided.<br />
4. Construction issues, timing, and access to individual residences should be<br />
evaluated in the DEIR.<br />
Residents should have ample notice prior to the start of construction. In<br />
addition, it is assumed that the DEIR will discuss noise, dust, and traffic<br />
relocation. The document should also provide alternatives for street parking<br />
for residents and visitors, and should provide for a minimum amount of<br />
disruption to residents during construction.<br />
I look forward to reading the Draft EIR. Please continue to notify me of the<br />
availability of project related reports, staff reports, and upcoming public meetings.<br />
I can be reached at the address listed below.<br />
Sincerely,<br />
William Wanner<br />
2034 Palm Avenue<br />
Redwood City, CA 94061<br />
Daytime phone: 650-522-7208<br />
2<br />
A.1-123
3N<br />
chunyao<br />
<br />
01/15/2010 02:08 PM<br />
To<br />
cc<br />
bcc<br />
Subject<br />
jamie.dean@sfgov.org<br />
impact to residents house<br />
Dear Jamie Dean<br />
I'm a resident lived at 1979 28th Ave, <strong>San</strong> <strong>Francisco</strong>. I've been living here more than 10 years.<br />
I'm really scared by getting the letter from <strong>San</strong> <strong>Francisco</strong> Public Commission recently, talking<br />
about groundwater supply project. Last year, there were a lot underground water works on the<br />
street front my house. I know this work is for protection of city water supply system from<br />
earthquake. However, during the work, my house was shakes very badly. Right now, as long as<br />
some truck pass by front street of my house, the house will shake. This never happened before<br />
the underground water works. Not too long ago, the resident on 24th Ave, Ortega, pass the letter<br />
to neighborhood, talked about same problems caused by underground water works. We really<br />
worry about our property right now. Could you help us to talk to city related department to<br />
protect the residents property from this kind of damage or potential damage by earthquake?<br />
Thank you very much!<br />
Chunyao Xia<br />
A.1-124
01/25/2010 12: 09 415-522-5125 BANK OF AMER I CA PAGE 01/01<br />
3O<br />
. January 25. 2010<br />
<strong>San</strong> <strong>Francisco</strong> <strong>Planning</strong> <strong>Department</strong><br />
Attn.: Bil Wycko,<br />
Environmental Review Officer,<br />
<strong>San</strong> <strong>Francisco</strong> Groundwater Supply Projec Seeping Comments<br />
1650 Mission Street, Suite 400<br />
<strong>San</strong> <strong>Francisco</strong>, CA 94103-2479<br />
Via Fax: (415) 558.6409<br />
Dear Mr. Wycko,<br />
I would like to express my great concern about the impact on my home and my health from the<br />
construction of the two underground water wells (one at West Sunset Playground and the other at South Sunset<br />
Playground) and the underground water pipelines under 40th Avenue to ccnnect the two wells.<br />
We are also conoerned that in the future if any of the pipelines lea (s, it would cause ground subsidence.<br />
If the water pipeline bursts, it would destroy our house foundations and thilS our houses. As Sunset houses are<br />
built on sand. the foundatIons are already weak. Furthermore, while consiruction is going on, there will be a lot of<br />
har and incovenience to the residents of 40th Avenue caused by the duiit, noise pollution and traffc diversion.<br />
I am allergic to dust and I usually get a headache from noise pollution.<br />
I have worked very hard for years and years to be able to own a hl)USe and my house is my only asset. I<br />
would like to ask for your kind consideration not to proceed with the constrJcton of the well at West Sunset<br />
Playground and the pipelines under 40th Avenue in view of the great advene effects on the residents of the 40th<br />
Avenue.<br />
Sincerely,<br />
LD~<br />
L.C. Vim<br />
(resident of 40th Avenue)<br />
A.1-125
This page intentionally left blank<br />
A.1-126
Appendix A<br />
Scoping Reports<br />
APPENDIX A‐2<br />
2011 Scoping Report<br />
SFPUC <strong>San</strong> <strong>Francisco</strong> Groundwater Supply Project Draft EIR A.2‐1 March 2013<br />
Case No. 2008.1122E
Appendix A<br />
Scoping Reports<br />
This page intentionally left blank<br />
SFPUC <strong>San</strong> <strong>Francisco</strong> Groundwater Supply Project Draft EIR A.2‐2 March 2013<br />
Case No. 2008.1122E
<strong>San</strong> <strong>Francisco</strong> Public Utilities Commission<br />
<strong>San</strong> <strong>Francisco</strong> Groundwater Supply Project<br />
Environmental Impact Report<br />
Final<br />
Scoping Report<br />
June 2011<br />
Prepared for the <strong>San</strong> <strong>Francisco</strong> <strong>Planning</strong> <strong>Department</strong><br />
Prepared by ESA<br />
A.2-3
This page intentionally left blank<br />
A.2-4
TABLE OF CONTENTS<br />
<strong>San</strong> <strong>Francisco</strong> Public Utilities Commission<br />
<strong>San</strong> <strong>Francisco</strong> Groundwater Supply Project<br />
Environmental Impact Report<br />
Scoping Report<br />
1.0 Introduction and Background .................................................................................... 1<br />
1.1 Introduction .......................................................................................................... 1<br />
1.2 Notice of Preparation ........................................................................................... 1<br />
1.3 <strong>San</strong> <strong>Francisco</strong> Groundwater Supply Project ........................................................ 1<br />
2.0. Purpose of the Scoping Process ............................................................................... 2<br />
3.0 Notification of Scoping ............................................................................................... 3<br />
4.0 Overview of Comments Received ............................................................................. 5<br />
5.0 Summary of Comments by Subject Area .................................................................. 6<br />
Page<br />
<strong>Appendices</strong><br />
A. Notice of Preparation (NOP) and NOP Notice of Availability .................................... A-1<br />
B. Comments Received During EIR Scoping Process .................................................. B-1<br />
List of Tables<br />
1. Number of Recipients on Mailing List for NOP ............................................................. 4<br />
2. Index of Written Comments .......................................................................................... 5<br />
3. Summary of Comments by Commenter ........................................................................ 7<br />
<strong>San</strong> <strong>Francisco</strong> Groundwater Supply Project i June 2011<br />
Case No. 2008.1122E<br />
A.2-5
This page intentionally left blank<br />
A.2-6
Scoping Report<br />
1.0 Introduction and Background<br />
1.1 Introduction<br />
The <strong>San</strong> <strong>Francisco</strong> <strong>Planning</strong> <strong>Department</strong> is the lead agency for implementation of California<br />
Environmental Quality Act (CEQA) requirements for all projects sponsored by the City and County<br />
of <strong>San</strong> <strong>Francisco</strong> (CCSF) or conducted within <strong>San</strong> <strong>Francisco</strong>. The <strong>San</strong> <strong>Francisco</strong> <strong>Planning</strong><br />
<strong>Department</strong> is preparing a Draft Environmental Impact Report (EIR) for the <strong>San</strong> <strong>Francisco</strong> Public<br />
Utilities Commission’s (SFPUC’s) proposed <strong>San</strong> <strong>Francisco</strong> Groundwater Supply Project (project or<br />
proposed project). The Draft EIR, which will assess the potential impacts of the project on the<br />
physical environment, is being prepared in accordance with CEQA. CEQA requires the preparation<br />
of an EIR when a proposed project could significantly affect the physical environment.<br />
As part of the Draft EIR process, the <strong>San</strong> <strong>Francisco</strong> <strong>Planning</strong> <strong>Department</strong> conducted a public<br />
scoping effort in March 2011, soliciting comments from interested parties, State and natural<br />
resource agencies, and the public to help determine the scope of the Draft EIR. This report<br />
describes the scoping process and summarizes the public and regulatory agencies’ comments<br />
received during the scoping period.<br />
1.2 Notice of Preparation<br />
The <strong>San</strong> <strong>Francisco</strong> <strong>Planning</strong> <strong>Department</strong> published a Revised Notice of Preparation (NOP) on<br />
March 2, 2011, announcing the preparation of the Draft EIR for the project under CEQA. The<br />
Revised NOP summarized the project objectives and provided a description of the proposed<br />
project. The Revised NOP also described the scoping process. The scoping process, and<br />
notification procedures are described below, following a brief description of the proposed project.<br />
1.3 <strong>San</strong> <strong>Francisco</strong> Groundwater Supply Project<br />
The purpose of the <strong>San</strong> <strong>Francisco</strong> Groundwater Supply Project (project) is to provide an average<br />
of four million gallons per day (mgd) of groundwater to <strong>San</strong> <strong>Francisco</strong>’s municipal water supply.<br />
Subsequent to the initial NOP and scoping period from December 2009 to January 2010, the<br />
SFPUC modified the project. As a result, a revised NOP has been prepared to inform you of the<br />
following changes to the project:<br />
<br />
<br />
<br />
The proposed pipeline alignment between Vicente and Quintara streets has been moved<br />
from 40th Avenue to 41st Avenue.<br />
Project description information regarding Sunset Reservoir connection point requirements<br />
has been clarified.<br />
The West of Spreckels Lake and Polo Field well facility alternatives have been removed<br />
from the project description.<br />
<strong>San</strong> <strong>Francisco</strong> Groundwater Supply Project 1 June 2011<br />
Case No. 2008.1122E<br />
A.2-7
Scoping Report<br />
<br />
A portion of the pipeline alignment within Golden Gate Park east of 41st Avenue/Chain of<br />
Lakes Drive East has been moved from Martin Luther King Jr. Drive to Middle Drive<br />
West.<br />
Groundwater would be blended with <strong>San</strong> <strong>Francisco</strong>’s existing municipal water supply for<br />
distribution within <strong>San</strong> <strong>Francisco</strong>. The groundwater would be pumped from the North Westside<br />
Groundwater Basin, which is located within the larger Westside Groundwater Basin that<br />
underlies parts of <strong>San</strong> <strong>Francisco</strong> and <strong>San</strong> Mateo Counties. Facilities required to implement the<br />
project, including groundwater production well facilities, would be located on the western side of<br />
the city of <strong>San</strong> <strong>Francisco</strong> on property owned by the City and County of <strong>San</strong> <strong>Francisco</strong> (CCSF),<br />
and managed by the <strong>San</strong> <strong>Francisco</strong> Public Utilities Commission (SFPUC) or the <strong>San</strong> <strong>Francisco</strong><br />
Recreation and Park <strong>Department</strong>.<br />
Under the project, the SFPUC would construct and operate six potable groundwater production<br />
well facilities. Although seven locations are currently under consideration for the groundwater<br />
production well facilities, only six facilities would be constructed—two that would be converted<br />
from existing irrigation well facilities and four new well facilities. Each facility would include a<br />
groundwater production well and a pump station. The SFPUC would also construct a distribution<br />
system (including pipelines and connection points) that would connect five of the well facilities<br />
to Sunset Reservoir; the sixth well would connect to the existing Lake Merced Pump Station, and<br />
would require a short length of distribution piping to make this connection. The project would be<br />
implemented in two phases: (1) construction and operation of the four new well facilities to<br />
supply an annual average of approximately 2.5 to 3.0 mgd of groundwater; and (2) construction<br />
of well facilities required to convert the two existing irrigation well facilities to potable water<br />
well facilities and operation of the converted irrigation wells to provide an additional annual<br />
average of approximately 1.0 to 1.5 mgd of groundwater.<br />
The project is a component of the SFPUC’s Water System Improvement Program (WSIP), which<br />
includes facility improvement projects designed to: (1) maintain high-quality water; (2) reduce<br />
vulnerability to earthquakes; (3) increase delivery reliability and improve the ability to maintain<br />
the water system; (4) meet customer purchase requests in nondrought and drought periods; (5)<br />
enhance sustainability in all system activities; and (6) achieve a cost-effective, fully operational<br />
system. Implementation of the project, as a component of the WSIP, would contribute to meeting<br />
the overall WSIP goals and objectives.<br />
2.0 Purpose of the Scoping Process<br />
The purpose of the scoping process is to solicit input from the public, interested parties, and<br />
agencies with discretionary authority over the project on the appropriate scope, focus, and content<br />
of the Draft EIR. The <strong>San</strong> <strong>Francisco</strong> <strong>Planning</strong> <strong>Department</strong> will consider all of the input received<br />
during the scoping process in the preparation of the Draft EIR.<br />
The Draft EIR will describe the existing environmental conditions of the area that could be<br />
affected by the proposed project and evaluate the potential effects of the project on the<br />
<strong>San</strong> <strong>Francisco</strong> Groundwater Supply Project 2 June 2011<br />
Case No. 2008.1122E<br />
A.2-8
Scoping Report<br />
environment in accordance with CEQA. The comments provided by the public and agencies<br />
during scoping will help the <strong>San</strong> <strong>Francisco</strong> <strong>Planning</strong> <strong>Department</strong> identify pertinent issues,<br />
methods of analyses, and level of detail that should be addressed in the Draft EIR. The scoping<br />
comments will also provide the input for development of a reasonable range of feasible<br />
alternatives to be evaluated in the Draft EIR.<br />
The scoping comments will augment the information developed by the EIR project team, which<br />
includes specialists in each of the environmental subject areas covered in the EIR. This combined<br />
input will result in an EIR that is both comprehensive and responsive to issues raised by the<br />
public and regulatory agencies, and that meets CEQA requirements. The Draft EIR is scheduled<br />
to be available for public comment in late 2011.<br />
In addition to facilitating public and regulatory agency input on the scope and focus of the Draft<br />
EIR, scoping allows the <strong>San</strong> <strong>Francisco</strong> <strong>Planning</strong> <strong>Department</strong> to explain the EIR process to the<br />
public and to identify additional opportunities for public comment and public involvement during<br />
the EIR process.<br />
3.0 Notification of Scoping<br />
The first scoping period began on December 30, 2009, with the issuance of the NOP. The <strong>San</strong><br />
<strong>Francisco</strong> <strong>Planning</strong> <strong>Department</strong> held a scoping meeting on January 20, 2010, and accepted written<br />
comments through January 30, 2010.<br />
The second scoping period began on March 2, 2011, with the issuance of the Revised NOP. The<br />
<strong>San</strong> <strong>Francisco</strong> <strong>Planning</strong> <strong>Department</strong> accepted written comments through April 1, 2011. The<br />
following methods were used to notify agencies and the public about the availability of the<br />
Revised NOP:<br />
<br />
<br />
Mailing List. A mailing list was compiled, including approximately 3,700 contacts for<br />
federal, state, regional, and local agencies; federal, state, regional, and local elected<br />
officials; regional and local interest groups; member agencies of the Bay Area Water<br />
Supply and Conservation Agency; other potentially affected water districts; SFPUC<br />
Community Advisory Committee members; information repositories; media contacts; and<br />
property owners and residents 300 feet within the proposed project limits.<br />
Revised Notice of Preparation of an EIR. Copies of the Revised NOP were<br />
distributed via certified mail to responsible and trustee agencies and 15 copies were<br />
delivered to the State Clearinghouse (See Appendix A for a copy of the Revised NOP and<br />
Revised NOP Notice of Availability). In addition, a notice of availability of the Revised<br />
NOP was distributed via first-class mail to the entire mailing list (approximately 3,700<br />
addressees):<br />
- Locations to obtain a copy of the Revised NOP. The revised NOP was posted to the<br />
<strong>San</strong> <strong>Francisco</strong> <strong>Planning</strong> <strong>Department</strong>’s website (http://mea.sfplanning.org). A printed<br />
copy of the Revised NOP was also provided to anyone who requested it from the <strong>San</strong><br />
<strong>Francisco</strong> <strong>Planning</strong> <strong>Department</strong>.<br />
<strong>San</strong> <strong>Francisco</strong> Groundwater Supply Project 3 June 2011<br />
Case No. 2008.1122E<br />
A.2-9
Scoping Report<br />
TABLE 1<br />
NUMBER OF RECIPIENTS ON MAILING LIST FOR REVISED NOP<br />
Category<br />
Number of NOP Recipients<br />
Number of NOP Notice of<br />
Availability Recipients<br />
Owners and Occupants<br />
Wholesale Customers<br />
0<br />
3<br />
5,813<br />
45<br />
Responsible and Trustee Agencies, Other Agencies 9 0<br />
SFPUC Citizen's Advisory Committee 0 17<br />
Interested Parties 6 322<br />
Local and Bordering Jurisdictions 0 9<br />
Media, Libraries, and Individuals 18 6<br />
TOTAL 36 6,212<br />
4.0 Overview of Comments Received<br />
Agencies and members of the public utilized several different methods of providing input: written<br />
comments submitted via U.S. mail, email and fax. Table 2 lists agencies and other parties that<br />
provided written comments in response to the Revised NOP, listed by comment letter number.<br />
Copies of comment letters and emails are located in Appendix B.<br />
TABLE 2<br />
INDEX OF WRITTEN COMMENTS<br />
Comment<br />
Letter No.<br />
1. Agencies<br />
1A<br />
Commenter<br />
<strong>San</strong> <strong>Francisco</strong> Recreation and Parks, Karen Mauney-Brodek<br />
2. Organizations<br />
2A Golden Gate Park Preservation Alliance (Katherine Howard)<br />
3. Individuals<br />
3A<br />
3B<br />
3C<br />
3D<br />
Dale Gutierrez<br />
Dale Gutierrez<br />
Steve Lawrence<br />
Nancy Wuerfel<br />
<strong>San</strong> <strong>Francisco</strong> Groundwater Supply Project 4 June 2011<br />
Case No. 2008.1122E<br />
A.2-10
Scoping Report<br />
5.0 Summary of Comments by Subject Area<br />
This section summarizes the issues raised in written during the scoping period. Table 3 provides a<br />
summary of scoping comments by commenter. (<strong>Appendices</strong> B also contain all of the commenter<br />
correspondence.<br />
<strong>San</strong> <strong>Francisco</strong> Groundwater Supply Project 5 June 2011<br />
Case No. 2008.1122E<br />
A.2-11
Scoping Report<br />
TABLE 3<br />
SUMMARY OF COMMENTS BY COMMENTER<br />
Commenter Page, Paragraph Summary of Comment CEQA Subject Area<br />
Comments Not Applicable to<br />
CEQA or the Proposed Project<br />
A.2-12<br />
1A<br />
1A<br />
1A<br />
1A<br />
1A<br />
1A<br />
1A<br />
1A<br />
<strong>San</strong> <strong>Francisco</strong><br />
Recreation and Parks,<br />
Karen Mauney-Brodek<br />
<strong>San</strong> <strong>Francisco</strong><br />
Recreation and Parks,<br />
Karen Mauney-Brodek<br />
<strong>San</strong> <strong>Francisco</strong><br />
Recreation and Parks,<br />
Karen Mauney-Brodek<br />
<strong>San</strong> <strong>Francisco</strong><br />
Recreation and Parks,<br />
Karen Mauney-Brodek<br />
<strong>San</strong> <strong>Francisco</strong><br />
Recreation and Parks,<br />
Karen Mauney-Brodek<br />
<strong>San</strong> <strong>Francisco</strong><br />
Recreation and Parks,<br />
Karen Mauney-Brodek<br />
<strong>San</strong> <strong>Francisco</strong><br />
Recreation and Parks,<br />
Karen Mauney-Brodek<br />
<strong>San</strong> <strong>Francisco</strong><br />
Recreation and Parks,<br />
Karen Mauney-Brodek<br />
Page 1, Paragraph 1 Opening statement Not applicable to CEQA<br />
Page 1, Paragraph 2 Clarifies that the project involves several<br />
properties under the jurisdiction of the<br />
Recreation and Parks <strong>Department</strong> (RPD). An<br />
MOU was approved and establishes as a<br />
framework for collaboration between RPD and<br />
the Public Utilities Commission. Water Use<br />
Efficiency programs have been beneficial to<br />
RPD and the parks they manage.<br />
Page 1, Paragraph 3 The West Sunset Playground and South<br />
Street Playground have had test wells<br />
installed. Permanent facilities at these<br />
properties will require approval.<br />
Page 1, Paragraph 4 Confirms that the project does involved<br />
Golden Gate Park. The project will affect all of<br />
the RPS properties within the scope of work.<br />
Page 1, Paragraph 5 States that site alternatives for the well<br />
location inside and outside of the Golden Gate<br />
Park have already been studied and reviewed<br />
by RPD staff. Recommends alignments<br />
through Golden Gate Park produce minimal<br />
impacts.<br />
Page 1, Paragraph 6 Emphasizes the importance of Golden Gate<br />
Parks landscapes, views, recreation, habitat<br />
historic and intrinsic value. Recommends the<br />
<strong>Planning</strong> <strong>Department</strong>’s historical planning staff<br />
should be consulted to determine the<br />
appropriate pipeline alignment.<br />
Page 2, Paragraph 1 States that the project should not impeded the<br />
RPD’s regular and long term maintenance of<br />
operation. Recommends pipeline be located<br />
away from maintenance yards, storage areas<br />
or waste facilities.<br />
Page 2, Paragraph 2 The project should not hinder the use of the<br />
parks including recreation facilities.<br />
Project Description<br />
Project Description<br />
Project Description<br />
Alternatives<br />
Cultural and Paleontological Resources<br />
Recreation<br />
Project Description<br />
Recreation<br />
<strong>San</strong> <strong>Francisco</strong> Groundwater Supply Project 6 June 2011<br />
Case No. 2008.1122E
Scoping Report<br />
TABLE 3 (Continued)<br />
SUMMARY OF COMMENTS BY COMMENTER<br />
Commenter Page, Paragraph Summary of Comment CEQA Subject Area<br />
Comments Not Applicable to<br />
CEQA or the Proposed Project<br />
A.2-13<br />
1A<br />
1A<br />
2A<br />
2A<br />
2A<br />
2A<br />
2A<br />
2A<br />
2A<br />
2A<br />
<strong>San</strong> <strong>Francisco</strong><br />
Recreation and Parks,<br />
Karen Mauney-Brodek<br />
<strong>San</strong> <strong>Francisco</strong><br />
Recreation and Parks,<br />
Karen Mauney-Brodek<br />
Golden Gate Park<br />
Preservation Alliance<br />
Golden Gate Park<br />
Preservation Alliance<br />
Golden Gate Park<br />
Preservation Alliance<br />
Golden Gate Park<br />
Preservation Alliance<br />
Golden Gate Park<br />
Preservation Alliance<br />
Golden Gate Park<br />
Preservation Alliance<br />
Golden Gate Park<br />
Preservation Alliance<br />
Golden Gate Park<br />
Preservation Alliance<br />
Page 2, Paragraph 3 The Recreation and Parks Commission would<br />
need to review the EIR to make appropriate<br />
findings in adopting any agreement.<br />
Not applicable to CEQA<br />
Page 2, Paragraph 4 Closing Comments Not applicable to CEQA<br />
Page 1, Paragraph 1 Opening comments. Suggest the department<br />
do a comprehensive outreach to more people<br />
who have expressed concern in the past with<br />
issues relating to Golden Gate Park.<br />
Page 1, Paragraph 2 Would like to see impacts, alternative design,<br />
issues related to other water treatment<br />
projects and safety impacts thoroughly<br />
analyzed in the EIR.<br />
Page 2, Paragraph 1 Concerned with construction impacts to the<br />
immediate and adjoining parkland in regards<br />
to earth-moving and tree removal<br />
Page 2, Paragraph 2 Concerned with construction impacts outside<br />
of the parkland including construction impacts<br />
to nearby residential and commercial areas.<br />
Page 2, Paragraph 3 Request that the EIR include parking studies<br />
and traffic impacts.<br />
Page 2, Paragraph 4 Request that the EIR include analyses on the<br />
impacts to wildlife and other biological<br />
resources.<br />
Page 2, Paragraph 5 Request that the EIR include analyses on<br />
impacts related to aesthetics and construction<br />
noise. Concerned with the loss of trees as an<br />
aesthetics resources.<br />
Page 2, Paragraph 6 Request that the EIR include analyses on the<br />
loss of parkland related to recreation uses.<br />
Suggest an alternative of using the<br />
construction yard as the location for the pump<br />
station.<br />
Public participation process<br />
Project Description<br />
Hydrology (Groundwater Recharge and<br />
Quality)<br />
Cumulative Impacts<br />
Project Description<br />
Biological Resources<br />
Noise<br />
Transportation and Circulation<br />
Biological Resources<br />
Aesthetics<br />
Noise<br />
Recreation<br />
Alternatives<br />
<strong>San</strong> <strong>Francisco</strong> Groundwater Supply Project 7 June 2011<br />
Case No. 2008.1122E
Scoping Report<br />
TABLE 3 (Continued)<br />
SUMMARY OF COMMENTS BY COMMENTER<br />
Commenter Page, Paragraph Summary of Comment CEQA Subject Area<br />
Comments Not Applicable to<br />
CEQA or the Proposed Project<br />
A.2-14<br />
2A<br />
2A<br />
2A<br />
2A<br />
2A<br />
2A<br />
2A<br />
2A<br />
2A<br />
2A<br />
Golden Gate Park<br />
Preservation Alliance<br />
Golden Gate Park<br />
Preservation Alliance<br />
Golden Gate Park<br />
Preservation Alliance<br />
Golden Gate Park<br />
Preservation Alliance<br />
Golden Gate Park<br />
Preservation Alliance<br />
Golden Gate Park<br />
Preservation Alliance<br />
Golden Gate Park<br />
Preservation Alliance<br />
Golden Gate Park<br />
Preservation Alliance<br />
Golden Gate Park<br />
Preservation Alliance<br />
Golden Gate Park<br />
Preservation Alliance<br />
Page 3, Paragraph 1 Request that the EIR include analyses on the<br />
aquifer underneath Golden Gate Park.<br />
Page 3, Paragraph 2 Request that the EIR study the impacts of the<br />
energy to power the plant, including the<br />
amount of energy needed to pump water out<br />
of the ground to Sunset Reservoir.<br />
Page 3, Paragraph 3 Request that the EIR include analyses on<br />
economic impacts of the project related to cost<br />
of water to consumers and taxpayers. Suggest<br />
considering a less expensive alternative to the<br />
proposed project.<br />
Page 3, Paragraph 4 EIR should explore future expansion of the<br />
pumping station at the Golden Gate Park and<br />
other parkland locations.<br />
Page 3, Paragraph 5 Request that the EIR include analyses on the<br />
cumulative impacts of the existing and<br />
proposed athletic/soccer field and Westside<br />
Water Treatment Plant.<br />
Page 3, Paragraph 6 EIR should explore alternative designs that<br />
preserve the natural meadow and forest<br />
feeling of Golden Gate Park.<br />
Page 3, Paragraph 7 EIR should explore alternative design for the<br />
West Sunset Playground pumping station.<br />
Page 4, Paragraph 1 EIR should explain the relationship of the<br />
proposed project to all relevant City<br />
documents and agreements.<br />
Page 4, Paragraph 2 EIR should explain the relationship of the<br />
proposed project to all other water projects in<br />
<strong>San</strong> <strong>Francisco</strong>.<br />
Page 4, Paragraph 3 EIR should include analyses on safety issues<br />
related to the proposed plant. Safety issues<br />
related to risk of damage by earthquakes,<br />
tsunamis, and industrial accidents.<br />
Hydrology (Groundwater Recharge,<br />
Groundwater Quality)<br />
Utilities<br />
Alternatives<br />
Project Location<br />
Alternative<br />
Cumulative Analyzes<br />
Alternatives<br />
Alternatives<br />
Cumulative<br />
Plans and Policies<br />
Cumulative Analyzes<br />
Geology<br />
Hazardous materials<br />
Water Quality<br />
<strong>San</strong> <strong>Francisco</strong> Groundwater Supply Project 8 June 2011<br />
Case No. 2008.1122E
Scoping Report<br />
TABLE 3 (Continued)<br />
SUMMARY OF COMMENTS BY COMMENTER<br />
Commenter Page, Paragraph Summary of Comment CEQA Subject Area<br />
Comments Not Applicable to<br />
CEQA or the Proposed Project<br />
A.2-15<br />
2A<br />
2A<br />
2A<br />
2A<br />
Golden Gate Park<br />
Preservation Alliance<br />
Golden Gate Park<br />
Preservation Alliance<br />
Golden Gate Park<br />
Preservation Alliance<br />
Golden Gate Park<br />
Preservation Alliance<br />
Page 5, Paragraph 1 Request that the EIR include analyses on<br />
water conservation alternatives including use<br />
of desalinated water, and the use of tertiary<br />
water.<br />
Page 5,<br />
Paragraph 2-3<br />
EIR should include the non-building of the <strong>San</strong><br />
<strong>Francisco</strong> Westside Water Project as an<br />
alternative.<br />
Page 5, Paragraph 4 Includes letter addressing scoping issues for<br />
the Beach Chalet Soccer Fields Renovation.<br />
Page 6,<br />
Paragraph 1-2<br />
Closing comments. Hopes the EIR will result<br />
in a project that will be all around beneficial.<br />
3A Gutierrez, Dale Page 1, Paragraph 1 References notice from the <strong>Planning</strong><br />
Commission.<br />
3A Gutierrez, Dale Page 1,<br />
Paragraph 2-3<br />
Understands the needs for a diverse water<br />
supply but opposes the use of groundwater.<br />
Concerned with the cost of groundwater.<br />
Alternatives<br />
Alternatives<br />
Public participation process<br />
Not applicable to CEQA<br />
Not applicable to CEQA<br />
Not applicable to CEQA<br />
3A Gutierrez, Dale Page 1, Paragraph 4 Opposes the project. Not applicable to CEQA<br />
3B Gutierrez, Dale Page 1,<br />
Paragraphs 1<br />
3B Gutierrez, Dale Page 1,<br />
Paragraphs 2<br />
3C Lawrence, Steve Page 1,<br />
Paragraphs 1<br />
Opposes the project. Concerned with water<br />
quality and its impacts to public health.<br />
Concerned with economic and social impacts<br />
regarding the project.<br />
Express interests in voicing concerns during<br />
the public commenting phase.<br />
Expresses concern with the over drawing of<br />
the water basins, believes the project will<br />
extract too much water.<br />
3C Lawrence, Steve Page 1, Paragraph 2 Expresses concern about the possibly of<br />
saltwater intrusion into the groundwater.<br />
Question the effects of sea level rise and the<br />
use of groundwater in wet vs. dry years.<br />
3C Lawrence, Steve Page 1, Paragraph 3 Asserts that recycled water will be used to<br />
irrigate Golden Gate Park and questions the<br />
impacts of recycled water reaching the<br />
groundwater table. Expresses concern for<br />
water quality.<br />
Water Quality<br />
Public participation process<br />
Hydrology (Groundwater Recharge)<br />
Hydrology (Groundwater Recharge,<br />
Groundwater Quality)<br />
Hydrology (Groundwater Recharge,<br />
Groundwater Quality)<br />
<strong>San</strong> <strong>Francisco</strong> Groundwater Supply Project 9 June 2011<br />
Case No. 2008.1122E
Scoping Report<br />
TABLE 3 (Continued)<br />
SUMMARY OF COMMENTS BY COMMENTER<br />
Commenter Page, Paragraph Summary of Comment CEQA Subject Area<br />
Comments Not Applicable to<br />
CEQA or the Proposed Project<br />
3C Lawrence, Steve Page 1, Paragraph 4 Expresses concern regarding the amount of<br />
groundwater that will be used. Questions if<br />
season variations during the year will affect<br />
the amount of groundwater being used.<br />
Hydrology<br />
A.2-16<br />
3C Lawrence, Steve Page 1, Paragraph 5 Questions if and how an earthquake could<br />
damage the aquifer. Expresses concern<br />
regarding water quality if the water system is<br />
damaged by an earthquake.<br />
Geology<br />
Water Quality<br />
Hydrology<br />
3D Wuerfel, Nancy Page 1, Paragraph 1 Opening comments Not applicable to CEQA<br />
3D Wuerfel, Nancy Page 1,<br />
Paragraph 2-4<br />
3D Wuerfel, Nancy Page 1,<br />
Paragraph 5-6<br />
Expresses concern about 3 new well facilities<br />
being built on park lands, which does not<br />
comply with Section 4.113 of the city charter<br />
Expresses concern for the lost of groundwater<br />
as an irrigation source at 2 parks and reliance<br />
on a recycled water plant.<br />
3D Wuerfel, Nancy Page 2, Paragraph 1 Questions if groundwater was diverted to park<br />
irrigation would Sunset Reservoir be backfilled<br />
with Hetch Hetchy water to 100%<br />
3D Wuerfel, Nancy Page 2, Paragraph 2 Questions the effects of using recycled water<br />
on Golden Gate Park over time.<br />
3D Wuerfel, Nancy Page 2, Paragraph 3 Questions the impacts of operational noise on<br />
recreation and wildlife.<br />
3D Wuerfel, Nancy Page 2, Paragraph 4 Questions why the system cannot be used to<br />
transport the groundwater to Sunset Reservoir<br />
instead of trenching new pipelines along 41 st<br />
Avenue.<br />
3D Wuerfel, Nancy Page 2, Paragraph 5 Expresses concern for water quality impacting<br />
public health if Hetch Hetchy water and<br />
groundwater are consumed.<br />
3D Wuerfel, Nancy Page 2, Paragraph 6 Questions if a new EIR will be circulated if the<br />
ratio of groundwater is changed.<br />
3D Wuerfel, Nancy Page 2, Paragraph 7 Questions the effects of using groundwater<br />
and Hetch Hetchy water blend on home<br />
appliances.<br />
Project Location<br />
Land Use<br />
Hydrology<br />
Hydrology<br />
Hydrology<br />
Water Quality<br />
Biological Resources<br />
Noise<br />
Project Description<br />
Water Quality<br />
Recirculation<br />
Not applicable to CEQA<br />
<strong>San</strong> <strong>Francisco</strong> Groundwater Supply Project 10 June 2011<br />
Case No. 2008.1122E
Scoping Report<br />
TABLE 3 (Continued)<br />
SUMMARY OF COMMENTS BY COMMENTER<br />
Commenter Page, Paragraph Summary of Comment CEQA Subject Area<br />
Comments Not Applicable to<br />
CEQA or the Proposed Project<br />
3D Wuerfel, Nancy Page 2, Paragraph 8 Expresses concern that part of <strong>San</strong> <strong>Francisco</strong><br />
will be drinking this water, while other are not.<br />
3D Wuerfel, Nancy Page 2, Paragraph 9 Questions what access would be available to<br />
the groundwater site and alternatives points of<br />
access.<br />
Water Quality<br />
Project Location<br />
Transportation<br />
A.2-17<br />
3D Wuerfel, Nancy Page 2,<br />
Paragraph 10<br />
3D Wuerfel, Nancy Page 2,<br />
Paragraph 11<br />
Questions what will be done if 4 mgd of<br />
groundwater cannot be produced to blend with<br />
Hetch Hetchy water because park access<br />
cannot be used.<br />
Questions the effect on human health if the<br />
groundwater is not blended with the Hetch<br />
Hetchy water. Questions what other options<br />
are there to meet the water needs.<br />
Project Location<br />
Project Description<br />
Water Quality<br />
3D Wuerfel, Nancy Page 3, Paragraph 1 Question how the project promotes population Land Use<br />
growth in <strong>San</strong> <strong>Francisco</strong>. Concerned with<br />
conservation and new housing growth. Population and Housing<br />
3D Wuerfel, Nancy Page 3, Paragraph 2 Closing comments Not applicable to CEQA<br />
<strong>San</strong> <strong>Francisco</strong> Groundwater Supply Project 11 June 2011<br />
Case No. 2008.1122E
This page intentionally left blank<br />
A.2-18
APPENDICES<br />
A. Notice of Preparation (NOP) and NOP Notice of Availability<br />
B. Comments Received During EIR Scoping Process<br />
<strong>San</strong> <strong>Francisco</strong> Groundwater Supply Project June 2011<br />
Case No. 2008.2211E<br />
A.2-19
This page intentionally left blank<br />
A.2-20
APPENDIX A<br />
Notice of Preparation and NOP Notice of<br />
Availability<br />
<strong>San</strong> <strong>Francisco</strong> Groundwater Supply Project A-1 June 2011<br />
Case No. 2008.1122E<br />
A.2-21
This page intentionally left blank<br />
A.2-22
March 2, 2011<br />
TO:<br />
RE:<br />
Responsible Agencies, Trustee Agencies, and Interested Parties<br />
CASE NO. 2008.1122E – SAN FRANCISCO GROUNDWATER SUPPLY PROJECT<br />
REVISED NOTICE OF PREPARATION OF AN ENVIRONMENTAL IMPACT REPORT<br />
A revised Notice of Preparation of an Environmental Impact Report (EIR) for the above‐referenced<br />
project, described below, has been issued by the <strong>Planning</strong> <strong>Department</strong>. The <strong>Planning</strong> <strong>Department</strong><br />
previously issued a Notice of Preparation (NOP) for the above‐referenced project on December 30, 2009,<br />
and a scoping meeting was held on January 20, 2010 in the project vicinity. The <strong>San</strong> <strong>Francisco</strong> Public<br />
Utilities Commission (SFPUC) has since made certain changes to the proposed project, and the revised<br />
NOP for the revised project description is either attached or is available upon request from Timothy<br />
Johnston, whom you may reach at (415) 575‐9035 or Timothy.Johnston@sfgov.org or by mail at the above<br />
address. It is also available online at http://tinyurl.com/puccases. This notice is being sent to you because<br />
you have been identified as potentially having an interest in the project or the project area.<br />
Project Description:<br />
Subsequent to the NOP and scoping period from December 2009 to January 2010, the SFPUC has<br />
made certain changes to the <strong>San</strong> <strong>Francisco</strong> Groundwater Supply Project (the project). As a result, a<br />
revised NOP has been prepared to inform you of the following changes to the project:<br />
• The proposed pipeline alignment between Vicente and Quintara streets has been moved from<br />
40th Avenue to 41st Avenue.<br />
• Project description information regarding Sunset Reservoir connection point requirements has<br />
been clarified.<br />
• The West of Spreckels Lake and Polo Field well facility alternatives have been removed from<br />
the project description.<br />
• A portion of the pipeline alignment within Golden Gate Park east of 41st Avenue/Chain of<br />
Lakes Drive East has been moved from Martin Luther King Jr. Drive to Middle Drive West.<br />
As described in the NOP, the purpose of the project is to provide an average of four million gallons<br />
per day (mgd) of groundwater to <strong>San</strong> <strong>Francisco</strong>’s municipal water supply. Groundwater would be<br />
blended with <strong>San</strong> <strong>Francisco</strong>’s existing municipal water supply for distribution within <strong>San</strong> <strong>Francisco</strong>.<br />
The groundwater would be pumped from the North Westside Groundwater Basin, which is located<br />
within the larger Westside Groundwater Basin that underlies parts of <strong>San</strong> <strong>Francisco</strong> and <strong>San</strong> Mateo<br />
Counties. Facilities required to implement the project, including groundwater production well<br />
facilities, would be located on the western side of the city of <strong>San</strong> <strong>Francisco</strong> on property owned by the<br />
City and County of <strong>San</strong> <strong>Francisco</strong>, and managed by the <strong>San</strong> <strong>Francisco</strong> Public Utilities Commission<br />
(SFPUC) or the <strong>San</strong> <strong>Francisco</strong> Recreation and Park <strong>Department</strong>.<br />
Under the project, the SFPUC would construct and operate six potable groundwater production well<br />
facilities. Although seven locations are currently under consideration for the groundwater production<br />
well facilities, only six facilities would be constructed—two that would be converted from existing<br />
www.sfplanning.org<br />
A.2-23
irrigation well facilities, and four new well facilities. Each well facility would include a groundwater<br />
production well and a pump station. The SFPUC would also construct a distribution system<br />
(including pipelines and connection points) that would connect five of the well facilities to Sunset<br />
Reservoir; the sixth well would connect to the existing Lake Merced Pump Station, and would require<br />
a short length of distribution piping to make this connection. The project would be implemented in<br />
two phases: (1) construction and operation of the four new well facilities to supply an annual average<br />
of approximately 2.5 to 3.0 mgd of groundwater; and (2) construction of well facilities required to<br />
convert two existing irrigation well facilities to potable water well facilities and operation of the<br />
converted irrigation wells to provide an additional annual average of approximately 1.0 to 1.5 mgd of<br />
groundwater.<br />
The project is a component of the SFPUC’s Water System Improvement Program (WSIP). The WSIP,<br />
approved by the SFPUC in October, 2008, includes facility improvement projects designed to:<br />
(1) maintain high‐quality water; (2) reduce vulnerability to earthquakes; (3) increase delivery<br />
reliability and improve the ability to maintain the water system; (4) meet customer purchase requests<br />
in nondrought and drought periods; (5) enhance sustainability in all system activities; and (6) achieve<br />
a cost‐effective, fully operational system. Implementation of the project, as a component of the WSIP,<br />
would contribute to meeting the overall WSIP goals and objectives.<br />
As set forth in the NOP, the <strong>San</strong> <strong>Francisco</strong> <strong>Planning</strong> <strong>Department</strong> has determined that an EIR must be<br />
prepared for the project prior to any final decision regarding whether to approve the project. The<br />
purpose of the EIR is to provide information about potential significant physical environmental effects of<br />
the project, to identify possible ways to minimize the significant effects, and to describe and analyze<br />
possible alternatives to the project. Preparation of a NOP or EIR does not indicate a decision by the City<br />
to approve or to disapprove the project. However, prior to making any such decision, the decisionmakers<br />
must review and consider the information contained in the EIR.<br />
Written comments will be accepted until the close of business on April 1, 2011. These comments will<br />
assist the <strong>Planning</strong> <strong>Department</strong> in reviewing the scope and content of the environmental impact analysis<br />
and information to be contained in the EIR that is being prepared for the project. Written comments<br />
should be sent to Bill Wycko, c/o Timothy Johnston, <strong>San</strong> <strong>Francisco</strong> <strong>Planning</strong> <strong>Department</strong>, 1650 Mission<br />
Street, Suite 400, <strong>San</strong> <strong>Francisco</strong>, CA 94103‐2479; by fax to (415) 558‐6409 (Attn: Timothy Johnston); or by<br />
e‐mail to Timothy.Johnston@sfgov.org. Comments that were received in response to the December 2009<br />
NOP remain on file with the <strong>Planning</strong> <strong>Department</strong> and will be considered during environmental review<br />
of the project to the extent that they remain relevant to the project, as revised.<br />
If you work for an agency that is a Responsible or a Trustee Agency, we need to know the views of<br />
your agency as to the scope and content of the environmental information that is relevant to your<br />
agency’s statutory responsibilities in connection with the proposed project. Your agency may need to<br />
use the EIR when considering a permit or other approval for this proposed project. We will also need<br />
the name of the contact person for your agency. If you have questions concerning environmental<br />
review of the proposed project under CEQA, please contact Timothy Johnston at (415) 575‐9035 or<br />
Timothy.Johnston@sfgov.org.<br />
A.2-24<br />
2
Revised Notice of Preparation of an Environmental Impact Report<br />
Date: March 2, 2011<br />
Case No.: 2008.1122E<br />
Project Title: <strong>San</strong> <strong>Francisco</strong> Groundwater Supply Project<br />
Location: The project is located in the North Westside Groundwater Basin,<br />
which is within the larger Westside Groundwater Basin underlying<br />
parts of <strong>San</strong> <strong>Francisco</strong> and <strong>San</strong> Mateo Counties. Project facilities would<br />
be constructed in the Sunset District of <strong>San</strong> <strong>Francisco</strong> and in Golden<br />
Gate Park.<br />
BPA Nos.: N/A<br />
Zoning:<br />
Various<br />
Block/Lot: Various<br />
Lot Size:<br />
Various<br />
Project Sponsor Antonia Sivyer, <strong>San</strong> <strong>Francisco</strong> Public Utilities Commission<br />
(415) 554‐3238; ASivyer@sfwater.org<br />
Lead Agency: <strong>San</strong> <strong>Francisco</strong> <strong>Planning</strong> <strong>Department</strong><br />
Staff Contact: Timothy Johnston – (415) 575‐9035; timothy.johnston@sfgov.org<br />
PROJECT DESCRIPTION<br />
The purpose of the <strong>San</strong> <strong>Francisco</strong> Groundwater Supply Project (project) is to provide an average of four<br />
million gallons per day (mgd) of groundwater to <strong>San</strong> <strong>Francisco</strong>’s municipal water supply. Subsequent to<br />
the initial Notice of Preparation (NOP) and scoping period from December 2009 to January 2010, the<br />
SFPUC modified the project. As a result, a revised NOP has been prepared to inform you of the following<br />
changes to the project:<br />
• The proposed pipeline alignment between Vicente and Quintara streets has been moved from<br />
40th Avenue to 41st Avenue.<br />
• Project description information regarding Sunset Reservoir connection point requirements has<br />
been clarified.<br />
• The West of Spreckels Lake and Polo Field well facility alternatives have been removed from the<br />
project description.<br />
• A portion of the pipeline alignment within Golden Gate Park east of 41st Avenue/Chain of Lakes<br />
Drive East has been moved from Martin Luther King Jr. Drive to Middle Drive West.<br />
Groundwater would be blended with <strong>San</strong> <strong>Francisco</strong>’s existing municipal water supply for distribution<br />
within <strong>San</strong> <strong>Francisco</strong>. The groundwater would be pumped from the North Westside Groundwater Basin,<br />
which is located within the larger Westside Groundwater Basin that underlies parts of <strong>San</strong> <strong>Francisco</strong> and<br />
<strong>San</strong> Mateo Counties. Facilities required to implement the project, including groundwater production well<br />
facilities, would be located on the western side of the city of <strong>San</strong> <strong>Francisco</strong> on property owned by the City<br />
and County of <strong>San</strong> <strong>Francisco</strong> (CCSF), and managed by the <strong>San</strong> <strong>Francisco</strong> Public Utilities Commission<br />
(SFPUC) or the <strong>San</strong> <strong>Francisco</strong> Recreation and Park <strong>Department</strong>.<br />
www.sfplanning.org<br />
A.2-25
Notice of Preparation of an EIR<br />
March 2, 2011<br />
Case No.2008.1122E<br />
<strong>San</strong> <strong>Francisco</strong> Groundwater Supply Project<br />
Under the project, the SFPUC would construct and operate six potable groundwater production well<br />
facilities. Although seven locations are currently under consideration for the groundwater production<br />
well facilities, only six facilities would be constructed—two that would be converted from existing<br />
irrigation well facilities and four new well facilities. Each facility would include a groundwater<br />
production well and a pump station. The SFPUC would also construct a distribution system (including<br />
pipelines and connection points) that would connect five of the well facilities to Sunset Reservoir; the<br />
sixth well would connect to the existing Lake Merced Pump Station, and would require a short length of<br />
distribution piping to make this connection. The project would be implemented in two phases:<br />
(1) construction and operation of the four new well facilities to supply an annual average of<br />
approximately 2.5 to 3.0 mgd of groundwater; and (2) construction of well facilities required to convert<br />
the two existing irrigation well facilities to potable water well facilities and operation of the converted<br />
irrigation wells to provide an additional annual average of approximately 1.0 to 1.5 mgd of groundwater.<br />
The project is a component of the SFPUC’s Water System Improvement Program (WSIP), which includes<br />
facility improvement projects designed to: (1) maintain high‐quality water; (2) reduce vulnerability to<br />
earthquakes; (3) increase delivery reliability and improve the ability to maintain the water system;<br />
(4) meet customer purchase requests in nondrought and drought periods; (5) enhance sustainability in all<br />
system activities; and (6) achieve a cost‐effective, fully operational system. Implementation of the project,<br />
as a component of the WSIP, would contribute to meeting the overall WSIP goals and objectives.<br />
FINDING<br />
This project may have a significant effect on the environment and an Environmental Impact Report<br />
(EIR) is required. This determination is based upon the criteria of the CEQA Guidelines, Sections 15063<br />
(Initial Study), 15064 (Determining Significant Effect), and 15065 (Mandatory Findings of Significance),<br />
and for the reasons documented in the Environmental Evaluation (Initial Study), which is attached.<br />
PUBLIC SCOPING PROCESS<br />
Written comments will be accepted on the scope of the EIR until the close of business on April 1, 2011.<br />
These comments will assist the <strong>Planning</strong> <strong>Department</strong> in reviewing the scope and content of the<br />
environmental impact analysis and information to be contained in the EIR. Written comments should be<br />
sent to Bill Wycko, c/o Timothy Johnston, <strong>San</strong> <strong>Francisco</strong> <strong>Planning</strong> <strong>Department</strong>, 1650 Mission Street,<br />
Suite 400, <strong>San</strong> <strong>Francisco</strong>, CA, 94103; or faxed to: 415‐558‐6409 (Attn: Timothy Johnston); or e‐mailed to<br />
Timothy.Johnston@sfgov.org. Comments that were received in response to the initial December 2009<br />
NOP remain on file with the <strong>Planning</strong> <strong>Department</strong> and will be considered during environmental review<br />
of the revised project proposal to the extent that they remain relevant to the revised project.<br />
If you work for a Responsible or Trustee Agency, we need to know the views of your agency regarding<br />
the scope and content of the environmental information that is germane to your agency’s statutory<br />
responsibilities in connection with the proposed project. Your agency may need to use the EIR when<br />
considering a permit or other approval for this project. Please include the name of a contact person in<br />
your agency.<br />
A.2-26<br />
2
REVISED NOTICE OF PREPARATION<br />
<strong>San</strong> <strong>Francisco</strong> Groundwater Supply Project<br />
Case No. 2008.1122E<br />
1.0 Overview<br />
The <strong>San</strong> <strong>Francisco</strong> Public Utilities Commission (SFPUC) is proposing the <strong>San</strong> <strong>Francisco</strong><br />
Groundwater Supply Project (the project). To meet California Environmental Quality Act (CEQA)<br />
requirements, the <strong>San</strong> <strong>Francisco</strong> <strong>Planning</strong> <strong>Department</strong>’s Major Environmental Analysis (MEA)<br />
Division is preparing and will distribute an environmental impact report (EIR) to describe and<br />
analyze the environmental effects of the proposed project. The <strong>Planning</strong> <strong>Department</strong> previously<br />
issued a Notice of Preparation (NOP) for the project on December 30, 2009, and a scoping<br />
meeting was held on January 20, 2010 in the project vicinity. The SFPUC has since made certain<br />
changes to the proposed project (as discussed below in Sections 1.1 and 4.0), and this revised<br />
NOP has been prepared in order to identify those changes and describe the proposed facilities and<br />
potential environmental effects of the project, as revised, that are being analyzed in the EIR.<br />
As described in the NOP, the project would provide an average of four million gallons per day<br />
(mgd) of groundwater to <strong>San</strong> <strong>Francisco</strong>’s municipal water supply. Groundwater would be<br />
blended with <strong>San</strong> <strong>Francisco</strong>’s existing municipal water supply for distribution within<br />
<strong>San</strong> <strong>Francisco</strong>. The groundwater would be pumped from the North Westside Groundwater Basin,<br />
which is located within the larger Westside Groundwater Basin, which underlies parts of<br />
<strong>San</strong> <strong>Francisco</strong> and <strong>San</strong> Mateo Counties. Facilities required to implement the project, including<br />
groundwater production well facilities, would be located on the western side of <strong>San</strong> <strong>Francisco</strong><br />
(see Figure 1), on property owned by the City and County of <strong>San</strong> <strong>Francisco</strong>, and managed by the<br />
SFPUC or the <strong>San</strong> <strong>Francisco</strong> Recreation and Park <strong>Department</strong> (SFRPD).<br />
As illustrated on Figure 1, seven locations are under consideration for the groundwater<br />
production well facilities; however, only six potable groundwater well facilities would be<br />
constructed—two that would be converted from existing irrigation well facilities and four new<br />
facilities. Each facility would include a groundwater production well and a pump station. The<br />
SFPUC also proposes the construction of a distribution system (including pipelines and<br />
connection points) that would connect five of the well facilities to Sunset Reservoir; the sixth well<br />
would connect to the existing Lake Merced Pump Station, and would require a short length of<br />
distribution piping to make this connection.<br />
<strong>San</strong> <strong>Francisco</strong> Groundwater Supply Project 1 March 2011<br />
Case No. 2008.1122E<br />
A.2-27
1<br />
0 2,000 4,000 Feet<br />
GEARY BLVD<br />
36TH AVE<br />
North Lake Deepwell Site<br />
South Windmill Deepwell Site<br />
CHAIN OF<br />
LAKES DR E<br />
JOHN F KENNEDY DR<br />
M<br />
ARTIN LU THER KING JR DR<br />
FULTON ST<br />
Golden Gate Park<br />
MIDDLE DR W<br />
TRA<br />
NSV<br />
SE DR<br />
ER<br />
LINCOLN WAY<br />
Urban Forestry Center Site (Alternative)<br />
Central Pump Station Site (Alternative)<br />
P A C I F I C<br />
North W estside<br />
Groundwater Basin<br />
9TH AVE<br />
28TH AVE<br />
24TH AVE<br />
O C E A N<br />
GREAT HWY (HWY 1)<br />
QUINTARA<br />
ST<br />
41ST AVE<br />
SUNSET BLVD<br />
ORTEGA ST<br />
West Sunset Site<br />
Sunset<br />
Reservoir<br />
Sutro<br />
Reservoir<br />
41TH AVE<br />
40TH AVE<br />
WAWONA ST<br />
SF Zoo<br />
South Sunset Site<br />
SLOAT BLVD<br />
Lake<br />
Merced<br />
Harding Park<br />
Pine Lake<br />
LAKE MERCED BLVD<br />
Stern<br />
Grove<br />
Merced<br />
Manor<br />
Reservoir<br />
Lake Merced Site<br />
S a n F r a n c i s c o<br />
I-280<br />
Legend<br />
Proposed Groundwater Well Facility<br />
BROTHERHOOD<br />
W AY<br />
Existing Groundwater Well Facility<br />
(Proposed for Modification)<br />
Proposed Sample Station and Chlorine Analyzer<br />
<strong>San</strong> <strong>Francisco</strong> Co.<br />
<strong>San</strong> Mateo Co.<br />
Proposed Groundwater Pipeline Routes<br />
Lake<br />
Groundwater Basin Boundary<br />
[Source: CA Dept.of Water<br />
Resources, Bulletin 118 (2003),<br />
modified by Gus Yates, 2003]<br />
D a l y C i t y<br />
South Westside<br />
Groundwater Basin<br />
SOURCE: SFPUC, 2009; 2010<br />
<strong>San</strong> <strong>Francisco</strong> Groundwater Supply Project<br />
Figure 1<br />
Project Location<br />
A.2-28
Revised Notice of Preparation<br />
The project is a component of the SFPUC’s Water System Improvement Program (WSIP). The<br />
WSIP, approved by the <strong>San</strong> <strong>Francisco</strong> Public Utilities Commission in October, 2008, includes facility<br />
improvement projects designed to: (1) maintain high‐quality water; (2) reduce vulnerability to<br />
earthquakes; (3) increase water delivery reliability and improve the ability to maintain the water<br />
system; (4) meet customer purchase requests in non‐drought and drought periods; (5) enhance<br />
sustainability in all system activities; and (6) achieve a cost‐effective, fully operational system.<br />
Implementation of the project, as a component of the WSIP, would contribute to meeting the overall<br />
WSIP goals and objectives (<strong>San</strong> <strong>Francisco</strong> <strong>Planning</strong> <strong>Department</strong>, 2008).<br />
1.1 Project Changes Following the 2009 NOP Release<br />
Following the December 2009 NOP release date and scoping meeting by the <strong>San</strong> <strong>Francisco</strong><br />
<strong>Planning</strong> <strong>Department</strong>, the SFPUC revised the following project components:<br />
• The proposed pipeline alignment between Vicente and Quintara streets has been moved<br />
from 40th Avenue to 41st Avenue.<br />
• Project description information regarding Sunset Reservoir connection point requirements<br />
has been clarified.<br />
• The West of Spreckels Lake and Polo Field well facility alternatives have been removed<br />
from the project description. Pipeline alignments required to connect those well facility<br />
alternatives to the project distribution system have also been removed from the project<br />
description.<br />
• A portion of the pipeline alignment within Golden Gate Park east of 41st Avenue/Chain of<br />
Lakes Drive East has been moved from Martin Luther King Jr. Drive to Middle Drive West.<br />
The project location and facilities included in the December 2009 NOP are shown in Figure 2.<br />
Following receipt of scoping comments on localized differential settlement along 40th Avenue,<br />
SFPUC conducted geotechnical investigations along 40th Avenue and 41st Avenue and<br />
determined that the proposed pipeline alignment between Vicente and Quintara streets should<br />
be moved to 41st Avenue. At the time of preparation of the December 2009 NOP, the location and<br />
requirements for connecting five of the well facilities to Sunset Reservoir was not known. Since<br />
that time, SFPUC has clarified the potential connection points, and identified the need for a<br />
sample station and chlorine analyzer that would be installed on a concrete pad to the northwest<br />
of Sunset Reservoir and two flowmeters that would be installed within an existing vault. The<br />
December 2009 NOP included consideration of nine locations for the groundwater production<br />
well facilities. Since that time, the SFPUC has decided, after further consideration and in<br />
consultation with the <strong>San</strong> <strong>Francisco</strong> Recreation and Park <strong>Department</strong>, to remove the West of<br />
Spreckels Lake and Polo Field well facility alternatives from the project description. Finally,<br />
pipeline alignments proposed within Golden Gate Park have been refined to remove alignments<br />
related to the West of Spreckels Lake and Polo Field well facility alternatives, and to reduce the<br />
length of pipelines needed to connect either the Central Pump Station or Urban Forestry well<br />
facility alternatives to the distribution system.<br />
<strong>San</strong> <strong>Francisco</strong> Groundwater Supply Project 3 March 2011<br />
Case No. 2008.1122E<br />
A.2-29
1<br />
GEARY BLVD<br />
36TH AVE<br />
0 2,000 4,000 Feet<br />
CHAIN OF<br />
LAKES DR<br />
4<br />
JOHN F KENNEDY DR<br />
M<br />
5<br />
7<br />
ARTIN LU THER KING JR DR<br />
FULTON ST<br />
6<br />
8<br />
MIDDLE DR W<br />
9<br />
TRANSVERSE DR<br />
LINCOLN WAY<br />
Golden Gate Park<br />
PACIFIC<br />
OCEAN<br />
North W estside<br />
Groundwater B asin<br />
9TH AVE<br />
24TH AVE<br />
GREAT HWY (HWY 1)<br />
QUINTARA<br />
ST<br />
41ST AVE<br />
SUNSET BLVD<br />
3<br />
ORTEGA ST<br />
Sunset<br />
Reservoir<br />
Sutro<br />
Reservoir<br />
40TH AVE<br />
Legend<br />
Proposed Groundwater Well Facility<br />
Existing Groundwater Well Facility<br />
(Proposed for Modification)<br />
Alternative Groundwater Well Facility<br />
1 - Lake Merced Site<br />
2 - South Sunset Site<br />
3 - West Sunset Site<br />
4 - South Windmill Deepwell Site<br />
5 - North Lake Deepwell Site<br />
6 - Polo Field Site<br />
7 - Spreckels Lake Site<br />
8 - Urban Forestry Center Site<br />
9 - Central Pump Station Site<br />
WAWONA ST<br />
SF Zoo<br />
2<br />
SLOAT BLVD<br />
Lake<br />
Merced<br />
Harding Park<br />
Pine Lake<br />
LAKE MERCED BLVD<br />
1<br />
Stern<br />
Grove<br />
Merced<br />
Manor<br />
Reservoir<br />
BROTHERHOOD<br />
<strong>San</strong> Fr<br />
ancisco<br />
WAY<br />
<strong>San</strong> <strong>Francisco</strong> Co.<br />
<strong>San</strong> Mateo Co.<br />
I-280<br />
Proposed Groundwater Pipeline Routes<br />
Daly City<br />
Lake<br />
Groundwater Basin Boundary<br />
[Source: CA Dept.of Water<br />
Resources, Bulletin 118 (2003),<br />
modified by Gus Yates, 2003]<br />
South W estside<br />
Groundwater B asin<br />
SOURCE: SFPUC, 2009<br />
<strong>San</strong> <strong>Francisco</strong> Groundwater Supply Project<br />
Figure 2<br />
2009 NOP Project Location<br />
A.2-30
Revised Notice of Preparation<br />
2.0 Environmental Review Process<br />
The <strong>San</strong> <strong>Francisco</strong> <strong>Planning</strong> Commission certified the WSIP Program Environmental Impact Report<br />
(PEIR) in October 2008. The PEIR addressed the potential environmental impacts of the WSIP<br />
facilities on a programmatic level and evaluated regional water supply alternatives. The PEIR is<br />
available on the <strong>San</strong> <strong>Francisco</strong> <strong>Planning</strong> <strong>Department</strong> website at: http://tinyurl.com/puccases. The<br />
<strong>San</strong> <strong>Francisco</strong> <strong>Planning</strong> <strong>Department</strong> is now preparing a project‐specific EIR to evaluate the<br />
environmental effects of the proposed project on the environment. The EIR will be prepared in<br />
compliance with CEQA Guidelines Section 15161 and will address project‐specific construction and<br />
operational impacts.<br />
The first step in the environmental review process is the formal public scoping process, for which<br />
the NOP was prepared. The <strong>San</strong> <strong>Francisco</strong> <strong>Planning</strong> <strong>Department</strong> is issuing this revised NOP to<br />
inform agencies and the public of the changes made to the proposed project that will be included as<br />
part of the project being analyzed in the EIR. This revised NOP will be circulated for a 30‐day<br />
public review period. The purpose of this public review period is to solicit public comments to aid<br />
in determining the scope and focus of the environmental impact analysis to be addressed in the<br />
EIR. All comments received in response to the NOP issued in December, 2009 NOP remain on file<br />
with the <strong>Planning</strong> <strong>Department</strong> and will be considered during environmental review of the project,<br />
to the extent they remain relevant to the project, as revised. Following the public scoping phase, a<br />
Draft EIR will be prepared and circulated for a 45‐day public review period. Public comments on<br />
the Draft EIR will be accepted in writing during the review period, or verbally at the formal public<br />
hearing to be held by the <strong>San</strong> <strong>Francisco</strong> <strong>Planning</strong> Commission. The <strong>San</strong> <strong>Francisco</strong> <strong>Planning</strong><br />
<strong>Department</strong> will then prepare a Comments and Responses document, which will respond to<br />
comments on environmental issues raised during the public review period. This document will be<br />
considered by the <strong>San</strong> <strong>Francisco</strong> <strong>Planning</strong> Commission, along with the Draft EIR and any revisions<br />
to the draft based on the comments and responses, for certification as the Final EIR.<br />
3.0 Public Scoping Comments<br />
The <strong>San</strong> <strong>Francisco</strong> <strong>Planning</strong> <strong>Department</strong> will accept written comments by mail, email, or fax until<br />
close of business on April 1, 2011. The comments received will assist the <strong>San</strong> <strong>Francisco</strong> <strong>Planning</strong><br />
<strong>Department</strong> in determining the scope and focus of the environmental impact analysis for the<br />
project, as revised, to be addressed in the EIR.<br />
Written comments may be mailed to the Bill Wycko, <strong>San</strong> <strong>Francisco</strong> <strong>Planning</strong> <strong>Department</strong>,<br />
1650 Mission Street, Suite 400, <strong>San</strong> <strong>Francisco</strong>, CA 94103; sent by fax to (415) 558‐6409; or submitted by<br />
email to Timothy Johnston, the CEQA coordinator for this project, at timothy.johnston@sfgov.org.<br />
<strong>San</strong> <strong>Francisco</strong> Groundwater Supply Project 5 March 2011<br />
Case No. 2008.1122E<br />
A.2-31
Revised Notice of Preparation<br />
4.0 Project Description<br />
4.1 Project Goals and Objectives<br />
The proposed project would provide an average of approximately four mgd of groundwater to<br />
<strong>San</strong> <strong>Francisco</strong>’s municipal water supply from the North Westside Groundwater Basin, which<br />
would:<br />
• Expand the SFPUC’s water supply portfolio to increase system reliability<br />
• Increase the use of local water supply sources<br />
• Reduce dependence on imported water<br />
In addition, the project would ensure the availability of potable groundwater for emergency<br />
supply in the event of an earthquake or other major catastrophe (SFPUC, 2009a).<br />
4.2 Proposed Project<br />
4.2.1 Summary of Proposed Project Components<br />
The Groundwater Supply Project includes following components:<br />
• Construction of six groundwater well facilities, including the conversion of two existing<br />
irrigation well facilities in Golden Gate Park to potable groundwater well facilities and the<br />
construction of four new groundwater well facilities. Each facility would include a<br />
groundwater production well and a pump station. Disinfection equipment would be<br />
included at the Lake Merced and West Sunset well facilities.<br />
• Construction of a distribution system (including pipelines and connection points) to<br />
connect five of the groundwater well facilities to Sunset Reservoir. The sixth groundwater<br />
well would connect to the Lake Merced Pump Station, and would require a short length of<br />
distribution piping to make this connection.<br />
The project would be implemented in two phases: (1) construction and operation of the four new<br />
groundwater well facilities to supply an annual average of approximately 2.5 to 3.0 mgd of<br />
groundwater; and (2) construction of well facilities required to convert the two existing irrigation<br />
well facilities to potable groundwater well facilities and operation of the converted irrigation wells<br />
to provide an additional annual average of approximately 1.0 to 1.5 mgd of groundwater.<br />
Phase 2 of the proposed project would be implemented if the SFPUCʹs proposed <strong>San</strong> <strong>Francisco</strong><br />
Westside Recycled Water Project, 1 which is another WSIP project that proposes development of a<br />
new recycled water supply for non‐potable irrigation uses at Golden Gate Park, Lincoln Park<br />
Golf Course, and the Presidio Golf Course, is implemented. The availability of a recycled water<br />
1 The <strong>San</strong> <strong>Francisco</strong> Westside Recycled Water Project is one of the projects proposed for implementation under<br />
the WSIP, approved by the SFPUC in October, 2008. The environmental review for the <strong>San</strong> <strong>Francisco</strong> Westside<br />
Recycled Water Project (<strong>San</strong> <strong>Francisco</strong> <strong>Planning</strong> <strong>Department</strong> Case Number 2008.0091E) is proceeding<br />
independently of this project. The revised Notice of Preparation (NOP) of an EIR for the <strong>San</strong> <strong>Francisco</strong><br />
Westside Recycled Water Project is available at http:tinyurl.com/puccases, and was published on September 8,<br />
2010. The Draft EIR is expected to be available for public review in late 2011.<br />
<strong>San</strong> <strong>Francisco</strong> Groundwater Supply Project 6 March 2011<br />
Case No. 2008.1122E<br />
A.2-32
Revised Notice of Preparation<br />
supply for the Park would enable the SFPUC to operate two existing well facilities at Golden<br />
Gate Park; the wells then could be used for the production of potable water instead of irrigation<br />
water. Thus, Phase 2 of the proposed project could be implemented only if the proposed<br />
<strong>San</strong> <strong>Francisco</strong> Westside Recycled Water Project is approved and operational, as Phase 2 of the<br />
proposed project includes the use of those two well facilities for potable water. If the<br />
<strong>San</strong> <strong>Francisco</strong> Westside Recycled Water Project is not implemented and a backup source of<br />
irrigation water for Golden Gate Park (i.e., other than groundwater) is not made available, the<br />
existing irrigation wells in Golden Gate Park would not be used to supply municipal water as<br />
part of the <strong>San</strong> <strong>Francisco</strong> Groundwater Supply Project. Under this scenario, the proposed project<br />
would only include operation of four potable wells, which may result in some reduction in the<br />
average annual groundwater production.<br />
4.2.2 Proposed Project Component Locations<br />
Proposed Groundwater Well Facility Locations<br />
The proposed project includes the construction and operation of three new groundwater well<br />
facilities south of Golden Gate Park and, as described above, would convert two existing irrigation<br />
well facilities in Golden Gate Park to municipal use. The project also includes the construction and<br />
operation of a new groundwater well facility at one of two alternative locations in Golden Gate<br />
Park. The proposed and alternative locations for groundwater well facilities are shown on Figure 1<br />
and described below.<br />
Groundwater Well Facility Sites Proposed South of Golden Gate Park<br />
Lake Merced Site. The existing Lake Merced Pump Station is on Lake Merced Boulevard next to<br />
Lake Merced and south of the Harding Park Golf Course. A new well facility would be developed<br />
approximately 300 feet southeast of the existing pump station in an undeveloped area of SFPUCmanaged<br />
property. The SFPUC has an existing test well at this location. This area is restricted from<br />
public use and access.<br />
South Sunset Site. The South Sunset well facility would be developed in the corner of the South<br />
Sunset Playground, at 40th Avenue and Wawona Street, next to a SFRPD‐managed public<br />
recreational field used for softball, baseball, and soccer. Residences are located across the street<br />
along 40th Avenue and Wawona Street. The well facility would be constructed within a landscaped<br />
berm adjacent to the sports field and would include storage facilities for playground and field<br />
maintenance equipment. The SFPUC has an existing test well at this location.<br />
West Sunset Site. The West Sunset well facility would be developed at the West Sunset<br />
Playground, at the intersection of 40th Avenue and Quintara Street adjacent to a SFRPDmanaged<br />
public recreational field used for softball, baseball and soccer. Residences are located<br />
across the street along Quintara Street. The proposed well facility would be constructed within a<br />
small area at the northeast corner of the playground parking lot. The SFPUC has an existing test<br />
well at this location.<br />
<strong>San</strong> <strong>Francisco</strong> Groundwater Supply Project 7 March 2011<br />
Case No. 2008.1122E<br />
A.2-33
Revised Notice of Preparation<br />
Alternative Sites in Golden Gate Park Proposed for New Groundwater Well Facility<br />
Urban Forestry Center. The Urban Forestry Center site is located to the south of Middle Drive<br />
West, adjacent to and west of the Urban Forestry Center. The SFRPD uses the Urban Forestry<br />
Center buildings and yard areas for park operations and maintenance activities. The proposed<br />
well facility site is to the west of the existing Urban Forestry Center.<br />
Central Pump Station. The Central Pump Station, located southwest of the John F. Kennedy<br />
Drive/Transverse Drive intersection, is part of the park’s existing irrigation system. The yard area<br />
at the Central Pump Station is used for the SFRPD’s wood waste storage and composting<br />
operations. The proposed well facility site is to the west of the existing fenced Central Pump<br />
Station facility. The SFPUC has an existing test well at this location.<br />
Existing Well Facilities in Golden Gate Park Proposed for Conversion<br />
South Windmill Deepwell Site. The South Windmill Deepwell facility was constructed in 2001<br />
and is operated by the SFRPD as an irrigation well. The facility is within the western area of<br />
Golden Gate Park north of Martin Luther King Jr. Drive.<br />
North Lake Deepwell Site. The North Lake Deepwell facility was constructed in 2001 and is<br />
operated by the SFRPD as an irrigation well. The facility is next to Chain of Lakes Drive within<br />
the western area of Golden Gate Park, south of Fulton Street.<br />
Pipeline Locations<br />
As shown in Figure 1, the proposed groundwater transmission pipelines for five of the well<br />
facilities would connect groundwater well facilities with the Sunset Reservoir. The groundwater<br />
transmission pipelines would be 8 to 16 inches in diameter.<br />
Groundwater drawn from the Lake Merced well facility would be transferred to the Lake Merced<br />
Pump Station via a short connector pipeline, and then conveyed to either the Sunset Reservoir or<br />
the Sutro Reservoir through the Lake Merced Pump Station’s existing pumping and distribution<br />
system.<br />
The SFPUC would install a pipeline along 40th Avenue between Wawona and Vicente streets, west<br />
along Vicente Street to 41st Avenue, then north along 41st Avenue between Vicente and Quintara<br />
Streets and east one block along Quintara Street to connect the South Sunset and West Sunset well<br />
facilities. The pipeline would extend north along 41st Avenue from Quintara Street, and then<br />
continue approximately one mile eastward along Ortega Street to 28th Avenue. A chlorine analyzer<br />
sample station would be constructed at the northwest corner of the Sunset Reservoir site, where the<br />
groundwater supply would be tested for chlorine levels. The pipeline would extend east along<br />
Ortega Street to 24th Avenue, and then continue southward along 24th Avenue for approximately<br />
one block, where it would enter the Sunset Reservoir facility. The pipeline would terminate in both<br />
the north and south basins of Sunset Reservoir. Two 12‐inch flowmeters would be installed within<br />
vaults located on the east side of the Sunset Reservoir. At Sunset Reservoir, groundwater would be<br />
blended with the water in storage and then distributed to local customers.<br />
<strong>San</strong> <strong>Francisco</strong> Groundwater Supply Project 8 March 2011<br />
Case No. 2008.1122E<br />
A.2-34
Revised Notice of Preparation<br />
Within Golden Gate Park, potable water wells would be connected to pipeline branches that<br />
would converge and that would exit the park at Lincoln Way and 41st Avenue (see Figure 1). The<br />
pipeline would continue south approximately one mile along 41st Avenue and then east one<br />
block at Quintara Street to connect to the pipeline alignment at the West Sunset well facility.<br />
4.2.3 Project Construction<br />
Well Facility Construction<br />
Modification of the existing South Windmill Deepwell and North Lake Deepwell facilities would<br />
require demolition of some existing facilities to accommodate the upgraded pumping equipment<br />
and new pipeline connections. Tree removal could be required within the construction and<br />
staging areas at several of the proposed facilities.<br />
Construction of well facilities and conversion of irrigation wells would consist of upgrades and<br />
equipment required to meet municipal well construction standards and could include, as<br />
applicable, construction of the well, installation of pumps, valves, monitoring equipment, and<br />
electrical utility connections. Pumps and pump motors would be the vertical turbine type. Well<br />
facility buildings would include noise‐limiting 10‐inch‐thick concrete walls, 8‐inch‐thick concrete<br />
roofs, and acoustical louvers shielding vented openings and windows.<br />
Pipeline Construction<br />
Pipeline construction would require trench corridors that would generally be 10 feet wide for<br />
single pipeline routes, and 16 feet wide along the few segments where up to three pipelines<br />
would run along the same route (e.g., sections of Quintara Street, near the West Sunset well<br />
facility). Site preparation for pipeline construction could include tree removal or ground clearing<br />
of the work area, as well as grading or pavement cutting.<br />
Figure 1 shows the locations of pipeline infrastructure and connection points with the Lake Merced<br />
Pump Station and the Sunset Reservoir. The pipeline alignment would be located primarily within<br />
existing roadways; after pipeline construction activities were completed, roadways would be<br />
restored to pre‐construction conditions. In general, the pipeline routes would be excavated to a<br />
depth of six feet, except where the pipeline enters/exits individual well facilities. At these locations,<br />
the pipeline excavation would be at the same depth as the well facility connection.<br />
The open‐cut trench method would primarily be used for the pipeline construction. This method<br />
involves excavation of the trench, placement of the pipe, backfilling of the trench, and restoration<br />
of the work surface. Typically, excavation of an approximately 4‐foot‐wide by 6‐foot‐deep trench<br />
would be required to install the pipeline. In accordance with Occupational Safety and Health<br />
Administration standards, shoring would be required for trenches 5 or more feet deep to prevent<br />
the surrounding soil and adjacent structures from collapsing. Dewatering of the trench would be<br />
required if groundwater were encountered.<br />
<strong>San</strong> <strong>Francisco</strong> Groundwater Supply Project 9 March 2011<br />
Case No. 2008.1122E<br />
A.2-35
Revised Notice of Preparation<br />
The pipeline route would cross the Taraval and Judah MUNI light rail lines at their intersections<br />
with 41st Avenue. Jack and bore pipeline (pipe‐jacking) construction would be used to tunnel<br />
under the light rail lines without disturbing these rail lines.<br />
Spoils Disposal and Dewatering<br />
Excavated soil would be stockpiled at the construction staging area for reuse at the well facility or<br />
pipeline construction site, or would be disposed of at an appropriate landfill. Most of the spoils<br />
material is expected to be Class III non‐hazardous waste.<br />
Dewatering could be required, and would involve pumping water out of the excavated area and,<br />
following appropriate onsite treatment, discharging into a nearby sewer, open channel, or over<br />
land. Discharge to the <strong>San</strong> <strong>Francisco</strong> combined sewer system would require a permit from the<br />
SFPUC Wastewater Enterprise, which would be the case for most project sites. Discharge to an<br />
open channel or over land must be performed in accordance with the requirements of the<br />
Statewide General Construction Permit for Stormwater Discharges Associated with Construction<br />
Activity issued by the State Water Resources Control Board, and municipal stormwater permits.<br />
Construction Staging<br />
Each well facility and pipeline construction site would require a staging area for equipment and<br />
materials storage (e.g., construction vehicles, building materials, pipes, fuels, lubricants). Staging<br />
areas could also be used for stockpiling excavated soil for reuse. Whenever possible, the project<br />
staging areas would be located on developed or previously disturbed areas, rights‐of‐way, or<br />
roadsides.<br />
Staging areas would be used for up to 15 months during well facility construction. Pipeline<br />
staging would be located sequentially near the pipeline route, and each staging area would<br />
typically operate for an approximate seven‐week period during pipeline construction. Once a<br />
staging area is no longer needed, the area would be restored to its pre‐construction condition.<br />
Unpaved roadways would be restored to pre‐project conditions, and roadway pavement would<br />
be restored in accordance with local design specifications.<br />
4.2.4 Construction Schedule<br />
Table 1 provides the approximate duration of construction work necessary at each well facility<br />
and the installation rate for the proposed pipeline system. The construction of new groundwater<br />
well facilities would require approximately 15 months at each site. Construction activities would<br />
occur primarily Monday through Friday during daytime hours (7:00 a.m. to 5:00 p.m.). At some<br />
sites, construction might be necessary during weekend and evening hours to reduce disruption to<br />
traffic or meet other construction requirements. If nighttime work is required, work could be<br />
performed between 8:00 p.m. and 6:00 a.m. but would be restricted to weekdays.<br />
<strong>San</strong> <strong>Francisco</strong> Groundwater Supply Project 10 March 2011<br />
Case No. 2008.1122E<br />
A.2-36
Revised Notice of Preparation<br />
TABLE 1<br />
CONSTRUCTION DURATION BY ACTIVITY TYPE<br />
Construction Activity<br />
Well Facility<br />
Site Clearing, Grubbing, and Preparation<br />
Foundation and Utility Connections<br />
Building and Well Construction and Equipment Installation<br />
Start‐up and Testing<br />
Total Well Facility Construction Duration<br />
Expected<br />
Duration per<br />
Facility<br />
1 month<br />
2 months<br />
10 months<br />
2 months<br />
15 months<br />
Pipeline Installation<br />
Normal Construction—Open‐Cut Trench (at a rate of 300 to 600 feet per week)<br />
Pipe Jacking (concurrent with open‐cut trench)<br />
Total Pipeline Installation Duration<br />
12 to 16 months<br />
3 weeks per site<br />
12‐16 months<br />
Construction of pipelines would occur at the same time as well facility construction. In general,<br />
pipeline installation would progress at a net rate of approximately 60 feet per day for in‐street<br />
areas and up to 120 feet per day in off‐street areas. However, construction activities might not be<br />
continuous. For example, pipeline installation could begin several days after completion of<br />
excavation, and temporary paving could occur up to several days after completion of backfilling.<br />
At two locations, beneath the Taraval and Judah MUNI light rail lines, pipe‐jacking (jack and<br />
bore) construction would be necessary, and the duration of this activity at each site would be<br />
approximately three weeks.<br />
4.3 Operations and Maintenance<br />
4.3.1 Operations<br />
Normal daily extraction rates from the six wells would vary by well from approximately 0.4 to<br />
1.4 mgd, for a total average of 4 mgd, and groundwater would be blended with <strong>San</strong> <strong>Francisco</strong>’s<br />
municipal water supply and distributed to <strong>San</strong> <strong>Francisco</strong> residents served through the Sunset and<br />
Sutro Reservoirs. However, due to water quality requirements that dictate a ceiling for blending<br />
groundwater in the <strong>San</strong> <strong>Francisco</strong> municipal water system, as well as seasonal variations in water<br />
demand, production from the proposed wells could vary on a daily basis. During low‐demand<br />
periods, such as winter months when surface water supplies are more abundant and water use is<br />
lower, groundwater extraction would generally be less than 4 mgd. During high‐demand<br />
periods, the production rate could be greater than 4 mgd, but the total production rate would be<br />
equal to 4 mgd averaged over a year. During project operation, the SFPUC would monitor<br />
groundwater levels and groundwater quality in the Westside Groundwater Basin monitoring<br />
network. The groundwater monitoring results would be used to detect potential adverse effects<br />
of seawater intrusion, changes in water levels in surface water features (such as Lake Merced),<br />
<strong>San</strong> <strong>Francisco</strong> Groundwater Supply Project 11 March 2011<br />
Case No. 2008.1122E<br />
A.2-37
Revised Notice of Preparation<br />
and interference with other wells. Groundwater pumping would be balanced between the six<br />
groundwater production wells to avoid such effects.<br />
In addition to normal operations, the project would provide an available source of drinking water<br />
in the event that other imported water sources are interrupted due to earthquake damage or<br />
other repairs and unplanned outages. The six wells would be capable of producing up to 6 mgd<br />
(total) during a catastrophic emergency and could operate at this rate for up to 30 days,<br />
consistent with level‐of‐service goals established by the SFPUC (2009b). Portable generators<br />
would provide backup power to enable use of the West Sunset well facility and the North Lake<br />
Deepwell facility during a catastrophic emergency. In addition, the project also would provide an<br />
available backup water supply for irrigation in Golden Gate Park if needed during repair or<br />
unplanned outages of recycled water facilities supplying water for park irrigation.<br />
4.3.2 Maintenance<br />
During project operation, an operator would make daily visits by truck (of approximately<br />
30‐minute duration) to check the equipment at each of the groundwater well facility sites.<br />
Standard Supervisory Control and Data Acquisition equipment would be installed at each site for<br />
remote monitoring of the well facility and pipeline equipment. Longer‐term maintenance would<br />
include removal and repair (or replacement) of pumps, valves, and other equipment. The<br />
production wells might require rehabilitation on an infrequent basis. The estimated operational<br />
life of the proposed production wells is 50 years (or more).<br />
5.0 Permits and Approvals Required<br />
The SFPUC may be required to obtain the following permits and approvals for project construction<br />
and operation.<br />
5.1 Federal<br />
Based upon the current understanding of project activities and environmental conditions, no<br />
federal permits or approvals are expected to be required for implementation of the project. This<br />
determination is contingent on the completion of EIR project description and site surveys to be<br />
conducted for analysis of impacts of the proposed project.<br />
5.2 State<br />
• California <strong>Department</strong> of Public Health, Water Supply Division permit amendments and<br />
approval of well construction and operation.<br />
• California <strong>Department</strong> of Toxic Substances Control Contaminated Soil Treatment Work<br />
Plan (required only if contaminated soil were encountered during construction).<br />
<strong>San</strong> <strong>Francisco</strong> Groundwater Supply Project 12 March 2011<br />
Case No. 2008.1122E<br />
A.2-38
Revised Notice of Preparation<br />
• State Water Resources Control Board Stormwater General Permit and Stormwater<br />
Pollution Prevention Plan, if more than one acre of land were disturbed 2 .<br />
5.3 Local<br />
• <strong>San</strong> <strong>Francisco</strong> <strong>Planning</strong> Commission certification of the Final EIR, issuance of Coastal<br />
Development Permit, and determination of consistency with the general plan.<br />
• SFPUC approval of project, adoption of CEQA findings, approval of an MOU or other<br />
agreement with SFRPD for coordination of construction activities and ongoing project<br />
operationon SFRPD‐managed land and other implementation actions.<br />
• <strong>San</strong> <strong>Francisco</strong> Board of Supervisors consideration of any appeals of the <strong>Planning</strong><br />
Commission’s certification of the Final EIR, appropriation of funding, and adoption of<br />
CEQA and project related findings.<br />
• <strong>San</strong> <strong>Francisco</strong> Recreation and Park Commission approval of an MOU or other agreement<br />
with the SFPUC regarding coordination of construction activities and ongoing project<br />
operation on park property and related findings.<br />
• <strong>San</strong> <strong>Francisco</strong> Arts Commission approval of exterior design of structures on City property.<br />
• <strong>San</strong> <strong>Francisco</strong> <strong>Department</strong> of Public Health approval of well construction and operation<br />
permits in accordance with California <strong>Department</strong> of Water Resources standards.<br />
• SFPUC Wastewater Enterprise permit for discharge to the <strong>San</strong> <strong>Francisco</strong> combined sewer<br />
system.<br />
6.0 Environmental Analysis<br />
6.1 Environmental Issues to Be Addressed in the EIR<br />
The EIR that is being prepared will address all environmental issue areas required under CEQA.<br />
The EIR will discuss the environmental impacts of the proposed project due to construction and<br />
operation activities, and will propose mitigation measures for impacts considered to be<br />
potentially significant.<br />
6.1.1 Land Use and Land Use <strong>Planning</strong><br />
Project construction and operation could affect land uses at the project sites and surrounding<br />
areas. Potential impacts to be evaluated include:<br />
• Temporary and permanent disruption or displacement of existing land uses during<br />
construction—including construction impacts on sensitive land uses such as schools and<br />
residences, and potential temporary closures of some portions of Golden Gate Park, South<br />
Sunset Playground, and West Sunset Playground.<br />
2 Applicable to areas that do not drain to the City’s combined sewer system.<br />
<strong>San</strong> <strong>Francisco</strong> Groundwater Supply Project 13 March 2011<br />
Case No. 2008.1122E<br />
A.2-39
Revised Notice of Preparation<br />
6.1.2 Aesthetics<br />
Project construction and operation could affect aesthetics at the project sites and surrounding<br />
areas. Potential impacts to be evaluated include:<br />
• Impacts on scenic vistas or visual character, including potential impacts on the visual<br />
character of Golden Gate Park, Lake Merced, South Sunset Playground, and West Sunset<br />
Playground.<br />
6.1.3 Population and Housing<br />
Construction and operation of the proposed project could affect adjacent population and<br />
housing. Potential effects to be evaluated include:<br />
• Inducement of direct or indirect substantial population growth.<br />
• Displacement of substantial numbers of existing housing or people.<br />
6.1.4 Cultural and Paleontological Resources<br />
The project could potentially affect archaeological, historical, or paleontological resources<br />
through ground‐disturbing activities during construction, or by introducing new facilities that<br />
could compromise the historical integrity of historical buildings or landscapes. Potential impacts<br />
to be evaluated include:<br />
• Impacts on archaeological and paleontological resources.<br />
• Impacts on the historical significance of a historic district, contributor to a historic district,<br />
or historic landscape. Of particular focus will be the proposed well facilities in Golden Gate<br />
Park.<br />
6.1.5 Traffic, Transportation, and Circulation<br />
Construction could have temporary impacts on traffic volumes, traffic safety, and parking in the<br />
vicinity of the groundwater pipelines, well facility sites, and the Sunset Reservoir. Potential<br />
impacts to be evaluated include:<br />
• Temporary reduction in roadway capacity and increase in traffic delays, including impacts<br />
from short‐term closure of one parking and/or traffic lane.<br />
• Temporary displacement of on‐ or off‐street parking.<br />
6.1.6 Noise<br />
Project construction noise and vibration impacts associated with facility construction would be<br />
temporary and short term. However, operation of the proposed pumps, building ventilation fans,<br />
and chemical treatment equipment could create permanent noise impacts. Potential impacts to be<br />
evaluated include:<br />
<strong>San</strong> <strong>Francisco</strong> Groundwater Supply Project 14 March 2011<br />
Case No. 2008.1122E<br />
A.2-40
Revised Notice of Preparation<br />
• Impacts of construction noise and vibration on sensitive receptors in the vicinity of project<br />
construction sites, especially sensitive land uses such as schools and residences.<br />
• Operational noise impacts from groundwater well facilities, including pumps, building<br />
ventilation fans, and groundwater treatment equipment.<br />
6.1.7 Air Quality<br />
Effects on air quality from the project would largely be associated with construction activities<br />
and, as such, would be temporary and short term. Potential impacts to be evaluated include:<br />
• Impacts of construction emissions, including fugitive dust.<br />
6.1.8 Greenhouse Gas Emissions<br />
Effects related to greenhouse gas emissions from the proposed project would be both temporary<br />
and short term (associated with construction activities) and long‐term (associated with operation<br />
of the well facilities). Potential effects to be evaluated include:<br />
• Generation of greenhouse gas emissions that have a significant impact on the environment.<br />
• Consistency with plans and policies regarding the reduction of greenhouse gases.<br />
6.1.9 Wind and Shadow<br />
Construction of aboveground project facilities could result in wind and shadow effects. Potential<br />
effects to be evaluated include:<br />
• Alteration of wind in a manner that substantially affects public areas.<br />
• Creation of new shadow in a manner that substantially affects outdoor recreation facilities<br />
or other public areas.<br />
6.1.10 Recreation<br />
Project construction could temporarily disrupt recreational uses in the vicinity of the well facility<br />
sites as a result of noise, dust, and temporary access restrictions. The EIR will evaluate project<br />
impacts on recreational resources. Potential impacts to be evaluated include:<br />
• Temporary and permanent impacts on recreational facilities, including but not limited to<br />
closure of some portions of the South Sunset Playground, West Sunset Playground, and<br />
Golden Gate Park.<br />
6.1.11 Utilities and Service Systems<br />
Construction could result in temporary effects on utilities and service systems. Potential effects to<br />
be evaluated include:<br />
• Consistency with wastewater treatment requirements of the applicable Regional Water<br />
Quality Control Board.<br />
<strong>San</strong> <strong>Francisco</strong> Groundwater Supply Project 15 March 2011<br />
Case No. 2008.1122E<br />
A.2-41
Revised Notice of Preparation<br />
• Effects associated with construction of new service systems.<br />
• Effects on storm water drainage facilities.<br />
• Effects on water supplies.<br />
• Effects on wastewater treatment capacity.<br />
• Effects on landfill capacity.<br />
• Consistency with federal, state, and local statues and regulations related to solid waste.<br />
6.1.12 Public Services<br />
Construction and implementation of the proposed project could temporarily affect public<br />
services. Potential effects to be evaluated include:<br />
• Substantial adverse physical impacts associated with provision of, or need for, new or<br />
physically altered government facility (fire or police station, school, and/or park).<br />
6.1.13 Biological Resources<br />
Temporary impacts on biological resources could result from construction activities related to<br />
noise, vibration and dust. Potential impacts to be evaluated include:<br />
• Impacts on sensitive wildlife habitats (including wetlands), migration corridors, and<br />
protected/heritage trees.<br />
• Impacts on special‐status wildlife and plant species (direct mortality and/or habitat effects).<br />
6.1.14 Geology, Soils, and Seismicity<br />
Construction and operation of new well facilities and below‐ground distribution pipelines could<br />
result in site‐specific impacts on or from local geology and soils conditions. Potential impacts to<br />
be evaluated include:<br />
• Seismic hazards and/or increased exposure of structures to seismic hazards, including<br />
impacts from ground‐shaking in the event of an earthquake on the <strong>San</strong> Andreas fault or<br />
other Bay Area faults.<br />
• Increased exposure of structures to geologic hazards (such as liquefaction, poor soil<br />
conditions, or unstable slopes) from construction in geologic hazard zones.<br />
• Soil erosion potential from construction activities.<br />
• Potential for land subsidence from decreases in groundwater level elevations (drawdown)<br />
in the groundwater aquifer.<br />
<strong>San</strong> <strong>Francisco</strong> Groundwater Supply Project 16 March 2011<br />
Case No. 2008.1122E<br />
A.2-42
Revised Notice of Preparation<br />
6.1.15 Hydrology and Water Quality<br />
Project construction could affect surface and groundwater water quality in the project area.<br />
Project operation could affect groundwater levels and quality in the project area and in the<br />
Westside Groundwater Basin. Potential impacts to be evaluated include:<br />
• Changes in local groundwater quality and levels within the project area and the Westside<br />
Groundwater Basin.<br />
• Depletion of groundwater supplies or interference with groundwater recharge such that<br />
production rates of preexisting wells in the Westside Groundwater Basin would drop to a<br />
level that would not support existing or planned land uses, seawater intrusion would<br />
occur, or land subsidence would result.<br />
• Changes in surface water bodies or other surface water features, such as Lake Merced, due<br />
to changes in groundwater levels in the Westside Groundwater Basin.<br />
• Changes in drinking water quality due to blending of treated groundwater with the<br />
imported treated surface water supply.<br />
• Alteration of drainage patterns and increase in stormwater flows due to increase in the<br />
amount of impervious surfaces.<br />
• Degradation of surface and groundwater water quality as a result of erosion and<br />
sedimentation, hazardous materials release during construction, and construction<br />
dewatering discharges.<br />
6.1.16 Hazards and Hazardous Materials<br />
Construction and operation of the proposed project could require the use of hazardous material,<br />
including fuels and oil. Additionally, project construction (mainly excavation) could expose<br />
workers to existing hazardous materials sites. Potential effects to be evaluated include:<br />
• Creation of a significant hazard through the routine transport, use, or disposal of<br />
hazardous materials.<br />
• Creation of a significant hazard through upset or accident conditions involving the release<br />
of hazardous materials.<br />
• Emission of hazardous materials within the vicinity of a school.<br />
• Creation of a significant hazard associated with existing hazardous materials sites.<br />
• Conflicts with adopted emergency response plan or evacuation plan.<br />
• Exposure to people or structures to fires.<br />
6.1.17 Mineral/Energy Resources<br />
Construction activities (mainly excavation) associated with the project could affect mineral<br />
resources, if present in the project area. Construction and operation of the project would require<br />
the use of energy resources. Potential effects to be evaluated include:<br />
<strong>San</strong> <strong>Francisco</strong> Groundwater Supply Project 17 March 2011<br />
Case No. 2008.1122E<br />
A.2-43
Revised Notice of Preparation<br />
• Loss of the availability of a known mineral resource.<br />
• Conflicts or loss of locally‐important mineral resource recovery site on a local general,<br />
specific, or land use plan.<br />
• Use of large amounts of fuel, water, or energy.<br />
6.1.18 Agriculture and Forestry Resources<br />
While it is not likely that agricultural or forestry resources would be located within the project<br />
area given the urban nature of the City and County of <strong>San</strong> <strong>Francisco</strong>, potential effects to be<br />
evaluated include:<br />
• Conversion of Prime Farmland, Unique Farmland, or Farmland of Statewide Importance.<br />
• Consistency with existing zoning for agricultural use, a Williamson Act contract, forest<br />
land, timberland, and/or timberland zoned Timberland Product.<br />
• Loss or conversion of forest land or agricultural land from to non‐forest or non‐agricultural<br />
uses.<br />
6.1.19 Other Environmental Issues<br />
The EIR will evaluate any potential growth‐inducing impacts that could result from<br />
implementation of the proposed project. The EIR will also address whether the project could<br />
result in impacts that would be significant when combined with the impacts of other SFPUC or<br />
non‐SFPUC projects occurring concurrently within the same geographic area.<br />
6.2 Alternatives<br />
CEQA requires that an EIR evaluate a reasonable range of feasible alternatives to the project, or to<br />
the project location that would attain most of the project objectives but avoid or substantially<br />
lessen any of the significant effects of the project. The EIR will identify the potentially significant<br />
impacts of the proposed project. The findings of the EIR impact analysis will guide the<br />
refinement of an appropriate range of alternatives to be evaluated in the EIR that would avoid or<br />
substantially lessen significant impacts, while still meeting project objectives. Alternatives<br />
suggested during the public scoping period will also be considered. The EIR will also discuss<br />
impacts associated with the No Project Alternative.<br />
7.0 References<br />
<strong>San</strong> <strong>Francisco</strong> <strong>Planning</strong> <strong>Department</strong>, Program Environmental Impact Report on the <strong>San</strong> <strong>Francisco</strong> Public<br />
Utilities Commissionʹs Water System Improvement Program, October 2008.<br />
<strong>San</strong> <strong>Francisco</strong> Public Utilities Commission (SFPUC), Water System Improvement Program<br />
California Environmental Quality Act Findings: Findings of Fact, Evaluation of Mitigation<br />
Measures and Alternatives, and Statement of Overriding Considerations, October 2008<br />
(Attachment A to SFPUC Resolution No. 08‐0200, adopted October 30, 2008).<br />
<strong>San</strong> <strong>Francisco</strong> Groundwater Supply Project 18 March 2011<br />
Case No. 2008.1122E<br />
A.2-44
Revised Notice of Preparation<br />
<strong>San</strong> <strong>Francisco</strong> Public Utilities Commission (SFPUC), CUW 30102 – North Westside Basin Local<br />
Supply (Groundwater Project B), CER Checklist for Environmental Review (Project<br />
Description Requirements), March 25, 2009a.<br />
<strong>San</strong> <strong>Francisco</strong> Public Utilities Commission (SFPUC), Operation Plans for Environmental Review<br />
Purposes – WSIP Groundwater Projects, June 30, 2009b.<br />
<strong>San</strong> <strong>Francisco</strong> Groundwater Supply Project 19 March 2011<br />
Case No. 2008.1122E<br />
A.2-45
This page intentionally left blank<br />
A.2-46
APPENDIX B<br />
Comments Received During EIR Scoping<br />
Process<br />
<strong>San</strong> <strong>Francisco</strong> Groundwater Supply Project B-1 June 2011<br />
Case No. 2008.1122E<br />
A.2-47
This page intentionally left blank<br />
A.2-48
A.2-49
A.2-50
DRAFT<br />
MEMORANDUM OF UNDERSTANDING<br />
BETWEEN<br />
THE SAN FRANCISCO PUBLIC UTILITIES COMMISSION<br />
AND<br />
THE SAN FRANCISCO RECREATION AND PARK DEPARTMENT<br />
FOR THE APPLICATION AND MANAGEMENT OF WATER USE EFFICIENCY PROGRAMS<br />
January____, 2009<br />
This MOU is entered into this _______ day in January 2009, in the City and<br />
County of <strong>San</strong> <strong>Francisco</strong>, by and between the <strong>San</strong> <strong>Francisco</strong> Public Utilities<br />
Commission (SFPUC) and the <strong>San</strong> <strong>Francisco</strong> Recreation and Park <strong>Department</strong><br />
(SFRPD) to further project planning and design for the replacement of<br />
groundwater and potable water with recycled water for irrigation on SFRPD<br />
property and to maximize water use efficiency on SFRPD property.<br />
Recitals<br />
Whereas, the SFPUC is implementing a multi-billion dollar capital<br />
improvement program to upgrade the <strong>San</strong> <strong>Francisco</strong>’s regional and local<br />
drinking water system. The program will deliver improvements that enhance<br />
<strong>San</strong> <strong>Francisco</strong>’s ability to provide reliable, affordable, high quality drinking<br />
water to 800,000 retail customers in <strong>San</strong> <strong>Francisco</strong> and 27 wholesale<br />
customers, in an environmentally sustainable manner.<br />
Whereas, SFRPD is currently pumping potable groundwater for irrigation and<br />
other non-potable uses in Golden Gate Park. Groundwater is pumped from<br />
three active water-supply wells located in Golden Gate Park and one watersupply<br />
well at the <strong>San</strong> <strong>Francisco</strong> Zoo. The water-supply wells draw on the<br />
Westside Basin aquifer, a source of groundwater that extends from Golden<br />
Gate Park to the <strong>San</strong> <strong>Francisco</strong> County line and south into <strong>San</strong> Mateo County.<br />
The SFPUC has undertaken planning and feasibility studies to replace the<br />
groundwater with recycled water for irrigation purposes within Golden Gate<br />
Park and at the <strong>San</strong> <strong>Francisco</strong> Zoo.<br />
A.2-51<br />
1
Whereas, potable water is used for irrigation at SFRPD golf courses, such as<br />
Harding Park and Fleming Park Golf Courses, Sharp Park Golf Course and<br />
Lincoln Park Golf Course. The SFPUC has undertaken design and feasibility<br />
studies to provide recycled water for irrigation at SFRPD golf courses as well<br />
as other parks and open spaces managed by SFRPD and other areas of the<br />
City.<br />
Whereas, Golden Gate Park, Harding Park and Fleming Park Golf Courses,<br />
Lincoln Park Golf Course and the <strong>San</strong> <strong>Francisco</strong> Zoo are located within<br />
designated Recycled Water Use Areas as set forth in <strong>San</strong> <strong>Francisco</strong> Public<br />
Works Code Section 1209.<br />
Whereas, the SFPUC Groundwater Program proposes to pump approximately<br />
four million gallons (mgd) of groundwater a day to blend with the municipal<br />
system for drinking water purposes. Approximately six wells are proposed<br />
for the Western portion of <strong>San</strong> <strong>Francisco</strong> and would begin production after<br />
2011. The proposal includes building three new well stations on SFRPD lands<br />
and modifying two existing wells in Golden Gate Park.<br />
Whereas, the SFPUC Recycled Water Program proposes to build a reverse<br />
osmosis recycled water facility on SFRPD property to produce recycled water<br />
for irrigation purposes at Golden Gate Park, Lincoln Park Golf Course, <strong>San</strong><br />
<strong>Francisco</strong> Zoo and other appropriate facilities by 2013. The SFPUC also<br />
proposes to replace potable water used for irrigation purposes with recycled<br />
water at Harding Park Golf Course and Sharp Park Golf Course in 2010.<br />
Whereas, the SFPUC Water Conservation Program implements a number of<br />
programs to assist residential, municipal and commercial sectors to reduce<br />
water usage. Programs include water audits, rebates and technical and<br />
financial support to implement the water-saving technologies set forth in this<br />
MOU. The SFPUC proposes to save up to four mgd of water through<br />
implementation of conservation measures in <strong>San</strong> <strong>Francisco</strong> by 2018.<br />
Whereas, in order to undertake environmental review of these proposed<br />
projects, it is necessary to coordinate with SFRPD to better define the<br />
possible design and programmatic concepts.<br />
Now, therefore, the Parties agree as follows:<br />
A.2-52<br />
2
AGREEMENT<br />
I. Definitions<br />
A. “Groundwater Facilities” refers to groundwater wells and all related<br />
fixed assets owned and operated by the SFPUC, including transmission,<br />
storage, pumping and appurtenant facilities necessary to deliver<br />
groundwater to the SFPUC distribution system for potable purposes.<br />
Groundwater Facilities include SFRPD groundwater infrastructure that the<br />
SFPUC will modify and use for potable purposes. The SFPUC will<br />
compensate SFRPD for assuming groundwater infrastructure owned by<br />
SFRPD. The term “Groundwater Facilities” does not include any SFRPD<br />
groundwater infrastructure that is not part of the SFPUC's program to<br />
develop groundwater for potable purposes that SFRPD owns, operates and<br />
maintains for its own purposes.<br />
B. "Irrigation System Retrofits" means the retrofits to Park Irrigation<br />
Systems and associated capital costs that are required under Title 22 of<br />
the California Code of Regulations to enable SFRPD to irrigate city parks<br />
and golf courses using recycled water.<br />
C. "Park Irrigation Systems" refers to all SFRPD owned and operated<br />
components of irrigation systems downstream of the discharge side of the<br />
SFPUC's potable water or recycled water meters, including irrigation<br />
piping systems, hoses, fittings and associated valves, sprinklers and<br />
controllers.<br />
D. "Park Water Conservation Plan" refers to the plan to be prepared by<br />
SFRPD and SFPUC that identifies the top water consuming parks in the<br />
City, excluding park lands identified for recycled water and artificial turf<br />
conversion, and to develop measures and recommendations to install<br />
water use efficiency measures, such as retrofits to existing irrigation<br />
systems, new irrigation systems, automatic controllers, climateappropriate<br />
plants, by September 2009. The Plan will include a schedule<br />
for implementation and budget recommendations.<br />
E. "Point of Delivery" refers to the meters to be installed by the SFPUC to<br />
measure the quantities of potable surface water, groundwater, or recycled<br />
water delivered to Park Irrigation Systems, up to the discharge side of the<br />
meters.<br />
F. “Recycled Water Facilities” refers to SFPUC-owned and operated<br />
recycled water treatment plants, transmission, storage, pumping and<br />
appurtenant facilities to and including the Point of Delivery that are<br />
necessary to produce and deliver recycled water to Park Irrigation<br />
Systems.<br />
A.2-53<br />
3
II. Financial Responsibilities; Cooperation Regarding Development<br />
and Use of Recycled Water, Groundwater, and Promotion of Water<br />
Use Efficiency<br />
A. SFPUC will fund the design and, if approved, construction of all<br />
Groundwater and Recycled Water Facilities and retrofits to Park<br />
Irrigation Systems that are required to use recycled water in place of<br />
potable surface or groundwater. The SFPUC will maintain and operate<br />
all Recycled Water and Groundwater Facilities. The SFPUC will<br />
coordinate the design and implementation of any Groundwater and<br />
Recycled Water Facilities with SFRPD.<br />
B. SFRPD will properly use and apply recycled water where available<br />
and maximize water efficiency irrigation measures on park lands using<br />
Park Irrigation Systems. SFRPD will provide access to park lands and<br />
associated property interests, as necessary, following completion of<br />
CEQA review where required, for the construction and operation of any<br />
approved Groundwater and Recycled Water Facilities.<br />
C. SFPUC, as part of its ongoing water conservation program, will<br />
contribute towards the cost of retrofits to Park Irrigation Systems that<br />
are required to maximize water use efficiency and conserve water at<br />
parks based upon the Park Water Conservation Plan, in a manner<br />
similar to water conservation funding provided by the SFPUC to other<br />
large irrigation water users. SFPUC and SFRPD will develop a list of<br />
prioritized sites for retrofits. Upon completion of the improvements to<br />
the irrigation systems, SFRPD and SFPUC will negotiate another<br />
agreement for the SFPUC to operate and maintain the Park Irrigation<br />
Systems.<br />
III. General Design And Construction Considerations For Recycled<br />
Water And Groundwater Projects<br />
A. SFRPD shall assist the SFPUC in identifying all existing utilities in<br />
City parks that are located in the vicinity of all proposed Groundwater<br />
and Recycled Water Facilities, including, but not limited to, water,<br />
sewer, electrical, gas, telephone and cable television.<br />
B. All Recycled Water and Groundwater Facility engineering, design<br />
and, if approved, construction documentation prepared by or for the<br />
SFPUC will be reviewed by SFRPD. All Recycled Water and<br />
A.2-54<br />
4
Groundwater Facility construction, modification and related<br />
appurtenances will be performed in accordance with mutually<br />
approved engineering design and construction plans. The SFPUC and<br />
SFRPD will develop access routes, storage and staging areas for<br />
Recycled Water and Groundwater Facility construction on SFRPD park<br />
lands.<br />
D. SFRPD will work with the SFPUC to identify opportunities to<br />
beneficially use “overboard water” produced by Groundwater Facilities<br />
(groundwater that is generated through pumping that is otherwise not<br />
delivered to the SFPUC's potable water distribution system or to Park<br />
Irrigation Systems) when the well stations initially start up during each<br />
pumping cycle.<br />
E. The SFPUC, in consultation with SFRPD, will prepare maps of the<br />
existing and proposed Park Irrigation Systems within Golden Gate<br />
Park, Harding Park and Fleming Park Golf Courses, Sharp Park Golf,<br />
Lincoln Park Golf Course and the <strong>San</strong> <strong>Francisco</strong> Zoo. The proposed<br />
Park Irrigation System maps will show all Recycled Water and<br />
Groundwater Facilities and associated Points of Delivery to Park<br />
Irrigation Systems. The SFPUC and SFRPD will review and update<br />
these maps as they may change in relation to capital work at Golden<br />
Gate Park, <strong>San</strong> <strong>Francisco</strong> Zoo and/or SFRPD Golf Courses.<br />
G. After fair compensation has been provided to SFRPD, SFRPD will<br />
allow the SFPUC permanent access, with applicable easements, to all<br />
Groundwater and Recycled Water Facilities constructed on SFRPD<br />
property for the short- and long-term operation and maintenance of<br />
these facilities, if approved, following completion of CEQA review<br />
where required.<br />
IV. Coordination of <strong>Planning</strong> and Design Activities for Recycled Water<br />
and Groundwater Facilities by SFRPD and SFPUC<br />
A. Groundwater<br />
1. Municipal Well Stations – Permanent Supply<br />
a. SFPUC, in consultation with SFRPD, will modify two<br />
existing irrigation wells located in Golden Gate Park for potable<br />
purposes. Additionally, the SFPUC will build two new<br />
groundwater well stations at West Sunset Playground and South<br />
Sunset Playground for potable purposes. Modification and<br />
construction of the groundwater well stations are subject to<br />
compliance with CEQA, and subsequent approval, if required<br />
b. SFPUC, in consultation with SFRPD, will develop a<br />
conceptual design for an additional groundwater well<br />
A.2-55<br />
5
station to be located within Golden Gate Park, including<br />
the orientation, layout and footprint of this facility.<br />
c. SFRPD will allow the SFPUC to construct a test well at<br />
the new proposed groundwater well station site. The<br />
purpose of the test well is to verify that the pumping rate<br />
and groundwater quality are sufficient for proceeding with<br />
a new municipal water-supply well station at this location,<br />
subject to compliance with CEQA, and subsequent<br />
approval, if required.<br />
2. Municipal Well Stations – Emergency Supply<br />
a. The parties agree that SFPUC will use the <strong>San</strong><br />
<strong>Francisco</strong> Zoo Well No. 5 as an emergency water supply<br />
on a permanent basis. The SFPUC will coordinate with<br />
SRPD and the <strong>San</strong> <strong>Francisco</strong> Zoo.<br />
b. The parties agree that SFPUC will use the SFPUCconstructed<br />
<strong>San</strong> <strong>Francisco</strong> Zoo Well Emergency Drinking<br />
Water Fill Station on a permanent basis.<br />
c. SFRPD will coordinate with SFPUC in the semi-annual<br />
testing of the <strong>San</strong> <strong>Francisco</strong> Zoo Well Emergency Drinking<br />
Water Fill Station.<br />
3. Groundwater Pipelines<br />
a. SFRPD and the SFPUC will identify locations and routes<br />
for the groundwater branch pipelines (from well stations<br />
to trunk line) in Golden Gate Park, West Sunset<br />
Playground and South Sunset Playground.<br />
4. Groundwater Basin Management<br />
a. SFRPD will work with the SFPUC to develop a plan to<br />
decommission inactive wells in Golden Gate Park as<br />
required by the California Water Code and Article 12B of<br />
the <strong>San</strong> <strong>Francisco</strong> Health Code. SFRPD and SFPUC will<br />
develop a well inventory that documents the condition<br />
and location of the inactive irrigation and monitoring wells<br />
under its jurisdiction and in prepare specifications for well<br />
decommissioning.<br />
b. To protect groundwater quality, the SFPUC will work<br />
with SFRPD to develop plans to maintain a buffer around<br />
A.2-56<br />
6
all current and future groundwater well stations, including<br />
potable and irrigations well stations on SFRPD property,<br />
that is free and clear of construction debris, wood waste<br />
and manure. This buffer area also shall not be used to<br />
store fertilizer, fuels or toxic chemicals.<br />
c. SFRPD will manage groundwater use for irrigation in<br />
the western part of Golden Gate Park in order to avoid<br />
salt water intrusion impacts on the aquifer.<br />
d. SFRPD will allow the SFPUC permanent access to<br />
collect flow rate and flow totalizer data from the flow<br />
meters installed at the South Windmill (Replacement)<br />
Deepwell Pump Station, North Lake Deepwell Pump<br />
Station, <strong>San</strong> <strong>Francisco</strong> Zoo Well no. 5, and Pine Lake<br />
Well. SFRPD and the SFPUC will coordinate to allow the<br />
periodic calibration of these flow meters and for<br />
troubleshooting apparent problems with these meters.<br />
B. Recycled Water<br />
1. SFRPD will coordinate with the SFPUC to assess the Park Irrigation<br />
Systems at Golden Gate Park, Lincoln Park Golf Course, Harding Park<br />
and Fleming Park Golf Courses, Sharp Park Golf Course and the <strong>San</strong><br />
<strong>Francisco</strong> Zoo to determine the necessary retrofits that are required to<br />
irrigate with recycled water.<br />
2. The SFPUC will contribute toward the costs of the irrigation system<br />
retrofits to meet state and local requirements for application of<br />
recycled water and the operational requirements of the SFRPD. The<br />
irrigation system to be installed, at the SFPUC’s direction, shall be the<br />
best available technology (BET) and shall include evapotranspiration<br />
sensors and two-way communications computer controls.<br />
3. SFRPD will operate all Park Irrigation Systems in compliance with<br />
all City, state and federal guidelines on recycled water use<br />
requirements and applicable health, building and plumbing codes,<br />
including but not limited to, backflow prevention, cross connection<br />
control and customer and public interaction, notification, signage &<br />
postings.<br />
4. The SFPUC will train SFRPD employees on the proper use and<br />
application of recycled water on SFRPD property. SFRPD employees<br />
will be responsible for complying with all laws, regulations and<br />
requirements of Federal, state, county and municipal authorities on the<br />
proper application of recycled water.<br />
A.2-57<br />
7
5. SFRPD will comply with the <strong>San</strong> <strong>Francisco</strong> Reclaimed Water<br />
Ordinance (Title 22, Public Works Code) for parks located within<br />
designated "Reclaimed Water Use Areas" by designing and installing<br />
Park Irrigation Systems that meet Title 17 and Title 22 requirements<br />
for application of recycled water.<br />
C. Water Use Efficiency<br />
1. Water Conservation<br />
a. The SFPUC will conduct water audits of SFRPD parks to<br />
identify the largest water users, other than Golden<br />
Gate Park, develop water budgets and install meters if<br />
necessary.<br />
b. SFRPD, with assistance provided by the SFPUC, will<br />
develop a Park Water Conservation Plan by September<br />
2009, including measures and budget<br />
recommendations to conserve water in SFRPD parks.<br />
c. The SFPUC shall immediately establish an assessment<br />
program of SFRPD facilities to verify the location and<br />
accuracy of water meters and water usage.<br />
2. Landscape Practices<br />
a. SFRPD will promote climate appropriate planting<br />
unless the new/renovated area is designed for<br />
recreational purposes or subject to other restrictions such<br />
as landmark designation.<br />
b. All landscape-related activities under SFRPD will be in<br />
compliance with AB 1881.<br />
c. Park Irrigation Systems will be designed, installed and<br />
operated to ensure the efficient use of water during<br />
operation, including but not limited to operating irrigation<br />
systems to prevent run off and overspray.<br />
3. SFRPD Park Facility Renovations<br />
a. SFRPD, with the assistance of the SFPUC Water<br />
Conservation Program, will incorporate water efficient<br />
A.2-58<br />
8
fixtures in all SFRPD facility renovations and new facilities<br />
built on SFRPD property.<br />
b. SFRPD will use re-circulating water in non-potable<br />
water features, such as decorative fountains, located on<br />
SFRPD property as allowed by local and state regulatory<br />
agencies.<br />
V. Post Project Implementation Activities – Items for Future<br />
Agreement Following Completion of Review Under California<br />
Environmental Quality Act<br />
The SFPUC's recycled water and groundwater projects in <strong>San</strong> <strong>Francisco</strong> must<br />
undergo CEQA review by the <strong>Department</strong> of City <strong>Planning</strong> prior to the<br />
exercise of discretion by either SFPUC or SFRPD in initiating construction;<br />
allocating funding for construction; or allowing use of SFRPD property for<br />
SFPUC project facilities. SFRPD must in addition make required findings<br />
under the City Charter and Administrative Code regarding whether SFPUC's<br />
proposed use of park property is consistent or otherwise related to park use<br />
prior to authorizing use of park lands for project purposes by the SFPUC.<br />
Notwithstanding anything to the contrary in this MOU, neither party is in any<br />
way limiting its discretion or the discretion of any department, board or<br />
commission with jurisdiction over these projects, including but not limited to<br />
the SFPUC, the SFRPD or the Board of Supervisors, from exercising any<br />
discretion available to such department, board or commission with respect to<br />
these projects, including but not limited to the discretion to (i) make such<br />
modifications deemed necessary to mitigate significant environmental<br />
impacts, (ii) select other feasible alternatives to avoid such impacts; (iii)<br />
balance the benefits against unavoidable significant impacts prior to taking<br />
final action if such significant impacts cannot otherwise be avoided, or (iv)<br />
determine not to proceed with the proposed Projects.SFPUC and SFRPD<br />
agree to cooperate and use best efforts to reach agreement, including<br />
agreement on the project description required to perform the necessary<br />
environmental analysis, on the following matters:<br />
A. Groundwater<br />
1. Conversion by the SFPUC of two existing irrigation wells in<br />
Golden Gate Park, the South Windmill (Replacement) Deepwell<br />
Pump Station and the North Lake Deepwell Pump Station, for<br />
permanent use as permitted water sources for the <strong>San</strong> <strong>Francisco</strong><br />
municipal water supply.<br />
2 Construction and permanent operation of a new municipal<br />
water-supply well station by the SFPUC in Golden Gate Park.<br />
3. Construction and permanent operation of a new municipal<br />
water-supply well station by the SFPUC at a site at the West<br />
Sunset Playground. This site is located in the northeast corner<br />
A.2-59<br />
9
of the parking lot for the playground, near 40th Avenue and<br />
Quintara Street.<br />
4. Construction and permanent operation of a new municipal<br />
water-supply well station by the SFPUC at a site at the South<br />
Sunset Playground. This site is located behind the southeast<br />
corner of the new playing fields at the playground near 40th<br />
Avenue and Wawona Street.<br />
5. Conversion of the new West Sunset Playground municipal<br />
water-supply well station for use as an emergency water supply<br />
and drinking water fill station.<br />
B. Recycled Water<br />
1. Construction and operation by SFPUC of a reverse osmosis<br />
recycled water treatment facility, or similar recycled water<br />
treatment facility, within Golden Gate Park to produce recycled<br />
water for irrigation purposes. SFPUC and SFRPD will jointly<br />
determine the location of the treatment facility. If the facility is<br />
located above-ground, the SFPUC will provide fair compensation<br />
to SFRPD.<br />
2. Modification by SFPUC of the existing reservoir within Golden<br />
Gate Park to store recycled water for use at Golden Gate Park<br />
and Lincoln Park Golf Course.<br />
3. Construction by SFPUC of a 700,000 gallon underground<br />
tank and above ground pump station to store and pump<br />
recycled water for irrigation at Harding Park and Fleming Park<br />
Golf Courses.<br />
A.2-60<br />
10
each site visit with a vehicle. Any additional cost incurred toremove and re-install removable<br />
site furniture will be paid by PUC.<br />
• For vehicle access using the gate along the first base side of the field, which will require driving<br />
onto the field, PUC will adhere to the load limits for a vehicle as specified by the synthetic turf<br />
manufacturer.<br />
• PUC’s City Distribution Division shall provide the Recreation and Park <strong>Department</strong> (RPD)’s<br />
Neighborhood Services Manager with a minimum of 3-days advance notice prior to a site visit<br />
with a vehicle that would require removing the players’ benches and bleachers and/or field<br />
access. The advance notice shall not apply under emergency conditions.<br />
• Rooftop of the facility should be no higher than 3’ above the elevation of the sidewalk on the<br />
abutting side. (The roof may, however, be sloped from front to back where the front side would<br />
be higher than the back side adjacent to the sidewalk). The fence line between the sidewalk and<br />
the facility shall be coordinated with fence height currently being designed by RPD consistent<br />
with PUC’s security requirements.<br />
• Wherever possible minimize potential adverse permanent effects from noise, odors and lighting.<br />
• The contractor specs will provide detailed instructions on construction staging and access.<br />
Constructing activities will not spill over onto the field nor substantially affect recreation use of<br />
the field. The site will be accessed for construction from the adjacent right of way (as opposed to<br />
the field).<br />
• The athletic field fence lines, backstops and field turf shall not be removed or damaged by<br />
construction activities.<br />
• The final design will not interfere with recreational programs or pedestrian circulation.<br />
• The (new) test well (south/east corner) will need to be completed prior to the start of field<br />
construction, which is anticipated to begin late June 2007. This corner of the park will be made<br />
accessible to PUC starting May 28, 2007. PUC shall coordinate with on-site staff regarding<br />
access and temporary fencing.<br />
• Since the PUC project will not be constructed for several years, we request that the test well<br />
surface elevation be set at the final grade of our project drawings. This elevation can be<br />
modified once your project moves forward.<br />
• The (new) test well (south/east corner) must be adequately capped so that it does not pose a<br />
safety hazard to the general public or interfere with construction activities related to the Fields<br />
Project.<br />
• PUC shall remove the existing monitoring well located in the south/west corner of the park prior<br />
to the start of construction on the Fields Project<br />
• PUC shall coordinate with RPD on all electrical requirements needed for this facility prior to the<br />
end of April 2007 so that both projects can be coordinated with PG&E without impacting the<br />
A.2-61
June 25, 2007<br />
Jeff Gilman<br />
SFPUC Water Enterprise<br />
1145 Market Street, Ste 401<br />
<strong>San</strong> <strong>Francisco</strong>, CA 94103<br />
Dear Mr. Gilman:<br />
Thank you for meeting with us on March 16, 2007 regarding your proposal for a Groundwater well<br />
pump station (“facility”) at South Sunset Playground. As a follow up to that meeting, and the meetings<br />
on April 5 and May 23, 2007 we have compiled a list of conditions for the use of the site for a new<br />
groundwater well facility. The conditions will provide the necessary framework to implement your<br />
project without interfering with recreational programming or conflict with our efforts to renovate the<br />
existing athletic field through the Fields Project.<br />
General Conditions<br />
• Move the facility closer to the corner space of Wawona Avenue and 40 th Street, or move a<br />
portion of the building under the sidewalks (DPW right-of-way) to open up more space for the<br />
field. This will minimize the risk for potential interference with recreational activities on the<br />
park. The proposed facility should not protrude into the park any further than the new block<br />
retaining wall that will be constructed as part of the new Fields Project.<br />
• The facility shall be constructed substantially similar to the site plan as depicted on Attachment<br />
“A.” The long edge of the facility shall be along 40th Ave. The facility shall contain a storage<br />
room with a minimum clear floor space area of 8’ deep by 15’ long. This room shall be accessed<br />
by a 10’ wide roll down door.<br />
• The storage room will be used solely by RecPark for maintenance storage.<br />
• A barrier fence shall be constructed along the side of the facility on the berm to detract park<br />
users from jumping or climbing on the roof.<br />
• Routine PUC access to the facility for operation and maintenance will be on foot, using the<br />
playground gate along Wawona Street. When occasionally required for major maintenance,<br />
PUC may access the facility by vehicle by removing the players’ benches, fence sections and<br />
bleachers (“removable site furniture”) along the Wawona Street (third base) side of the field, or<br />
by using the access gate for the RecPark storage room along the first base side of the field. PUC<br />
and RecPark will establish an appropriate visitation protocol as part of a future Memorandum of<br />
Understanding between the <strong>Department</strong>s.<br />
• For vehicle access requiring the removal of removable site furniture along the third base side of<br />
the field, PUC will be responsible for removing and re-installing removable site furniture after<br />
A.2-62
Field renovation project. PUC and RPD shall share equally all costs required to bring electrical<br />
service from the utility pole to the project site. Either party reserves the right to terminate its<br />
coordination on electrical requirements if that party will not proceed with its project. In the case<br />
that a party will not be proceeding with its project, that party shall give timely written notice to<br />
the other party. The terminating party shall be obligated to compensate the other party for<br />
incremental costs incurred up to the point of termination.<br />
As we discussed, the South Sunset project will require approval in the form of a resolution and<br />
Memorandum of Understanding from the Recreation and Park Commission. The Project EIR for the<br />
facilities must be complete prior to Commission action. You indicated at our last meeting that the<br />
Project EIR would be certified sometime in 2009.<br />
The PUC may continue with the temporary groundwater drilling for the site, however, provided that the<br />
PUC understands and has agreed to the conditions contained in this letter and CEQA review is<br />
satisfactorily completed for the drilling. In the event that the pump station is not constructed, the PUC<br />
shall remove the test well and restore the park to the appropriate condition.<br />
In order to effectively carry out your proposal, the <strong>Department</strong> recommends holding at least two<br />
community meetings in the South Sunset neighborhood area and at least one information presentation to<br />
the Recreation and Park Commission.<br />
Thank you for your continued cooperation. If you have any questions, please contact me at (415) 831-<br />
2742.<br />
Regards,<br />
Daniel LaForte<br />
Park Planner<br />
Attachment:<br />
Cc:<br />
“Attachment “A”, Preferred Layout for South Sunset Playground<br />
Yomi Agunbiade<br />
Dan Mauer<br />
Ronnie Scott<br />
Denny Kern<br />
Scott Reese<br />
Barry Pearl<br />
Dawn Kamalanathan<br />
A.2-63
A.2-64
March 10, 2008<br />
Jeff Gilman<br />
SFPUC Water Enterprise<br />
1145 Market Street, Ste 401<br />
<strong>San</strong> <strong>Francisco</strong>, CA 94103<br />
Dear Mr. Gilman:<br />
Thank you for meeting with us on December 20, 2007 regarding your proposal for a Groundwater well<br />
pump station at West Sunset Playground. As a follow up to that meeting we have compiled a list of<br />
conditions for the use of the site for a new groundwater well facility. The conditions will provide the<br />
necessary framework to implement your project without interfering with recreational programming or<br />
operations.<br />
General Conditions<br />
• The facility shall be constructed substantially similar to the site plan as depicted on Attachment<br />
“A” (Option E2).<br />
• Wherever possible minimize potential adverse permanent effects from noise, odors and lighting.<br />
• The contractor specs will provide detailed instructions on construction staging and access.<br />
• The final design will not interfere with recreational programs, traffic or pedestrian circulation.<br />
• A (new) test well (north/east corner of parking lot) is anticipated to be constructed in April and<br />
May 2008. The PUC shall coordinate with on-site staff regarding access and temporary fencing<br />
for this construction activity.<br />
• When completed, the (new) test well (north/east corner of parking lot) must be adequately<br />
capped so that it does not pose a safety hazard to the general public.<br />
• The PUC shall incur expenses for all electrical requirements needed for this facility.<br />
• The PUC shall coordinate with RPD in identifying all irrigation lines. The PUC shall incur<br />
expenses related to capping, repair, removal or adding new irrigation lines required for the<br />
construction of the new groundwater well facility.<br />
• The project must meet <strong>Department</strong>’s tree removal guidelines. Tree posting requirement is a 30-<br />
day minimum.<br />
A.2-65
• Stormwater runoff will be controlled and managed so that the water is diverted from the material<br />
storage area. The PUC shall also be responsible for landscaping around the facility to reduce<br />
erosion and stabilize the berm.<br />
As we discussed, the West Sunset pump station project will require approval in the form of a resolution<br />
and Memorandum of Understanding from the Recreation and Park Commission. The Project-Specific<br />
EIR for the North Westside Basin Local Groundwater Supply project must be complete prior to<br />
Commission action. You indicated at our last meeting that the Project-Specific EIR would be certified<br />
sometime in 2009.<br />
The PUC may continue with the temporary groundwater drilling for the site, however, provided that the<br />
PUC understands and has agreed to the conditions contained in this letter and CEQA review is<br />
satisfactorily completed for the drilling. In the event that the pump station is not constructed, the PUC<br />
shall remove the test well and restore the park to the pre-existing condition.<br />
In order to effectively carry out your proposal, the <strong>Department</strong> recommends holding at least two<br />
community meetings in the Outer Sunset neighborhood area and at least one information presentation to<br />
the Recreation and Park Commission.<br />
Thank you for your continued cooperation. If you have any questions, please contact me at (415) 831-<br />
2742.<br />
Regards,<br />
Daniel LaForte<br />
Park Planner<br />
Attachment: Attachment “A”, Site Plan, West Sunset Playground Well Station, Option E-2<br />
Cc:<br />
Yomi Agunbiade<br />
Dan Mauer<br />
Ronnie Scott<br />
Denny Kern<br />
Barry Pearl<br />
Dawn Kamalanathan<br />
A.2-66
A.2-67
Golden Gate Park Preservation Alliance ©<br />
“Destroy a public building and it can be rebuilt in a year; destroy a<br />
city woodland park and all the people living at the time will have<br />
passed away before its restoration can be effected."<br />
William Hammond Hall, Surveyor<br />
First Superintendent of Golden Gate Park<br />
March 31, 2011<br />
Mr. Bill Wycko<br />
c/o Timothy Johnston<br />
<strong>San</strong> <strong>Francisco</strong> <strong>Planning</strong> <strong>Department</strong><br />
1650 Mission Street, Suite 400<br />
<strong>San</strong> <strong>Francisco</strong>, CA, 94103-2479<br />
Re:<br />
EIR Case No.2008.1122E<br />
<strong>San</strong> <strong>Francisco</strong> Groundwater Supply Project<br />
Revised NOP for EIR, March 2, 2011<br />
Dear Mr. Wycko:<br />
Following are comments pursuant to the March 2, 2011, Revised Notice of Preparation for the<br />
Environmental Impact Report for the referenced project (herein referred to as the project). We would<br />
like to take this opportunity to outline some of the issues that we feel must be included in the EIR.<br />
We also encourage the <strong>Department</strong> to start comprehensive outreach to a broader range of members<br />
of the public who have expressed concern in the past with issues relating to Golden Gate Park. All<br />
<strong>San</strong> Franciscans and Bay Area residents must have the opportunity to raise their own concerns<br />
about the project with the <strong>Department</strong>.<br />
SUMMARY:<br />
The following are issues which we feel must be thoroughly explored in an EIR:<br />
- Potential impacts of the proposed project;<br />
- Alternative designs for the proposed project;<br />
- Review of documents and agreements relating to the proposed project;<br />
- Issues related to other water treatment projects;<br />
- Safety of all aspects of the proposed project;<br />
- Issues related to additional and/or adjacent projects, including but not limited to the<br />
SF Westside Recycled Water Project and the Beach Chalet Athletic Fields;<br />
- Water conservation alternatives;<br />
- Limit of project to wells outside of Golden Gate Park;<br />
- Scoping letters for related projects<br />
EIR Scoping Request - <strong>San</strong> <strong>Francisco</strong> Groundwater Supply Project - Page 1 of 7<br />
A.2-68
DETAILS:<br />
Potential impacts of the proposed project<br />
• The EIR must analyze how construction will impact all the immediate and adjoining parkland<br />
sites, including but not limited to:<br />
o The use of earth-moving equipment and cranes;<br />
o Removal of sand and soil;<br />
o Construction zone needed for building the pumping stations ;<br />
o Removal of specific trees and shrubs;<br />
o Damage to remaining trees, and tree roots damaged, by construction, including<br />
trenching for underground utilities.<br />
• The EIR must analyze how construction will impact the area outside of parkland, including<br />
but not limited to:<br />
o The impact of the construction of the project on adjoining residential and commercial<br />
neighborhoods.<br />
• The EIR must study parking and traffic impacts, including but not limited to:<br />
o Impact on traffic in the neighborhood surrounding the project sites;<br />
o Impact on the above traffic and parking issues not only during ordinary weekdays<br />
and weekends, but also during special, heavy-park usage events such as the<br />
Outside Lands Festival, the Bay to Breakers, and all the other events that take place<br />
throughout Golden Gate Park and at Ocean Beach.<br />
• The EIR must study the impacts to wildlife at all project sites, including but not limited to:<br />
o Loss of open space, trees, and shrubs;<br />
o Loss of windbreaks;<br />
o Loss of, and damage to, tree roots for trees that are to remain;<br />
o Increase in paved surfaces;<br />
o Increase in noise from pumps, motors, trucks and other equipment;<br />
o Increase in heavy vehicular traffic;<br />
o Introduction of all of these elements along the Pacific Flyway and to the green<br />
corridor that is Golden Gate Park.<br />
• The EIR must study aesthetic impacts and the impacts on the quality of life of surrounding<br />
areas due to the proposed project, including but not limited to:<br />
o Loss of trees and shrubs;<br />
o All impacts due to noise related to the proposed project - both construction and<br />
ongoing facility operations;<br />
o All impacts due to artificial lighting related to the proposed project;<br />
o The aesthetic impact on the parkland experience of the pumping stations.<br />
• The EIR must study the loss of parkland use for a wider variety of users, including but not<br />
limited to:<br />
o Loss of the potential general recreation uses;<br />
o Specific description of land areas needed for pumping stations and justification for<br />
these land areas. For example, the Tree Report 1 shows a large land area at the<br />
Central Pump Station in Golden Gate Park. The report lists 52 trees in this area, with<br />
1 "<strong>San</strong> <strong>Francisco</strong> Groundwater Supply Project, Tree and Large Shrub Assessment Report," Figure 7, SFPUC,<br />
February 2011.<br />
EIR Scoping Request - <strong>San</strong> <strong>Francisco</strong> Groundwater Supply Project - Page 2 of 7<br />
A.2-69
o<br />
seven to be removed for "health" reasons, but there is no indication of what kind of<br />
construction will take place in this area and or how much room will be needed.<br />
The Central Pump Station is located next to a construction yard. The EIR must<br />
consider the alternative of using this construction yard as the location for the pump<br />
station, instead of using forested parkland.<br />
• The EIR must study the impact of the project on the aquifer underneath Golden Gate Park,<br />
including but not limited to:<br />
o Depletion of the aquifer;<br />
o Cumulative contamination of the aquifer with inorganic and organic contaminants,<br />
including but not limited to heavy metals, halogens, pharmaceutical waste,<br />
pesticides, hormones, from the proposed Westside Recycled Water Treatment plant<br />
output which is planned to irrigate Golden Gate Park;<br />
o Cumulative contamination of the aquifer due to the possible presence of artificial turf<br />
at the proposed Beach Chalet Athletic Fields project.<br />
• The EIR must study the impact of the energy needed to power the plant, including but not<br />
limited to:<br />
o Amount of energy needed to pump water out of the ground and to the Sunset<br />
Reservoir;<br />
o Energy needed to process the water according to various water treatment standards.<br />
• The EIR must study the economic impact of the project, including but not limited to:<br />
o The impact on the cost of water to consumers;<br />
o The impact on the cost of the project to the taxpayers;<br />
o Consideration of less expensive alternatives to the proposed project.<br />
• The EIR must explore the possibility of future expansion of the pumping stations at the<br />
Golden Gate Park and other parkland locations, and the impact on all of the issues included<br />
in this document.<br />
• The EIR must study the cumulative impact of the existing and proposed athletic/soccer field<br />
and the Westside Water Treatment Plant, if built in Golden Gate Park, including but not<br />
limited to:<br />
o Cumulative impact on historic and aesthetic character of Golden Gate Park and<br />
Ocean Beach.<br />
o Cumulative effect of increased lighting, paving, traffic and all other issues considered<br />
in both this document and in the attached document for the Westside Water<br />
Treatment Plant.<br />
Alternative designs for the proposed project<br />
• The EIR must explore alternative designs that preserve the natural meadow and forest<br />
feelings of Golden Gate Park, including but not limited to:<br />
o Construction of pumping and equipment stations that are completely underground;<br />
o Construction of minimal, park-friendly security measures that do not detract from the<br />
bucolic experience of Golden Gate Park; for example, if fencing is necessary, then other<br />
types of fence than chain link must be considered.<br />
• The EIR must explore alternative designs for the West Sunset Playground pumping station,<br />
including but not limited to:<br />
EIR Scoping Request - <strong>San</strong> <strong>Francisco</strong> Groundwater Supply Project - Page 3 of 7<br />
A.2-70
o<br />
Placing the pumping station away from the existing mature and significant Cupressus<br />
macrocarpa trees, so that they can be preserved. (Trees # 783, 784, 785, and 786.) 2<br />
For example, the pumping station can be placed in the parking lot.<br />
Review of documents and agreements relating to the proposed project<br />
• The EIR must explain the relationship of the proposed project to all relevant City documents<br />
and agreements. The individual and cumulative impact of these documents and agreements<br />
on parkland must be examined and explored in detail. These documents include but are not<br />
limited to:<br />
o The <strong>San</strong> <strong>Francisco</strong> General Plan;<br />
o The Golden Gate Park Master Plan;<br />
o All current and proposed water supply agreements entered into or to be entered into<br />
by the SFPUC;<br />
o All agreements with other <strong>Department</strong>s and Agencies in the City related to the<br />
proposed project, including but limited to all Memoranda of Understanding between<br />
the SFPUC and the SF Recreation and Parks <strong>Department</strong>.<br />
Issues related to other water treatment projects<br />
• The EIR must explain the relationship of the proposed project to all other water projects in<br />
<strong>San</strong> <strong>Francisco</strong> and related areas as well as their impact on <strong>San</strong> <strong>Francisco</strong> parkland,<br />
including but not limited to:<br />
o<br />
o<br />
Proposed water treatment projects in <strong>San</strong> <strong>Francisco</strong>;<br />
Proposed water treatment projects in surrounding communities with which <strong>San</strong><br />
<strong>Francisco</strong> has water supply agreements.<br />
• The EIR must consider coordinating the Groundwater Supply Project piping with the piping<br />
necessary for the Westside Recycled Treatment Plant, including but not limited to<br />
consideration of sharing trenches and/or construction with piping from the Westside<br />
Recycled Treatment Plant alternative locations up to Golden Gate Park. These locations<br />
include, but may not be limited to, the Sunset Circle, the Armory and the Zoo Parking Lot<br />
sites.<br />
Safety of all aspects of the proposed project<br />
• The EIR must explore all environmental safety issues related to the proposed plant, including<br />
but not limited to:<br />
o The risk of damage to the project by earthquakes, tsunamis, and other natural<br />
disasters;<br />
o The risk of damage to the project by terrorists, industrial accidents and other manmade<br />
disasters.<br />
o The impact of security measures on all project locations, in the eventuality that the<br />
risk of damage to projects by terrorists be considered heightened.<br />
2<br />
"<strong>San</strong> <strong>Francisco</strong> Groundwater Supply Project, Tree and Large Shrub Assessment Report," Figure 3, SFPUC,<br />
February 2011.<br />
EIR Scoping Request - <strong>San</strong> <strong>Francisco</strong> Groundwater Supply Project - Page 4 of 7<br />
A.2-71
Water conservation alternatives<br />
• The EIR must discuss water conservation alternatives to the proposed project, including but<br />
not limited to:<br />
o Use of desalinated water;<br />
o Collaboration with other agencies, including but not limited to Bay Area Water Users<br />
Association, for construction of a water recycling plant outside of <strong>San</strong> <strong>Francisco</strong><br />
o Retrofitting of Recreation and Park piping and other irrigation fixtures to achieve<br />
water savings;<br />
o Use of permeable paving and permeable pavers throughout <strong>San</strong> <strong>Francisco</strong> to<br />
promote replenishment of the aquifer;<br />
o Removing additional paving in Golden Gate Park to promote replenishment of the<br />
aquifer;<br />
o Use of tertiary water in all buildings in <strong>San</strong> <strong>Francisco</strong>.<br />
Limit of project to wells outside of Golden Gate Park<br />
• Section 4.2.1 of the Groundwater NOP states:<br />
"If the <strong>San</strong> <strong>Francisco</strong> Westside Recycled Water Project is not implemented and a backup<br />
source of irrigation water for Golden Gate Park (i.e., other than groundwater) is not made<br />
available, the existing irrigation wells in Golden Gate Park would not be used to supply<br />
municipal water as part of the <strong>San</strong> <strong>Francisco</strong> Groundwater Supply Project. Under this<br />
scenario, the proposed project would only include operation of four potable wells, which may<br />
result in some reduction in the average annual groundwater production."<br />
• The EIR must therefore include the non-building of the <strong>San</strong> <strong>Francisco</strong> Westside Water<br />
Project as an alternative, with information in detail about this alternative, including but not<br />
limited to:<br />
o The amount of water projected to come from each Golden Gate Park pumping<br />
o<br />
station;<br />
The amount of water per day expected to come from each pumping station outside of<br />
Golden Gate Park.<br />
• If the non-building of the Westside Recycled Water Project is not included as an alternative,<br />
the EIR must still include the above information.<br />
Scoping letters for related projects<br />
In addition to the foregoing, also attached are letters dated October 12th, 2010 addressing scoping<br />
issues for the Westside Recycled Water Project and March 3, 2011 addressing scoping issues for<br />
the Beach Chalet Soccer Fields Renovation. All requests for consideration in those letters are<br />
hereby incorporated by reference.<br />
EIR Scoping Request - <strong>San</strong> <strong>Francisco</strong> Groundwater Supply Project - Page 5 of 7<br />
A.2-72
CONCLUSION:<br />
We are looking forward to the inclusion of the above issues and other related issues in the EIR, so<br />
that the resulting project can be the most beneficial for preserving the beauty and historic context<br />
and current uses of Golden Gate Park, the recreation opportunities in all <strong>San</strong> <strong>Francisco</strong> parkland, as<br />
well as providing safe drinking water and irrigation water for <strong>San</strong> <strong>Francisco</strong>.<br />
In addition, we remain very interested in the steps that will be taken in the development of the EIR<br />
and the pursuit of this project. We request that the <strong>Department</strong> notify us and the people copied on<br />
this letter about the <strong>Department</strong>'s plans at this time and throughout the EIR process.<br />
Thank you for your consideration.<br />
Sincerely,<br />
Katherine Howard<br />
Member, Steering Committee<br />
Golden Gate Park Preservation Alliance<br />
Attachments - Scoping and comment letters:<br />
October 12th, 2010, Westside Recycled Water Project<br />
March 3, 2011, Beach Chalet Soccer Fields Renovation.<br />
cc:<br />
Timothy Johnston, <strong>San</strong> <strong>Francisco</strong> <strong>Planning</strong> <strong>Department</strong><br />
Mark Buell, President, Recreation and Park Commission<br />
Margaret McArthur, Secretary, Recreation and Park Commission<br />
Dan Mauer, Project Manager, Recreation and Park <strong>Department</strong><br />
Parks and Recreation Open Space Committee, <strong>San</strong> <strong>Francisco</strong> (PROSAC)<br />
Mayor Ed Lee<br />
Clerk of the Board of Supervisors<br />
David Chiu, President, <strong>San</strong> <strong>Francisco</strong> Board of Supervisors, District 3<br />
Ross Mirkarimi, <strong>San</strong> <strong>Francisco</strong> Board of Supervisors, District 5<br />
Eric Mar, <strong>San</strong> <strong>Francisco</strong> Board of Supervisors, District 1<br />
Mark Farrell, <strong>San</strong> <strong>Francisco</strong> Board of Supervisors, District 2<br />
John Avalos, <strong>San</strong> <strong>Francisco</strong> Board of Supervisors, District 11<br />
David Campos, <strong>San</strong> <strong>Francisco</strong> Board of Supervisors, District 9<br />
Carmen Chu, <strong>San</strong> <strong>Francisco</strong> Board of Supervisors, District 4<br />
Jane Kim, <strong>San</strong> <strong>Francisco</strong> Board of Supervisors, District 6<br />
Scott Wiener, <strong>San</strong> <strong>Francisco</strong> Board of Supervisors, District 8<br />
Sean Elsbernd, <strong>San</strong> <strong>Francisco</strong> Board of Supervisors, District 7<br />
Malia Cohen, <strong>San</strong> <strong>Francisco</strong> Board of Supervisors, District 10<br />
Dr. Eliot Katz, In Defense of Animals<br />
Arthur Feinstein, Sierra Club<br />
John Rizzo, Sierra Club<br />
Michael Lynes, Golden Gate Audubon Society<br />
Noreen Weeden, Golden Gate Audubon Society<br />
Peter Brastow, Nature in the City<br />
Roy C. Leggitt, III, Consulting Arborist<br />
EIR Scoping Request - <strong>San</strong> <strong>Francisco</strong> Groundwater Supply Project - Page 6 of 7<br />
A.2-73
Amy Westervelt, Managing Editor, Earth Island Journal<br />
California Academy of Sciences<br />
California Communities Against Toxics<br />
Caroline Cox, Research Director, Center for Environmental Health<br />
Dave Phillips Executive Director, Earth Island Institute<br />
Deb Self, Executive Director <strong>San</strong> <strong>Francisco</strong> Baykeeper<br />
Greenaction for Health and Environmental Justice<br />
<strong>San</strong> <strong>Francisco</strong> Foundation<br />
<strong>San</strong> <strong>Francisco</strong> Green Party<br />
Save the Bay<br />
Surfrider Foundation, <strong>San</strong> <strong>Francisco</strong> Chapter<br />
Melanie Macchio, The Cultural Landscape Foundation<br />
Jennifer Gates, California Preservation Foundation<br />
Mike Buhler, <strong>San</strong> <strong>Francisco</strong> Architectural Heritage<br />
Alexandra Bevk, <strong>San</strong> <strong>Francisco</strong> Architectural Heritage<br />
Charles Chase, SF Historic Preservation Commission<br />
Janet Gracyk, Historic American Landscape Survey (HALS)<br />
Jim Chappell, <strong>San</strong> <strong>Francisco</strong> Beautiful<br />
Sheila Kolenc, <strong>San</strong> <strong>Francisco</strong> Beautiful<br />
Susan Brandt-Hawley, Preservation Lawyers<br />
Carolyn Blair, <strong>San</strong> <strong>Francisco</strong> Tree Council<br />
David Eldred, Keep the Arboretum Free<br />
David Goggin, <strong>San</strong> Franciscans for Smart Lighting<br />
George Wooding, West of Twin Peaks Central Council (WTPCC)<br />
Gerry Crowley, Telegraph Hill Dwellers<br />
John Frykman, Coalition to Save Ocean Beach, Friends of Sutro Park<br />
Judy Berkowitz, Coalition for <strong>San</strong> <strong>Francisco</strong> Neighborhoods (CSFN)<br />
Judy Irving, Telegraph Hill Dwellers<br />
Julie Burns, Friends of Lands End<br />
Kelley Watts, <strong>Francisco</strong> Heights Civic Association<br />
Libby Benedict, Friends of Rossi Park<br />
Marc Duffett, Sunset Parkside Education and Action Committee (SPEAK)<br />
Mary Anne Miller, <strong>San</strong> <strong>Francisco</strong> Tomorrow<br />
Nancy Wuerfel, Golden Gate Park Preservation Alliance<br />
Ray Holland, <strong>Planning</strong> Association for the Richmond (PAR)<br />
Suzanne Dumont, Save the Stowe Lake Boathouse Coalition<br />
EIR Scoping Request - <strong>San</strong> <strong>Francisco</strong> Groundwater Supply Project - Page 7 of 7<br />
A.2-74
Golden Gate Park Preservation Alliance ©<br />
“Destroy a public building and it can be rebuilt in a year; destroy a<br />
city woodland park and all the people living at the time will have<br />
passed away before its restoration can be effected."<br />
William Hammond Hall, Surveyor<br />
First Superintendent of Golden Gate Park<br />
October 12, 2010<br />
Mr. Bill Wycko<br />
<strong>San</strong> <strong>Francisco</strong> <strong>Planning</strong> <strong>Department</strong><br />
1650 Mission Street, Suite 400<br />
<strong>San</strong> <strong>Francisco</strong>, CA, 94103<br />
Re:<br />
EIR Case No.2008.0091E<br />
SF Westside Recycled Water Project<br />
(Recycled water project, including factory planned for Golden Gate Park)<br />
Dear Mr. Wycko:<br />
Following are comments pursuant to a September 8, 2010, Notice of Preparation for the<br />
Environmental Impact Report for the referenced project (herein referred to as the Factory). We<br />
would like to take this opportunity to outline some of the issues that we feel should be included<br />
in the EIR. We also encourage the <strong>Department</strong> to start comprehensive outreach to a broader<br />
range of members of the public who have expressed concern in the past with issues relating to<br />
Golden Gate Park. All <strong>San</strong> Franciscans and Bay Area residents should have the opportunity to<br />
raise their own concerns about the project with the <strong>Department</strong>.<br />
SUMMARY:<br />
The following are issues which we feel should be thoroughly explored in an EIR:<br />
- Potential impacts of the proposed project;<br />
- Alternative locations for the proposed project;<br />
- Alternative designs for the proposed project;<br />
- Review of documents and agreements relating to the proposed project;<br />
- Issues related to other water treatment projects;<br />
- The safety of all aspects of the proposed project;<br />
- Issues related to the use of membrane filtration and reverse osmosis in the<br />
proposed project;<br />
- Customer retrofits;<br />
- Future Expansion of the project:<br />
- Issues related to additional and/or adjacent projects, including both the existing<br />
and proposed renovated athletic fields adjoining the proposed project;<br />
- Water conservation alternatives<br />
- Beach Chalet Athletic Field Renovation Project scoping letter<br />
EIR Scoping Request - <strong>San</strong> <strong>Francisco</strong> Westside Recycled Water Treatment Plant - Page 1 of 8<br />
A.2-75
DETAILS:<br />
Potential impacts of the proposed project<br />
• The EIR should discuss the ways in which the project described by the PUC may have a<br />
substantial adverse impact on the historic integrity of Golden Gate Park. The National<br />
Register of Historic Places lists the characteristics of the Park as pastoral, with<br />
recreation areas that blend into that setting. The EIR should discuss the ways in which<br />
the proposed project may considerably change this area because, among other things,<br />
the project:<br />
o Adds a building where this is no building at this time<br />
o Takes away land from an area that could be recovered and used to fulfill the<br />
landscape needs of Golden Gate park<br />
o Has lighting where there is no lighting at this time;<br />
o Removes trees and shrubs;<br />
o Removes trees that provide a windbreak, which protects the rest of Golden Gate<br />
Park;<br />
o Injects a factory building into an area that is adjacent to landmarks, removing the<br />
possibility of establishing connections between them in the western end of<br />
Golden Gate Park Adds paving for more parking, introducing more cars to<br />
parkland;<br />
o Introduces truck traffic to the space<br />
o Changes the space from an open space to one dominated by a large building<br />
and related driveways and parking<br />
o Introduces 24 hour activity to a space that is currently used only during the day<br />
o<br />
• The EIR should analyze how construction will impact the immediate and adjoining<br />
parkland, including but not limited to:<br />
o The use of earth-moving equipment and cranes;<br />
o Removal of sand and soil down to the depth of the storage tanks;<br />
o construction zone needed for building this type of factory ;<br />
o Removal of trees and shrubs;<br />
o Damage to remaining trees, and tree roots damaged, by construction, including<br />
trenching for underground utilities.<br />
• The EIR should analyze how construction will impact the area outside Golden Gate<br />
Park, including but not limited to:<br />
o The impact of constructing a pipeline below the Great Highway, including but not<br />
limited to;<br />
The safety of the proposed pipeline;<br />
The impact of erosion on the proposed pipeline;<br />
<br />
<br />
The impact of the proposed pipeline on the character of Ocean Beach;<br />
The impact of global warming and project sea-level rising on the<br />
proposed pipeline and the location of the factory;<br />
o The impact of the construction of the project on adjoining residential and<br />
commercial neighborhoods;<br />
o The impact of construction on all parklands that will be receiving water treated in<br />
the proposed plant, including but not limited to Lincoln Park and Golf Course, and<br />
Presidio Golf Course.<br />
• The EIR should study parking and traffic impacts, including but not limited to:<br />
EIR Scoping Request - <strong>San</strong> <strong>Francisco</strong> Westside Recycled Water Treatment Plant - Page 2 of 8<br />
A.2-76
o Impact on traffic in Golden Gate Park;<br />
o Impact on traffic along the Great Highway;<br />
o Impact on bicycle lanes in Golden Gate Park;<br />
o Impact on traffic in the neighborhood surrounding Golden Gate Park;<br />
o Impact on the above traffic and parking issues not only during ordinary weekdays<br />
and weekends, but also during special, heavy-park usage events such as the<br />
Outside Lands Festival, the Bay to Breakers, and all the other events that take<br />
place throughout Golden Gate Park and at Ocean Beach.<br />
• The EIR should study the impacts to wildlife, including but not limited to:<br />
o Loss of meadow, trees, and shrubs;<br />
o Loss of windbreak which protects the rest of Golden Gate Park;<br />
o Loss of tree roots for trees that are to remain;<br />
o Loss of irrigation for trees that are to remain;<br />
o Loss of food sources, such as insects and gophers, for wildlife;<br />
o Increase in paved surfaces;<br />
o Increase in trash and food waste;<br />
o Increase in noise from factory motors, trucks and other equipment<br />
o Increase in truck traffic<br />
o Increase in foot traffic to the visitor center<br />
o Introduction of all of these elements next to a native plant planting area and the<br />
impact on the insect, butterfly and other species that are attracted to the native<br />
plants;<br />
o Introduction of all of these elements along the Pacific Flyway and to the green<br />
corridor that is Golden Gate Park.<br />
• The EIR should study aesthetic impacts and the impacts on the quality of life of<br />
surrounding areas due to the proposed project, including but not limited to:<br />
o Loss of trees and shrubs;<br />
o All impacts due to the release of odoriferous material as a result of the proposed<br />
project;<br />
o All impacts due to noise related by the proposed project;<br />
o All impacts due to artificial lighting related to the proposed project;<br />
o The aesthetic impact on the areas adjoining the proposed plant, including but not<br />
limited to Murphy Windmill and the historic millwright's cottage;<br />
o The impact of the proposed project on a nearby playground near 26 th Avenue;<br />
o Presence of a large, 3-story above-ground facility.<br />
• The EIR should study the loss of parkland use for a wider variety of users, including but<br />
not limited to:<br />
o Loss of the potential for general recreation uses, including but not limited to kite<br />
flying, individual exercise, picnicking, sun-bathing, bird-watching, concerts, dog<br />
exercise, nature walks, enjoyment of darker skies at Ocean Beach, astronomy,<br />
and any sport activity that requires a stake (for example, volleyball, croquet,<br />
footbag/hacky sack with a net.)<br />
• The EIR should study the impact of the project on the aquifer underneath Golden Gate<br />
Park, including but not limited to:<br />
o Depletion of the aquifer;<br />
EIR Scoping Request - <strong>San</strong> <strong>Francisco</strong> Westside Recycled Water Treatment Plant - Page 3 of 8<br />
A.2-77
o Cumulative contamination of the aquifer with inorganic and organic<br />
contaminants, including but not limited to heavy metals, halogens,<br />
pharmaceutical waste, pesticides, hormones, etc.<br />
• The EIR should study the impact of the energy needed to power the plant, including but<br />
not limited to:<br />
o Amount of energy needed to pump water into and out of the water recycling<br />
plant;<br />
o Energy needed to process the water according to various water treatment<br />
standards<br />
• The EIR should study the impact of tertiary treated water from the proposed project on<br />
the environment, including but not limited to the following:<br />
o The impact of exposure to tertiary treated water on the health and viability of<br />
vegetation;<br />
o The impact of exposure to tertiary treated water on humans and all other<br />
vertebrate and invertebrate species.<br />
• The EIR should study and identify contaminants in the water from the proposed plant,<br />
including but not limited to heavy metals, halogens, endocrine disrupters, and<br />
pharmaceuticals; and the impact of any contaminants on the environment, including but<br />
not limited to:<br />
o Contamination of the ground water below Golden Gate Park;<br />
o Contamination of the air;<br />
o Contamination of the ocean;<br />
o Contamination of foliage and grass.<br />
• The EIR should study the economic impact of the project, including but not limited to:<br />
o The impact on the cost of water to consumers;<br />
o The impact on the cost of the project to the taxpayers;<br />
o Consideration of less expensive alternatives to the proposed project.<br />
Alternative locations for the proposed project<br />
• The EIR should explore all other alternative locations that could be used for this project,<br />
including but not limited to:<br />
o Other locations owned by SFPUC, including but not limited to Lake Merced and<br />
Fleishacker Zoo;<br />
o Other locations owned by other City agencies.<br />
• The EIR should explain why each alternative site, if rejected, is not acceptable<br />
Alternative designs for the proposed project<br />
• The EIR should explore alternative designs that preserve the natural meadow and forest<br />
feeling of the area, including but not limited to:<br />
o Construction of a plant that is completely underground;<br />
o Construction of an above-ground factory that has a smaller footprint and is lower in<br />
height than the currently proposed factory.<br />
o Construction of berms surrounding the factory, so that the factory is not visible from<br />
any angles to Park visitors.<br />
EIR Scoping Request - <strong>San</strong> <strong>Francisco</strong> Westside Recycled Water Treatment Plant - Page 4 of 8<br />
A.2-78
Review of documents and agreements relating to the proposed project<br />
• The EIR should explain the relationship of the proposed project to all relevant City<br />
documents and agreements. The individual and cumulative impact of these documents<br />
and agreements on Golden Gate Park and Ocean Beach should be examined and<br />
explored in detail. These documents include but are not limited to:<br />
o The <strong>San</strong> <strong>Francisco</strong> General Plan;<br />
o The Golden Gate Park Master Plan;<br />
o All current and proposed water supply agreements entered into or to be entered<br />
into by the SFPUC;<br />
o All agreements with other <strong>Department</strong>s and Agencies in the City related to the<br />
proposed project, including but limited to all Memoranda of Understanding<br />
between the SFPUC and the SF Recreation and Parks <strong>Department</strong>.<br />
Issues related to other water treatment projects<br />
• The EIR should explain the relationship of the proposed project to all other water<br />
recycling projects in <strong>San</strong> <strong>Francisco</strong> and related areas as well as their impact on Golden<br />
Gate Park, including but not limited to:<br />
o Proposed water treatment projects in <strong>San</strong> <strong>Francisco</strong>;<br />
o Proposed water treatment projects in surrounding communities with which <strong>San</strong><br />
<strong>Francisco</strong> has water supply agreements.<br />
o Proposed use of groundwater from under Golden Gate Park.<br />
Safety of all aspects of the proposed project<br />
• The EIR should explore all environmental safety issues related to the proposed plant,<br />
including but not limited to:<br />
o Contamination of ground water by secondary or tertiary treated water;<br />
o Contamination of secondary treated water by raw sewage while the secondary<br />
treated water is traveling in pipes from its origin at the Oceanside water treatment<br />
plant to the proposed plant in Golden Gate Park;<br />
o The risk of damage to the project by earthquakes, tsunamis, and other natural<br />
disasters;<br />
o The risk of damage to the project by terrorists, industrial accidents and other<br />
man-made disasters.<br />
Issues related to the use of membrane filtration and reverse osmosis in the proposed project<br />
• The EIR should explore all issues related to the use of membrane filtration and reverse<br />
osmosis in the proposed plant, including but not limited to:<br />
o The removal of waste material resulting from the membrane filtration process;<br />
o The removal of a reverse osmosis concentrate, which is a concentrated brine<br />
solution containing contaminants including, but not limited to, bacteria, viruses,<br />
organic particles (pesticides), and inorganic particles (heavy metals);<br />
o The impact of dumping the reverse osmosis concentrate into the ocean.<br />
EIR Scoping Request - <strong>San</strong> <strong>Francisco</strong> Westside Recycled Water Treatment Plant - Page 5 of 8<br />
A.2-79
Customer Retrofits<br />
• The EIR should explore all retrofits required to bring the systems to be used in the<br />
project into compliance with all local, State and Federal regulations, including but not<br />
limited to:<br />
o Compliance with California <strong>Department</strong> of Public Health Services Title 22 and<br />
Title 17 requirements, regulating the production and use of recycled water;<br />
o The installation of limited sections of pipeline, the installation of backflow<br />
preventers, and the replacement of noncompliant irrigation system components.<br />
Future Expansion of the Project<br />
• The EIR should explore the possibility of future expansion of the factory at the Golden<br />
Gate Park location and the impact on all of the issues included in this document.<br />
Issues related to additional and/or adjacent projects, including both the existing and proposed<br />
renovated athletic fields adjoining the proposed project<br />
• The EIR should discuss how the proposed water recycling plant is related to additional<br />
and related projects being considered by the SF PUC, including but not limited to:<br />
o Removal of water from the aquifer under Golden Gate Park;<br />
o Purification of the water from the aquifer under Golden Gate Park;<br />
o Transport of the water from the aquifer under Golden Gate Park to reservoirs<br />
o Safety of combining water from the aquifer under Golden Gate Park with the<br />
current drinking water provided to <strong>San</strong> <strong>Francisco</strong>;<br />
o Construction of additional water recycling plants elsewhere in <strong>San</strong> <strong>Francisco</strong>.<br />
• The EIR should study the cumulative impact of the existing and proposed athletic/soccer<br />
field adjoining the project, including but not limited to:<br />
o Toxic and safety impacts on the underlying aquifer relating to artificial turf and its<br />
infill, including but not limited to heavy metals, volatile organic compounds,<br />
carcinogens, asthma triggers, bacterial growth and infection risk (including<br />
MRSA).<br />
o Cumulative impact on historic and aesthetic character of Golden Gate Park and<br />
Ocean Beach.<br />
o Cumulative effect of increased lighting, paving, traffic and all other issues<br />
considered in both this document and in the attached document for the Beach<br />
Chalet Athletic Field renovation EIR.<br />
Water conservation alternatives<br />
• The EIR should discuss water conservation alternatives to the proposed project,<br />
including but not limited to:<br />
o Use of desalinated water;<br />
o Use of water in wells in Golden Gate Park and other areas to be served by the<br />
proposed project;<br />
o Collaboration with other agencies, including but not limited to Bay Area Water<br />
Users Association, for construction of a water recycling plant outside of <strong>San</strong><br />
<strong>Francisco</strong><br />
o Retrofitting of Recreation and Park piping and other irrigation fixtures to achieve<br />
water savings;<br />
EIR Scoping Request - <strong>San</strong> <strong>Francisco</strong> Westside Recycled Water Treatment Plant - Page 6 of 8<br />
A.2-80
o Use of permeable paving and permeable pavers throughout <strong>San</strong> <strong>Francisco</strong> parks<br />
to promote replenishment of the aquifer<br />
o Removable of additional paving in golden Gate Park to promote replenishment of<br />
the aquifer<br />
o Use of tertiary water in all buildings in all Parks in <strong>San</strong> <strong>Francisco</strong>, including the<br />
major institutions in Golden Gate Park.<br />
Beach Chalet Soccer Field Scoping letter<br />
In addition to the foregoing, also attached is a letter dated September 25 th , 2010 addressing<br />
scoping issues of Beach Chalet Soccer Fields proposed for construction in Golden Gate Park.<br />
All requests for consideration in that letter are hereby incorporated by reference.<br />
CONCLUSION:<br />
We are looking forward to the inclusion of the above issues and other related issues in the EIR,<br />
so that the resulting project can be the most beneficial for preserving the beauty and historic<br />
context of Golden Gate Park, as well as providing safe drinking water and irrigation water for<br />
<strong>San</strong> <strong>Francisco</strong>.<br />
In addition, we remain very interested in the steps that will be taken in the development of the<br />
EIR and the pursuit of this project. We request that the <strong>Department</strong> notify us and the people<br />
copied on this letter about the <strong>Department</strong>'s plans at this time and throughout the EIR process.<br />
Thank you for your consideration.<br />
Sincerely,<br />
Katherine Howard, Co-Chair<br />
Golden Gate Park Preservation Alliance<br />
cc:<br />
Carrie Dovzak,the CEQA coordinator, <strong>San</strong> <strong>Francisco</strong> <strong>Planning</strong> <strong>Department</strong><br />
Mark Buell, President, Recreation and Park Commission<br />
Margaret McArthur, Secretary, Recreation and Park Commission<br />
Dan Mauer, Project Manager, Recreation and Park <strong>Department</strong><br />
Parks and Recreation Open Space Committee, <strong>San</strong> <strong>Francisco</strong> (PROSAC)<br />
Mayor Gavin Newsom<br />
Clerk of the Board of Supervisors<br />
David Chiu, President, <strong>San</strong> <strong>Francisco</strong> Board of Supervisors, District 3<br />
Ross Mirkarimi, <strong>San</strong> <strong>Francisco</strong> Board of Supervisors, District 5<br />
Eric Mar, <strong>San</strong> <strong>Francisco</strong> Board of Supervisors, District 1<br />
Michela Alioto-Pier, <strong>San</strong> <strong>Francisco</strong> Board of Supervisors, District 2<br />
John Avalos, <strong>San</strong> <strong>Francisco</strong> Board of Supervisors, District 11<br />
David Campos, <strong>San</strong> <strong>Francisco</strong> Board of Supervisors, District 9<br />
Carmen Chu, <strong>San</strong> <strong>Francisco</strong> Board of Supervisors, District 4<br />
Chris Daly, <strong>San</strong> <strong>Francisco</strong> Board of Supervisors, District 6<br />
Bevan Dufty, <strong>San</strong> <strong>Francisco</strong> Board of Supervisors, District 8<br />
EIR Scoping Request - <strong>San</strong> <strong>Francisco</strong> Westside Recycled Water Treatment Plant - Page 7 of 8<br />
A.2-81
Sean Elsbernd, <strong>San</strong> <strong>Francisco</strong> Board of Supervisors, District 7<br />
Sophie Maxwell, <strong>San</strong> <strong>Francisco</strong> Board of Supervisors, District 10<br />
Arthur Feinstein, Sierra Club<br />
Dr. Eliot Katz, In Defense of Animals<br />
John Rizzo, Sierra Club<br />
Michael Lynes, Golden Gate Audubon Society<br />
Noreen Weeden, Golden Gate Audubon Society<br />
Peter Brastow, Nature in the City<br />
Roy C. Leggitt, III, Consulting Arborist<br />
Amy Westervelt Managing Editor, Earth Island Journal<br />
California Academy of Sciences<br />
California Communities Against Toxics<br />
Caroline Cox, Research Director, Center for Environmental Health<br />
Dave Phillips Executive Director, Earth Island Institute<br />
Deb Self, Executive Director <strong>San</strong> <strong>Francisco</strong> Baykeeper<br />
Greenaction for Health and Environmental Justice<br />
<strong>San</strong> <strong>Francisco</strong> Foundation<br />
<strong>San</strong> <strong>Francisco</strong> Green Party<br />
Save the Bay<br />
Surfrider Foundation, <strong>San</strong> <strong>Francisco</strong> Chapter<br />
Melanie Macchio, The Cultural Landscape Foundation<br />
Jennifer Gates, California Preservation Foundation<br />
Mike Buhler, <strong>San</strong> <strong>Francisco</strong> Architectural Heritage<br />
Alexandra Bevk, <strong>San</strong> <strong>Francisco</strong> Architectural Heritage<br />
Charles Chase, SF Historic Preservation Commission<br />
Janet Gracyk, Historic American Landscape Survey (HALS)<br />
Jim Chappell, <strong>San</strong> <strong>Francisco</strong> Beautiful<br />
Sheila Kolenc, <strong>San</strong> <strong>Francisco</strong> Beautiful<br />
Susan Brandt-Hawley, Preservation Lawyers<br />
Carolyn Blair, <strong>San</strong> <strong>Francisco</strong> Tree Council<br />
David Eldred, Keep the Arboretum Free<br />
David Goggin, <strong>San</strong> Franciscans for Smart Lighting<br />
George Wooding, West of Twin Peaks Central Council (WTPCC)<br />
Gerry Crowley, Telegraph Hill Dwellers<br />
John Frykman, Coalition to Save Ocean Beach, Friends of Sutro Park<br />
Judy Berkowitz, Coalition for <strong>San</strong> <strong>Francisco</strong> Neighborhoods (CSFN)<br />
Judy Irving, Telegraph Hill Dwellers<br />
Julie Burns, Friends of Lands End<br />
Kelley Watts, <strong>Francisco</strong> Heights Civic Association<br />
Libby Benedict, Friends of Rossi Park<br />
Marc Duffett, Sunset Parkside Education and Action Committee (SPEAK)<br />
Mary Anne Miller, <strong>San</strong> <strong>Francisco</strong> Tomorrow<br />
Nancy Wuerfel, Golden Gate Park Preservation Alliance<br />
Ray Holland, <strong>Planning</strong> Association for the Richmond (PAR)<br />
Suzanne Dumont, Save the Stowe Lake Boathouse Coalition<br />
EIR Scoping Request - <strong>San</strong> <strong>Francisco</strong> Westside Recycled Water Treatment Plant - Page 8 of 8<br />
A.2-82
Where Golden Gate Park meets Ocean Beach . . .<br />
www.sfoceanedge.org<br />
March 3, 2011<br />
Mr. Bill Wycko<br />
<strong>San</strong> <strong>Francisco</strong> <strong>Planning</strong> <strong>Department</strong><br />
1650 Mission Street, Suite 400<br />
<strong>San</strong> <strong>Francisco</strong>, CA 94103<br />
Subject: Case No. 2010.0016E<br />
Beach Chalet Athletic Fields Renovation<br />
Dear Mr. Wycko:<br />
SUMMARY:<br />
The following are issues which must be thoroughly explored in an EIR, including but not limited to:<br />
− A range of alternative construction methods for renovation of the Beach Chalet athletic fields<br />
(herein referred to as " the project"), with natural, living grass;<br />
− A range of alternative designs to provide some amenities at Beach Chalet without losing the<br />
parkland character of the meadow and surrounding forest;<br />
− A range of alternative locations outside of Golden Gate Park for the artificial turf athletic fields, for<br />
the purposes of increasing play time;<br />
− Documentation of the site, using the National Park Service, HALS (Historic American Landscape<br />
Survey) methodology, and documenting at a Level I status, for significant American Landscapes.<br />
DETAILS:<br />
The potential impacts of the proposed project<br />
• The EIR must discuss the ways in which the project described by RPD has a substantial adverse<br />
impact on the historic integrity of Golden Gate Park. The National Register of Historic Places<br />
lists the characteristics of the Park as pastoral, with recreation areas that blend into that setting.<br />
The EIR must discuss the ways in which the proposed project may negatively change this area<br />
because, among other things, the project:<br />
o Has a non-pastoral design;<br />
o Changes the space from an irregular meadow-like outline to a rectilinear space;<br />
o Has lighting where there is no lighting at this time;<br />
o Introduces sports complex lighting to a pastoral space;<br />
o Adds paving where there is no paving at this time;<br />
o Removes trees and shrubs from a pastoral space;<br />
o Removes trees that provide a windbreak, which protects the rest of Golden Gate Park;<br />
o Replaces natural (living) grass with artificial turf;<br />
o Changes the views into and out of the area;<br />
o Removes current links to adjacent landmarks;<br />
Beach Chalet Athletic Field Renovation - EIR Scoping Letter - March 3, 2011 -- SF Ocean Edge Page 1 of 8<br />
A.2-83
o Adds a concession area, new play equipment, and more paving for this area;<br />
o Adds more paving for more parking<br />
o Introduces more cars to parkland;<br />
o Changes the space from a multi-use space to a limited sport-specific use area.<br />
• The EIR must analyze how construction will impact the parkland, including but not limited to:<br />
o The use of earth-moving equipment and cranes;<br />
o Removal of two feet or more of topsoil for the artificial turf ;<br />
o The sports lights excavation to 10 feet or more and installation of supports for the lights;<br />
o Trees and shrubs removal;<br />
o Damage to remaining trees, and tree roots damaged, by construction, including trenching<br />
for underground utilities.<br />
• Parking and traffic impacts to be studied in the EIR must include but are not limited to:<br />
o Impact on the parking at Ocean Beach;<br />
o impact on traffic in Golden Gate Park;<br />
o Impact on traffic along the Great Highway;<br />
o Impact on bicycle lanes in Golden Gate Park;<br />
o Impact on traffic in the neighborhood surrounding Golden Gate Park;<br />
o Impact on the above traffic and parking issues not only during ordinary weekdays and<br />
weekends, but also during special, heavy-park usage events such as the Outside Lands<br />
Festival, the Bay to Breakers, and all the other events that take place throughout Golden<br />
Gate Park and at Ocean Beach, at various times of the year<br />
• Impacts to wildlife to be studied in the EIR must include but are not limited to:<br />
o Use of artificial turf;<br />
o Loss of meadow, trees, and shrubs;<br />
o Loss of windbreak which protects the rest of Golden Gate Park;<br />
o Loss of tree roots for trees that are to remain;<br />
o Loss of irrigation for trees that are to remain;<br />
o Loss of food sources, such as insects and gophers, for wildlife;<br />
o Increase in paved surfaces;<br />
o Increase in trash and food waste;<br />
o Introduction of night lighting to an area that is currently not lighted;<br />
o Introduction of intensely bright sports night lighting in an area that is currently not lighted;<br />
o Introduction of all of these elements next to a native plant planting area and the impact on<br />
the insect, butterfly and other species that are attracted to the native plants;<br />
o Introduction of all of these elements along the Pacific Flyway and to the green corridor that<br />
is Golden Gate Park.<br />
• Aesthetic impacts to be studied in the EIR must include but are not limited to:<br />
o Use of artificial turf<br />
o Loss of meadows, trees and shrubs;<br />
o Loss of screening of views into the construction area to the south of the field;<br />
o Loss of screening of the area from the surrounding roads;<br />
o Direct and reflected night lighting affecting the Dark Sky;<br />
o Direct and reflected night lighting affecting the evening sunset and beach experience at<br />
Ocean Beach, the Great Highway Parking lot, Sutro Heights, and the Cliff House area.<br />
Beach Chalet Athletic Field Renovation - EIR Scoping Letter - March 3, 2011 -- SF Ocean Edge Page 2 of 8<br />
A.2-84
• Water usage to be studied in the EIR must include but is not limited to:<br />
o Quantity of water needed for cleaning the artificial turf and frequency of application;<br />
o Type and chemical make-up of cleansing solutions for the artificial turf;<br />
o Impact of increase in sending cleansing solutions and water to the sewer system;<br />
o Impact of sending rainwater to the sewer system for processing, include amount of water<br />
and increase in need to process at sewage treatment plant;<br />
o Impact of preventing rainwater from percolating into the aquifer.<br />
• Artificial turf impacts to be studied in the EIR must include but are not limited to:<br />
o Impact of the eventual removal , replacement and disposal of the artificial turf, when it<br />
reaches the end of its lifespan; the EIR should consider the impact of several cycles of such<br />
replacement;<br />
o All toxic and safety impacts relating to artificial turf and its infill, including but not limited to<br />
heavy metals, volatile organic compounds, carcinogens, asthma triggers, increased risk of<br />
injury, bacterial growth and infection risk (including MRSA);<br />
o Since the selection of artificial turf manufacturer is not known at this time, an evaluation of<br />
all of the artificial turf products on the market at this time.<br />
o The migration of infill material from the site by wind, leaching, sewer overflow , and through<br />
shoes and clothing.<br />
o The identification of any components of artificial turf that are listed as carcinogenic and/or<br />
endocrine disrupters under Proposition 65;<br />
o The need for additional “infill” below the artificial turf;<br />
o Cooling with water because of unacceptable high temperatures;<br />
o The impact of chemical treatment to disinfect;<br />
o The need for an adequate drainage system;<br />
o The use of fabric softener to reduce static cling;<br />
o The impact of elevated temperatures on artificial turf;<br />
o The impact of breakdown of materials used in artificial turf;<br />
o The need to periodically replace infill, including amounts needed and frequency of<br />
replacement.<br />
• Climate change impacts to be studied in the EIR must include but are not limited to:<br />
o Artificial turf installation;<br />
o Urban heat island effect;<br />
o Loss of natural grass, plants and trees.<br />
• Loss of park use for a wider variety of users must be studied in the EIR, including but not limited to:<br />
o Reduction of general recreation uses, including but not limited to kite flying, individual<br />
exercise, picnicking, sun-bathing, bird-watching, concerts, dog exercise, nature walks,<br />
enjoyment of darker skies at Ocean Beach, astronomy, and any sport activity that requires a<br />
stake (for example, volleyball, croquet, footbag/hacky sack with a net.)<br />
• Inconsistencies with City planning documents must be studied in the EIR, including but not limited<br />
to:<br />
o The <strong>San</strong> <strong>Francisco</strong> General Plan<br />
o The Golden Gate Park Master Plan<br />
Beach Chalet Athletic Field Renovation - EIR Scoping Letter - March 3, 2011 -- SF Ocean Edge Page 3 of 8<br />
A.2-85
Alternative construction methods for natural grass playing fields<br />
• Alternative field construction methods.<br />
o The EIR must explore various types of field construction that will result in a safe,<br />
consistent, long-wearing, natural-grass playing surface. The EIR must study other fields<br />
that are successful and propose new methods of field construction and maintenance,<br />
including but not limited to:<br />
Investigation of state of the art natural grass playing fields throughout the US and<br />
internationally;<br />
Investigation of state of the art drainage systems ;<br />
Soil improvement methods to ameliorate compaction and promote root growth;<br />
Introduction of synthetic fibers into the soil to promote strong grass roots, decrease<br />
maintenance, and improve playing time;<br />
Investigation of lawn grass species that use less water and are suited to a park-like<br />
setting;<br />
Investigation of water-efficient irrigation systems ;<br />
The impact of utilizing the forthcoming PUC recycled water project for Golden Gate<br />
Park to irrigate natural grass;<br />
Investigation of subsurface water –storage systems for irrigation purposes;<br />
<br />
<br />
Alternative designs for the project<br />
Investigation of efficient maintenance methods;<br />
Gopher control methods, including but not limited to:<br />
Increase in the habitat for gopher predator species, such as the Great Blue<br />
Heron or the red-tailed hawk, currently seen hunting at the fields;<br />
Gaps in the fencing to allow access by coyotes and other wingless predators;<br />
Gopher barriers buried in the ground, including but not limited to chicken wire,<br />
concrete, rock, gravel, or other barriers;<br />
Gopher repellent added to the irrigation system;<br />
Gopher trapping – both by staff and contracted out.<br />
• The EIR must explore alternative designs that preserve the natural meadow and forest feeling of<br />
the area, including but not limited to:<br />
o Investigation of minimal low-level lighting for the parking lot that is keyed to motion<br />
activated sensors that people, not animals, can trigger;<br />
o Investigation of designs that can create seating areas that are not bleachers, can be used for<br />
games, and look like natural parkland when sports or other organized activities are not<br />
being engaged in;<br />
o Elimination of the rectilinear sidewalk that surrounds the field and other elements that<br />
destroy the park-like feeling for the area;<br />
o Investigation of more effective public transport to the fields, such as bringing a bus line into<br />
the park or providing a bus stop on the Great Highway, to avoid expansion of the parking<br />
lot;<br />
o Restriping of the parking lot for efficient traffic flow without expanding the lot;<br />
o Planting of trees in the parking lot to further disguise its purpose;<br />
o Using grass in the parking lot to promote a park-like atmosphere, for example in grasspavers<br />
or using fibers mixed into the soil to promote soil strength;<br />
Beach Chalet Athletic Field Renovation - EIR Scoping Letter - March 3, 2011 -- SF Ocean Edge Page 4 of 8<br />
A.2-86
o Evaluating the major events that will take place along the Great Highway and Golden Gate<br />
Park and the impact on traffic in Golden Gate Park and the availability of parking for the<br />
project and for these events, if the fields are developed.<br />
Alternative field locations<br />
• The EIR must explore other locations that can be improved for longer play times, including but<br />
not limited to:<br />
o Fields in <strong>San</strong> <strong>Francisco</strong> that are currently natural grass and could be renovated with artificial<br />
turf; specifically, West Sunset, Balboa Park, including Boxer Stadium, and Minnie and Lovie<br />
Ward Recreation fields. The EIR must explore the increase in play hours that would be<br />
provided by these fields.<br />
o The EIR must analyze the potential increase in play hours that would be provided by a<br />
combination of renovating one of the above fields with artificial turf and renovating the<br />
Golden Gate Park Beach Chalet fields with natural, living grass, with state of the art<br />
construction including but not limited to improved drainage, soil amendment, gopher<br />
barriers, and species of grass.<br />
o Fields associated with schools, resulting in the dual benefit of improving school field use and<br />
locating fields near where children are already present;<br />
o Public property that could be developed as fields; for example, newly acquired property,<br />
property that must be targeted for appropriation, tops of parking garages, new<br />
redevelopment areas, sections of larger parks such as Sharp Park, unused streets, or empty<br />
lots in various areas of <strong>San</strong> <strong>Francisco</strong>.<br />
Cumulative Impacts with Westside Water Treatment Plant<br />
• The SFPUC is planning to build a Westside Water Treatment Plant in western <strong>San</strong> <strong>Francisco</strong>. The<br />
SFPUC preferred location is the area immediately adjacent to the Beach Chalet Soccer Fields in<br />
Golden Gate Park. Therefore, the EIR for the Beach Chalet Athletic fields must explore the<br />
cumulative impacts that both of these projects will have on Golden Gate Park and on this area,<br />
for all of the categories of analysis that are detailed in this letter, including but not limited to:<br />
o Impact on parkland<br />
o Impacts on traffic<br />
o impacts to wildlife<br />
o Impacts on traffic<br />
o Impacts of construction on parkland<br />
o Impacts of water usage<br />
o Impacts of artificial turf in conjunction with the new irrigation and the use of water from<br />
under Golden Gate Park for drinking water<br />
o Impacts on climate change<br />
o Loss of additional acreage to recreational uses<br />
o Impact of reduction of general recreation uses for this section of Golden Gate Park<br />
o Inconsistencies with the City <strong>Planning</strong> Documents<br />
o Possible us of the open area in the current construction yard for an additional practice field,<br />
yielding more playing hours<br />
Beach Chalet Athletic Field Renovation - EIR Scoping Letter - March 3, 2011 -- SF Ocean Edge Page 5 of 8<br />
A.2-87
Cumulative impacts with Ocean Beach Master Plan of both the Beach Chalet Athletic Tields project and<br />
the combined Beach Chalet project and the Westside Water Treatment Plant:<br />
• Currently, the city is undertaking an analysis of the uses and preservation of Ocean Beach and<br />
will be creating a new Master Plan for this area. The EIR for the Beach Chalet Athletic fields<br />
must explore the cumulative impacts that the Athletic fields project could have on these plans<br />
including but not limited to:<br />
o Proposals in the current Ocean Beach Master <strong>Planning</strong> process to connect golden Gate Park<br />
with the Ocean through elimination or undergrounding of the Great Highway<br />
o Proposals in the current Ocean Beach Master <strong>Planning</strong> process to make beach restoration<br />
and environmental conservation major tenets of that process;<br />
o Proposals in the current Ocean Beach Master <strong>Planning</strong> process to increase habitat at Ocean<br />
Beach with the possibility of attracting endangered species to that area.<br />
o Impact on parkland<br />
o Impacts on traffic of bringing more people out to Ocean Beach<br />
o impacts to wildlife of the<br />
o Impacts on traffic<br />
o Impacts of construction on neighboring Ocean Beach<br />
o Impacts of water usage<br />
o Impacts of artificial turf in conjunction with the new irrigation and the use of water from<br />
under Golden Gate Park for drinking water<br />
o Impacts on climate change<br />
o Loss of additional acreage to recreational uses<br />
o Impact of reduction of general recreation uses for this section of Golden Gate Park<br />
o Inconsistencies with the City <strong>Planning</strong> Documents<br />
NPS HALS Documentation - Level I<br />
CONCLUSION:<br />
• The Historic American Landscapes Survey (HALS) mission is to record historic landscapes in<br />
the United States and its territories through measured drawings and interpretive drawings,<br />
written histories, and large-format black and white photographs and color photographs. The<br />
National Park Service oversees the daily operation of HALS and formulates policies, sets<br />
standards, and drafts procedural guidelines in consultation with the American Society of<br />
Landscape Architects (ASLA). The ASLA provides professional guidance and technical advice<br />
through their Historic Preservation Professional Practice Network. The Prints & Photographs<br />
Division of the Library of Congress preserves the documentation for posterity and makes it<br />
available to the general public.<br />
• The EIR must include a full documentation of the site, using the National Park Service, HALS<br />
(Historic American Landscape Survey) methodology, and documenting at a Level I status, for<br />
significant American Landscapes.<br />
• This documentation must in no way be construed to replace preservation of the historic<br />
context and value of the site.<br />
We are looking forward to the inclusion in the EIR of the above issues and other related issues discussed<br />
by the public since the beginning of the public input into this project, so that the resulting project can<br />
Beach Chalet Athletic Field Renovation - EIR Scoping Letter - March 3, 2011 -- SF Ocean Edge Page 6 of 8<br />
A.2-88
e the most beneficial for preserving the beauty and historic context of Golden Gate Park, as well as<br />
providing a safe playing field for the City’s children.<br />
We request that the <strong>Department</strong> notify us and the people copied on this letter about the <strong>Department</strong>'s<br />
plans at this time and with full documentation throughout the EIR process.<br />
Thank you for your consideration.<br />
Sincerely,<br />
Katherine Howard<br />
Member, Steering Committee<br />
SF Ocean Edge<br />
cc:<br />
Mayor Ed Lee<br />
Clerk of the Board of Supervisors<br />
Each member of the <strong>San</strong> <strong>Francisco</strong> Board of Supervisors<br />
Michael Lynes, Golden Gate Audubon Society<br />
Noreen Weeden, Golden Gate Audubon Society<br />
John Rizzo, Sierra Club<br />
Arthur Feinstein, Sierra Club<br />
Peter Brastow, Nature in the City<br />
Dr. Eliot Katz, In Defense of Animals<br />
Roy C. Leggitt, III, Consulting Arborist<br />
Save the Bay<br />
California Academy of Science<br />
Caroline Cox, Research Director, Center for Environmental Health<br />
Greenaction for Health and Environmental Justice<br />
California Communities Against Toxics<br />
The <strong>San</strong> <strong>Francisco</strong> Foundation<br />
<strong>San</strong> <strong>Francisco</strong> Green Party<br />
Surfrider Foundation, <strong>San</strong> <strong>Francisco</strong> Chapter<br />
<strong>San</strong> <strong>Francisco</strong> Baykeeper<br />
Earth Island Institute<br />
Earth Island Journal<br />
Charles Chase, SF Historic Preservation Commission<br />
Janet Gracyk, Historic American Landscape Survey (HALS)<br />
Jennifer Gates, California Preservation Foundation<br />
Alexandra Bevk, <strong>San</strong> <strong>Francisco</strong> Architectural Heritage<br />
Melanie Macchio, The Cultural Landscape Foundation<br />
Jim Chappell, <strong>San</strong> <strong>Francisco</strong> Beautiful<br />
Susan Brandt-Hawley, Preservation Lawyers<br />
Beach Chalet Athletic Field Renovation - EIR Scoping Letter - March 3, 2011 -- SF Ocean Edge Page 7 of 8<br />
A.2-89
Mary Anne Miller, <strong>San</strong> <strong>Francisco</strong> Tomorrow<br />
Marc Duffett, Sunset Parkside Education and Action Committee (SPEAK)<br />
Judy Berkowitz, Coalition for <strong>San</strong> <strong>Francisco</strong> Neighborhoods (CSFN)<br />
George Wooding, West of Twin Peaks Central Council (WTPCC)<br />
David Goggin, <strong>San</strong> Franciscans for Smart Lighting<br />
Ray Holland, <strong>Planning</strong> Association for the Richmond (PAR)<br />
John Frykman, Coalition to Save Ocean Beach, Friends of Sutro Park<br />
David Eldred, Keep the Arboretum Free<br />
Suzanne Dumont, Save the Stowe Lake Boathouse Coalition<br />
Julie Burns, Friends of Lands End<br />
Carolyn Blair, <strong>San</strong> <strong>Francisco</strong> Tree Council<br />
Gerry Crowley, Telegraph Hill Dwellers<br />
Judy Irving, Telegraph Hill Dwellers<br />
Libby Benedict, Friends of Rossi Park<br />
Kelley Watts, <strong>Francisco</strong> Heights Civic Association<br />
Nancy Wuerfel, Golden Gate Park Preservation Alliance<br />
Mark Buell, President, Recreation and Park Commission<br />
Margaret McArthur, Secretary, Recreation and Park Commission<br />
Dan Mauer, Project Manager, Recreation and Park <strong>Department</strong><br />
Parks and Recreation Open Space Committee, <strong>San</strong> <strong>Francisco</strong> (PROSAC)<br />
Don Lewis, MEA, <strong>San</strong> <strong>Francisco</strong> <strong>Planning</strong> <strong>Department</strong><br />
City Fields Foundation<br />
Beach Chalet Athletic Field Renovation - EIR Scoping Letter - March 3, 2011 -- SF Ocean Edge Page 8 of 8<br />
A.2-90
Dale Gutierrez to Sup Carmen Chu 2001-03-09<br />
Diana Sokolove/CTYPLN/SFGOV<br />
04/01/2011 12:27 PM<br />
To: Timothy J Johnston/CTYPLN/SFGOV@SFGOV<br />
cc:<br />
bcc:<br />
Subject: Fw: <strong>San</strong> <strong>Francisco</strong> Groundwater Supply Project<br />
----- Forwarded by Diana Sokolove/CTYPLN/SFGOV on 04/01/2011 12:29<br />
PM -----<br />
"Liapes, Michele" <br />
04/01/2011 11:59 AM<br />
To: <br />
cc: "Chu, Carmen" , "Harrington, Ed"<br />
, "Ritchie, Steve" ,<br />
"Kehoe, Paula" , "Sokolove, Diana"<br />
, "Gilman, Jeff" <br />
Subject: <strong>San</strong> <strong>Francisco</strong> Groundwater Supply Project<br />
Dear Mr. Gutierrez,<br />
We have received your email message of March 25, 2011 to Supervisor Carmen<br />
Chu, which Supervisor Chu forwarded to us for a response.<br />
We understand that you have spoken with Diana Sokolove of the <strong>San</strong><br />
<strong>Francisco</strong> <strong>Planning</strong> <strong>Department</strong> about the environmental aspects of the<br />
proposed <strong>San</strong> <strong>Francisco</strong> Groundwater Supply Project. As Diana likely<br />
explained, the Draft Environmental Impact Report for the <strong>San</strong> <strong>Francisco</strong><br />
Groundwater Supply Project is scheduled to be published in early 2012.<br />
The <strong>Planning</strong> <strong>Department</strong> will notify you when that document is published.<br />
You will have an opportunity to review and comment on the Draft<br />
Environmental Impact Report at that time.<br />
Groundwater from the proposed project would be pumped from the Westside<br />
Groundwater Basin aquifer, which extends from Golden Gate Park southward<br />
through <strong>San</strong> Bruno. As you may already know, groundwater makes up all or<br />
part of the drinking water supply for many communities throughout<br />
California, and provides approximately 40% of the State’s drinking water.<br />
The cities of Daly City, South <strong>San</strong> <strong>Francisco</strong> and <strong>San</strong> Bruno have utilized<br />
groundwater from the Westside Basin aquifer for more than 50 years.<br />
Blending of the extracted groundwater with imported surface water would be<br />
in quantities small enough to ensure the continued high quality and taste<br />
of <strong>San</strong> <strong>Francisco</strong>’s drinking water. The groundwater would be treated as<br />
necessary to comply with California <strong>Department</strong> of Public Health<br />
requirements before entering the municipal water system for distribution<br />
to areas throughout the City.<br />
Your email also mentioned that the cost of treated groundwater would be<br />
ten times as expensive as Hetch Hetchy water. However, the cost of<br />
treated groundwater supplied by the <strong>San</strong> <strong>Francisco</strong> Groundwater Supply<br />
Project would be less than the imported retail cost of water in 2018 (the<br />
time horizon for our financial planning).<br />
Thank you for taking the time to express your concerns regarding the<br />
proposed <strong>San</strong> <strong>Francisco</strong> Groundwater Supply Project.<br />
Sincerely yours,<br />
Page 1<br />
A.2-91
Michele Liapes, Community Liaison<br />
Dale Gutierrez to Sup Carmen Chu 2001-03-09<br />
P Please consider the environment before printing this email.<br />
Michele Liapes<br />
SFPUC Communications and Public Outreach<br />
1155 Market Street, 11th Floor<br />
<strong>San</strong> <strong>Francisco</strong>, CA 94103<br />
415-554-3211<br />
From:<br />
To:<br />
Date:<br />
Subject:<br />
Dale G <br />
Carmen Chu <br />
03/25/2011 09:19 PM<br />
Resend Re: Groundwater Supply<br />
On Wed, Mar 9, 2011 at 9:49 AM, Dale G wrote:<br />
Hi, Carmen.<br />
Just got a notice from the <strong>Planning</strong> Commission about a massive project<br />
that was in the works<br />
many years ago. Much of this work entails water well facilities and<br />
delivery systems that are to be<br />
constructed under our Sunset District 4 streets. I'm just catching on now.<br />
Though there are<br />
many abbreviations and acronyms, I"m seeing SFPUC, BAWSA, WSIP, MSWA, bla,<br />
bla...<br />
While I understand the need for a reliable, scaleable, diversified water<br />
supply and delivery system,<br />
as still must opine:<br />
I'm opposed to blending our higher-quality, gravity-delivery Hetch Hetchy<br />
water, with treated<br />
groundwater that is ten times as expensive as HH water, and will result in<br />
the doubling of SF's<br />
users' bills -- one tenth our water will be treated groundwater that costs<br />
ten times as much as<br />
HH water.<br />
Since funding mechanism management and governance has long ago (2002<br />
California legislation) been lost,<br />
and this is already in the stages of final EIR, what can I as citizen do<br />
to oppose this? Can I protest through<br />
you, in any way? Or can you log my vote on this matter? I think the<br />
environmental and financial costs<br />
are enormous. You already know what I think about what's underground at<br />
the South East corridor --<br />
radionuclides.<br />
I sincerely hope you are well.<br />
Thanks,<br />
Dale<br />
Dale Gutierrez<br />
Page 2<br />
A.2-92
Dale G <br />
Dale Gutierrez 2011-03-31<br />
03/31/2011 01:14 PM<br />
To: diana.sokolove@sfgov.org<br />
cc: timothy.johnston@sfgov.org, EHarrington@sfwater.org, cityattorney@sfgov.org,<br />
board.of.supervisors@sfgov.org<br />
bcc:<br />
Subject: <strong>San</strong> <strong>Francisco</strong> Groundwater Supply Project outreach<br />
Diana Sokolove<br />
Senior Environmental Planner<br />
<strong>San</strong> <strong>Francisco</strong> <strong>Planning</strong> <strong>Department</strong><br />
Major Environmental Analysis Division<br />
1650 Mission Street, Suite 400<br />
<strong>San</strong> <strong>Francisco</strong>, CA 94103-2479<br />
Thursday 31 Mar 2011<br />
Diana.<br />
It was a pleasure to chat with you today.<br />
I spoke to you on the phone about 12:15 pm today. I called to voice my<br />
opposition to the SF Groundwater Supply project because of the blending of<br />
Hetch Hetchy water with lower-quality, expensive, treated water from the<br />
SF Ground Supply Project, based on concerns for public health and safety;<br />
taste and odor of the treated water; its possible toxic, chemical, mineral<br />
content, and other non-environmental concerns. That would include a desire<br />
to review some of the economics, regulation, statistics and databases,<br />
policy-making, social impact, and politics surrounding this project. I'll<br />
be taking a closer look at this in the context of the possible reliability<br />
and redundancy that is advertised with the project. I'll be talking to an<br />
economist friend<br />
to get his sense.<br />
You also told me that we had not reached the Public Comment phase, and<br />
I could directly voice concerns to the SF Water Dept.<br />
Thanks for your patience, cooperation, and valuable time,<br />
Dale Gutierrez family<br />
D4 Residents & SF Water Dept ratepayer (2 buildings)<br />
Page 1<br />
A.2-93
Steve Lawrence 2011-03-03<br />
Steven Lawrence <br />
03/03/2011 09:40 AM<br />
To Timothy.Johnston@sfgov.org<br />
cc<br />
bcc<br />
Subject: SF Groundwater Supply<br />
Please accept these comments to the revised proposed project, SF<br />
Groundwater Supply, WSIP.<br />
Is the project too ambitious? Is there enough water? Recent minutes of an<br />
advisory committee for a Groundwater Management Plan concluded that the<br />
Southwestside basin contains 8700 acre feet per year yield. The whole<br />
Westside Basin contains 10,600.The difference would seem to be the volume<br />
of the Northwestside Basin, which the project is to tap: 1900 acre feet<br />
per year. That is about 619 million gallons. Yet the project aims to<br />
extract nearly 1.5 billion gallons per year. It seems that the basin would<br />
be overdrawn.<br />
In addition, there is concern about saltwater instrusion into groundwater.<br />
The Regional Groundwater Storage & Recovery project is expected to allow<br />
water to build up during wet years. Then, during drought water is to be<br />
sucked out for human use. In comparison to what happens today, and what<br />
has happened in the recent past, this would seem to create large suction<br />
during the next drought. That combined with sea level rise foreseeably<br />
could cause saltwater intrusion, just when it would be worst to have it.<br />
Sea levels are said to have risen some inches over the past hundred years.<br />
They are predicted to rise by something like four feet over the next<br />
hundred. I'm not able to provide good figures. But it seems to me that the<br />
matter should be addressed: more suction, higher seas...where does this<br />
lead?<br />
Recycled water is to irrigate GG Park. How long before this trickles down<br />
to the groundwater table, and once there, does it pollute significantly<br />
after...10 years, 20, 30? Recycled water may contain pharmaceuticals.<br />
WSIP once promised water as good as what has been received during past<br />
years. Is that promise still made. It was once promised that no more than<br />
ten percent of water served would be groundwater. Is that promise still<br />
made? Do the arithmetic: is that promise credible? Sunset Reservoir is the<br />
terminus for how much of the 4 mgd of groundwater? Does Sunset serve more<br />
than 40 mgd? Are there season variations so that during parts of the year<br />
more than 10% of served water is groundwater?<br />
Finally, is it wise to rely on groundwater in an area prone to<br />
earthquakes? Would or could a quake damage the aquifer? Would it or could<br />
a quake allow saltwater intrusion, or might a quake pollute in other ways?<br />
To what extent should the water system be designed not only for every day<br />
times, but also for emergency situations, such as post-earthquake? Will<br />
the wells work? Will the water be potable? Will the pipelines leak? Will<br />
demand rise (due to leaking pipes and fire suppression)? Is counting on<br />
groundwater for normal supply safe and effective in an earthquake-prone<br />
city?<br />
Steve Lawrence<br />
Page 1<br />
A.2-94
NANCY WUERFEL, 2516 23 RD AVENUE, SAN FRANCISCO, CA 94116<br />
April 1, 2011<br />
Mr. Bill Wycko<br />
c/o Timothy Johnston<br />
<strong>San</strong> <strong>Francisco</strong> <strong>Planning</strong> <strong>Department</strong><br />
1650 Mission Street, Suite 400<br />
<strong>San</strong> <strong>Francisco</strong>, CA, 94103-2479<br />
Re:<br />
EIR Case No.2008.1122E<br />
<strong>San</strong> <strong>Francisco</strong> Groundwater Supply Project<br />
Revised NOP for EIR, March 2, 2011<br />
Dear Mr. Wycko:<br />
Following are my comments pursuant to the March 2, 2011, Revised Notice of Preparation<br />
for the Environmental Impact Report for the referenced project<br />
I. NOP section 5.0 PERMITS AND APPROVALS REQUIRED has omitted the following<br />
required approval necessary for this project to use land managed by the Recreation and<br />
Park Commission:<br />
Section 4.113 of the city charter states that “No park land may be sold or leased for nonrecreational<br />
purposes, nor shall any structure on park property be built, maintained or<br />
used for non-recreational purposes, unless approved by a vote of the electors.”<br />
<br />
This project intends to build 3 new well facilities on park lands (2 outside of Golden<br />
Gate Park and 1 inside of GGP) that are for non recreational purposes. These wells<br />
are to siphon 4 mgd of groundwater to the <strong>San</strong> <strong>Francisco</strong> municipal water supply.<br />
These wells are not built to irrigate park lands. Therefore, these structures on park<br />
lands MUST BE APPROVED by the voters.<br />
The NOP documents must be corrected to include this requirement of the city charter .<br />
II. What are the potential impacts of the proposed project on the Recreation and Park<br />
properties involved in the project:<br />
1. There will be a permanent loss of groundwater as source of irrigation to GGP and 2<br />
other parks. There will be total reliance on the output of a recycled water plant (RWP) to<br />
support the irrigation of these parks. Please evaluate if these parks can be switched back to<br />
using ground water through the wells on park land for an indefinite period of time, if the<br />
RWP is unable to provide recycled water for any reason. If not, what will happen to the<br />
parks that once had ground water to irrigate them, if recycled water is not available?<br />
EIR Scoping Request - <strong>San</strong> <strong>Francisco</strong> Groundwater Supply Project - Page 1 of 3<br />
A.2-95
2. If groundwater were diverted to park irrigation, would Sunset Reservoir be backfilled<br />
with Hetch Hetchy water to 100% for an indefinite period?<br />
3. What are the negative effects of using recycled water on GGP over time?<br />
4. If voters approve using the parks for accessing groundwater for this project by building<br />
new wells, what impacts will there be from the operational noise of these new facilities on<br />
recreation, wildlife and neighbors of the parks?<br />
III. Request alternatives to proposed pipelines:<br />
The NOP states that “pipeline infrastructure and connection points” exist between the Lake<br />
Merced Pump Station and the Sunset Reservoir (page 9). Since this is in place, why can’t<br />
this system be used to transport the ground water to Sunset Reservoir instead of trenching<br />
new pipelines along 41 st Avenue? EIR should study linking South Sunset and West Sunset<br />
sites into this existing pipeline to Sunset Reservoir.<br />
IV. Issues about the safety of blending water:<br />
1. What are the potential health effects of consuming the proposed blend of 90% Hetch<br />
Hetchy water and 10% groundwater?<br />
2. If the SFPUC elects to change this ratio, will a new EIR have to be conducted to evaluate<br />
the new potential health hazards? What ratio would trigger another EIR? 80 -20?<br />
3. What are the effects of using the blended groundwater-HH water on appliances in<br />
people’s homes? What effect will the less pure water have on any machinery that uses<br />
water currently supplied by Hetch Hetchy?<br />
4. The residents of the western portion of the city will drink blended water, while the<br />
residents on the eastern side will drink pure Hetch Hetchy water. The EIR should require<br />
ill effects of this experiment to be evaluated before subjecting the rest of <strong>San</strong> <strong>Francisco</strong> to<br />
the change.<br />
V. Miscellaneous concerns:<br />
1. Besides using park property to access the ground water, what other alternative sites can<br />
be used to access groundwater for the project?<br />
2. What happens if 4 mgd of ground water cannot be produced to blend with Hetch Hetchy<br />
water because the park access to this water cannot be used? Will the project be feasible<br />
with less than 4 mgd of ground water? What is the lowest level mgd required?<br />
3. What are the effects of not implementing this project of blending ground water with<br />
Hetch Hetchy water for human use? What other options are there to meet water needs?<br />
EIR Scoping Request - <strong>San</strong> <strong>Francisco</strong> Groundwater Supply Project - Page 2 of 3<br />
A.2-96
4. How does this project, which conserves Hetch Hetchy water use on the West side of SF,<br />
promote population growth in SF? Will the conserved water be used as the water supply<br />
for the new required number of housing units in SF, included in the proposed Housing<br />
Element of the General Plan?<br />
Thank you for considering these comments. Please acknowledge receipt of this letter.<br />
Please let me review the results of the draft EIR.<br />
Sincerely,<br />
Nancy Wuerfel<br />
EIR Scoping Request - <strong>San</strong> <strong>Francisco</strong> Groundwater Supply Project - Page 3 of 3<br />
A.2-97
APPENDIX B<br />
WSIP PEIR Consistency Analysis and Mitigation<br />
Measures, Applicability to the Proposed Project<br />
WSIP PEIR Consistency Analysis<br />
The Groundwater Supply Project (proposed project) was analyzed at a program‐level in the<br />
Water System Improvement Program (WSIP) Program Environmental Impact Report (PEIR) 1 as<br />
one of the facility improvement projects under the WSIP. The project details presented in the<br />
PEIR were based on the best information available at that time with respect to project design and<br />
construction. Details regarding project design, facility layout, construction, staging areas, etc,<br />
were not available at the time the PEIR was prepared.<br />
The Groundwater Supply Project EIR (File No. 2008.1122E) provides a detailed, project‐level<br />
analysis of the proposed project based on site‐specific and up‐to‐date information developed<br />
subsequent to the preparation of the PEIR. Subsequent to publication of the PEIR, several<br />
modifications were made to the proposed project as more detailed information regarding project<br />
impacts was developed during project design and site‐specific analyses. The most notable project<br />
change is the siting of proposed well facility locations and groundwater pipelines. Overall, the<br />
project changes reduce the impacts associated with the Groundwater Supply project as described<br />
in the PEIR. Because less detailed information about the Groundwater Supply project was<br />
available at the time the PEIR was prepared, many of the impacts were conservatively assumed<br />
to be more severe than those determined in the Groundwater Supply Project EIR. Table 1<br />
evaluates the consistency of the project‐level impact analysis in the Groundwater Supply Project<br />
EIR with the program‐level impact analysis previously conducted in the PEIR. Where<br />
significance determinations vary between these documents, a brief explanation of the rationale<br />
for this determination is provided.<br />
1 <strong>San</strong> <strong>Francisco</strong> <strong>Planning</strong> <strong>Department</strong>, Final Program Environmental Impact Report for the <strong>San</strong> <strong>Francisco</strong> Public<br />
Utilities Commission’s Water System Improvement Program, File No. 2005‐0159E, State Clearinghouse<br />
No. 2005092026. Certified October 30, 2008.<br />
SFPUC <strong>San</strong> <strong>Francisco</strong> Groundwater Supply Project Draft EIR B‐1 March 2013<br />
Case No. 2008.1122E
Appendix B<br />
WSIP PEIR Consistency Analysis and Mitigation Measures, Applicability to the Proposed Project<br />
TABLE 1<br />
PEIR IMPACTS – CONSISTENCY REVIEW FOR THE GROUNDWATER SUPPLY PROJECT<br />
PEIR Impact<br />
PEIR Significance<br />
Determination for<br />
Groundwater<br />
Supply Project<br />
Project‐Level<br />
Significance<br />
Determination<br />
Same<br />
Rationale for<br />
Significance<br />
Determination<br />
as PEIR? (Y/N)<br />
Notes<br />
(Explain difference in significance determinations<br />
and/or rationale for determinations)<br />
Land Use<br />
Impact 4.3‐1: Temporary disruption or<br />
displacement of existing land uses during<br />
construction.<br />
Impact 4.3‐2: Permanent displacement or<br />
long‐term disruption of existing land<br />
uses.<br />
PSM LS N See Impact LU‐1: Project operations would not result in substantial long‐term or<br />
permanent impacts on the existing character of the vicinity.<br />
The PEIR assumed that the 24‐hour construction activities would be required for well facility<br />
construction and assumed that a new well would be constructed at the Francis Scott Key<br />
Elementary School. The analysis assumed that construction activities could disrupt sensitive<br />
land uses such as schools and nearby residential uses but implementation of SFPUC<br />
Construction Measures #1, #3, #5, #6, #10 and mitigation measures identified in Chapter 6,<br />
would reduce the impact to less than significant.<br />
Since publication of the PEIR, the SFPUC determined that 24‐hour construction would not be<br />
required and the well facility location at Francis Scott Key Elementary School was<br />
eliminated. As stated in Impact LU‐1, although the Groundwater Supply Project would<br />
result in temporary disruption of activities in the project vicinity as a result of construction<br />
staging, excavation, and pipeline installation activities, once construction is complete, all<br />
proposed pipelines would be belowground and would not be visible upon completion.<br />
Direct effects associated with temporary noise, traffic, and air quality effects are described in<br />
EIR Sections 5.6, 5.7, and 5.8, respectively.<br />
PSU LS N See Impact LU‐1: Project operations would not result in substantial long‐term or<br />
permanent impacts on the existing character of the vicinity.<br />
The PEIR conservatively assumed that the Groundwater Supply Project could include sites<br />
adjacent to Francis Scott Key School or other sites in <strong>San</strong> <strong>Francisco</strong> and northern <strong>San</strong> Mateo<br />
County, which could have resulted in significant and unavoidable impacts on these sensitive<br />
land uses even with implementation of SFPUC Construction Measures #6 (compliance with<br />
local noise ordinances to the extent feasible) and #10 (locating staging areas away from<br />
public view and directing nighttime lighting away from residential areas) as well as<br />
recommendations of facility siting studies (Measure 4.3‐2).<br />
Since publication of the PEIR, the SFPUC has determined that all project facilities would be<br />
sited on lands zoned for public uses that the City and County of <strong>San</strong> <strong>Francisco</strong> owns. Since<br />
new pipelines would be belowground and would not be visible upon completion, operation<br />
of the pipelines would not alter the existing character of the project area in the long‐term.<br />
Proposed well facilities would also be constructed adjacent to public uses and would not<br />
result in any substantial blockage of publicly accessible vistas or trails.<br />
PEIR Significance Categories<br />
N/A = Not Applicable or no impact<br />
LS = Less than Significant<br />
PSM = Potentially Significant impact with Mitigation<br />
SU = Significant and Unavoidable, even with mitigation<br />
PSU = Potentially Significant and Unavoidable, even with mitigation<br />
EIR Significance Categories<br />
NI = No Impact or not applicable (equivalent to N/A)<br />
LS = Less than Significant<br />
LSM = Less than Significant impact with Mitigation (equivalent to PSM)<br />
SU = Significant and Unavoidable impact, no feasible mitigation is available<br />
SUM = Significant and Unavoidable impact with Mitigation<br />
SFPUC <strong>San</strong> <strong>Francisco</strong> Groundwater Supply Project Draft EIR B‐2 March 2013<br />
Case No. 2008.1122E
Appendix B<br />
WSIP PEIR Consistency Analysis and Mitigation Measures, Applicability to the Proposed Project<br />
TABLE 1 (Continued)<br />
PEIR IMPACTS – CONSISTENCY REVIEW FOR THE GROUNDWATER SUPPLY PROJECT<br />
PEIR Impact<br />
PEIR Significance<br />
Determination for<br />
Groundwater<br />
Supply Project<br />
Project‐Level<br />
Significance<br />
Determination<br />
Same<br />
Rationale for<br />
Significance<br />
Determination<br />
as PEIR? (Y/N)<br />
Notes<br />
(Explain difference in significance determinations<br />
and/or rationale for determinations)<br />
Visual Quality<br />
Impact 4.3‐3: Temporary construction<br />
impacts on scenic vistas or visual<br />
character.<br />
Impact 4.3‐4: Permanent adverse impacts<br />
on scenic vistas or visual character.<br />
LS LS Y See Impact AE‐1: Temporary construction‐related disturbances would not have an adverse<br />
effect on a scenic vista, scenic resource, or the existing visual character or quality of the site<br />
and its surroundings.<br />
PSM<br />
LS/LSM<br />
(equivalent to<br />
PSM)<br />
N<br />
The PEIR assumed that temporary effects on visual character would be less than significant<br />
with implementation of SFPUC Construction Measure #10 (Project Site).<br />
The project‐level analysis does not assume implementation of SFPUC Construction Measure<br />
#10 and determined that since construction would be temporary, and would not be out of<br />
character, in terms of scale and duration, for construction in a typical urban environment<br />
(e.g., road improvements, utility maintenance, etc.); construction impacts at the West Sunset<br />
Well Facility site and South Sunset Well Facility site would be less than significant. The Lake<br />
Merced, Central Pump Station, South Windmill, and North Lake well facility sites have low<br />
visual quality and are poorly exposed. Construction activities at these sites would be<br />
relatively short and would not have a substantial adverse effect on the visual character or<br />
quality of the sites and surrounding areas.<br />
See Impact AE‐3: The proposed project would not have an adverse effect on a scenic vista.<br />
Also see Impact AE‐4: The project would have a substantial adverse effect on scenic<br />
resources or the existing visual character or quality of the site and its surroundings.<br />
The PEIR conservatively assumed that the Groundwater well facilities could be within<br />
viewsheds of I‐280 and the Great Highway, Lake Merced, Pine lake, <strong>San</strong> <strong>Francisco</strong> Zoo, and<br />
or Golden Gate Park. Implementation of PEIR Measures 4.3‐4a (Architectural Design), 4.3‐4c<br />
(Landscape Screens), and 4.3‐4d (Tree Removal) would reduce these potentially significant<br />
impacts to a less‐than‐significant level.<br />
The project‐level analysis determined that some locations near the proposed Lake Merced<br />
well facility could be considered vista points due to their unique and high‐quality views.<br />
However, because the well facility is co‐located with an existing water infrastructure facility<br />
and because viewers would be focused on views across the lake, the lake Merced well facility<br />
would not result in an adverse effect on scenic vistas. All other well facility sites do not<br />
include scenic vistas; there construction of the project would have a less than significant<br />
impact on scenic vistas. As described in Impact AE‐4, the proposed project’s pumping would<br />
PEIR Significance Categories<br />
N/A = Not Applicable or no impact<br />
LS = Less than Significant<br />
PSM = Potentially Significant impact with Mitigation<br />
SU = Significant and Unavoidable, even with mitigation<br />
PSU = Potentially Significant and Unavoidable, even with mitigation<br />
EIR Significance Categories<br />
NI = No Impact or not applicable (equivalent to N/A)<br />
LS = Less than Significant<br />
LSM = Less than Significant impact with Mitigation (equivalent to PSM)<br />
SU = Significant and Unavoidable impact, no feasible mitigation is available<br />
SUM = Significant and Unavoidable impact with Mitigation<br />
SFPUC <strong>San</strong> <strong>Francisco</strong> Groundwater Supply Project Draft EIR B‐3 March 2013<br />
Case No. 2008.1122E
Appendix B<br />
WSIP PEIR Consistency Analysis and Mitigation Measures, Applicability to the Proposed Project<br />
TABLE 1 (Continued)<br />
PEIR IMPACTS – CONSISTENCY REVIEW FOR THE GROUNDWATER SUPPLY PROJECT<br />
PEIR Impact<br />
PEIR Significance<br />
Determination for<br />
Groundwater<br />
Supply Project<br />
Project‐Level<br />
Significance<br />
Determination<br />
Same<br />
Rationale for<br />
Significance<br />
Determination<br />
as PEIR? (Y/N)<br />
Notes<br />
(Explain difference in significance determinations<br />
and/or rationale for determinations)<br />
Visual Quality (cont.)<br />
Impact 4.3‐4 (cont.) exacerbate surface water levels at Lake Merced such that reduced lake levels could detract<br />
from the scenic quality of the lake as viewed from the pedestrian path around the perimeter<br />
of the lake, adjacent roadways, trails, picnic areas, docks, and golf courses. Implementation<br />
of Mitigation Measure M‐HY‐9 (Lake‐Level Management for Lake Merced) would reduce<br />
impacts on the visual character and quality of Lake Merced area to a less‐than‐significant<br />
level.<br />
Impact 4.3‐5: New permanent sources of<br />
light or glare.<br />
PSM LS Y See Impact AE‐5: The proposed project would not create a new source of substantial light or<br />
glare that would adversely affect day or nighttime views in the area.<br />
The PEIR conservatively assumed that all WSIP projects that include aboveground<br />
improvements could include a new source of light or glare and required implementation of<br />
design measures (Mitigation Measure 4.3‐5) to reduce this impact to a less‐than‐significant<br />
level. Other well facilities would not result in substantial view blockage and therefore would<br />
not result in a substantial adverse effect on the site’s visual quality.<br />
The project‐level analysis determined that the Lake Merced and Golden Gate Park well<br />
facility sites would not be in the vicinity of residences or other land uses that would be<br />
sensitive to light and glare. Potentially affected viewers in the vicinity of the South Sunset<br />
and West Sunset well facilities would not be exposed to direct illumination or glare from<br />
reflective surfaces but might be exposed to soft light reflected off of the door of the building.<br />
In an urban context with many existing light sources, this would not be a substantial source<br />
of light or glare and no mitigation is required.<br />
Geology, Soils, and Seismicity<br />
Impact 4.4‐1: Slope instability during<br />
construction.<br />
PEIR Significance Categories<br />
N/A = Not Applicable or no impact<br />
LS = Less than Significant<br />
PSM = Potentially Significant impact with Mitigation<br />
SU = Significant and Unavoidable, even with mitigation<br />
PSU = Potentially Significant and Unavoidable, even with mitigation<br />
PSM LS N See Impact GE‐1: The proposed project is not located on a geologic unit that could become<br />
unstable as a result of project construction.<br />
The WSIP PEIR assumed that the pipelines associated with the Groundwater Supply project<br />
could cross areas of potential landslide susceptibility in <strong>San</strong> Mateo County but<br />
implementation of SFPUC Construction Measure #2 Seismic and Geotechnical Studies) as<br />
well as a quantified landslide analysis (Measure 4.4‐1) would reduce this impact to a lessthan‐significant<br />
level.<br />
EIR Significance Categories<br />
NI = No Impact or not applicable (equivalent to N/A)<br />
LS = Less than Significant<br />
LSM = Less than Significant impact with Mitigation (equivalent to PSM)<br />
SU = Significant and Unavoidable impact, no feasible mitigation is available<br />
SUM = Significant and Unavoidable impact with Mitigation<br />
SFPUC <strong>San</strong> <strong>Francisco</strong> Groundwater Supply Project Draft EIR B‐4 March 2013<br />
Case No. 2008.1122E
Appendix B<br />
WSIP PEIR Consistency Analysis and Mitigation Measures, Applicability to the Proposed Project<br />
TABLE 1 (Continued)<br />
PEIR IMPACTS – CONSISTENCY REVIEW FOR THE GROUNDWATER SUPPLY PROJECT<br />
PEIR Impact<br />
PEIR Significance<br />
Determination for<br />
Groundwater<br />
Supply Project<br />
Project‐Level<br />
Significance<br />
Determination<br />
Same<br />
Rationale for<br />
Significance<br />
Determination<br />
as PEIR? (Y/N)<br />
Notes<br />
(Explain difference in significance determinations<br />
and/or rationale for determinations)<br />
Geology, Soils, and Seismicity (cont.)<br />
Impact 4.4‐1 (cont.) While the PEIR conservatively assumed that some of the pipelines for the Groundwater Supply<br />
project could extend into <strong>San</strong> Mateo County, this is not the case under the proposed project<br />
which is located entirely in <strong>San</strong> <strong>Francisco</strong>. The project‐level analysis determined that the<br />
proposed facilities would not lie in designated landslide zones. Pipeline installation would<br />
include open‐cut excavation activities but implementation of shoring techniques, as required by<br />
Occupational Safety and Health Administration (OSHA) and standard geotechnical practice,<br />
would ensure that potential impacts related to slope instability are less than significant.<br />
Impact 4.4‐2: Erosion during<br />
construction.<br />
Impact 4.4‐3: Substantial alteration of<br />
topography.<br />
Impact 4.4‐4: Squeezing ground and<br />
subsidence during tunneling.<br />
Impact 4.4‐5: Surface fault rupture.<br />
Impact 4.4‐6: Seismically induced<br />
groundshaking.<br />
Impact 4.4‐7: Seismically induced ground<br />
failure, including liquefaction and<br />
settlement.<br />
Impact 4.4‐8: Seismically induced<br />
landslides or other slope failures.<br />
LS LS Y See Impact GE‐2: The proposed project would not result in substantial soil erosion or the loss<br />
of topsoil during construction.<br />
LS N/A N See Section 5.15.3 under the heading “Approach to Analysis.” While construction at the West<br />
Sunset and South Sunset well facility sites would require excavation into the adjacent slopes<br />
to create a flat area for the well facilities, such alternatives would not substantially alter the<br />
topography of the surrounding area. Therefore, there would be no impact related to<br />
substantial changes to topography or geologic or physical features of the site.<br />
N/A N/A Y As described in EIR Chapter 3, Project Description, trenchless construction (auger boring)<br />
would be used to tunnel under the light rail lines. Subsidence is not expected to be an issue.<br />
LS N/A N See Section 5.15.3 under the heading “Approach to Analysis.” The project‐level analysis<br />
determined that because the project sites are not located within an Alquist‐Priolo Fault Zone,<br />
and no mapped or potentially active faults are known to pass through the project area, the<br />
significance criterion related to exposing people or structures to risk of ground rupture along<br />
a fault line is not applicable to the proposed project.<br />
LS LS Y See Impact GE‐3: The proposed project would not expose people or structures to substantial<br />
adverse effects related to the risk of property loss, injury, or death due to seismically induced<br />
groundshaking.<br />
LS LS Y See Impact GE‐4: The proposed project would not expose people or structures to substantial<br />
adverse effects related to the risk of property loss, injury, or death due to seismically induced<br />
ground failure, including liquefaction, lateral spreading, and settlement.<br />
LS LS Y See Impact GE‐1: The proposed project is not located on a geologic unit that could become<br />
unstable as a result of project construction.<br />
PEIR Significance Categories<br />
N/A = Not Applicable or no impact<br />
LS = Less than Significant<br />
PSM = Potentially Significant impact with Mitigation<br />
SU = Significant and Unavoidable, even with mitigation<br />
PSU = Potentially Significant and Unavoidable, even with mitigation<br />
EIR Significance Categories<br />
NI = No Impact or not applicable (equivalent to N/A)<br />
LS = Less than Significant<br />
LSM = Less than Significant impact with Mitigation (equivalent to PSM)<br />
SU = Significant and Unavoidable impact, no feasible mitigation is available<br />
SUM = Significant and Unavoidable impact with Mitigation<br />
SFPUC <strong>San</strong> <strong>Francisco</strong> Groundwater Supply Project Draft EIR B‐5 March 2013<br />
Case No. 2008.1122E
Appendix B<br />
WSIP PEIR Consistency Analysis and Mitigation Measures, Applicability to the Proposed Project<br />
TABLE 1 (Continued)<br />
PEIR IMPACTS – CONSISTENCY REVIEW FOR THE GROUNDWATER SUPPLY PROJECT<br />
PEIR Impact<br />
PEIR Significance<br />
Determination for<br />
Groundwater<br />
Supply Project<br />
Project‐Level<br />
Significance<br />
Determination<br />
Same<br />
Rationale for<br />
Significance<br />
Determination<br />
as PEIR? (Y/N)<br />
Notes<br />
(Explain difference in significance determinations<br />
and/or rationale for determinations)<br />
Geology, Soils, and Seismicity (cont.)<br />
Impact 4.4‐9: Expansive or corrosive soils. PSM LS N See Impact GE‐5: The proposed project would not create substantial risks to life or property<br />
due to expansive or corrosive soils.<br />
Hydrology and Water Quality<br />
Based on regional mapping reviewed for the PEIR, expansive and corrosive soils are mapped in<br />
the project area, and impacts related to these soils were considered potentially significant.<br />
The analysis presented in the PEIR was based on the preliminary project information available<br />
at that time. Since preparation of the PEIR, geotechnical investigations have been conducted for<br />
the proposed project, which concluded that the project area soils have a mild to moderate<br />
corrosion potential, and advised that all buried ductile iron or steel pipelines be protected<br />
against corrosion. Implementation of these recommendations, which have been incorporated<br />
into the project design of the groundwater pipeline, would ensure that potential impacts related<br />
to corrosive soils are less than significant.<br />
Impact 4.5‐1: Degradation of water bodies<br />
as a result of erosion and sedimentation<br />
or a hazardous materials release during<br />
construction.<br />
LS LSM Y See Impact HY‐1: Project construction would possibly violate water quality standards and<br />
waste discharge requirements or otherwise substantially degrade water quality.<br />
Although final locations of the Groundwater Supply Project were not determined at the time of<br />
publication of the WSIP PEIR, the PEIR indicated that implementation of SFPUC Construction<br />
Measure #3 (onsite air and water quality measures during construction), implementation of<br />
control measures in compliance with NPDES permit requirements for projects disturbing more<br />
than one acre, and implementation of measures in compliance with Article 4.1 of the <strong>San</strong><br />
<strong>Francisco</strong>’s Public Works Code would ensure that this impact is less than significant.<br />
Similar to the PEIR, the project‐level analysis indicates that through compliance with Article 4.1<br />
of the <strong>San</strong> <strong>Francisco</strong> Public Works Code, the SFPUC would be required to develop and<br />
implement an erosion and sediment control plan. Impact HY‐1 also evaluated potential<br />
effects on water quality in the combined sewer system and Lake Merced by discharges of<br />
dewatered groundwater. The project‐level analysis determined that if dewatered<br />
groundwater were discharged to Lake Merced, these discharges could degrade water quality<br />
but implementation of Mitigation Measure HY‐1 (Implement Groundwater Dewatering BMPs<br />
at Lake Merced Well Facility) would reduce these effects to a less‐than‐significant level.<br />
PEIR Significance Categories<br />
N/A = Not Applicable or no impact<br />
LS = Less than Significant<br />
PSM = Potentially Significant impact with Mitigation<br />
SU = Significant and Unavoidable, even with mitigation<br />
PSU = Potentially Significant and Unavoidable, even with mitigation<br />
EIR Significance Categories<br />
NI = No Impact or not applicable (equivalent to N/A)<br />
LS = Less than Significant<br />
LSM = Less than Significant impact with Mitigation (equivalent to PSM)<br />
SU = Significant and Unavoidable impact, no feasible mitigation is available<br />
SUM = Significant and Unavoidable impact with Mitigation<br />
SFPUC <strong>San</strong> <strong>Francisco</strong> Groundwater Supply Project Draft EIR B‐6 March 2013<br />
Case No. 2008.1122E
Appendix B<br />
WSIP PEIR Consistency Analysis and Mitigation Measures, Applicability to the Proposed Project<br />
TABLE 1 (Continued)<br />
PEIR IMPACTS – CONSISTENCY REVIEW FOR THE GROUNDWATER SUPPLY PROJECT<br />
PEIR Impact<br />
PEIR Significance<br />
Determination for<br />
Groundwater<br />
Supply Project<br />
Project‐Level<br />
Significance<br />
Determination<br />
Same<br />
Rationale for<br />
Significance<br />
Determination<br />
as PEIR? (Y/N)<br />
Notes<br />
(Explain difference in significance determinations<br />
and/or rationale for determinations)<br />
Hydrology and Water Quality (cont.)<br />
Impact 4.5‐2: Depletion of groundwater<br />
resources.<br />
LS/PSM<br />
LS/LSM<br />
(equivalent to<br />
PSM)<br />
Y<br />
See Impact HY‐12: Project operation would not have a substantial adverse effect on<br />
groundwater depletion in the Westside Groundwater Basin. As described in Section 5.16.1, the<br />
project‐level EIR also addresses other negative effects on the groundwater basin relative to<br />
subsidence, seawater intrusion, groundwater/surface water interactions, and water quality<br />
(Impacts HY‐7 through HY‐11).<br />
The PEIR evaluates potential impacts related to the depletion of groundwater resources in<br />
Section 5.6. Impacts 5.6‐1 through 5.6‐6 in the PEIR address potential impacts on the Westside<br />
Groundwater Basin, including basin overdraft, changes in water levels in Lake Merced,<br />
seawater intrusion due to decreased groundwater levels, land subsidence, and contamination of<br />
drinking water. In the North Westside Groundwater Basin, land subsidence and the potential<br />
for drinking water contaminants to exceed maximum contaminant levels as a result of<br />
groundwater pumping were determined to be less than significant. The program‐level analysis<br />
determined that effects related to basin overdraft, changes in water levels in Lake Merced,<br />
seawater intrusion, and contamination of drinking water would be potentially significant but<br />
implementation of Mitigation Measures 5.6‐1 (Groundwater Monitoring to Determine Basin<br />
Safe Yield), 5.6‐2 (Implementation of a Lake Management Plan), and 5.6‐5 (Drinking Water<br />
Source Assessments for Groundwater Wells) would reduce such impacts to less‐thansignificant<br />
levels.<br />
The project‐level analysis also determined that project‐related groundwater pumping would<br />
not result in substantial land subsidence nor would it have a substantial adverse effect on water<br />
quality in Pine Lake. Similar to the PEIR, the analysis determined that operations could result in<br />
seawater intrusion, adverse effects on water quality affecting beneficial uses of Lake Merced,<br />
and could cause a violation of water quality standards. However, implementation of Mitigation<br />
Measures M‐HY‐8a (Expand Coastal Monitoring Network), M‐HY‐8b (Continuous<br />
Groundwater Monitoring in the Primary Production Aquifer), M‐HY‐8c (Adaptive<br />
Management Program for Seawater Intrusion), M‐HY‐9 (Lake‐Level Management for Lake<br />
Merced), and M‐HY‐11 (Prepare a Source Water Protection Program and Update Drinking<br />
Water Source Assessment) would reduce aforementioned impacts to a less‐than‐significant<br />
level.<br />
PEIR Significance Categories<br />
N/A = Not Applicable or no impact<br />
LS = Less than Significant<br />
PSM = Potentially Significant impact with Mitigation<br />
SU = Significant and Unavoidable, even with mitigation<br />
PSU = Potentially Significant and Unavoidable, even with mitigation<br />
EIR Significance Categories<br />
NI = No Impact or not applicable (equivalent to N/A)<br />
LS = Less than Significant<br />
LSM = Less than Significant impact with Mitigation (equivalent to PSM)<br />
SU = Significant and Unavoidable impact, no feasible mitigation is available<br />
SUM = Significant and Unavoidable impact with Mitigation<br />
SFPUC <strong>San</strong> <strong>Francisco</strong> Groundwater Supply Project Draft EIR B‐7 March 2013<br />
Case No. 2008.1122E
Appendix B<br />
WSIP PEIR Consistency Analysis and Mitigation Measures, Applicability to the Proposed Project<br />
TABLE 1 (Continued)<br />
PEIR IMPACTS – CONSISTENCY REVIEW FOR THE GROUNDWATER SUPPLY PROJECT<br />
PEIR Impact<br />
PEIR Significance<br />
Determination for<br />
Groundwater<br />
Supply Project<br />
Project‐Level<br />
Significance<br />
Determination<br />
Same<br />
Rationale for<br />
Significance<br />
Determination<br />
as PEIR? (Y/N)<br />
Notes<br />
(Explain difference in significance determinations<br />
and/or rationale for determinations)<br />
Hydrology and Water Quality (cont.)<br />
Impact 4.5‐3a: Degradation of water<br />
quality due to construction dewatering<br />
discharges.<br />
Impact 4.5‐3b: Degradation of water<br />
quality due to construction‐related<br />
discharges of treated water.<br />
Impact 4.5‐4: Flooding and water quality<br />
impacts associated with impeding or<br />
redirecting flood flows.<br />
N/A LSM N See Impact HY‐1: Project construction would possibly violate water quality standards and<br />
waste discharge requirements or otherwise substantially degrade water quality.<br />
N/A<br />
LSM (equivalent<br />
to PSM)<br />
N<br />
The PEIR assumed that the Groundwater Supply Project would not involve dewatering. As<br />
described above for PEIR Impact 4.5‐1, dewatered groundwater could degrade water quality<br />
at Lake Merced but Mitigation Measure HY‐1 would reduce this potential impact to a lessthan‐significant<br />
level.<br />
See Impact HY‐1: Project construction would possibly violate water quality standards and<br />
waste discharge requirements or otherwise substantially degrade water quality.<br />
The PEIR assumed that the Groundwater Supply Project would not involve constructionrelated<br />
discharges of water; therefore this impact was determined to not be applicable.<br />
The project‐level analysis indicates that, consistent with Article 4.1 of the <strong>San</strong> <strong>Francisco</strong><br />
Public Works Code, a permit from the SFPUC would be required. This permit would contain<br />
appropriate standards to regulate the quantity and quality of discharges and would ensure<br />
that discharges to the sewer age system are less than significant.<br />
PSM LS N See Impact HY‐5: The proposed project would not result in adverse effects related to the<br />
placement of structures within a 100‐year flood hazard area.<br />
At the time the PEIR was prepared, the project design conservatively assumed that some<br />
Groundwater Supply Project components could be constructed in <strong>San</strong> Mateo County and<br />
could be constructed in a flood zone. Thus, the PEIR determined that impacts related to<br />
flooding would be potentially significant but implementation of flood flow protection<br />
measures (Measure 4.5‐4a), which would be prepared for the project, would reduce impacts<br />
to a less‐than‐significant level.<br />
The project‐level analysis determined that none of the proposed project sites are within a<br />
special flood hazard zone nor are they located in <strong>San</strong> Mateo County. The project‐level<br />
analysis determined that the South Windmill Replacement well facility site is within an area<br />
PEIR Significance Categories<br />
N/A = Not Applicable or no impact<br />
LS = Less than Significant<br />
PSM = Potentially Significant impact with Mitigation<br />
SU = Significant and Unavoidable, even with mitigation<br />
PSU = Potentially Significant and Unavoidable, even with mitigation<br />
EIR Significance Categories<br />
NI = No Impact or not applicable (equivalent to N/A)<br />
LS = Less than Significant<br />
LSM = Less than Significant impact with Mitigation (equivalent to PSM)<br />
SU = Significant and Unavoidable impact, no feasible mitigation is available<br />
SUM = Significant and Unavoidable impact with Mitigation<br />
SFPUC <strong>San</strong> <strong>Francisco</strong> Groundwater Supply Project Draft EIR B‐8 March 2013<br />
Case No. 2008.1122E
Appendix B<br />
WSIP PEIR Consistency Analysis and Mitigation Measures, Applicability to the Proposed Project<br />
TABLE 1 (Continued)<br />
PEIR IMPACTS – CONSISTENCY REVIEW FOR THE GROUNDWATER SUPPLY PROJECT<br />
PEIR Impact<br />
PEIR Significance<br />
Determination for<br />
Groundwater<br />
Supply Project<br />
Project‐Level<br />
Significance<br />
Determination<br />
Same<br />
Rationale for<br />
Significance<br />
Determination<br />
as PEIR? (Y/N)<br />
Notes<br />
(Explain difference in significance determinations<br />
and/or rationale for determinations)<br />
Hydrology and Water Quality (cont.)<br />
Impact 4.5‐4 (cont.) of potential flooding under existing conditions as well as with a 55‐inch sea level rise. Given<br />
that the proposed well facility would be smaller than the existing irrigation well building<br />
that would be demolished at the same location, and because the facility would not be<br />
inhabited by people, this impact would be less than significant.<br />
Impact 4.5‐5: Degradation of water<br />
quality and increased flows due to<br />
discharges to surface water during<br />
operation.<br />
PSM<br />
LSM (equivalent<br />
to PSM)<br />
N<br />
See Impact HY‐9: The proposed project would possibly have a substantial, adverse effect on<br />
water quality that could affect the beneficial uses of Lake Merced.<br />
The PEIR analysis determined that the use of treated stormwater for groundwater recharge<br />
could affect groundwater quality if the bacterial standards for the source water were less<br />
stringent than those for drinking water, a potentially significant impact. Implementation of<br />
Measure 4.5‐5, which requires treatment to remove nutrients from stormwater and<br />
implementation of groundwater monitoring in the vicinity of Lake Merced, would reduce<br />
this impact to less than significant.<br />
While the PEIR analysis focused on potential drinking water quality impacts associated with<br />
the Lake Merced project (a separate WSIP project), the project‐level analysis focuses on<br />
whether the proposed project would result in significant changes in water quality that could<br />
affect the beneficial uses of Lake Merced using modeled existing conditions compared with<br />
lake water levels modeled to occur with implementation of the proposed project. The project<br />
is predicted to cause Lake Merced water levels to fall, which could result in water quality<br />
changes that could cause exceedences of water quality objectives related to warm and cold<br />
freshwater habitat, a potentially significant impact. Implementation of Mitigation Measure<br />
M‐HY‐9 (Lake‐Level Management for Lake Merced) would reduce this impact to a less‐thansignificant<br />
level.<br />
Impact 4.5‐6: Degradation of water<br />
quality due to an alteration of drainage<br />
patterns or an increase in impervious<br />
surfaces.<br />
LS LS Y See Impact HY‐2: Project operation would not violate any water quality standards or waste<br />
discharge requirements or otherwise degrade water quality. Also see Impact HY‐3: The<br />
proposed project would not substantially alter the existing drainage pattern of the site or<br />
area, including through the alteration of the course of a stream or river, in a manner that<br />
would result in substantial erosion, siltation, or flooding on or off the site.<br />
PEIR Significance Categories<br />
N/A = Not Applicable or no impact<br />
LS = Less than Significant<br />
PSM = Potentially Significant impact with Mitigation<br />
SU = Significant and Unavoidable, even with mitigation<br />
PSU = Potentially Significant and Unavoidable, even with mitigation<br />
EIR Significance Categories<br />
NI = No Impact or not applicable (equivalent to N/A)<br />
LS = Less than Significant<br />
LSM = Less than Significant impact with Mitigation (equivalent to PSM)<br />
SU = Significant and Unavoidable impact, no feasible mitigation is available<br />
SUM = Significant and Unavoidable impact with Mitigation<br />
SFPUC <strong>San</strong> <strong>Francisco</strong> Groundwater Supply Project Draft EIR B‐9 March 2013<br />
Case No. 2008.1122E
Appendix B<br />
WSIP PEIR Consistency Analysis and Mitigation Measures, Applicability to the Proposed Project<br />
TABLE 1 (Continued)<br />
PEIR IMPACTS – CONSISTENCY REVIEW FOR THE GROUNDWATER SUPPLY PROJECT<br />
PEIR Impact<br />
PEIR Significance<br />
Determination for<br />
Groundwater<br />
Supply Project<br />
Project‐Level<br />
Significance<br />
Determination<br />
Same<br />
Rationale for<br />
Significance<br />
Determination<br />
as PEIR? (Y/N)<br />
Notes<br />
(Explain difference in significance determinations<br />
and/or rationale for determinations)<br />
Biological Resources<br />
Impact 4.6‐1: Impacts on wetlands and<br />
aquatic resources.<br />
PSM<br />
LS/LSM<br />
(equivalent to<br />
PSM)<br />
N<br />
See Impact BI‐2: Construction of the proposed project would not adversely affect federally<br />
protected wetlands. Also see Impact BI‐7: Operation of the proposed project would adversely<br />
affect wetland habitats and other waters of the United States associated with Lake Merced.<br />
The PEIR analysis assumed that the Groundwater Supply Project could affect wetlands and<br />
stream crossings at undetermined locations but implementation of SFPUC Construction<br />
Measure #8 (biological screening survey) would help determine whether wetland and<br />
aquatic resources would be affected. If needed, Measures 4.6‐1 and 4.6‐1b would have been<br />
implemented.<br />
Since publication of the PEIR, several biological surveys have been conducted at project sites.<br />
The project‐level analysis determined that the project sites do not support federally protected<br />
wetlands or waters of the U.S. but given that the sites are located near several water bodies,<br />
construction activities (e.g., grading and excavation) could result in erosion to adjacent areas<br />
such as Lake Merced, North Lake, and wetlands associated with these features.<br />
Development and implementation of an Erosion and Sedimentation Control Plan, as<br />
required by Article 4.1 of the <strong>San</strong> <strong>Francisco</strong> Public Works Code, would ensure that potential<br />
impacts on wetlands are less than significant. The project‐level analysis also evaluates<br />
potential effects on wetlands due to groundwater pumping and decreases in water levels at<br />
Lake Merced (see Impact BI‐7), which could be potentially significant. The analysis<br />
determined that implementation of Mitigation Measure M‐HY‐9 (Lake Level Management<br />
for Lake Merced) would maintain water levels to avoid or minimize adverse effects on<br />
wetlands at Lake Merced.<br />
Impact 4.6‐2: Impacts on sensitive<br />
habitats, common habitats, and heritage<br />
trees.<br />
PSM<br />
LSM (equivalent<br />
to PSM)<br />
Y<br />
See Impact BI‐3: Construction of the proposed project would conflict with applicable local<br />
policies or ordinances protecting biological resources, such as a tree preservation policy or<br />
ordinance.<br />
PEIR Significance Categories<br />
N/A = Not Applicable or no impact<br />
LS = Less than Significant<br />
PSM = Potentially Significant impact with Mitigation<br />
SU = Significant and Unavoidable, even with mitigation<br />
PSU = Potentially Significant and Unavoidable, even with mitigation<br />
EIR Significance Categories<br />
NI = No Impact or not applicable (equivalent to N/A)<br />
LS = Less than Significant<br />
LSM = Less than Significant impact with Mitigation (equivalent to PSM)<br />
SU = Significant and Unavoidable impact, no feasible mitigation is available<br />
SUM = Significant and Unavoidable impact with Mitigation<br />
SFPUC <strong>San</strong> <strong>Francisco</strong> Groundwater Supply Project Draft EIR B‐10 March 2013<br />
Case No. 2008.1122E
Appendix B<br />
WSIP PEIR Consistency Analysis and Mitigation Measures, Applicability to the Proposed Project<br />
TABLE 1 (Continued)<br />
PEIR IMPACTS – CONSISTENCY REVIEW FOR THE GROUNDWATER SUPPLY PROJECT<br />
PEIR Impact<br />
PEIR Significance<br />
Determination for<br />
Groundwater<br />
Supply Project<br />
Project‐Level<br />
Significance<br />
Determination<br />
Same<br />
Rationale for<br />
Significance<br />
Determination<br />
as PEIR? (Y/N)<br />
Notes<br />
(Explain difference in significance determinations<br />
and/or rationale for determinations)<br />
Biological Resources (cont.)<br />
Impact 4.6‐3: Impacts on key specialstatus<br />
species – direct mortality and/or<br />
habitat effects.<br />
LS<br />
LSM (equivalent<br />
to PSM)<br />
Y<br />
See Impact BI‐1: Construction of the proposed project would potentially adversely affect<br />
species identified as a candidate, sensitive, or special‐status species in local or regional plans,<br />
policies, or regulations, or by the CDFW or USFWS.<br />
The PEIR analysis assumed that proposed Groundwater Supply Project facilities would be<br />
located in previously disturbed areas that do not support key special‐status species. Since<br />
publication of the PEIR, the project‐level analysis determined that the project could result in<br />
adverse impacts on sensitive species that utilize aquatic habitats at Lake Merced, North Lake,<br />
and Central Pump Station well facility sites. Vegetation clearing could also result in impacts<br />
on special‐status bats and monarch butterflies. Implementation of Mitigation Measures M‐BI‐<br />
1a, ‐1b, and ‐1c would reduce this impact to a less‐than‐significant level.<br />
Impact 4.6‐4: Water discharge effects on<br />
riparian and/or aquatic resources.<br />
Impact 4.6‐5: Conflicts with adopted<br />
conservation plans or other approved<br />
biological resources plans.<br />
N/A LS N See Impact HY‐1: Project construction would possibly violate water quality standards and<br />
waste discharge requirements or otherwise substantially degrade water quality.<br />
The PEIR assumed that the Groundwater Supply Project would not involve dewatering. As<br />
described above for PEIR Impact 4.5‐1, the project‐level analysis determined that dewatered<br />
groundwater could degrade water quality at Lake Merced but Mitigation Measure M‐HY‐1<br />
would reduce this potential impact to less than significant.<br />
N/A NI Y See Section 5.14.3 in the Biological Resources section.<br />
Cultural Resources<br />
Impact 4.7‐1: Impacts on paleontological<br />
resources.<br />
PSM LS N See Impact CP‐3: The proposed project would not directly or indirectly destroy a unique<br />
paleontological resource or site or unique geological feature.<br />
The WSIP PEIR assumed that since the Groundwater Supply Project would involve<br />
excavation, the likelihood that this project could affect paleontological resources was<br />
considered potentially significant but implementation of PEIR Measure 4.7‐1 would reduce<br />
the impact to less than significant.<br />
PEIR Significance Categories<br />
N/A = Not Applicable or no impact<br />
LS = Less than Significant<br />
PSM = Potentially Significant impact with Mitigation<br />
SU = Significant and Unavoidable, even with mitigation<br />
PSU = Potentially Significant and Unavoidable, even with mitigation<br />
EIR Significance Categories<br />
NI = No Impact or not applicable (equivalent to N/A)<br />
LS = Less than Significant<br />
LSM = Less than Significant impact with Mitigation (equivalent to PSM)<br />
SU = Significant and Unavoidable impact, no feasible mitigation is available<br />
SUM = Significant and Unavoidable impact with Mitigation<br />
SFPUC <strong>San</strong> <strong>Francisco</strong> Groundwater Supply Project Draft EIR B‐11 March 2013<br />
Case No. 2008.1122E
Appendix B<br />
WSIP PEIR Consistency Analysis and Mitigation Measures, Applicability to the Proposed Project<br />
TABLE 1 (Continued)<br />
PEIR IMPACTS – CONSISTENCY REVIEW FOR THE GROUNDWATER SUPPLY PROJECT<br />
PEIR Impact<br />
PEIR Significance<br />
Determination for<br />
Groundwater<br />
Supply Project<br />
Project‐Level<br />
Significance<br />
Determination<br />
Same<br />
Rationale for<br />
Significance<br />
Determination<br />
as PEIR? (Y/N)<br />
Notes<br />
(Explain difference in significance determinations<br />
and/or rationale for determinations)<br />
Cultural Resources (cont.)<br />
Impact 4.7‐1 (cont.) Since publication of the PEIR, the project‐level analysis determined there is a low potential<br />
for project construction to uncover unique or significant fossils within the paleontological C‐APE.<br />
Therefore, the impact related to direct or indirect effects on paleontological resources would be<br />
less than significant, and no mitigation would be required.<br />
Impact 4.7‐2: Impacts on archaeological<br />
resources.<br />
PSM<br />
LSM (equivalent<br />
to PSM)<br />
Y<br />
See Impact CP‐2a: The proposed project would potentially cause a substantial adverse<br />
change in the significance of an archaeological resource pursuant to Section 15064.5. Also see<br />
Impact CP‐2b: Construction of the proposed Lake Merced well facility would potentially<br />
cause a substantial adverse change in the significance of an archaeological resource pursuant<br />
to Section 15064.5.<br />
Impact 4.7‐3: Impacts on the historical<br />
significance of a historic district or a<br />
contributor to a historic district.<br />
N/A LS N Impact CP‐1: The proposed project would not cause a substantial adverse change in the<br />
significance of a historical resource as defined in CEQA Guidelines Section 15064.5, including<br />
those resources listed in Article 10 or Article 11 of the <strong>San</strong> <strong>Francisco</strong> <strong>Planning</strong> Code.<br />
The WSIP PEIR concluded that the Groundwater Supply Project would add new facilities to the<br />
WSIP system or upgrade existing non‐historic facilities; therefore, the project would not affect<br />
historic components of the regional system.<br />
The project‐level analysis evaluated the potential for proposed well facilities and new<br />
groundwater supply pipeline to affect any historical resources, including those within the<br />
Golden Gate Park National Historic District. The project‐level analysis determined that none of<br />
the proposed components or staging areas would cause impacts on historical resources.<br />
Impact 4.7‐4: Impacts on the historical<br />
significance of individual facilities<br />
resulting from demolition or alteration.<br />
N/A LS N See Impact CP‐1: The proposed project would not cause a substantial adverse change in the<br />
significance of a historical resource as defined in CEQA Guidelines Section 15064.5, including<br />
those resources listed in Article 10 or Article 11 of the <strong>San</strong> <strong>Francisco</strong> <strong>Planning</strong> Code.<br />
The PEIR assumed that demolition would be limited to paved areas and playgrounds at the<br />
Francis Scott Key School Annex, and West and South Sunset Playgrounds.<br />
PEIR Significance Categories<br />
N/A = Not Applicable or no impact<br />
LS = Less than Significant<br />
PSM = Potentially Significant impact with Mitigation<br />
SU = Significant and Unavoidable, even with mitigation<br />
PSU = Potentially Significant and Unavoidable, even with mitigation<br />
EIR Significance Categories<br />
NI = No Impact or not applicable (equivalent to N/A)<br />
LS = Less than Significant<br />
LSM = Less than Significant impact with Mitigation (equivalent to PSM)<br />
SU = Significant and Unavoidable impact, no feasible mitigation is available<br />
SUM = Significant and Unavoidable impact with Mitigation<br />
SFPUC <strong>San</strong> <strong>Francisco</strong> Groundwater Supply Project Draft EIR B‐12 March 2013<br />
Case No. 2008.1122E
Appendix B<br />
WSIP PEIR Consistency Analysis and Mitigation Measures, Applicability to the Proposed Project<br />
TABLE 1 (Continued)<br />
PEIR IMPACTS – CONSISTENCY REVIEW FOR THE GROUNDWATER SUPPLY PROJECT<br />
PEIR Impact<br />
PEIR Significance<br />
Determination for<br />
Groundwater<br />
Supply Project<br />
Project‐Level<br />
Significance<br />
Determination<br />
Same<br />
Rationale for<br />
Significance<br />
Determination<br />
as PEIR? (Y/N)<br />
Notes<br />
(Explain difference in significance determinations<br />
and/or rationale for determinations)<br />
Cultural Resources (cont.)<br />
Impact 4.7‐4 (cont.) The project‐level analysis determined that demolition of the existing well facilities at the<br />
North Lake site and South Windmill site would not result in the removal of any features that<br />
contribute to the Golden Gate National Register Historic District. The project does not<br />
include a well facility site at the Francis Scott Key School. This impact would be less than<br />
significant.<br />
Impact 4.7‐5: Impacts on adjacent historic<br />
architectural resources.<br />
LS LS Y See Impact CP‐1: The proposed project would not cause a substantial adverse change in the<br />
significance of a historical resource as defined in CEQA Guidelines Section 15064.5, including<br />
those resources listed in Article 10 or Article 11 of the <strong>San</strong> <strong>Francisco</strong> <strong>Planning</strong> Code.<br />
Traffic, Transportation, and Circulation<br />
Impact 4.8‐1: Temporary reduction in<br />
roadway capacity and increased traffic<br />
delays.<br />
Impact 4.8‐2: Short‐term traffic increases<br />
on roadways.<br />
PSM LS Y See Impact TR‐1: Closure of travel lanes during project construction would temporarily<br />
reduce roadway capacity and increase traffic delays on area roadways, causing temporary<br />
and intermittent conflicts with all modes of travel, but the effects would be of short duration<br />
and limited in magnitude.<br />
The PEIR conservatively assumed that because the Groundwater Supply project would<br />
require construction within or across local roadways, this impact would be potentially<br />
significant. Implementation of SFPUC Construction Measure #5 (traffic control plan) and<br />
additional control measures identified in Measure 4.8‐1a would reduce this impact to a lessthan‐significant<br />
level.<br />
The project‐level analysis indicates that the SFPUC would implement a Construction<br />
Management Plan as part of the SFMTA’s Transportation Advisory Staff Committee, which<br />
includes representatives from the SFDPW, the SFMTA, and the Fire, <strong>Planning</strong>, Police, Port,<br />
and Public Health <strong>Department</strong>s. Due to the short duration and limited magnitude of traffic<br />
disruptions and through coordination and review of the Construction Management Plan,<br />
construction impacts would be less than significant.<br />
LS LS Y See Impact TR‐2: Project construction would cause temporary increases in traffic volumes on<br />
area roadways, but would not cause substantial conflicts with the performance of the<br />
circulation system.<br />
PEIR Significance Categories<br />
N/A = Not Applicable or no impact<br />
LS = Less than Significant<br />
PSM = Potentially Significant impact with Mitigation<br />
SU = Significant and Unavoidable, even with mitigation<br />
PSU = Potentially Significant and Unavoidable, even with mitigation<br />
EIR Significance Categories<br />
NI = No Impact or not applicable (equivalent to N/A)<br />
LS = Less than Significant<br />
LSM = Less than Significant impact with Mitigation (equivalent to PSM)<br />
SU = Significant and Unavoidable impact, no feasible mitigation is available<br />
SUM = Significant and Unavoidable impact with Mitigation<br />
SFPUC <strong>San</strong> <strong>Francisco</strong> Groundwater Supply Project Draft EIR B‐13 March 2013<br />
Case No. 2008.1122E
Appendix B<br />
WSIP PEIR Consistency Analysis and Mitigation Measures, Applicability to the Proposed Project<br />
TABLE 1 (Continued)<br />
PEIR IMPACTS – CONSISTENCY REVIEW FOR THE GROUNDWATER SUPPLY PROJECT<br />
PEIR Impact<br />
PEIR Significance<br />
Determination for<br />
Groundwater<br />
Supply Project<br />
Project‐Level<br />
Significance<br />
Determination<br />
Same<br />
Rationale for<br />
Significance<br />
Determination<br />
as PEIR? (Y/N)<br />
Notes<br />
(Explain difference in significance determinations<br />
and/or rationale for determinations)<br />
Traffic, Transportation, and Circulation (cont.)<br />
Impact 4.8‐3: Impaired access to adjacent<br />
roadways and land uses.<br />
Impact 4.8‐4: Temporary displacement of<br />
on‐street parking.<br />
Impact 4.8‐5: Increased traffic safety<br />
hazards during construction.<br />
PSM LS Y See Impact TR‐3: Project construction would not substantially limit access to adjacent<br />
roadways and land uses due to construction within roadways.<br />
The WSIP PEIR assumed that the Groundwater Supply Project would have the potential to<br />
result in impacts on adjacent land uses and on pedestrian and bicycle circulation, especially<br />
in a densely populated area. Implementation of SFPUC Construction Measure #5 (traffic<br />
control plan) and additional control measures identified in PEIR Measure 4.8‐1a were<br />
thought to reduce this impact to a less‐than‐significant level.<br />
The project‐level review determined that given the expected pace of work, impaired access to<br />
adjacent land uses, driveways, and cross‐streets along the pipeline construction routes would<br />
be limited to one or two days at most. The analysis also revealed that the project would<br />
restore access and travel or parking lanes during non‐construction hours by covering<br />
trenches with steel plates and that the SFPUC would be required to provide notification to all<br />
emergency service providers prior to lane closures. For these reasons, the impact<br />
determination is less than significant.<br />
PSM NI N Since publication of the PEIR, the significance criterion specifically pertaining to<br />
displacement of on‐street parking has been deleted from the <strong>San</strong> <strong>Francisco</strong> <strong>Planning</strong><br />
<strong>Department</strong>’s initial study checklist (<strong>San</strong> <strong>Francisco</strong> <strong>Planning</strong> <strong>Department</strong>, 2010).<br />
PSM NI N See Impacts TR‐1: Closure of travel lanes during project construction would temporarily<br />
reduce roadway capacity and increase traffic delays on area roadways, causing temporary<br />
and intermittent conflicts with all modes of travel, but the effects would be of short duration<br />
and limited in magnitude. Also see Impact TR‐4: Project construction would not substantially<br />
impair access to alternative transportation facilities (public transit, bicycle, or pedestrian<br />
facilities), although it could temporarily decrease the performance of such facilities.<br />
The PEIR conservatively assumed that the WSIP projects in all regions would increase safety<br />
hazards but implementation of SFPUC Construction Measure #5 (traffic control plan) and<br />
additional traffic control measures identified in Measure 4.8‐1a would reduce this impact to a<br />
less‐than‐significant level.<br />
PEIR Significance Categories<br />
N/A = Not Applicable or no impact<br />
LS = Less than Significant<br />
PSM = Potentially Significant impact with Mitigation<br />
SU = Significant and Unavoidable, even with mitigation<br />
PSU = Potentially Significant and Unavoidable, even with mitigation<br />
EIR Significance Categories<br />
NI = No Impact or not applicable (equivalent to N/A)<br />
LS = Less than Significant<br />
LSM = Less than Significant impact with Mitigation (equivalent to PSM)<br />
SU = Significant and Unavoidable impact, no feasible mitigation is available<br />
SUM = Significant and Unavoidable impact with Mitigation<br />
SFPUC <strong>San</strong> <strong>Francisco</strong> Groundwater Supply Project Draft EIR B‐14 March 2013<br />
Case No. 2008.1122E
Appendix B<br />
WSIP PEIR Consistency Analysis and Mitigation Measures, Applicability to the Proposed Project<br />
TABLE 1 (Continued)<br />
PEIR IMPACTS – CONSISTENCY REVIEW FOR THE GROUNDWATER SUPPLY PROJECT<br />
PEIR Impact<br />
PEIR Significance<br />
Determination for<br />
Groundwater<br />
Supply Project<br />
Project‐Level<br />
Significance<br />
Determination<br />
Same<br />
Rationale for<br />
Significance<br />
Determination<br />
as PEIR? (Y/N)<br />
Notes<br />
(Explain difference in significance determinations<br />
and/or rationale for determinations)<br />
Traffic, Transportation, and Circulation (cont.)<br />
Impact 4.8‐5 (cont.) The project‐level analysis determined that transportation impacts, including potential for<br />
increased safety hazards, are generally not considered significant because of the project’s<br />
temporary and limited duration. Implementation of a Construction Management Plan as part<br />
of the Transportation Advisory Staff Committee (TASC) process would ensure that the<br />
SFPUC coordinates appropriately with jurisdictional agencies through the Street<br />
Construction Coordination Center of the SFDPW and the TASC. Implementation of this plan<br />
would ensure that potential safety hazards would be less than significant.<br />
Impact 4.8‐6: Long‐term traffic increases<br />
during facility operation.<br />
LS LS Y See Impact TR‐5: Project operations and maintenance activities would cause some increases<br />
in traffic volumes on area roadways, but would not substantially alter transportation<br />
conditions and would not cause conflicts with alternative travel modes, including vehicles,<br />
emergency vehicles, transit, pedestrians, and bicycle traffic.<br />
Air Quality<br />
Impact 4.9‐1: Construction emissions of<br />
criteria pollutants.<br />
Impact 4.9‐2: Exposure to diesel<br />
particulate matter during construction.<br />
Impact 4.9‐3: Exposure to emissions<br />
(possibly including asbestos) from<br />
tunneling.<br />
LS LS Y See Impact AQ‐1: Project construction activities would not generate emissions of criteria<br />
pollutants and precursors such that a violation of air quality standards and substantial<br />
contribution to an existing air quality violation would occur.<br />
LS LS Y See Impact AQ‐2: Project construction would not result in substantial exposure of sensitive<br />
receptors to pollutant concentrations.<br />
PSM N/A N See Impact AQ‐3: Project construction activities would not result in the creation of objectionable<br />
odors that affect a substantial number of people.<br />
The PEIR analysis conservatively assumed that the Groundwater Supply Project could require<br />
the use of jack‐and‐bore construction, which could result in exposure of nuisance odors.<br />
Though tunneling would be required under the two MUNI light rail line crossings, the projectlevel<br />
analysis determined that tunneling would not result in the creation of objectionable odors.<br />
Rather, in general, the EIR determined that the use of construction equipment and well facility<br />
construction would generate diesel exhaust emissions, which could result in objectionable<br />
odors for nearby residents but since the odors would be temporary, the impact would be less<br />
than significant.<br />
PEIR Significance Categories<br />
N/A = Not Applicable or no impact<br />
LS = Less than Significant<br />
PSM = Potentially Significant impact with Mitigation<br />
SU = Significant and Unavoidable, even with mitigation<br />
PSU = Potentially Significant and Unavoidable, even with mitigation<br />
EIR Significance Categories<br />
NI = No Impact or not applicable (equivalent to N/A)<br />
LS = Less than Significant<br />
LSM = Less than Significant impact with Mitigation (equivalent to PSM)<br />
SU = Significant and Unavoidable impact, no feasible mitigation is available<br />
SUM = Significant and Unavoidable impact with Mitigation<br />
SFPUC <strong>San</strong> <strong>Francisco</strong> Groundwater Supply Project Draft EIR B‐15 March 2013<br />
Case No. 2008.1122E
Appendix B<br />
WSIP PEIR Consistency Analysis and Mitigation Measures, Applicability to the Proposed Project<br />
TABLE 1 (Continued)<br />
PEIR IMPACTS – CONSISTENCY REVIEW FOR THE GROUNDWATER SUPPLY PROJECT<br />
PEIR Impact<br />
PEIR Significance<br />
Determination for<br />
Groundwater<br />
Supply Project<br />
Project‐Level<br />
Significance<br />
Determination<br />
Same<br />
Rationale for<br />
Significance<br />
Determination<br />
as PEIR? (Y/N)<br />
Notes<br />
(Explain difference in significance determinations<br />
and/or rationale for determinations)<br />
Air Quality (cont.)<br />
Impact 4.9‐4: Air pollutant emissions<br />
during project operation.<br />
Impact 4.9‐5: Odors generated during<br />
project operation.<br />
Impact 4.9‐6: Secondary emissions at<br />
power plants.<br />
Impact 4.9‐7: Conflict with<br />
implementation of applicable regional air<br />
quality plans addressing criteria air<br />
pollutants and state goals to limit<br />
greenhouse gas emissions.<br />
LS LS Y See Impact AQ‐5: Project operations would expose sensitive receptors to pollutant<br />
concentrations, but concentrations would not be substantial.<br />
LS LS Y See Impact AQ‐6: Project operations could create objectionable odors, but the odors would<br />
not affect a substantial number of people.<br />
LS LS N See Impact ME‐2: Project operations would not result in substantial adverse effects related to<br />
the long‐term use of large amounts of fuel or energy, or the use of these resources in a<br />
wasteful manner.<br />
For all WSIP facility improvement projects, the PEIR analysis assumed any incremental<br />
increase in power demand would not result in significant secondary air quality impacts. The<br />
EIR analysis is consistent with the PEIR analysis and estimated the increase in power<br />
demand from implementation of the project to be less than 1 percent. Thus, this PEIR impact<br />
was not specifically called‐out in the project‐level analysis.<br />
LS LS Y See Impact C‐GG‐1: The proposed project would generate greenhouse gas emissions, but not<br />
in levels that would result in a significant impact on the environment or conflict with any<br />
policy, plan, or regulation adopted for the purpose of reducing greenhouse gas emissions.<br />
Noise and Vibration<br />
Impact 4.10‐1: Disturbance from<br />
temporary construction‐related noise<br />
increases.<br />
PSU<br />
LSM (equivalent<br />
to PSM)<br />
N<br />
See Impact NO‐1: The proposed project would result in the exposure of persons to, or<br />
generation of, noise levels in excess of standards established in the local general plan or noise<br />
ordinance or result in a substantial temporary or periodic increase in ambient noise levels in<br />
the project vicinity above levels existing without the project.<br />
When the PEIR was prepared, the primary construction noise issue related to the<br />
Groundwater Supply Project pertained to 24‐hour drilling required as part of proposed well<br />
construction, which could exceed the sleep interference criterion if sensitive receptors were<br />
located within approximately 900 feet of well sites. Implementation of Noise controls<br />
PEIR Significance Categories<br />
N/A = Not Applicable or no impact<br />
LS = Less than Significant<br />
PSM = Potentially Significant impact with Mitigation<br />
SU = Significant and Unavoidable, even with mitigation<br />
PSU = Potentially Significant and Unavoidable, even with mitigation<br />
EIR Significance Categories<br />
NI = No Impact or not applicable (equivalent to N/A)<br />
LS = Less than Significant<br />
LSM = Less than Significant impact with Mitigation (equivalent to PSM)<br />
SU = Significant and Unavoidable impact, no feasible mitigation is available<br />
SUM = Significant and Unavoidable impact with Mitigation<br />
SFPUC <strong>San</strong> <strong>Francisco</strong> Groundwater Supply Project Draft EIR B‐16 March 2013<br />
Case No. 2008.1122E
Appendix B<br />
WSIP PEIR Consistency Analysis and Mitigation Measures, Applicability to the Proposed Project<br />
TABLE 1 (Continued)<br />
PEIR IMPACTS – CONSISTENCY REVIEW FOR THE GROUNDWATER SUPPLY PROJECT<br />
PEIR Impact<br />
PEIR Significance<br />
Determination for<br />
Groundwater<br />
Supply Project<br />
Project‐Level<br />
Significance<br />
Determination<br />
Same<br />
Rationale for<br />
Significance<br />
Determination<br />
as PEIR? (Y/N)<br />
Notes<br />
(Explain difference in significance determinations<br />
and/or rationale for determinations)<br />
Noise and Vibration (cont.)<br />
Impact 4.10‐1 (cont.) (Measure 4.10‐1a) could reduce this effect if setbacks were less than 300 feet, construction<br />
noise impacts would be potentially significant and unavoidable.<br />
Impact 4.10‐2: Temporary noise<br />
disturbance along construction haul<br />
routes.<br />
Impact 4.10‐3: Disturbance due to<br />
construction‐related vibration.<br />
PSU<br />
LSM (equivalent<br />
to PSM)<br />
N<br />
Project‐level review indicates that construction‐related noise associated with well facilities<br />
and pipeline segments south of Golden Gate Park would result in a noticeable but temporary<br />
increase in ambient noise levels. Implementation of Mitigation Measure M‐NO‐1, which<br />
requires adherence to <strong>San</strong> <strong>Francisco</strong> Noise Ordinance daytime threshold of 80 dBA at 100 feet<br />
(or 86 dBA at 50 feet) at all locations between 7 a.m. to 8 p.m. would reduce this impact to lessthan‐significant<br />
levels.<br />
See Impact NO‐1: The proposed project would result in the exposure of persons to, or<br />
generation of, noise levels in excess of standards established in the local general plan or noise<br />
ordinance or result in a substantial temporary or periodic increase in ambient noise levels in<br />
the project vicinity above levels existing without the project.<br />
The PEIR assumed that any nighttime truck operations greater than 1 truck per hour could<br />
exceed the sleep interference criterion during construction of the Groundwater Supply<br />
Project. Implementation Mitigation Measures 4.10‐2a (limiting hourly truck volumes during<br />
the day) and 4.10‐2b (restricting of nighttime truck operations) could reduce the impact but<br />
even with implementation of this measure, the impact would be potentially significant and<br />
unavoidable.<br />
The project‐level analysis determined that, with implementation of the proposed project,<br />
increases of up to 10 trucks per hour would be noticeable but less than significant. Thus,<br />
project haul trips would not result in a noticeable noise increase at sensitive receptors.<br />
Contrary to the PEIR analysis, no nighttime construction would occur.<br />
PSU LS N See Impact NO‐2: Construction activities would not result in substantial groundborne<br />
vibration or groundborne noise levels.<br />
The PEIR assumed that potentially significant vibration effects could result if there are any<br />
sensitive receptors located within 100 feet of proposed facilities but implementation of<br />
vibration controls (Measures 4.10‐31 and 4.10‐3b) would help reduce impacts. The analysis<br />
conservatively assumed that construction could occur during nighttime hours; therefore, the<br />
impact was considered potentially significant and unavoidable.<br />
PEIR Significance Categories<br />
N/A = Not Applicable or no impact<br />
LS = Less than Significant<br />
PSM = Potentially Significant impact with Mitigation<br />
SU = Significant and Unavoidable, even with mitigation<br />
PSU = Potentially Significant and Unavoidable, even with mitigation<br />
EIR Significance Categories<br />
NI = No Impact or not applicable (equivalent to N/A)<br />
LS = Less than Significant<br />
LSM = Less than Significant impact with Mitigation (equivalent to PSM)<br />
SU = Significant and Unavoidable impact, no feasible mitigation is available<br />
SUM = Significant and Unavoidable impact with Mitigation<br />
SFPUC <strong>San</strong> <strong>Francisco</strong> Groundwater Supply Project Draft EIR B‐17 March 2013<br />
Case No. 2008.1122E
Appendix B<br />
WSIP PEIR Consistency Analysis and Mitigation Measures, Applicability to the Proposed Project<br />
TABLE 1 (Continued)<br />
PEIR IMPACTS – CONSISTENCY REVIEW FOR THE GROUNDWATER SUPPLY PROJECT<br />
PEIR Impact<br />
PEIR Significance<br />
Determination for<br />
Groundwater<br />
Supply Project<br />
Project‐Level<br />
Significance<br />
Determination<br />
Same<br />
Rationale for<br />
Significance<br />
Determination<br />
as PEIR? (Y/N)<br />
Notes<br />
(Explain difference in significance determinations<br />
and/or rationale for determinations)<br />
Noise and Vibration (cont.)<br />
Impact 4.10‐3 (cont.) The project does not propose nighttime construction. The analysis assumed that caisson<br />
drilling could be required for drilling under the MUNI light rail lines at Taraval Street and<br />
Judah Street, which could generate vibration levels of approximately 0.04 PPV for receptors at 40<br />
feet. However, given the temporary nature of this work and because vibration levels would not<br />
exceed the building damage threshold of 0.2 PPV, this impact would be less than significant.<br />
Impact 4.10‐4: Disturbance due to longterm<br />
noise increases.<br />
LS LS Y See Impact NO‐3: Project operations would not result in the exposure of persons to, or<br />
generation of, noise levels in excess of standards or a substantial increase in ambient noise<br />
levels in the project vicinity.<br />
Public Services and Utilities<br />
Impact 4.11‐1: Potential temporary<br />
damage to or disruption of existing<br />
regional or local public utilities.<br />
PSM<br />
LSM (equivalent<br />
to PSM)<br />
Y<br />
See Impact UT‐3: Project construction would potentially result in a substantial adverse effect<br />
related to disruption of utility operations or accidental damage to existing utilities.<br />
Impact 4.11‐2: Temporary adverse effects<br />
on solid waste landfill capacity.<br />
PSM LS N See Impact UT‐1: Project construction would not result in a substantial adverse effect related<br />
to landfill capacity.<br />
The analysis presented in the PEIR was based on preliminary project information available at<br />
that time and no estimated volumes of waste were available. Therefore, the PEIR conservatively<br />
assumed that impacts on solid waste landfill capacity would be potentially significant.<br />
Updated project information developed since the preparation of the PEIR indicates that project<br />
construction activities would produce approximately 3,040 cubic yards of excess spoils.<br />
Through compliance with the <strong>San</strong> <strong>Francisco</strong> Construction and Demolition (C&D) Ordinance<br />
(Ordinance No. 27‐06), it is assumed that 65 percent of the excess spoils would be diverted from<br />
nearby landfill. The receiving landfill would receive up to 65 percent of the 1,065 cubic yards of<br />
construction and demolition debris. The project‐level analysis determined that there is adequate<br />
landfill capacity to accept the project’s construction waste. Therefore, impacts related to adverse<br />
effects on solid waste landfill capacity would be less than significant.<br />
PEIR Significance Categories<br />
N/A = Not Applicable or no impact<br />
LS = Less than Significant<br />
PSM = Potentially Significant impact with Mitigation<br />
SU = Significant and Unavoidable, even with mitigation<br />
PSU = Potentially Significant and Unavoidable, even with mitigation<br />
EIR Significance Categories<br />
NI = No Impact or not applicable (equivalent to N/A)<br />
LS = Less than Significant<br />
LSM = Less than Significant impact with Mitigation (equivalent to PSM)<br />
SU = Significant and Unavoidable impact, no feasible mitigation is available<br />
SUM = Significant and Unavoidable impact with Mitigation<br />
SFPUC <strong>San</strong> <strong>Francisco</strong> Groundwater Supply Project Draft EIR B‐18 March 2013<br />
Case No. 2008.1122E
Appendix B<br />
WSIP PEIR Consistency Analysis and Mitigation Measures, Applicability to the Proposed Project<br />
TABLE 1 (Continued)<br />
PEIR IMPACTS – CONSISTENCY REVIEW FOR THE GROUNDWATER SUPPLY PROJECT<br />
PEIR Impact<br />
PEIR Significance<br />
Determination for<br />
Groundwater<br />
Supply Project<br />
Project‐Level<br />
Significance<br />
Determination<br />
Same<br />
Rationale for<br />
Significance<br />
Determination<br />
as PEIR? (Y/N)<br />
Notes<br />
(Explain difference in significance determinations<br />
and/or rationale for determinations)<br />
Public Services and Utilities (cont.)<br />
Impact 4.11‐3: Impacts related to<br />
compliance with statutes and regulations<br />
related to solid waste.<br />
PSM LS N See Impact UT‐2: Project construction would not result in a substantial adverse effect related<br />
to compliance with federal, State, and local statutes and regulations pertaining to solid waste.<br />
The PEIR was conservative in assuming that large amounts of spoils could be disposed of<br />
off‐site for all WSIP projects and required preparation of a waste management or recycling<br />
plan to achieve waste diversion rates in compliance with applicable statutes and regulations.<br />
The project‐level analysis determined that compliance with the <strong>San</strong> <strong>Francisco</strong> C&D<br />
Ordinance (Ordinance No. 27‐06), which prohibits C&D materials from being placed into the<br />
trash or sent directly to a landfill, would ensure that the project properly recycles, reuses and<br />
disposes of the C&D materials that the project produces. Therefore, potential impacts related<br />
to compliance with federal, State, and local solid waste statutes and regulations would be<br />
less than significant.<br />
Impact 4.11‐4: Impacts related to the<br />
relocation of utilities.<br />
PSM<br />
LSM (equivalent<br />
to PSM)<br />
Y<br />
See Impact UT‐4: Project construction would potentially result in a substantial adverse effect<br />
related to the relocation of local utilities.<br />
Recreational Resources<br />
Impact 4.12‐1: Temporary conflicts with<br />
established recreational uses during<br />
construction.<br />
PSM LS N See Impact RE‐1: The proposed project’s construction would not increase the use of existing<br />
neighborhood and regional parks or other recreational facilities such that substantial physical<br />
deterioration of the facilities would occur or be accelerated or otherwise result in substantial<br />
degradation of existing recreational resources.<br />
The PEIR conservatively assumed that the Groundwater Supply Project could disrupt<br />
recreational uses at several CCSF locations, including the South Sunset and West Sunset<br />
Playgrounds, and the playground at Francis Scott Key School, Lake Merced, two sites in Golden<br />
Gate Park, the <strong>San</strong> <strong>Francisco</strong> Zoo, and Pine Lake. In the absence of detailed project information,<br />
this impact was identified as potentially significant. Implementation of SFPUC Construction<br />
Measures #1, #3, #5, and #6, mitigation measures identified in PEIR Chapter 6, and coordination<br />
with golf course/recreational facility managers (Measure 4.12‐1) would reduce the impact to a<br />
less‐than‐significant level.<br />
PEIR Significance Categories<br />
N/A = Not Applicable or no impact<br />
LS = Less than Significant<br />
PSM = Potentially Significant impact with Mitigation<br />
SU = Significant and Unavoidable, even with mitigation<br />
PSU = Potentially Significant and Unavoidable, even with mitigation<br />
EIR Significance Categories<br />
NI = No Impact or not applicable (equivalent to N/A)<br />
LS = Less than Significant<br />
LSM = Less than Significant impact with Mitigation (equivalent to PSM)<br />
SU = Significant and Unavoidable impact, no feasible mitigation is available<br />
SUM = Significant and Unavoidable impact with Mitigation<br />
SFPUC <strong>San</strong> <strong>Francisco</strong> Groundwater Supply Project Draft EIR B‐19 March 2013<br />
Case No. 2008.1122E
Appendix B<br />
WSIP PEIR Consistency Analysis and Mitigation Measures, Applicability to the Proposed Project<br />
TABLE 1 (Continued)<br />
PEIR IMPACTS – CONSISTENCY REVIEW FOR THE GROUNDWATER SUPPLY PROJECT<br />
PEIR Impact<br />
PEIR Significance<br />
Determination for<br />
Groundwater<br />
Supply Project<br />
Project‐Level<br />
Significance<br />
Determination<br />
Same<br />
Rationale for<br />
Significance<br />
Determination<br />
as PEIR? (Y/N)<br />
Notes<br />
(Explain difference in significance determinations<br />
and/or rationale for determinations)<br />
Recreational Resources (cont.)<br />
Impact 4.12‐1 (cont.) The project‐level review concluded that although the proposed well facilities would be located<br />
within and immediately adjacent to parks and other recreation resources, construction would<br />
not result in removal or deterioration of such uses. The project‐level review also indicated that<br />
access within the western Golden Gate Park would be slightly altered during project<br />
construction through the temporary restrictions and closures of roads and bicycle lanes but<br />
since construction activities would occur on weekdays only and any open trenches would be<br />
covered during non‐work hours, the proposed project would not conflict with the high<br />
recreation use on weekend days. Therefore, this impact would be less than significant.<br />
Impact 4.12‐2: Conflicts with established<br />
recreational uses due to facility siting and<br />
project operation.<br />
PSM LS N See Impact RE‐2: The proposed project’s operation would not increase the use of existing<br />
neighborhood and regional parks or other recreational facilities such that substantial physical<br />
deterioration of the facilities would occur or be accelerated.<br />
The PEIR analysis assumed that the groundwater wells at the South Sunset Playground and<br />
West Sunset Playground would result in potentially significant impacts on recreational<br />
resources but implementation of architectural design, landscaping, and tree removal measures<br />
(Measures 4.3‐4a, 4.3‐4b, 4.3‐4c, and 4.3‐4d), as well as appropriate siting of proposed facilities<br />
(Measure 4.12‐2), would reduce potential impacts to a less‐than‐significant level.<br />
The project‐level analysis indicates that the South Sunset and West Sunset well facilities would<br />
not be located on active play fields at the South Sunset or West Sunset Playgrounds. Other well<br />
facilities would also not be located in high visitor use areas of Golden Gate Park. For these<br />
reasons, potential increases in the use of existing neighborhood and regional parks or other<br />
recreational facilities would be less than significant.<br />
Agricultural Resources<br />
Impact 4.13‐1: Temporary conflicts with<br />
established agricultural resources.<br />
N/A<br />
NI (equivalent to<br />
NA)<br />
Y<br />
As described in Section 5.19 of the Groundwater Supply Project EIR, the project would not<br />
result in impacts related to agricultural resources.<br />
Impact 4.13‐2: Conversion of farmlands to<br />
nonagricultural uses.<br />
N/A<br />
NI (equivalent to<br />
N/A)<br />
Y<br />
As described in Section 5.19 of the Groundwater Supply Project EIR, the project would not<br />
result in impacts related to agricultural resources.<br />
PEIR Significance Categories<br />
N/A = Not Applicable or no impact<br />
LS = Less than Significant<br />
PSM = Potentially Significant impact with Mitigation<br />
SU = Significant and Unavoidable, even with mitigation<br />
PSU = Potentially Significant and Unavoidable, even with mitigation<br />
EIR Significance Categories<br />
NI = No Impact or not applicable (equivalent to N/A)<br />
LS = Less than Significant<br />
LSM = Less than Significant impact with Mitigation (equivalent to PSM)<br />
SU = Significant and Unavoidable impact, no feasible mitigation is available<br />
SUM = Significant and Unavoidable impact with Mitigation<br />
SFPUC <strong>San</strong> <strong>Francisco</strong> Groundwater Supply Project Draft EIR B‐20 March 2013<br />
Case No. 2008.1122E
Appendix B<br />
WSIP PEIR Consistency Analysis and Mitigation Measures, Applicability to the Proposed Project<br />
TABLE 1 (Continued)<br />
PEIR IMPACTS – CONSISTENCY REVIEW FOR THE GROUNDWATER SUPPLY PROJECT<br />
PEIR Impact<br />
PEIR Significance<br />
Determination for<br />
Groundwater<br />
Supply Project<br />
Project‐Level<br />
Significance<br />
Determination<br />
Same<br />
Rationale for<br />
Significance<br />
Determination<br />
as PEIR? (Y/N)<br />
Notes<br />
(Explain difference in significance determinations<br />
and/or rationale for determinations)<br />
Hazards<br />
Impact 4.14‐1: Potential to encounter<br />
hazardous materials in soil or<br />
groundwater.<br />
Impact 4.14‐2: Exposure to naturally<br />
occurring asbestos during construction.<br />
Impact 4.14‐3: Risk of fires during<br />
construction.<br />
PSM<br />
LSM (equivalent<br />
to PSM)<br />
Y<br />
See Impact HZ‐2: Project construction would possibly result in a significant hazard to the<br />
public or the environment through reasonably foreseeable upset and accident conditions<br />
involving the release of hazardous materials present in soil and groundwater.<br />
Based on a voluntary study performed on behalf of the SFPUC in 2004, the PEIR assumed that<br />
raising the water level in Lake Merced under the Groundwater Supply Project would inundate<br />
a portion of the Pacific Road and Gun Club property and could result in lead and arsenic<br />
concentrations that exceed drinking water standards and cause adverse effects on aquatic<br />
organisms. For this reason, environmental effects were considered potentially significant.<br />
Lake Merced water levels would not be raised under the proposed project. The project‐level<br />
analysis was based on information obtained from site investigation reports and geotechnical<br />
engineering reports prepared subsequent to publication of the WSIP PEIR. Similar to the<br />
PEIR, the project‐level analysis determined that the potential hazard to construction workers<br />
and/or the environment from exposure to known elevated lead levels in soil at the North Lake<br />
and Central Pump Station well facility sites would be potentially significant. Implementation of<br />
Mitigation Measures M‐HZ‐2a through M‐HZ‐2c, Preconstruction Hazardous Materials<br />
Assessment, Health and Safety Plan, and Hazardous Materials Management Plan, would<br />
reduce this impact to a less‐than‐significant level.<br />
LS LS Y See Impact HZ‐1: Project construction would not result in a significant hazard to the public<br />
or the environment through the routine transport, use, or disposal of hazardous materials or<br />
result in reasonably foreseeable upset and accident conditions involving the release of<br />
hazardous construction materials to the environment.<br />
LS N/A N At the time the WSIP PEIR was prepared, the locations of specific Groundwater Supply<br />
Project components had not been determined. Therefore, the PEIR conservatively assumed<br />
that the project could be located within high fire hazard zones in <strong>San</strong> <strong>Francisco</strong>.<br />
As described in Section 5.17.3 of the EIR, the project‐level analysis has determined that the<br />
project sites are not within areas designated as very high or high fire hazard zones. Thus, the<br />
significance criterion related to exposing people or structures to a significant risk of loss,<br />
injury, or death involving fires is not applicable.<br />
PEIR Significance Categories<br />
N/A = Not Applicable or no impact<br />
LS = Less than Significant<br />
PSM = Potentially Significant impact with Mitigation<br />
SU = Significant and Unavoidable, even with mitigation<br />
PSU = Potentially Significant and Unavoidable, even with mitigation<br />
EIR Significance Categories<br />
NI = No Impact or not applicable (equivalent to N/A)<br />
LS = Less than Significant<br />
LSM = Less than Significant impact with Mitigation (equivalent to PSM)<br />
SU = Significant and Unavoidable impact, no feasible mitigation is available<br />
SUM = Significant and Unavoidable impact with Mitigation<br />
SFPUC <strong>San</strong> <strong>Francisco</strong> Groundwater Supply Project Draft EIR B‐21 March 2013<br />
Case No. 2008.1122E
Appendix B<br />
WSIP PEIR Consistency Analysis and Mitigation Measures, Applicability to the Proposed Project<br />
TABLE 1 (Continued)<br />
PEIR IMPACTS – CONSISTENCY REVIEW FOR THE GROUNDWATER SUPPLY PROJECT<br />
PEIR Impact<br />
PEIR Significance<br />
Determination for<br />
Groundwater<br />
Supply Project<br />
Project‐Level<br />
Significance<br />
Determination<br />
Same<br />
Rationale for<br />
Significance<br />
Determination<br />
as PEIR? (Y/N)<br />
Notes<br />
(Explain difference in significance determinations<br />
and/or rationale for determinations)<br />
Hazards (cont.)<br />
Impact 4.14‐4: Gassy conditions in tunnels. LS NI N The PEIR analysis was based on a project design that could require tunneling using jack‐andbore<br />
construction at roadway crossings.<br />
Impact 4.14‐5: Exposure to hazardous<br />
building materials.<br />
Impact 4.14‐6: Accidental hazardous<br />
materials release from construction<br />
equipment.<br />
Impact 4.14‐7: Increased use of hazardous<br />
materials during operation.<br />
Impact 4.14‐8: Emission or use of<br />
hazardous materials within 1/4 mile of a<br />
school.<br />
Updated project design information indicates that the project would not involve jack‐andbore<br />
construction; rather, the project would entail trenchless construction (auger boring) to<br />
tunnel under MUNI rail lines.<br />
PSM LS N See Impact HZ‐1: Project construction would not result in a significant hazard to the public or<br />
the environment through the routine transport, use, or disposal of hazardous materials or result<br />
in reasonably foreseeable upset and accident conditions involving the release of hazardous<br />
construction materials to the environment.<br />
At the time that the WSIP PEIR was prepared, the need for demolition under the Groundwater<br />
Supply Project had not been determined. Therefore, the PEIR conservatively assumed that<br />
demolition could be required and the impact was considered potentially significant.<br />
Updated project design information indicates that the proposed project would require<br />
demolition of existing structures at the North Lake and South Windmill Replacement well<br />
facility sites. However, analytical testing of building materials indicated that asbestoscontaining<br />
materials are not present and lead concentrations in paint are below the U.S.<br />
<strong>Department</strong> of Housing and Urban Development definition of lead‐based paint. Further,<br />
through compliance with regulations, impacts related to demolition, transportation and<br />
disposal of hazardous building materials would be less than significant.<br />
LS LS Y See Impact HZ‐1: Project construction would not result in a significant hazard to the public<br />
or the environment through the routine transport, use, or disposal of hazardous materials or<br />
result in reasonably foreseeable upset and accident conditions involving the release of<br />
hazardous construction materials to the environment.<br />
LS LS Y See Impact HZ‐5: Project operations would not create a significant hazard to the public or the<br />
environment through the routine transport, use, or disposal of hazardous materials.<br />
LS LS Y See Impact HZ‐6: Project operations would not cause hazardous emissions or handle acutely<br />
hazardous materials within ¼ mile of a school.<br />
PEIR Significance Categories<br />
N/A = Not Applicable or no impact<br />
LS = Less than Significant<br />
PSM = Potentially Significant impact with Mitigation<br />
SU = Significant and Unavoidable, even with mitigation<br />
PSU = Potentially Significant and Unavoidable, even with mitigation<br />
EIR Significance Categories<br />
NI = No Impact or not applicable (equivalent to N/A)<br />
LS = Less than Significant<br />
LSM = Less than Significant impact with Mitigation (equivalent to PSM)<br />
SU = Significant and Unavoidable impact, no feasible mitigation is available<br />
SUM = Significant and Unavoidable impact with Mitigation<br />
SFPUC <strong>San</strong> <strong>Francisco</strong> Groundwater Supply Project Draft EIR B‐22 March 2013<br />
Case No. 2008.1122E
Appendix B<br />
WSIP PEIR Consistency Analysis and Mitigation Measures, Applicability to the Proposed Project<br />
TABLE 1 (Continued)<br />
PEIR IMPACTS – CONSISTENCY REVIEW FOR THE GROUNDWATER SUPPLY PROJECT<br />
PEIR Impact<br />
PEIR Significance<br />
Determination for<br />
Groundwater<br />
Supply Project<br />
Project‐Level<br />
Significance<br />
Determination<br />
Same<br />
Rationale for<br />
Significance<br />
Determination<br />
as PEIR? (Y/N)<br />
Notes<br />
(Explain difference in significance determinations<br />
and/or rationale for determinations)<br />
Energy Resources<br />
Impact 4.15‐1: Construction‐related<br />
energy use.<br />
Impact 4.15‐2: Long‐term energy use<br />
during operation.<br />
PSM LS Y See Impact ME‐1: Project construction would not result in substantial adverse effects related<br />
to the use of large amounts of fuel or energy, or the use of these resources in a wasteful<br />
manner.<br />
The PEIR analysis assumed that during construction activities, fuel use for construction<br />
activities, including worker commute trips, the excessive idling and other inefficient site<br />
operations could result in the wasteful use of fuels, a potentially significant impact.<br />
Implementation of exhaust control measures specified in PEIR Section 4.9, Air Quality, and<br />
exhaust control measures (Measures 4.9‐1b and 4.9‐1d) would reduce the impact to less‐thansignificant<br />
levels.<br />
The project‐level analysis also assumed that excessive idling and other inefficient site<br />
operations could result in the wasteful use of fuels. Implementation of SFPUC actions<br />
described in Section 3.4.5, SFPUC Standard Construction Measures and Greenhouse Gas<br />
Reduction Measures and compliance with the Airborne Toxic Control Measure (ATCM) to<br />
Limit Diesel‐Fueled Commercial Motor Vehicle Idling would ensure that this potential energy<br />
impact is less than significant.<br />
PSM LS N See Impact ME‐2: Project operations would not result in substantial adverse effects related to<br />
the long‐term use of large amounts of fuel or energy, or the use of these resources in a<br />
wasteful manner.<br />
The PEIR estimated that the Groundwater Supply Project would require up to 5,100,000 kWh<br />
for project operations. The PEIR determined that implementation of this project in addition<br />
to other WSIP projects in the <strong>San</strong> <strong>Francisco</strong> region (e.g., <strong>San</strong> Andreas Pipeline 3 Installation<br />
and Recycled Water Project) would increase energy use in the <strong>San</strong> <strong>Francisco</strong> region by<br />
approximately 87 percent, a potentially significant impact.<br />
Similar to the WSIP PEIR, the project‐level analysis determined that the proposed project<br />
would require an estimated total of 4,994,000 kWh per year. Rather than comparing this<br />
usage to <strong>San</strong> <strong>Francisco</strong> energy usage, the analysis focused on the project’s effect on energy<br />
produced by the Hetch Hetchy system. Since the project would constitute approximately 0.3<br />
percent of the total energy produced by the Hetch Hetchy system, this impact would be less<br />
than significant.<br />
PEIR Significance Categories<br />
N/A = Not Applicable or no impact<br />
LS = Less than Significant<br />
PSM = Potentially Significant impact with Mitigation<br />
SU = Significant and Unavoidable, even with mitigation<br />
PSU = Potentially Significant and Unavoidable, even with mitigation<br />
EIR Significance Categories<br />
NI = No Impact or not applicable (equivalent to N/A)<br />
LS = Less than Significant<br />
LSM = Less than Significant impact with Mitigation (equivalent to PSM)<br />
SU = Significant and Unavoidable impact, no feasible mitigation is available<br />
SUM = Significant and Unavoidable impact with Mitigation<br />
SFPUC <strong>San</strong> <strong>Francisco</strong> Groundwater Supply Project Draft EIR B‐23 March 2013<br />
Case No. 2008.1122E
Appendix B<br />
WSIP PEIR Consistency Analysis and Mitigation Measures, Applicability to the Proposed Project<br />
TABLE 1 (Continued)<br />
PEIR IMPACTS – CONSISTENCY REVIEW FOR THE GROUNDWATER SUPPLY PROJECT<br />
PEIR Impact<br />
PEIR Significance<br />
Determination for<br />
Groundwater<br />
Supply Project<br />
Project‐Level<br />
Significance<br />
Determination<br />
Same<br />
Rationale for<br />
Significance<br />
Determination<br />
as PEIR? (Y/N)<br />
Notes<br />
(Explain difference in significance determinations<br />
and/or rationale for determinations)<br />
Collective Facilities Impacts (Consider these to be potential cumulative impacts)<br />
Impact 4.16‐1a: Collective temporary and<br />
permanent impacts on existing land uses<br />
in the vicinity of proposed facility sites.<br />
Impact 4.16‐1b: Collective temporary and<br />
permanent impacts on the visual<br />
character of the surrounding area.<br />
Impact 4.16‐2: Collective exposure of<br />
people or structures to geologic and<br />
seismic hazards.<br />
Impact 4.16‐3: Collective WSIP impacts<br />
related to flooding hazards and the<br />
degradation of surface waters.<br />
Impact 4.16‐4: Collective loss of sensitive<br />
biological resources.<br />
Impact 4.16‐5: Collective increase in<br />
impacts related to archaeological,<br />
paleontological, and historic resources.<br />
Impact 4.16‐6: Collective traffic increases<br />
on local and regional roads.<br />
Impact 4.16‐7: Collective increases in<br />
construction and operational emissions in<br />
the region.<br />
Impact 4.16‐8: Collective increases in<br />
construction‐related and operational<br />
noise.<br />
N/A N/A N/A<br />
LSM N/A N/A<br />
N/A N/A N/A<br />
LSM N/A N/A<br />
N/A N/A N/A<br />
N/A N/A N/A<br />
PSM N/A N/A<br />
LS N/A N/A<br />
PSU N/A N/A<br />
PEIR Significance Categories<br />
N/A = Not Applicable or no impact<br />
LS = Less than Significant<br />
PSM = Potentially Significant impact with Mitigation<br />
SU = Significant and Unavoidable, even with mitigation<br />
PSU = Potentially Significant and Unavoidable, even with mitigation<br />
EIR Significance Categories<br />
NI = No Impact or not applicable (equivalent to N/A)<br />
LS = Less than Significant<br />
LSM = Less than Significant impact with Mitigation (equivalent to PSM)<br />
SU = Significant and Unavoidable impact, no feasible mitigation is available<br />
SUM = Significant and Unavoidable impact with Mitigation<br />
SFPUC <strong>San</strong> <strong>Francisco</strong> Groundwater Supply Project Draft EIR B‐24 March 2013<br />
Case No. 2008.1122E
Appendix B<br />
WSIP PEIR Consistency Analysis and Mitigation Measures, Applicability to the Proposed Project<br />
TABLE 1 (Continued)<br />
PEIR IMPACTS – CONSISTENCY REVIEW FOR THE GROUNDWATER SUPPLY PROJECT<br />
PEIR Impact<br />
PEIR Significance<br />
Determination for<br />
Groundwater<br />
Supply Project<br />
Project‐Level<br />
Significance<br />
Determination<br />
Same<br />
Rationale for<br />
Significance<br />
Determination<br />
as PEIR? (Y/N)<br />
Notes<br />
(Explain difference in significance determinations<br />
and/or rationale for determinations)<br />
Collective Facilities Impacts (Consider these to be potential cumulative impacts) (cont.)<br />
Impact 4.16‐9: Collective impacts on<br />
utilities and landfill capacity.<br />
Impact 4.16‐10: Collective effects on<br />
recreational resources during<br />
construction.<br />
Impact 4.16‐11: Collective conversion of<br />
farmland to nonagricultural uses.<br />
Impact 4.16‐12: Collective effects related<br />
to hazardous conditions and exposure to<br />
or release of hazardous materials.<br />
Impact 4.16‐13: Collective increases in the<br />
use of nonrenewable energy resources<br />
during operation.<br />
N/A N/A N/A<br />
LSM N/A N/A<br />
N/A N/A N/A<br />
LSM N/A N/A<br />
LSM N/A N/A<br />
Cumulative Facilities Impacts<br />
Impact 4.17‐1: Cumulative disruption of<br />
established communities, changes in<br />
existing land use patterns, and impacts on<br />
the existing visual character.<br />
LS<br />
LS/LSM<br />
(equivalent to<br />
PSM)<br />
Y<br />
See Section 5.2, Impact C‐LU: Implementation of the proposed project would not result in<br />
a cumulatively considerable contribution to a significant cumulative impact on the<br />
existing character of the vicinity. Also see Section 5.3, Impact C‐AE: The proposed project<br />
would have a cumulatively considerable contribution to a significant cumulative aesthetic<br />
impact.<br />
The PEIR determined that cumulative development in the vicinity of WSIP projects could<br />
disrupt established communities and significantly alter existing land use patterns. However,<br />
implementation of SFPUC construction measures and PEIR Measure 4.3‐2 would ensure that<br />
the WSIP’s contribution to cumulative land use and visual impacts are less than significant.<br />
The EIR analysis determined that with operation of the North Westside Groundwater Basin<br />
Management Plan, Daly City’s proposed Vista Grande Drainage Basin Improvement Project,<br />
PEIR Significance Categories<br />
N/A = Not Applicable or no impact<br />
LS = Less than Significant<br />
PSM = Potentially Significant impact with Mitigation<br />
SU = Significant and Unavoidable, even with mitigation<br />
PSU = Potentially Significant and Unavoidable, even with mitigation<br />
EIR Significance Categories<br />
NI = No Impact or not applicable (equivalent to N/A)<br />
LS = Less than Significant<br />
LSM = Less than Significant impact with Mitigation (equivalent to PSM)<br />
SU = Significant and Unavoidable impact, no feasible mitigation is available<br />
SUM = Significant and Unavoidable impact with Mitigation<br />
SFPUC <strong>San</strong> <strong>Francisco</strong> Groundwater Supply Project Draft EIR B‐25 March 2013<br />
Case No. 2008.1122E
Appendix B<br />
WSIP PEIR Consistency Analysis and Mitigation Measures, Applicability to the Proposed Project<br />
TABLE 1 (Continued)<br />
PEIR IMPACTS – CONSISTENCY REVIEW FOR THE GROUNDWATER SUPPLY PROJECT<br />
PEIR Impact<br />
PEIR Significance<br />
Determination for<br />
Groundwater<br />
Supply Project<br />
Project‐Level<br />
Significance<br />
Determination<br />
Same<br />
Rationale for<br />
Significance<br />
Determination<br />
as PEIR? (Y/N)<br />
Notes<br />
(Explain difference in significance determinations<br />
and/or rationale for determinations)<br />
Cumulative Facilities Impacts (cont.)<br />
Impact 4.17‐1 (cont.) SFPUC’s proposed Regional Groundwater Storage and Recovery project, as well as the<br />
proposed project, estimated Lake Merced water levels are predicted to be mostly higher than<br />
under modeled existing conditions. During some years, however, water levels are predicted<br />
to be less than levels that would otherwise be expected under modeled existing conditions<br />
and Impound Lake would likely be substantially reduced. Groundwater pumping associated<br />
with the proposed project and the Regional Groundwater Storage and Recovery Project<br />
would worsen the hydrologic conditions and the scenic qualities of Lake Merced. However,<br />
implementation of Mitigation Measure M‐HY‐9 (Lake‐Level Management for Lake Merced),<br />
would ensure that the proposed project’s contribution to this cumulative impact would not<br />
be cumulatively considerable.<br />
Impact 4.17‐2: Cumulative exposure of<br />
people or structures to geologic and<br />
seismic hazards.<br />
LS LS Y See Section 5.15, Impact C‐GE: Project implementation would not result in cumulatively<br />
considerable impacts related to geology, soils, and seismicity.<br />
The PEIR determined that cumulative geologic and seismic impacts would be site‐specific<br />
and would be less than significant or mitigated through implementation of PEIR Measures<br />
4.4‐1, 4.4‐4, and 4.4‐9.<br />
Impact 4.17‐3: Cumulative impacts<br />
related to the degradation of water<br />
quality, alteration of drainage patterns,<br />
increased surface runoff, and flooding<br />
hazards.<br />
B/LS<br />
LS/LSM<br />
(equivalent to<br />
PSM)<br />
N<br />
See Section 5.16, Impacts C‐HY‐1 through C‐HY‐7.<br />
The PEIR determined that the WSIP projects in conjunction with other projects would not<br />
result in cumulative water quality and hydrology effects related to increased erosion and<br />
sedimentation, construction‐related discharges of treated water or groundwater produced<br />
during dewatering, or operational discharges of treated water with implementation of<br />
proper BMPs for temporary and permanent erosion control.<br />
The project‐level analysis evaluated cumulative hydrology and water quality impacts due to<br />
facility construction, operation and maintenance activities as well as the cumulative effects<br />
related to groundwater pumping (including well interference, subsidence, seawater<br />
intrusion, and water quality effects on beneficial uses of Lake Merced, and groundwater<br />
depletion). The project‐level analysis determined that the project’s contribution to most<br />
PEIR Significance Categories<br />
N/A = Not Applicable or no impact<br />
LS = Less than Significant<br />
PSM = Potentially Significant impact with Mitigation<br />
SU = Significant and Unavoidable, even with mitigation<br />
PSU = Potentially Significant and Unavoidable, even with mitigation<br />
EIR Significance Categories<br />
NI = No Impact or not applicable (equivalent to N/A)<br />
LS = Less than Significant<br />
LSM = Less than Significant impact with Mitigation (equivalent to PSM)<br />
SU = Significant and Unavoidable impact, no feasible mitigation is available<br />
SUM = Significant and Unavoidable impact with Mitigation<br />
SFPUC <strong>San</strong> <strong>Francisco</strong> Groundwater Supply Project Draft EIR B‐26 March 2013<br />
Case No. 2008.1122E
Appendix B<br />
WSIP PEIR Consistency Analysis and Mitigation Measures, Applicability to the Proposed Project<br />
TABLE 1 (Continued)<br />
PEIR IMPACTS – CONSISTENCY REVIEW FOR THE GROUNDWATER SUPPLY PROJECT<br />
PEIR Impact<br />
PEIR Significance<br />
Determination for<br />
Groundwater<br />
Supply Project<br />
Project‐Level<br />
Significance<br />
Determination<br />
Same<br />
Rationale for<br />
Significance<br />
Determination<br />
as PEIR? (Y/N)<br />
Notes<br />
(Explain difference in significance determinations<br />
and/or rationale for determinations)<br />
Cumulative Facilities Impacts (cont.)<br />
Impact 4.17‐3 (cont.) cumulative hydrology and water quality impacts would not be cumulatively considerable.<br />
However, as described in Impact C‐HY‐4, the proposed project could contribute to<br />
cumulative impacts related to seawater intrusion but implementation of Mitigation Measures<br />
M‐HY‐8a (Expand Coastal Monitoring Network), M‐HY‐8b (Continuous Groundwater<br />
Monitoring in the Primary Production Aquifer), and M‐HY‐8c (Adaptive Management<br />
Program for Seawater Intrusion) would ensure that that chloride concentrations are kept<br />
below 250 mg/L at any coastal monitoring location. Regarding the project’s contribution to<br />
cumulative water quality impacts that would affect beneficial uses of Lake Merced (see<br />
Impact C‐HY‐5), the project as well as the Daly City Vista Grande Drainage Basin<br />
Improvement Project and the Regional Groundwater Storage project could potentially cause<br />
increased eutrophication of Lake Merced and adverse effects on other water quality<br />
parameters due do water level declines. Implementation of Mitigation Measure M‐HY‐9<br />
(Lake‐Level Management for Lake Merced) would ensure that the project’s contribution to<br />
this impact would not be cumulatively considerable.<br />
Impact 4.17‐4: Cumulative loss of<br />
sensitive biological resources.<br />
LS LSM Y See Section 5.15, Impact C‐BI: The proposed project would result in cumulative impacts<br />
related to special‐status species, wetlands, waters of the United States, riparian habitat,<br />
wildlife nursery sites, and compliance with local policies and ordinances protecting<br />
biological resources.<br />
The PEIR determined that cumulative impacts on biological resources would be less than<br />
significant through implementation of PEIR Measures 4.6‐1 through 4.6‐3as well as Measure<br />
4.16‐4a.<br />
The project‐level analysis determined that the proposed project and cumulative projects (e.g.,<br />
Murphy Windmill/Millwright’s Cottage Restoration, the Beach Chalet Athletic Fields<br />
Renovation Project, the Parkmerced Project, and the <strong>San</strong> <strong>Francisco</strong> Botanical Garden<br />
Sustainable Gardening Project; and construction of new pipelines and facilities associated with<br />
the <strong>San</strong> <strong>Francisco</strong> Westside Recycled Water Project, and the Lake Merced Pump Station Essential<br />
Upgrade Project) could result in potentially significant cumulative impacts on biological<br />
resources. Implementation of Mitigation Measures M‐BI‐1a, M‐BI‐1b, M‐BI‐1c, M‐BI‐3 would<br />
ensure that the project’s contribution to impacts on sensitive species and trees would not be<br />
PEIR Significance Categories<br />
N/A = Not Applicable or no impact<br />
LS = Less than Significant<br />
PSM = Potentially Significant impact with Mitigation<br />
SU = Significant and Unavoidable, even with mitigation<br />
PSU = Potentially Significant and Unavoidable, even with mitigation<br />
EIR Significance Categories<br />
NI = No Impact or not applicable (equivalent to N/A)<br />
LS = Less than Significant<br />
LSM = Less than Significant impact with Mitigation (equivalent to PSM)<br />
SU = Significant and Unavoidable impact, no feasible mitigation is available<br />
SUM = Significant and Unavoidable impact with Mitigation<br />
SFPUC <strong>San</strong> <strong>Francisco</strong> Groundwater Supply Project Draft EIR B‐27 March 2013<br />
Case No. 2008.1122E
Appendix B<br />
WSIP PEIR Consistency Analysis and Mitigation Measures, Applicability to the Proposed Project<br />
TABLE 1 (Continued)<br />
PEIR IMPACTS – CONSISTENCY REVIEW FOR THE GROUNDWATER SUPPLY PROJECT<br />
PEIR Impact<br />
PEIR Significance<br />
Determination for<br />
Groundwater<br />
Supply Project<br />
Project‐Level<br />
Significance<br />
Determination<br />
Same<br />
Rationale for<br />
Significance<br />
Determination<br />
as PEIR? (Y/N)<br />
Notes<br />
(Explain difference in significance determinations<br />
and/or rationale for determinations)<br />
Cumulative Facilities Impacts (cont.)<br />
Impact 4.17‐4 (cont.) cumulatively considerable. The project‐level analysis also evaluated cumulative impacts related<br />
to groundwater pumping operations. Pumping associated with the Regional Groundwater<br />
Storage and Recovery Project and the proposed project would cause lake levels to fall and could<br />
decrease water quality in Lake Merced. Implementation of Mitigation Measure M‐HY‐9 (Lake‐<br />
Level Management for Lake Merced) would ensure that the project’s contribution to cumulative<br />
impacts on fisheries and fish habitat would not be cumulatively considerable.<br />
Impact 4.17‐5: Cumulative increase in<br />
impacts on archaeological, paleontological,<br />
and historical resources.<br />
PSU LSM N See Section 5.5, Impact C‐CP: The proposed project would possibly result in cumulatively<br />
considerable impacts related to historical, archaeological, or paleontological resources or<br />
human remains.<br />
The PEIR conservatively assumed that, in combination, projects in the Sunol Valley and<br />
Peninsula regions could result in significant impacts on individual historical resources or on<br />
potential historic districts (if historic districts were determined to be present). The PEIR did not<br />
describe cumulative impacts on cultural resources in the <strong>San</strong> <strong>Francisco</strong> region.<br />
The project‐level analysis determined that the proposed project as well as adjacent cumulative<br />
projects including the Beach Chalet Athletic Fields Renovation Project, the Murphy Windmill/<br />
Millwrightʹs Cottage Restoration Project, and the <strong>San</strong> <strong>Francisco</strong> Botanical Gardens Center for<br />
Sustainable Gardening Project, could encounter previously unrecorded archaeological<br />
resources or human remains, a potentially significant cumulative impact. Implementation of<br />
Mitigation Measures M‐CP‐2a, M‐CP‐4, and M‐CP‐2b would ensure that the project’s<br />
contribution to this cumulative impact would not be cumulatively considerable.<br />
Impact 4.17‐6: Cumulative traffic increases<br />
on local and regional roads.<br />
PSU LS N See Section 5.6, Impact C‐TR: The proposed project, in combination with past, present, and<br />
reasonably foreseeable future projects, would not substantially contribute to cumulative<br />
traffic increases on local and regional roads.<br />
The PEIR cumulative analysis determined that significant cumulative impacts could occur<br />
during concurrent construction of nearby projects, including non‐SFPUC projects, and based on<br />
the conservative assumption that interagency coordination of construction traffic might not<br />
always be possible; this impact was determined to be potentially significant and unavoidable.<br />
PEIR Significance Categories<br />
N/A = Not Applicable or no impact<br />
LS = Less than Significant<br />
PSM = Potentially Significant impact with Mitigation<br />
SU = Significant and Unavoidable, even with mitigation<br />
PSU = Potentially Significant and Unavoidable, even with mitigation<br />
EIR Significance Categories<br />
NI = No Impact or not applicable (equivalent to N/A)<br />
LS = Less than Significant<br />
LSM = Less than Significant impact with Mitigation (equivalent to PSM)<br />
SU = Significant and Unavoidable impact, no feasible mitigation is available<br />
SUM = Significant and Unavoidable impact with Mitigation<br />
SFPUC <strong>San</strong> <strong>Francisco</strong> Groundwater Supply Project Draft EIR B‐28 March 2013<br />
Case No. 2008.1122E
Appendix B<br />
WSIP PEIR Consistency Analysis and Mitigation Measures, Applicability to the Proposed Project<br />
TABLE 1 (Continued)<br />
PEIR IMPACTS – CONSISTENCY REVIEW FOR THE GROUNDWATER SUPPLY PROJECT<br />
PEIR Impact<br />
PEIR Significance<br />
Determination for<br />
Groundwater<br />
Supply Project<br />
Project‐Level<br />
Significance<br />
Determination<br />
Same<br />
Rationale for<br />
Significance<br />
Determination<br />
as PEIR? (Y/N)<br />
Notes<br />
(Explain difference in significance determinations<br />
and/or rationale for determinations)<br />
Cumulative Facilities Impacts (cont.)<br />
Impact 4.17‐6 (cont.) The project‐level analysis determined that the proposed project in combination with<br />
construction activities from cumulative projects such as the Parkmerced Project, <strong>San</strong> <strong>Francisco</strong><br />
Botanical Gardens: Center for Sustainable Gardening, Beach Chalet Athletic Fields Renovation<br />
Project, <strong>San</strong> <strong>Francisco</strong> Westside Recycled Water Project, Vista Grande Drainage Basin<br />
Improvement Project, could result in temporary and intermittent travel lane or road closures<br />
near work sites and increased construction traffic on local and regional roadways. However,<br />
the Construction Management Plan would require the SFPUC to engage in ongoing<br />
coordination with the appropriate jurisdictional agencies through the TASC to address any<br />
potential cumulative transportation impacts. Thus, implementation of this plan would<br />
ensure that the project’s contribution to this cumulative impact would not be cumulatively<br />
considerable.<br />
Impact 4.17‐7: Cumulative increases in<br />
construction and/or operational emissions<br />
in the region.<br />
PSU LS N See Section 5.8, Impact C‐AQ: Construction and operation of the proposed project could result<br />
in cumulative air quality impacts associated with criteria pollutant and precursor emissions and<br />
health risks, but the project’s contribution would not be cumulatively considerable.<br />
The PEIR determined that cumulative impacts due to emissions of criteria pollutants would be<br />
PSU because the WSIP projects in combination with the cumulative projects would result in<br />
regionwide cumulative increases in air emissions during project operations and the residual<br />
contribution from each project would contribute to the region’s nonattainment status for ozone<br />
and particulate matter. Cumulative impacts related to exposure to diesel particulate matter<br />
would also be potentially significant and unavoidable because of the lack the lack of certainty<br />
about the timing of many of the cumulative projects that might use common haul routes.<br />
The project‐level analysis determined that construction‐related criteria pollutant and precursor<br />
exhaust emissions associated with the project would not exceed the significance thresholds and<br />
would therefore not result in cumulative construction‐related air quality impacts. The analysis<br />
also determined that the cumulative lifetime excess cancer risk and the cumulative particulate<br />
matter from the proposed project and existing nearby sources would not exceed the cumulative<br />
significance criteria; thus no cumulative construction‐related health risk impact would occur.<br />
PEIR Significance Categories<br />
N/A = Not Applicable or no impact<br />
LS = Less than Significant<br />
PSM = Potentially Significant impact with Mitigation<br />
SU = Significant and Unavoidable, even with mitigation<br />
PSU = Potentially Significant and Unavoidable, even with mitigation<br />
EIR Significance Categories<br />
NI = No Impact or not applicable (equivalent to N/A)<br />
LS = Less than Significant<br />
LSM = Less than Significant impact with Mitigation (equivalent to PSM)<br />
SU = Significant and Unavoidable impact, no feasible mitigation is available<br />
SUM = Significant and Unavoidable impact with Mitigation<br />
SFPUC <strong>San</strong> <strong>Francisco</strong> Groundwater Supply Project Draft EIR B‐29 March 2013<br />
Case No. 2008.1122E
Appendix B<br />
WSIP PEIR Consistency Analysis and Mitigation Measures, Applicability to the Proposed Project<br />
TABLE 1 (Continued)<br />
PEIR IMPACTS – CONSISTENCY REVIEW FOR THE GROUNDWATER SUPPLY PROJECT<br />
PEIR Impact<br />
PEIR Significance<br />
Determination for<br />
Groundwater<br />
Supply Project<br />
Project‐Level<br />
Significance<br />
Determination<br />
Same<br />
Rationale for<br />
Significance<br />
Determination<br />
as PEIR? (Y/N)<br />
Notes<br />
(Explain difference in significance determinations<br />
and/or rationale for determinations)<br />
Cumulative Facilities Impacts (cont.)<br />
Impact 4.17‐8: Cumulative increases in<br />
construction‐related and operational<br />
noise.<br />
PSU LS N See Section 5.7, Impact C‐NO: Construction and operation of the proposed project, in<br />
combination with other past, present and reasonably foreseeable future projects in the project<br />
vicinity, would not result in a cumulatively considerable contribution to significant noise and<br />
vibration impacts.<br />
The PEIR determined that cumulative impacts related to noise from truck traffic could occur if<br />
the cumulative projects generated truck traffic and used the same delivery/haul/access routes at<br />
the same time as the WSIP projects, causing localized cumulative construction‐related noise<br />
increases. Given the lack of certainty about the timing of many of cumulative projects, this<br />
cumulative impact was considered potentially significant and unavoidable.<br />
The project‐level review indicates that cumulative noise increases from construction of<br />
cumulative projects (e.g., Parkmerced Project) in combination with the proposed project<br />
would be below the threshold of human detection for normal environmental noise. Noise<br />
generated during project operation would also be reduced through implementation of<br />
Mitigation Measure M‐NO‐1. Thus, the project’s contribution to cumulative noise effects<br />
would not be cumulatively considerable.<br />
Impact 4.17‐9: Cumulative impacts<br />
related to the disruption of utility service<br />
or the relocation of utilities.<br />
LS LSM N See Section 5.12, Impact C‐UT: Project implementation would result in cumulatively<br />
considerable impacts related to disruption or relocation of utilities, landfill capacity, or<br />
compliance with solid waste statutes and regulations.<br />
The PEIR determined that construction of the WSIP projects could disrupt utility services or<br />
require temporary or permanent relocation of utilities. However, PEIR determined that these<br />
potential impacts would be site‐specific rather than additive and would be mitigated on a<br />
site‐specific basis and, thus, this cumulative impact was considered less than significant.<br />
The project‐level analysis determined that the proposed project, the <strong>San</strong> <strong>Francisco</strong> Westside<br />
Recycled Water Project and the Beach Chalet Athletic Fields Renovation Project would<br />
overlap and could damage or disrupt utilities in the same area. Collectively, implementation<br />
of Mitigation Measures M‐UT‐3a (Preconstruction Utility Identification and Coordination),<br />
M‐UT‐3b (Protection of Other Utilities during Construction), M‐UT‐3c (Safeguard Employees<br />
PEIR Significance Categories<br />
N/A = Not Applicable or no impact<br />
LS = Less than Significant<br />
PSM = Potentially Significant impact with Mitigation<br />
SU = Significant and Unavoidable, even with mitigation<br />
PSU = Potentially Significant and Unavoidable, even with mitigation<br />
EIR Significance Categories<br />
NI = No Impact or not applicable (equivalent to N/A)<br />
LS = Less than Significant<br />
LSM = Less than Significant impact with Mitigation (equivalent to PSM)<br />
SU = Significant and Unavoidable impact, no feasible mitigation is available<br />
SUM = Significant and Unavoidable impact with Mitigation<br />
SFPUC <strong>San</strong> <strong>Francisco</strong> Groundwater Supply Project Draft EIR B‐30 March 2013<br />
Case No. 2008.1122E
Appendix B<br />
WSIP PEIR Consistency Analysis and Mitigation Measures, Applicability to the Proposed Project<br />
TABLE 1 (Continued)<br />
PEIR IMPACTS – CONSISTENCY REVIEW FOR THE GROUNDWATER SUPPLY PROJECT<br />
PEIR Impact<br />
PEIR Significance<br />
Determination for<br />
Groundwater<br />
Supply Project<br />
Project‐Level<br />
Significance<br />
Determination<br />
Same<br />
Rationale for<br />
Significance<br />
Determination<br />
as PEIR? (Y/N)<br />
Notes<br />
(Explain difference in significance determinations<br />
and/or rationale for determinations)<br />
Cumulative Facilities Impacts (cont.)<br />
Impact 4.17‐9 (cont.) from Potential Accidents Related to Underground Utilities), M‐UT‐3d (Notify <strong>San</strong> <strong>Francisco</strong><br />
Fire <strong>Department</strong>), M‐UT‐3e (Emergency Response Plan and Notification), M‐UT‐3f (Ensure<br />
Prompt Reconnection of Utilities), and M‐UT‐3g (Coordinate Final Construction Plans with<br />
Affected Utilities) would ensure that the project’s contribution to this impact would not be<br />
cumulatively considerable.<br />
Impact 4.17‐10: Cumulative effects on<br />
recreational resources during<br />
construction.<br />
Impact 4.17‐11: Cumulative conversion of<br />
farmland to nonagricultural uses.<br />
LS<br />
LSM (equivalent<br />
to PSM)<br />
N<br />
LS N/A Y See Section 5.19, Agricultural Resources.<br />
See Section 5.11, Impact C‐RE: The project’s contribution to cumulative impacts on<br />
recreational resources and uses would be cumulatively considerable.<br />
The PEIR determined that construction activities associated with some WSIP facilities could<br />
temporarily disrupt access to or use of recreational facilities during construction. However,<br />
implementation of SFPUC construction measures (including advanced notification) and<br />
coordination with recreational facility managers and schools (PEIR Measures 4.12‐1a and<br />
4.12‐1b) would reduce the WSIP’s impact to a less‐than‐significant level.<br />
The project‐level analysis determined that the combination of the groundwater pumping<br />
associated with the proposed project, Regional Groundwater Storage and Recovery Project,<br />
and other ongoing groundwater pumping activities, would exacerbate decreased water<br />
levels at Lake Merced, a recreation resource. However, implementation of Mitigation<br />
Measure M‐HY‐9 (Lake‐Level Management for Lake Merced) would ensure that water levels<br />
are maintained at water levels similar to those that would be expected without projectrelated<br />
pumping, and would ensure that the project’s contribution to cumulative impacts on<br />
recreational resources at Lake Merced would not be cumulatively considerable.<br />
The PEIR determined that the WSIP would not contribute to any regionwide cumulative loss<br />
of farmland in the Bay Area but could incrementally contribute to the regional cumulative<br />
loss of farmland in the <strong>San</strong> Joaquin Region. Siting WSIP facilities to avoid prime agricultural<br />
lands or to offset any loss of such lands (PEIR Measure 4.13‐2) reduce the WSIP’s<br />
contribution to this impact to a less‐than‐significant level.<br />
The project‐level analysis determined that the proposed project would not result in any<br />
adverse effects on agricultural resources; therefore no cumulative impacts on agricultural<br />
resources would occur.<br />
PEIR Significance Categories<br />
N/A = Not Applicable or no impact<br />
LS = Less than Significant<br />
PSM = Potentially Significant impact with Mitigation<br />
SU = Significant and Unavoidable, even with mitigation<br />
PSU = Potentially Significant and Unavoidable, even with mitigation<br />
EIR Significance Categories<br />
NI = No Impact or not applicable (equivalent to N/A)<br />
LS = Less than Significant<br />
LSM = Less than Significant impact with Mitigation (equivalent to PSM)<br />
SU = Significant and Unavoidable impact, no feasible mitigation is available<br />
SUM = Significant and Unavoidable impact with Mitigation<br />
SFPUC <strong>San</strong> <strong>Francisco</strong> Groundwater Supply Project Draft EIR B‐31 March 2013<br />
Case No. 2008.1122E
Appendix B<br />
WSIP PEIR Consistency Analysis and Mitigation Measures, Applicability to the Proposed Project<br />
TABLE 1 (Continued)<br />
PEIR IMPACTS – CONSISTENCY REVIEW FOR THE GROUNDWATER SUPPLY PROJECT<br />
PEIR Impact<br />
PEIR Significance<br />
Determination for<br />
Groundwater<br />
Supply Project<br />
Project‐Level<br />
Significance<br />
Determination<br />
Same<br />
Rationale for<br />
Significance<br />
Determination<br />
as PEIR? (Y/N)<br />
Notes<br />
(Explain difference in significance determinations<br />
and/or rationale for determinations)<br />
Cumulative Facilities Impacts (cont.)<br />
Impact 4.17‐12: Cumulative effects related<br />
to hazardous conditions and exposure to<br />
or release of hazardous materials.<br />
LS LSM N See Section 5.17, Impact C‐HZ: Implementation of the proposed project would possibly result<br />
in cumulatively considerable impacts related to hazards and hazardous materials.<br />
The PEIR determined that due to the site‐specific nature of hazardous materials impacts and<br />
mitigation measures, there would be no potential for cumulative effects from construction of<br />
WSIP projects in conjunction with other cumulative developments. The PEIR determined<br />
that compliance with applicable laws and regulations, and with implementation of SFPUC<br />
construction measures, this cumulative impact would be less than significant.<br />
The project‐level analysis determined that operation of the proposed project in combination<br />
with the North Westside Groundwater Basin Management Plan, SFPUC’s proposed Regional<br />
Groundwater Storage and Recovery Project, and Daly City’s proposed Vista Grande<br />
Drainage Basin Improvements Project, Lake Merced water surface elevations are expected to<br />
be higher than under modeled conditions but during some dry years, the levels are predicted<br />
to be lower than those that would occur without operation of the cumulative projects. In the<br />
event of a major disaster, Lake Merced water could be pumped into the City’s drinking water<br />
system and as a result, decreased water levels in Lake Merced could result in a significant<br />
cumulative impact. However, with implementation of Mitigation Measure M‐HY‐9, Lake‐<br />
Level Management for Lake Merced, the project’s contribution to this impact would not be<br />
cumulatively considerable.<br />
Impact 4.17‐13: Cumulative increases in<br />
the use of nonrenewable energy<br />
resources.<br />
LS LS Y See Section 5.18, Impact C‐ME: Project implementation would not result in cumulatively<br />
considerable impacts related to mineral and energy resources.<br />
PEIR Significance Categories<br />
N/A = Not Applicable or no impact<br />
LS = Less than Significant<br />
PSM = Potentially Significant impact with Mitigation<br />
SU = Significant and Unavoidable, even with mitigation<br />
PSU = Potentially Significant and Unavoidable, even with mitigation<br />
EIR Significance Categories<br />
NI = No Impact or not applicable (equivalent to N/A)<br />
LS = Less than Significant<br />
LSM = Less than Significant impact with Mitigation (equivalent to PSM)<br />
SU = Significant and Unavoidable impact, no feasible mitigation is available<br />
SUM = Significant and Unavoidable impact with Mitigation<br />
SFPUC <strong>San</strong> <strong>Francisco</strong> Groundwater Supply Project Draft EIR B‐32 March 2013<br />
Case No. 2008.1122E
Appendix B<br />
WSIP PEIR Consistency Analysis and Mitigation Measures, Applicability to the Proposed Project<br />
WSIP PEIR Mitigation Measures, Applicability to the<br />
Proposed Project<br />
The <strong>San</strong> <strong>Francisco</strong> Groundwater Supply Project (Groundwater Supply Project or proposed<br />
project) was analyzed at a program‐level in the Water System Improvement Program (WSIP)<br />
Program Environmental Impact Report (PEIR) 2 as one of the facility improvement projects under<br />
the WSIP. The PEIR identified programmatic mitigation measures, and under Resolution No. 08‐<br />
200, the SFPUC adopted the WSIP Mitigation Monitoring and Reporting Program that applies the<br />
programmatic mitigation measures to the WSIP facility improvements projects, including the<br />
Groundwater Supply Project. This Groundwater Supply Project Environmental Impact Report<br />
(EIR) provides a detailed, project‐level analysis of the proposed project based on site‐specific and<br />
up‐to‐date information developed subsequent to the preparation of the PEIR. This section<br />
identifies the applicability of the WSIP PEIR mitigation measures to the proposed project based<br />
on the project‐level impact analysis.<br />
Table B‐1 lists the programmatic mitigation measures identified in the WSIP PEIR and indicates<br />
which of these mitigation measures are applicable to the proposed project. For the programmatic<br />
mitigation measures that are applicable, the table identifies the comparable project‐level<br />
mitigation measure identified in the Groundwater Supply Project EIR that either relies on the<br />
programmatic measures or identifies an equivalent or better site‐specific mitigation measure to<br />
replace the programmatic mitigation measure. The table also provides an explanation for those<br />
programmatic mitigation measures that are not applicable to the proposed project.<br />
2 <strong>San</strong> <strong>Francisco</strong> <strong>Planning</strong> <strong>Department</strong>, Final Program Environmental Impact Report for the <strong>San</strong> <strong>Francisco</strong> Public<br />
Utilities Commission’s Water System Improvement Program, <strong>San</strong> <strong>Francisco</strong> <strong>Planning</strong> <strong>Department</strong> File<br />
No. 2005.0159E, State Clearinghouse No. 2005092026. Certified October 30, 2008.<br />
SFPUC <strong>San</strong> <strong>Francisco</strong> Groundwater Supply Project Draft EIR B‐33 March 2013<br />
Case No. 2008.1122E
Appendix B<br />
WSIP PEIR Consistency Analysis and Mitigation Measures, Applicability to the Proposed Project<br />
TABLE B‐1<br />
PEIR MITIGATION MEASURES – CONSISTENCY REVIEW FOR THE GROUNDWATER SUPPLY PROJECT<br />
PEIR Mitigation Measure(s)<br />
Applicable to<br />
Proposed Project<br />
(Y/N)?<br />
Discussion<br />
Land Use<br />
Measure 4.3‐2, Facility Siting Studies: Conduct project‐specific facility siting studies<br />
for non‐SFPUC land and implement these studies’ recommendations to avoid or<br />
minimize impacts on existing land uses.<br />
Measure 4.3‐4a, Architectural Design: Design permanent new, aboveground facilities<br />
to be compatible with existing visual character of the site and surrounding area.<br />
Measure 4.3‐4b, Landscaping Plans: Prepare and implement landscaping plans to<br />
restore (recontour, revegetate, landscape) sites to preconstruction conditions. Monitor<br />
landscape plantings.<br />
Measure 4.3‐4c, Landscape Screens: Include new plantings and landscape berms to<br />
screen views of new structures and equipment from scenic roads.<br />
Measure 4.3‐4d, Minimize Tree Removal: Minimize or avoid the removal of trees that<br />
screen existing and proposed WSIP facility sites; implement tree replacement plan.<br />
N<br />
N<br />
N<br />
N<br />
Y<br />
Not applicable; all project facilities are sited on land owned by the City and County of<br />
<strong>San</strong> <strong>Francisco</strong>. As described in Chapter 3, Project Description, well facilities would be<br />
managed by the SFPUC, including those located on land currently managed by the <strong>San</strong><br />
<strong>Francisco</strong> Recreation and Park <strong>Department</strong> (SFRPD). New well facilities would be sited<br />
adjacent to existing facilities used for operation and maintenance activities such as the<br />
Lake Merced Pump Station and the Central Pump Station. The proposed well facilities<br />
that would be adjacent to the South Sunset Playground and West Sunset Playground<br />
would be sited in areas that are not highly used by the public. In addition, the South<br />
Windmill Replacement well facility and the North Lake well facility would replace<br />
existing well facilities. No additional mitigation would be required.<br />
The walls of proposed aboveground well facilities would generally be a dark stonegray<br />
color and exterior finishes and textures were selected to avoid an industrial or<br />
indistinct appearance. Further, planting areas would be located around well facilities<br />
to provide partial screening. Both the South Windmill Replacement well and the North<br />
Lake well facilities would replace existing well facilities and the style of the buildings<br />
would be similar to Golden Gate Park buildings in the vicinity. Some trees would be<br />
removed from the well facilities but the areas are generally heavily vegetated such that<br />
removal of a few trees would not substantially alter views of the area. For these<br />
reasons, no additional mitigation would be required.<br />
As part of the proposed project, landscape plans have been prepared for all proposed<br />
well facility sites. Refer to Section 5.3, Aesthetics, for depictions of the landscaped<br />
areas.<br />
As described above, landscape plans have been prepared for the proposed well facility<br />
sites to provide screening. Refer to Section 5.3, Aesthetics, for depictions of the<br />
landscaped areas. In addition, the proposed aboveground facilities would be designed<br />
to result in minimal adverse visual effects; exterior finishes and textures were selected<br />
to avoid an industrial or indistinct appearance. See Impact AE‐4, The project would not<br />
have a substantial adverse effect on scenic resources or the existing visual character or<br />
quality of the site and its surroundings.<br />
See Mitigation Measure M‐BI‐3 (Plant Replacement Trees).<br />
SFPUC <strong>San</strong> <strong>Francisco</strong> Groundwater Supply Project Draft EIR B‐34 March 2013<br />
Case No. 2008.1122E
Appendix B<br />
WSIP PEIR Consistency Analysis and Mitigation Measures, Applicability to the Proposed Project<br />
TABLE B‐1 (Continued)<br />
PEIR MITIGATION MEASURES – CONSISTENCY REVIEW FOR THE GROUNDWATER SUPPLY PROJECT<br />
PEIR Mitigation Measure(s)<br />
Applicable to<br />
Proposed Project<br />
(Y/N)?<br />
Discussion<br />
Land Use (cont.)<br />
Measure 4.3‐4d (cont.) The project‐level mitigation measure requires the SFPUC to replace any trees removed<br />
within SFRPD‐managed lands with trees of equivalent ecological value (i.e., similar<br />
species) of the trees removed. If the project site does not have adequate room for<br />
replanting trees, the SFPUC will coordinate with SFRPD to identify acceptable replanting<br />
locations in the vicinity of the project site.<br />
Measure 4.3‐5, Reduce Lighting Effects: Use cut‐off shields and nonglare fixture<br />
design, direct lighting onsite and downward, prevent use of highly reflective building<br />
materials or finishes.<br />
Geology<br />
Measure 4.4‐1, Quantified Landslide Analysis: Avoid sites with landslide hazards;<br />
where they cannot be avoided, conduct site‐specific slope stability analyses and<br />
implement recommendations.<br />
Measure 4.4‐4, Subsidence Monitoring Program: Monitor subsidence and implement<br />
corrective actions as warranted.<br />
Measure 4.4‐9, Characterize Extent of Expansive and Corrosive Soil: Characterize the<br />
presence of expansive/corrosive soils; implement recommendations.<br />
Hydrology<br />
Measure 4.5‐2, Site‐Specific Groundwater Analysis and Identified Measures:<br />
Conduct project‐specific analysis of dewatering and implement measures to ensure that<br />
groundwater resources and the beneficial uses of groundwater are not adversely affected.<br />
N<br />
N<br />
N<br />
N<br />
N<br />
As part of the proposed project, permanent lighting for the proposed well facilities<br />
would be recessed lights above the doors of each building. The Lake Merced and<br />
Golden Gate Park sites would not be in the vicinity of residences or land uses sensitive<br />
to light and glare. Lighting at the South Sunset and West Sunset facilities would not<br />
generate substantial sources of light or glare since these sites are in urban areas with<br />
many existing light sources. Furthermore, building materials would be light grey or<br />
dark in color and would be nonreflective. No mitigation is necessary. See Impact AE‐5,<br />
The proposed project would not create a new source of substantial light or glare that<br />
would adversely affect day or nighttime views in the area.<br />
The proposed facilities do not lie within designated landslide zones, and thus landsliding<br />
would not be expected. Therefore, this PEIR measure is not applicable. See Impact GE‐1,<br />
The proposed project is not located on a geologic unit that could become unstable as a<br />
result of project construction.<br />
Not applicable; the project does not involve tunneling.<br />
The presence of expansive and corrosive soils was evaluated as part of the project‐specific<br />
geotechnical report. The project would be located on soils with a low shrink‐swell<br />
potential; therefore potential impacts related to expansive soils would be less than<br />
significant at these sites. With respect to corrosive soils, the proposed project would be<br />
located on potentially corrosive soils. However, because corrosion protection measures<br />
have been incorporated into the design of the groundwater pipeline (see Section 3.4.1), no<br />
mitigation is required. See Impact GE‐5, The proposed project would not create<br />
substantial risks to life or property due to expansive soils or corrosive soils.<br />
Not necessary. During construction, any project‐related effects on the shallow<br />
groundwater table would be temporary in nature, as dewatering would be required<br />
only during certain phases of construction and only if groundwater is encountered.<br />
SFPUC <strong>San</strong> <strong>Francisco</strong> Groundwater Supply Project Draft EIR B‐35 March 2013<br />
Case No. 2008.1122E
Appendix B<br />
WSIP PEIR Consistency Analysis and Mitigation Measures, Applicability to the Proposed Project<br />
TABLE B‐1 (Continued)<br />
PEIR MITIGATION MEASURES – CONSISTENCY REVIEW FOR THE GROUNDWATER SUPPLY PROJECT<br />
PEIR Mitigation Measure(s)<br />
Applicable to<br />
Proposed Project<br />
(Y/N)?<br />
Discussion<br />
Hydrology (cont.)<br />
Measure 4.5‐4a, Flood Flow Protection Measures: Preclude exposure of stockpiled<br />
soils, hazardous materials, and construction materials to flood flows.<br />
Measure 4.5‐4b, Site‐Specific Flooding Analysis and Identified Measures: Implement<br />
design measures to preclude projects from causing flooding or damage from redirected<br />
flood flows.<br />
Measure 4.5‐5, Stormwater Treatment and Groundwater Monitoring: If treated<br />
stormwater is used to maintain Lake Merced water levels, monitor surface water and<br />
groundwater quality in the vicinity of Lake Merced. Identify and implement corrective<br />
actions (e.g., treatment).<br />
Measure 4.5‐6, Appropriate Source Controls and Site Design Measures: For projects<br />
located in areas not covered by a municipal stormwater permit and disturbing less<br />
than one acre of land during construction, implement appropriate source control and<br />
site design measures. These measures will ensure compliance with applicable water<br />
quality criteria and goals and protect the beneficial uses of the receiving water.<br />
Biology<br />
Measure 4.6‐1a, Wetlands Assessment: Wetland scientist will determine whether<br />
wetlands could be affected by the project, and, if so, perform a wetland delineation and<br />
develop mitigation.<br />
N<br />
N<br />
Y<br />
N<br />
N<br />
The project area (including staging areas) is located outside of the designated 100‐year<br />
FEMA flood hazard zone. See Impact HY‐5, The proposed project would not result in<br />
adverse effects related to the placement of structures within a 100‐year flood hazard<br />
area. No additional mitigation is necessary.<br />
No mitigation is necessary. The project‐level analysis determined that none of the project<br />
areas is within a special flood hazard zone. See Impact HY‐5, The proposed project would<br />
not result in adverse effects related to the placement of structures within a 100‐year flood<br />
hazard area. Although the South Windmill Replacement well site is within areas of<br />
potential flooding, the proposed 685‐square foot well facility would be smaller than the<br />
existing 900‐square foot irrigation well building that would be demolished under the<br />
proposed project. Thus, any potential for the well facility to redirect or exacerbate flood<br />
flows would be less compared to existing conditions.<br />
See Mitigation Measure M‐HY‐9 (Lake‐Level Management for Lake Merced).<br />
This program requires the SFPUC to conduct monitoring to detect changes in lake level<br />
and water quality as well as groundwater‐level elevations add supplemental water to<br />
augment lake levels if available; and alter pumping as necessary to avoid adverse<br />
effects on Lake Merced should a supplemental water source be unavailable. See<br />
Measure M‐HY‐9 for additional details.<br />
Consistent with the <strong>San</strong> <strong>Francisco</strong>’s Green Building Ordinance, Article 4.1 of the <strong>San</strong><br />
<strong>Francisco</strong> Public Works Code, and the SFPUC’s Water Pollution Prevention Program, the<br />
SFPUC would be required to implement an erosion and sediment control plan, which<br />
includes provisions to prevent stormwater pollution and control runoff at each site<br />
during project construction. In addition, SFPUC would be required to obtain a permit in<br />
accordance with Article 4.1 of the <strong>San</strong> <strong>Francisco</strong> Public Works Code, for groundwater<br />
dewatering discharges to the combined sewer system.<br />
The proposed project facilities are not located in wetland areas. A wetland delineation<br />
prepared in 2007 was used to assess operational impacts on wetlands at Lake Merced.<br />
See Section 5.14, Biological Resources, for additional information.<br />
SFPUC <strong>San</strong> <strong>Francisco</strong> Groundwater Supply Project Draft EIR B‐36 March 2013<br />
Case No. 2008.1122E
Appendix B<br />
WSIP PEIR Consistency Analysis and Mitigation Measures, Applicability to the Proposed Project<br />
TABLE B‐1 (Continued)<br />
PEIR MITIGATION MEASURES – CONSISTENCY REVIEW FOR THE GROUNDWATER SUPPLY PROJECT<br />
PEIR Mitigation Measure(s)<br />
Applicable to<br />
Proposed Project<br />
(Y/N)?<br />
Discussion<br />
Biology (cont)<br />
Measure 4.6‐1b, Compensation for Wetlands and Other Biological Resources: If a<br />
WSIP project will affect jurisdictional wetlands, implement avoidance measures,<br />
restoration procedures, and compensatory creation or enhancement to ensure no net<br />
loss of wetland extent or function. Compensate for sensitive riparian and upland<br />
habitats supporting key special‐status species. Obtain permits for each project and<br />
comply with applicable regulations addressing sensitive habitats and species. The<br />
Habitat Reserve Program is an alternative for implementing offsite habitat<br />
compensation.<br />
Measure 4.6‐2, Habitat Restoration/Tree Replacement: Restore temporarily affected<br />
sensitive habitats. Replace trees designated as heritage trees (or similar local<br />
designation) consistent with requirements of local ordinances. Minimize loss of<br />
sensitive habitats by coordinating WSIP projects.<br />
Measure 4.6‐3a, Protection Measures During Construction for Key Special‐Status<br />
Species and Other Species of Concern: Where key special‐status species and other<br />
species of concern are potentially present, implement general practice measures<br />
(preconstruction surveys, worker awareness program, environmental inspector,<br />
minimization of habitat loss).<br />
Measure 4.6‐3b, Standard Mitigation Measures for Key Special‐Status Plants and<br />
Animals: Implement measures to reduce impacts on key special‐status species.<br />
See below for specific species and corresponding sub‐PEIR mitigation number.<br />
Invertebrates<br />
Y<br />
Y<br />
Y<br />
See Mitigation Measure M‐BI‐7. The project‐level analysis determined that operation of<br />
the Groundwater Supply Project would result in fluctuations in water surface elevation<br />
at Lake Merced between ‐10.4 and 10.7 feet City Datum. With implementation of the<br />
project, modeling results indicate that a net loss of wetlands would occur over time<br />
under the proposed project in comparison to existing conditions. Implementation of<br />
Mitigation Measure M‐HY‐9 (Lake‐Level Management for Lake Merced) would<br />
require the SFPUC to maintain average annual lake levels at water elevations within<br />
which no net loss of wetlands would occur as a result of the project.<br />
See Mitigation Measure M‐BI‐3 (Plant Replacement Trees).<br />
The project‐level mitigation measure requires the SFPUC to replace any trees removed<br />
within SFRPD‐managed lands with trees of equivalent ecological value at a 1:1 ratio<br />
(i.e., similar species) of the trees removed. If the project site does not have adequate<br />
room for replanting trees, the SFPUC will coordinate with SFRPD to identify<br />
acceptable replanting locations in the vicinity of the project site.<br />
See Mitigation Measures M‐BI‐1a (Avoidance and Minimization Measures for California<br />
Red‐Legged Frog and Western Pond Turtle), M‐BI‐1b (Avoidance and Minimization<br />
Measures for Special‐Status Bats), M‐BI‐1c (Avoidance and Minimization Measures for<br />
Monarch Butterfly).<br />
The project‐level measures are consistent with the PEIR measure and provide additional<br />
site‐ and project‐specific details where key special‐status species and other species of<br />
concern are potentially present. An environmental inspector in not required, but a<br />
biological monitor is required under Mitigation Measure M‐BI‐1a.<br />
Valley Elderberry Longhorn Beetle I.1 N Species not identified in project vicinity.<br />
Vernal Pool Crustaceans (Vernal Pool Fairy Shrimp;<br />
Conservancy Fairy Shrimp; Vernal Pool Tadpole Shrimp)<br />
I.2 N Species not identified in project vicinity.<br />
Bay Checkerspot Butterfly; Callippe Silverspot Butterfly I.3 N Species not identified in project vicinity.<br />
SFPUC <strong>San</strong> <strong>Francisco</strong> Groundwater Supply Project Draft EIR B‐37 March 2013<br />
Case No. 2008.1122E
Appendix B<br />
WSIP PEIR Consistency Analysis and Mitigation Measures, Applicability to the Proposed Project<br />
TABLE B‐1 (Continued)<br />
PEIR MITIGATION MEASURES – CONSISTENCY REVIEW FOR THE GROUNDWATER SUPPLY PROJECT<br />
PEIR Mitigation Measure(s)<br />
Applicable to<br />
Proposed Project<br />
(Y/N)?<br />
Discussion<br />
Biology (cont)<br />
Central Valley Fall‐ and Late‐Fall‐Run DPS Chinook Salmon;<br />
Central Valley DPS Steelhead; Green Sturgeon Southern District DPS;<br />
Central Coast DPS Steelhead; Rainbow Trout<br />
F.1 N Species not identified in project vicinity.<br />
Reptiles and Amphibians<br />
California Red‐Legged Frog; Foothill Yellow‐Legged Frog RA.1 Y See Mitigation Measure M‐BI‐1a (Avoidance and Minimization Measures for California<br />
Red‐Legged Frog and Western Pond Turtle).<br />
California Tiger Salamander RA.2 N Species not identified in project vicinity.<br />
The project‐level measures are consistent with the PEIR measure and include sitespecific<br />
protection measures for all special status species potentially present in the<br />
project area.<br />
<strong>San</strong> <strong>Francisco</strong> Garter Snake RA.3 N Species has a low potential to occur within the project vicinity. No mitigation required.<br />
Alameda Whipsnake RA.4 N Species not identified in project vicinity.<br />
Birds<br />
Swainson’s Hawk B.1 N Species not identified in project vicinity.<br />
Western Burrowing Owl B.2 and B.3 N Species not identified in project vicinity.<br />
Raptors (including Bald Eagle) B.4 N Species not identified in project vicinity.<br />
Least Bell’s Vireo B.5 N Species not identified in project vicinity.<br />
California Black Rail, California Clapper Rail B.6 N Species has a low potential to occur within the project vicinity. No mitigation required.<br />
Western Snowy Plover B.7 N Species has a low potential to occur within the project vicinity. No mitigation required.<br />
Mammals<br />
Salt Marsh Harvest Mouse M.1 N Species not identified in project vicinity.<br />
<strong>San</strong> Joaquin Kit Fox M.2 N Species not identified in project vicinity.<br />
Riparian Woodrat M.3 N Species not identified in project vicinity.<br />
SFPUC <strong>San</strong> <strong>Francisco</strong> Groundwater Supply Project Draft EIR B‐38 March 2013<br />
Case No. 2008.1122E
Appendix B<br />
WSIP PEIR Consistency Analysis and Mitigation Measures, Applicability to the Proposed Project<br />
TABLE B‐1 (Continued)<br />
PEIR MITIGATION MEASURES – CONSISTENCY REVIEW FOR THE GROUNDWATER SUPPLY PROJECT<br />
PEIR Mitigation Measure(s)<br />
Applicable to<br />
Proposed Project<br />
(Y/N)?<br />
Discussion<br />
Biology (cont)<br />
Plants<br />
Vernal Pool Plants (Succulent Owl’s Clover; Hoover’s Spurge;<br />
Colusa Grass; <strong>San</strong> Joaquin Valley Orcutt Grass;<br />
Greene’s Tuctoria; Hairy Orcutt Grass)<br />
P.1 N Species not identified in project vicinity.<br />
Riparian Plants<br />
Delta Button‐Celery P.2 N Species not identified in project vicinity.<br />
Large‐Flowered Fiddleneck P.3 N Species not identified in project vicinity.<br />
<strong>San</strong> <strong>Francisco</strong> Woolly Sunflower; Marin Western Flax; Fountain Thistle P.4 N Marin Western Flax has a low potential to occur within the project vicinity. Other<br />
species not identified in project vicinity.<br />
Measure 4.6‐4, Pipeline and Water Treatment Plant Treated Water Discharge<br />
Restrictions: Design planned discharges from the WSIP pipelines and water treatment<br />
plants to natural water bodies to minimize impacts on riparian and aquatic resources<br />
and to avoid or minimize temperature effects on aquatic resources.<br />
Cultural<br />
Measure 4.7‐1, Suspend Construction Work if Paleontological Resource Is Identified:<br />
Suspend work and notify a qualified paleontologist when a paleontological resource is<br />
discovered at any of the project sites. The paleontologist will document the discovery<br />
as needed, evaluate the potential resource, and assess the significance of the find under<br />
CEQA criteria. Temporarily halt or divert excavation within 50 feet of a fossil find until<br />
the discovery is examined by a paleontologist. If avoidance is not feasible, the<br />
paleontologist will prepare an excavation plan.<br />
N<br />
N<br />
Not applicable; as described in Section 5.14, normal operations and maintenance of<br />
project facilities are not expected to impact biological resources. As described in<br />
Section 3.5.1, Operations, overboard pumping would occur after the initial conversion<br />
of the wells to drinking water production and after maintenance within the well. At<br />
the Lake Merced well facility, overboard pumping discharges would be directed into<br />
Lake Merced via the Lake Merced Pump Station’s wet well. At the West Sunset and<br />
South Sunset well facilities, overboard discharges would be directed to an onsite<br />
percolation basin and drain pipe, respectively, to allow the groundwater to percolate<br />
back to the aquifer. At the Golden Gate Park well facility sites, water from overboard<br />
pumping would be used to fill North Lake or would infiltrate into the ground surface.<br />
Not applicable; there is a low potential for project activities to uncover unique or<br />
significant fossils within the paleontological C‐APE. No mitigation is required. See<br />
Impact CP‐3: The proposed project would not directly or indirectly destroy a unique<br />
paleontological resource or site or unique geological feature.<br />
SFPUC <strong>San</strong> <strong>Francisco</strong> Groundwater Supply Project Draft EIR B‐39 March 2013<br />
Case No. 2008.1122E
Appendix B<br />
WSIP PEIR Consistency Analysis and Mitigation Measures, Applicability to the Proposed Project<br />
TABLE B‐1 (Continued)<br />
PEIR MITIGATION MEASURES – CONSISTENCY REVIEW FOR THE GROUNDWATER SUPPLY PROJECT<br />
PEIR Mitigation Measure(s)<br />
Applicable to<br />
Proposed Project<br />
(Y/N)?<br />
Discussion<br />
Cultural (cont.)<br />
Measure 4.7‐2a, Archaeological Testing, Monitoring, and Treatment of Human<br />
Remains: Determine if implementation of an archaeological testing or archaeological<br />
monitoring program or both is the appropriate strategy for avoidance of potential<br />
adverse effects on significant archaeological resources. Review any requirements<br />
approved by the State Historic Preservation Officer. Prepare an archaeological testing<br />
plan, archaeological monitoring plan, final archeological resources report and, if<br />
applicable, an archaeological data recovery plan. The treatment of human remains and<br />
of associated or unassociated funerary objects discovered during any soil‐disturbing<br />
activity will comply with applicable state laws.<br />
Measure 4.7‐2b, Accidental Discovery Measures: Distribute archaeological resource<br />
“ALERT” sheet to contractors. If an archaeological resource may be present within the<br />
project site, an archaeological consultant will evaluate it and make a recommendation<br />
as to what action (e.g., preservation in situ) is warranted. The SFPUC will implement<br />
appropriate measures.<br />
Measure 4.7‐3, Protection of Historic Districts: A qualified historian will assess the city’s<br />
water system facilities affected by WSIP facility projects for their potential contribution to<br />
a historic district. If a historic district would be affected by one or more proposed WSIP<br />
facility project(s), develop and implement mitigation measures for effects with attention<br />
to the potential district as a whole. If a historic district is identified at the project level, it<br />
should be recorded as such, using National/California Register criteria of significance.<br />
Document the district by completing the State of California <strong>Department</strong> of Parks and<br />
Recreation Form 523 and submit to the State Historic Preservation Officer.<br />
Measure 4.7‐4a, Alternatives Identification and Resource Relocation: Identify feasible<br />
project alternatives to eliminate or reduce the need for demolition or removal of a<br />
historic resource to the greatest extent possible. If preservation of the affected historical<br />
resource at the current site is determined to be infeasible, the structure will be<br />
stabilized and relocated to other appropriate nearby sites, if feasible. After relocation,<br />
the resource will be treated according to the Secretary of the Interior’s Standards for the<br />
Treatment of Historic Properties. If the affected historic resource is to be demolished,<br />
consult with local historical societies and governmental agencies regarding salvage of<br />
materials for public information or reuse in other locations.<br />
Y<br />
Y<br />
N<br />
N<br />
See Mitigation Measure M‐CP‐4 (Accidental Discovery of Human Remains).<br />
Although no known human burial locations have been identified within the project<br />
area, the EIR measure addresses the possibility of discovery during construction<br />
activities.<br />
See Mitigation Measure M‐CP‐2a (Accidental Discovery of Archaeological Resources).<br />
No historical resources, including those within the Golden Gate Park National Historic<br />
District, would be affected as a result of the proposed project.<br />
No historic resources would be demolished or removed as a result of the project.<br />
SFPUC <strong>San</strong> <strong>Francisco</strong> Groundwater Supply Project Draft EIR B‐40 March 2013<br />
Case No. 2008.1122E
Appendix B<br />
WSIP PEIR Consistency Analysis and Mitigation Measures, Applicability to the Proposed Project<br />
TABLE B‐1 (Continued)<br />
PEIR MITIGATION MEASURES – CONSISTENCY REVIEW FOR THE GROUNDWATER SUPPLY PROJECT<br />
PEIR Mitigation Measure(s)<br />
Applicable to<br />
Proposed Project<br />
(Y/N)?<br />
Discussion<br />
Cultural (cont.)<br />
Measure 4.7‐4b, Historical Resources Documentation: Prepare documentation of<br />
historic resources prior to any construction work associated with demolition or<br />
removal. The appropriate level of documentation will be selected by a qualified<br />
professional who meets the standards for history, architectural history, and/or<br />
architecture (as appropriate) set forth by the Secretary of the Interior’s Professional<br />
Qualification Standards (36 CFR 61) in consultation with a preservation specialist<br />
assigned by the <strong>San</strong> <strong>Francisco</strong> <strong>Planning</strong> <strong>Department</strong> and the local jurisdiction, if<br />
deemed appropriate by the <strong>Planning</strong> <strong>Department</strong>.<br />
Measure 4.7‐4c, Secretary of the Interior’s Standards for the Treatment of Historic<br />
Properties: Prepare materials describing and depicting the proposed project. Review<br />
the proposed project for compliance with the Secretary of the Interior’s Standards for the<br />
Treatment of Historic Properties. If a project is determined to be inconsistent with the<br />
Standards for the Treatment of Historic Properties, pursue and implement redesign of the<br />
project such that consistency with the standards is achieved.<br />
Measure 4.7‐4d, Historic Resources Survey and Redesign: Undertake a historic<br />
resources survey to identify and evaluate potential historic resources that may exist in<br />
the project’s area of potential effect. If a survey identifies one or more historical<br />
resources, assess the impact the project may have on those historical resources. If the<br />
project will cause a substantial adverse change to a historic resource, assign a<br />
preservation specialist to review the proposed project for compliance with the<br />
Secretary of the Interior’s Standards for the Treatment of Historic Properties. If the project<br />
is determined to be inconsistent with those standards, pursue and implement redesign<br />
of the project such that consistency with the standards is achieved.<br />
Measure 4.7‐4e, Historic Resources Protection Plan: A qualified historian will prepare<br />
a plan that specifies procedures for protecting and monitoring historic resources<br />
during construction.<br />
Measure 4.7‐4f, Preconstruction Surveys and Vibration Monitoring: Include<br />
geotechnical investigations if vibration‐related impacts could affect historic resources.<br />
Follow recommendations of the final geotechnical reports. Conduct a preconstruction<br />
survey of existing conditions and monitor the adjacent buildings for damage during<br />
construction, if recommended.<br />
N<br />
N<br />
N<br />
N<br />
N<br />
No historic resources would be demolished or removed as a result of the project.<br />
No historic properties would be altered as a result of project implementation.<br />
The historic resources survey was conducted as part of background technical study for<br />
the project and is documented in Section 5.5, Cultural and Paleontological Resources.<br />
No historic properties would be altered as a result of project implementation.<br />
Not applicable; no historic resources would be affected as a result of project<br />
construction.<br />
SFPUC <strong>San</strong> <strong>Francisco</strong> Groundwater Supply Project Draft EIR B‐41 March 2013<br />
Case No. 2008.1122E
Appendix B<br />
WSIP PEIR Consistency Analysis and Mitigation Measures, Applicability to the Proposed Project<br />
TABLE B‐1 (Continued)<br />
PEIR MITIGATION MEASURES – CONSISTENCY REVIEW FOR THE GROUNDWATER SUPPLY PROJECT<br />
PEIR Mitigation Measure(s)<br />
Applicable to<br />
Proposed Project<br />
(Y/N)?<br />
Discussion<br />
Traffic<br />
Measure 4.8‐1a, Traffic Control Plan Measures: Elements of the traffic control plan<br />
could include: circulation and detour plans, designated truck routes, sufficient staging<br />
area, access to driveways, use of standard construction specifications for controlling<br />
construction vehicle movements, restrictions on truck trips during peak morning and<br />
evening commute hours, lane closure restrictions, maintenance of alternate one‐way<br />
traffic flow, detour signing, pedestrian and bicycle access and circulation, equipment<br />
and materials storage, construction worker parking, roadside safety protocols,<br />
considerations for sensitive land uses, coordination with local transit service providers,<br />
roadway repair, and conformance with the state’s Manual of Traffic Controls for<br />
Construction and Maintenance Work Areas.<br />
Measure 4.8‐1b, Coordination of Individual Traffic Control Plans: In the event that<br />
more than one construction contract is issued for work along existing or new pipelines,<br />
and where construction could occur within and/or across multiple streets in the same<br />
vicinity, coordinate the traffic control plans in order to mitigate the impact of traffic<br />
disruption by including measures that address overlapping construction schedules and<br />
activities, truck arrivals and departures, lane closures and detours, and the adequacy of<br />
on‐street staging requirements.<br />
Measure 4.8‐4, Accommodation of Displaced Public Parking Supply for Recreational<br />
Visitors: Include an additional measure in the traffic control plans to accommodate any<br />
anticipated visitor parking demand that would be displaced by proposed projects at<br />
public recreational facilities.<br />
Air Quality<br />
Measure 4.9‐1a, SJVAPCD Dust Control Measures: Include <strong>San</strong> Joaquin Valley Air<br />
Pollution Control District (SJVAPCD) Basic Control Measures in contract specifications<br />
for all construction sites. Include SJVAPCD Enhanced Control Measures in contract<br />
specifications when required to mitigate significant PM10 impacts. Include SJVAPCD<br />
Additional Control Measures in contract specifications for construction sites that are large<br />
in area, located near sensitive receptors, or which for any other reason warrant additional<br />
emissions reductions. Include SJVAPCD Rule 9510, Indirect Source Review, Section 6.1,<br />
Construction Equipment Emissions in contract specifications for any project subject to<br />
discretionary approval by a public agency that ultimately results in the construction of a<br />
new building, facility, or structure or reconstruction of a building, facility, or structure for<br />
the purpose of increasing capacity or activity and also involving 9,000 square feet of<br />
space.<br />
N<br />
N<br />
N<br />
N<br />
Not applicable; as described in Section 5.6, Transportation and Circulation, to<br />
minimize temporary effects on traffic in the vicinity of the construction area, the<br />
SFPUC would implement a Construction Management Plan as part of the <strong>San</strong><br />
<strong>Francisco</strong> Municipal Transportation Authority’s Transportation Advisory Staff<br />
Committee (TASC) process. The SFPUC would coordinate with appropriate<br />
jurisdictional agencies through the Street Construction Coordination Center of the<br />
<strong>San</strong> <strong>Francisco</strong> <strong>Department</strong> of Public Works and the TASC.<br />
Not applicable. Implementation of a project‐specific Construction Management Plan<br />
would require the project to address potential transportation impacts and would<br />
require the SFPUC to engage in ongoing coordination with appropriate jurisdictional<br />
agencies through the TASC. See Impact C‐TR: The proposed project, in combination<br />
with past, present, and reasonably foreseeable future projects, would not substantially<br />
contribute to cumulative traffic increases on local and regional roads.<br />
No recreational parking would be permanently displaced under the project, with the<br />
potential exception of one parking space at the West Sunset Playground parking lot.<br />
The project is not located within the jurisdiction of the SJVAPCD.<br />
SFPUC <strong>San</strong> <strong>Francisco</strong> Groundwater Supply Project Draft EIR B‐42 March 2013<br />
Case No. 2008.1122E
Appendix B<br />
WSIP PEIR Consistency Analysis and Mitigation Measures, Applicability to the Proposed Project<br />
TABLE B‐1 (Continued)<br />
PEIR MITIGATION MEASURES – CONSISTENCY REVIEW FOR THE GROUNDWATER SUPPLY PROJECT<br />
PEIR Mitigation Measure(s)<br />
Applicable to<br />
Proposed Project<br />
(Y/N)?<br />
Discussion<br />
Air Quality (cont.)<br />
Measure 4.9‐1b, SJVAPCD Exhaust Control Measures: Include SJVAPCD Exhaust<br />
Control Measures in contract specifications, where applicable, for heavy‐duty<br />
equipment to limit exhaust emissions within the <strong>San</strong> Joaquin Region.<br />
Measure 4.9‐1c, BAAQMD Dust Control Measures: For projects in the Sunol Valley,<br />
Bay Division, Peninsula, and <strong>San</strong> <strong>Francisco</strong> Regions, include Bay Area Air Quality<br />
Management District (BAAQMD) Basic Control Measures in contract specifications for<br />
all construction sites. Include BAAQMD Enhanced Control Measures in contract<br />
specifications for sites over four acres. Include BAAQMD Optional Control Measures<br />
in contract specifications for sites that are large in area, located near sensitive receptors,<br />
or which for any other reason warrant additional emissions reductions.<br />
Measure 4.9‐1d, BAAQMD Exhaust Control Measures: For projects in the Sunol<br />
Valley, Bay Division, Peninsula, and <strong>San</strong> <strong>Francisco</strong> Regions, include BAAQMD Exhaust<br />
Control Measures to limit exhaust emissions, where applicable.<br />
Measure 4.9‐2a, Health Risk Screening or Use of Soot Filters: Complete a health risk<br />
screening if truck volumes associated with a particular project along a particular haul<br />
route exceed 40,000 truck trips over the entire construction period. If a potentially<br />
significant impact is indicated, complete a site‐specific health risk assessment. Consider<br />
diesel particulate matter (DPM) emission rates in separate project‐level analysis at the<br />
time of construction. Develop a mitigation program based on the site‐specific health<br />
risk assessment implementing methods of reducing DPM emission or exposure to a<br />
less‐than‐significant level.<br />
Measure 4.9‐2b, Vacate SFPUC Land Managers’ Residences in Sunol Valley: Vacate<br />
the two SFPUC Land Managers’ residences in the Sunol Valley during construction of<br />
the Calaveras Dam or SVWTP – Treated Water Reservoirs projects or complete a health<br />
risk screening (and, if warranted, a health risk assessment) to determine health risks at<br />
these residences from either of these two projects.<br />
Measure 4.9‐3, Tunnel Gas Odor Control: Add water scrubbers and appropriate<br />
chemicals to tunnel ventilation systems if odorous gases become a nuisance odor<br />
problem (i.e., odor complaints are received).<br />
N<br />
N<br />
N<br />
N<br />
N<br />
N<br />
The project is not located within the jurisdiction of the SJVAPCD.<br />
Not applicable; the SFPUC would comply with the <strong>San</strong> <strong>Francisco</strong> Construction Dust<br />
Control Ordinance (Ordinance No. 176‐08), which requires the project sponsor to<br />
designate an individual to monitor compliance with dust control requirements.<br />
Not applicable. Emissions estimated from construction equipment and vehicle exhaust<br />
would not exceed applicable average daily significance thresholds for construction<br />
activities; therefore no mitigation is required.<br />
The health risk assessment conducted as part of the background studies for the<br />
proposed project determined that DPM exposure at sensitive receptors (including<br />
adult and child residents, daycare facilities, schools, and playgrounds) would not<br />
exceed the BAAQMD’s cancer and non‐cancer risk thresholds. No mitigation is<br />
required.<br />
The project is not located in the Sunol Valley.<br />
The project does not include tunneling.<br />
SFPUC <strong>San</strong> <strong>Francisco</strong> Groundwater Supply Project Draft EIR B‐43 March 2013<br />
Case No. 2008.1122E
Appendix B<br />
WSIP PEIR Consistency Analysis and Mitigation Measures, Applicability to the Proposed Project<br />
TABLE B‐1 (Continued)<br />
PEIR MITIGATION MEASURES – CONSISTENCY REVIEW FOR THE GROUNDWATER SUPPLY PROJECT<br />
PEIR Mitigation Measure(s)<br />
Applicable to<br />
Proposed Project<br />
(Y/N)?<br />
Discussion<br />
Noise/Vibration<br />
Measure 4.10‐1a, Noise Controls: For all WSIP projects located within 500 feet of any<br />
noise‐sensitive receptors, implement appropriate noise controls to reduce daytime<br />
construction noise levels to meet the 70‐dBA daytime speech interference criterion to<br />
the extent feasible. For all WSIP projects involving nighttime construction and located<br />
within 3,000 feet of any noise‐sensitive receptors, implement appropriate noise controls<br />
to maintain noise levels at or below any applicable ordinance nighttime noise limits or<br />
the 50‐dBA nighttime sleep interference criterion to the extent feasible.<br />
Measure 4.10‐1b, Vacate SFPUC Caretaker’s Residence at Tesla Portal: Vacate<br />
caretaker’s residence at Tesla Portal during construction of the Advanced Disinfection<br />
and Tesla Portal Disinfection Station projects as well as those portions of the <strong>San</strong><br />
Joaquin Pipeline System and Rehabilitation of Existing <strong>San</strong> Joaquin Pipelines projects<br />
located at Tesla Portal.<br />
Measure 4.10‐2a, Limit Hourly Truck Volumes: Haul and delivery truck routes for all<br />
WSIP projects will, to the extent feasible, avoid local residential streets and follow local<br />
designated truck routes. Total project‐related haul and delivery truck volumes on any<br />
particular haul truck route will be limited to 80 trucks per hour.<br />
Measure 4.10‐2b, Restrict Truck Operations: Prohibit haul and delivery trucks from<br />
operating within 200 feet of any residential uses during the nighttime hours. For<br />
receptors beyond 200 feet from a haul route, limit noise levels to the 50‐dBA sleep<br />
interference criterion at the closest receptor.<br />
Measure 4.10‐2c, Vacate SFPUC Land Manager’s Residence: Vacate Land Manager’s<br />
residence adjacent to Alameda East Portal during offsite truck operations associated<br />
with the New Irvington Tunnel project, if truck operations occur during the nighttime<br />
hours (10 p.m. to 7 a.m.) and are estimated to exceed the 50‐dBA sleep interference<br />
criterion at this residence.<br />
Y<br />
N<br />
N<br />
N<br />
N<br />
See Mitigation Measure M‐NO‐1 (Administrative and Source Controls).<br />
The project‐level mitigation measure requires SFPUC to develop and implement a<br />
noise control plan that includes compliance with the <strong>San</strong> <strong>Francisco</strong> Noise Ordinance<br />
daytime threshold of 80 dBA at 100 feet at all project locations between 7 a.m. and 8<br />
p.m. and other performance standards.<br />
The project is not located at the Tesla Portal.<br />
Not applicable. The number of construction‐related haul truck trips per day would<br />
vary depending on the type of construction technique, volume of spoils and fill.<br />
According to background noise levels estimated for <strong>San</strong> <strong>Francisco</strong> streets, increases of<br />
up to 10 trucks per hour would be noticeable but less than significant. Truck volumes<br />
would vary day to day but would not generate more than 10 haul trucks per hour on<br />
any one street providing access to and from a site. See Impact NO‐1, The proposed<br />
project would result in a substantial temporary or periodic increase in ambient noise<br />
levels in the project vicinity above levels existing without the project.<br />
Not applicable; project‐related haul and delivery trucks would not operate during the<br />
nighttime or evening hours (8 p.m. to 7 a.m.).<br />
Not applicable; the project is not located in the vicinity of the Alameda East Portal.<br />
SFPUC <strong>San</strong> <strong>Francisco</strong> Groundwater Supply Project Draft EIR B‐44 March 2013<br />
Case No. 2008.1122E
Appendix B<br />
WSIP PEIR Consistency Analysis and Mitigation Measures, Applicability to the Proposed Project<br />
TABLE B‐1 (Continued)<br />
PEIR MITIGATION MEASURES – CONSISTENCY REVIEW FOR THE GROUNDWATER SUPPLY PROJECT<br />
PEIR Mitigation Measure(s)<br />
Applicable to<br />
Proposed Project<br />
(Y/N)?<br />
Discussion<br />
Noise/Vibration (cont.)<br />
Measure 4.10‐3a, Vibration Controls to Prevent Cosmetic or Structural Damage:<br />
Incorporate restrictions into all contract specifications (primarily for sheetpile driving,<br />
pile driving, or tunnel construction activities), whereby surface vibration will be<br />
limited to 0.2 inch/second peak particle velocity (PPV) for continuous vibration (e.g.,<br />
vibratory equipment and impact pile drivers) and 0.5 inch/second PPV for controlled<br />
detonations at the closest receptors to ensure that cosmetic or structural damage does<br />
not occur.<br />
Measure 4.10‐3b, Limit Vibration Levels At or Below Vibration Perception<br />
Threshold: Maintain vibration levels at or below the vibration perception threshold at<br />
adjacent properties to the extent feasible during nighttime. If vibration complaints are<br />
received, operational adjustments will be made to reduce vibration annoyance effects.<br />
Measure 4.10‐3c, Limit Tunnel‐Related Detonation to Daylight Hours: Limit<br />
controlled detonation associated with tunnel construction to daylight hours, Monday<br />
through Saturday.<br />
Services/Utilities<br />
Measure 4.11‐1a, Notify Neighbors of Potential Utility Service Disruption: Notify<br />
residents and businesses in project area of potential utility service disruption two to<br />
four days in advance of construction.<br />
Measure 4.11‐1b, Locate Utility Lines Prior to Excavation: Locate overhead and<br />
underground utility lines prior to excavation work.<br />
Measure 4.11‐1c, Confirmation of Utility Line Information: Find the exact location of<br />
underground utilities by safe and acceptable means. Confirm information regarding<br />
the size, color, and location of existing utilities before construction activities commence.<br />
Measure 4.11‐1d, Safeguard Employees from Potential Accidents Related to<br />
Underground Utilities: While any excavation is open, protect, support, or remove<br />
underground utilities as necessary to safeguard employees.<br />
Measure 4.11‐1e, Notify Local Fire <strong>Department</strong>s: Notify local fire departments any<br />
time damage to a gas utility results in a leak or suspected leak, or whenever damage to<br />
any utility results in a threat to public safety.<br />
Measure 4.11‐1f, Emergency Response Plan: Develop an emergency response plan in<br />
the event of a leak or explosion prior to commencing construction activities.<br />
N<br />
N<br />
N<br />
N<br />
Y<br />
Y<br />
Y<br />
Y<br />
Y<br />
Not applicable; the project’s vibration impacts were determined to be less than<br />
significant. See Impact NO‐2.<br />
Not applicable; the project’s vibration impacts were determined to be less than<br />
significant. See Impact NO‐2.<br />
Not applicable; the project does not include tunneling.<br />
Project construction is not anticipated to result in utility service disruption for<br />
residences or businesses.<br />
See Mitigation Measure M‐UT‐3a (Preconstruction Utility Identification and<br />
Coordination).<br />
See Mitigation Measure M‐UT‐3a (Preconstruction Utility Identification and<br />
Coordination).<br />
See Mitigation Measure M‐UT‐3c (Safeguard Employees from Potential Accidents<br />
Related to Underground Utilities).<br />
See Mitigation Measure M‐UT‐3d (Notify Local Fire <strong>Department</strong>).<br />
See Mitigation Measure M‐UT‐3e (Emergency Response Plan and Notification).<br />
SFPUC <strong>San</strong> <strong>Francisco</strong> Groundwater Supply Project Draft EIR B‐45 March 2013<br />
Case No. 2008.1122E
Appendix B<br />
WSIP PEIR Consistency Analysis and Mitigation Measures, Applicability to the Proposed Project<br />
TABLE B‐1 (Continued)<br />
PEIR MITIGATION MEASURES – CONSISTENCY REVIEW FOR THE GROUNDWATER SUPPLY PROJECT<br />
PEIR Mitigation Measure(s)<br />
Applicable to<br />
Proposed Project<br />
(Y/N)?<br />
Discussion<br />
Services/Utilities (cont.)<br />
Measure 4.11‐1g, Prompt Reconnection of Utilities: Promptly reconnect any<br />
disconnected utility lines.<br />
Measure 4.11‐1h, Coordinate Final Construction Plans with Affected Utilities:<br />
Coordinate final construction plans and specifications with affected utilities.<br />
Measure 4.11‐2, Waste Reduction Measures: Incorporate into contract specifications<br />
for each WSIP project the requirement to obtain any necessary waste management<br />
permits prior to construction and to comply with conditions of approval attached to<br />
project implementation.<br />
Recreation<br />
Measure 4.12‐1, Coordination with Golf Course/Recreational Facility Managers:<br />
Coordinate with managers of golf courses or other recreational facilities directly<br />
affected by pipeline construction to minimize adverse impacts on golfers and other<br />
recreational users.<br />
Measure 4.12‐2, Appropriate Siting of Proposed Facilities: Locate WSIP project<br />
facilities on park and recreation properties in consultation with park planning staff to<br />
minimize the direct loss of recreation and play space and to minimize inconvenience to<br />
park and recreation users.<br />
Agriculture<br />
Measure 4.13‐1a, Supplemental Noticing and Soil Stockpiling: For the <strong>San</strong> Joaquin<br />
Pipeline projects (<strong>San</strong> Joaquin System and Rehabilitation of Existing <strong>San</strong> Joaquin<br />
Pipeline), stockpile and replace topsoil in mapped areas of Prime and Unique<br />
Farmland and Farmland of Statewide Importance that would be temporarily disturbed<br />
by pipeline construction, unless other actions are required under specific agreements<br />
with individual landowners.<br />
Y<br />
Y<br />
N<br />
N<br />
N<br />
N<br />
See Mitigation Measure M‐UT‐3f (Ensure Prompt Reconnection of Utilities).<br />
See Mitigation Measure M‐UT‐3g (Coordinate Final Construction Plans with Affected<br />
Utilities).<br />
Consistent with the <strong>San</strong> <strong>Francisco</strong> Construction and Demolition Ordinance (Ordinance<br />
No. 27‐06), sixty‐five percent of excavated materials would be reused or recycled,<br />
which would meet or exceed the State of California’s <strong>San</strong> <strong>Francisco</strong>’s waste diversion<br />
goals. Additionally, <strong>San</strong> <strong>Francisco</strong> has a goal to divert 75 percent of all waste from<br />
landfills, which would also be met by the proposed project. See Impact UT‐2, Project<br />
construction would not result in a substantial adverse effect related to compliance with<br />
federal, state, and local statutes and regulations pertaining to solid waste.<br />
The project would not directly affect golf courses or other designated recreational<br />
facilities. Pedestrian and bicycle resources in Golden Gate Park would be slightly<br />
altered during pipeline construction through temporary construction disturbance;<br />
however the resources would be restored to their general preconstruction condition<br />
and no mitigation is required. See Impact RE‐1, The proposed project’s construction<br />
would not increase the use of existing neighborhood and regional parks or other<br />
recreational facilities such that substantial physical deterioration of the facilities would<br />
occur or be accelerated or otherwise result in substantial degradation of existing<br />
recreational resources.<br />
Not applicable; proposed well facilities would not be located on active play fields or<br />
high visitor use areas of Golden Gate Park, West Sunset Playground, or South Sunset<br />
Playground. As part of the proposed project, for well facilities that are proposed in<br />
Golden Gate Park, the SFPUC would operate and maintain these facilities in<br />
consultation and coordination with SFRPD. Thus, no mitigation would be required.<br />
The project is not located in the <strong>San</strong> Joaquin Region.<br />
SFPUC <strong>San</strong> <strong>Francisco</strong> Groundwater Supply Project Draft EIR B‐46 March 2013<br />
Case No. 2008.1122E
Appendix B<br />
WSIP PEIR Consistency Analysis and Mitigation Measures, Applicability to the Proposed Project<br />
TABLE B‐1 (Continued)<br />
PEIR MITIGATION MEASURES – CONSISTENCY REVIEW FOR THE GROUNDWATER SUPPLY PROJECT<br />
PEIR Mitigation Measure(s)<br />
Applicable to<br />
Proposed Project<br />
(Y/N)?<br />
Discussion<br />
Agriculture (cont.)<br />
Measure 4.13‐1b, Avoidance or Soil Stockpiling: Minimize any potential impacts on<br />
agricultural lands in the Sunol Valley by avoiding these resources wherever possible.<br />
Where this is not possible, stockpile, replace, and hydroseed topsoil to prevent erosion,<br />
unless other actions are required as a result of contracts affecting use of the property or<br />
under specific agreements with individual landowners.<br />
N<br />
The project is not located in the Sunol Valley Region.<br />
Measure 4.13‐2, Siting Facilities to Avoid Prime Farmland: Avoid areas identified as<br />
Prime Farmland, Unique Farmland, or Farmland of Statewide Importance. If avoidance<br />
is not feasible, adopt a permanent set‐aside for an equivalent acreage of similarly<br />
valued farmland in the area.<br />
N Not applicable; the project would not affect agricultural resources. See Section 5.19,<br />
Agricultural and Forest Resources.<br />
Hazards<br />
Measure 4.14‐1a, Site Health and Safety Plan: For all projects where the site<br />
assessment indicates the potential to encounter hazardous materials, prepare a site<br />
health and safety plan identifying the chemicals present, potential health and safety<br />
hazards, monitoring, soil‐handling methods, appropriate personnel protective<br />
equipment, and emergency response procedures.<br />
Measure 4.14‐1b, Materials Disposal Plan: For all projects where the site assessment<br />
indicates the potential to encounter hazardous materials in the soil, prepare a materials<br />
disposal plan that specifies the disposal method and approved disposal site for the soil.<br />
Measure 4.14‐1c, Coordination with Property Owners and Regulatory Agencies:<br />
Based on regulatory agency file reviews, assess the potential to encounter unacceptable<br />
levels of hazardous materials at known environmental cases, for construction activities<br />
to cause groundwater plume migration or interfere with ongoing remediations at<br />
known environmental cases, and for increased water levels in reservoirs or lakes to<br />
inundate known environmental cases. Modify construction or remediation activities.<br />
Y<br />
Y<br />
N<br />
See Mitigation Measures M‐HZ‐2a (Preconstruction Hazardous Materials Assessment),<br />
M‐HZ‐2b (Health and Safety Plan) and M‐HZ‐2c (Hazardous Materials Management<br />
Plan).<br />
The project‐level mitigation measures require the construction contractor to conduct a<br />
regulatory agency database review of hazardous materials sites in the project vicinity.<br />
If this review indicates a high likelihood of encountering contamination at the project<br />
sites, additional soil and groundwater sampling would need to occur prior to<br />
preparation of a site‐specific health and safety plan (Mitigation Measure M‐HZ‐2b) and<br />
hazardous materials disposal plan (Mitigation Measure M‐HZ‐2c).<br />
See Mitigation Measure M‐HZ‐2c (Hazardous Materials Management Plan).<br />
The project‐level mitigation measure requires the contractor to prepare a hazardous<br />
materials management plan that specifies the method for handling and disposal of<br />
contaminated soil and building debris, should any be encountered during<br />
construction.<br />
The project is not expected to interfere with the investigation or remediation of a<br />
known environmental case. See Section 5.17.1, Setting.<br />
SFPUC <strong>San</strong> <strong>Francisco</strong> Groundwater Supply Project Draft EIR B‐47 March 2013<br />
Case No. 2008.1122E
Appendix B<br />
WSIP PEIR Consistency Analysis and Mitigation Measures, Applicability to the Proposed Project<br />
TABLE B‐1 (Continued)<br />
PEIR MITIGATION MEASURES – CONSISTENCY REVIEW FOR THE GROUNDWATER SUPPLY PROJECT<br />
PEIR Mitigation Measure(s)<br />
Applicable to<br />
Proposed Project<br />
(Y/N)?<br />
Discussion<br />
Hazards (cont.)<br />
Measure 4.14‐2, Health Risk Screening and Airborne Asbestos Monitoring Plan: For<br />
tunneling projects where soil or rock may contain naturally occurring asbestos, conduct<br />
a health risk screening assessment to identify acceptable levels of asbestos in tunnel<br />
emissions. Prepare an airborne asbestos monitoring plan for approval by the<br />
BAAQMD.<br />
Measure 4.14‐5, Hazardous Building Materials Surveys and Abatement: For all WSIP<br />
projects involving demolition or renovation of existing facilities, perform a hazardous<br />
building materials survey for each structure prior to demolition or renovation<br />
activities. If any friable asbestos‐containing materials, lead‐containing materials, or<br />
hazardous components of building materials are identified, implement adequate<br />
abatement practices prior to demolition or renovation.<br />
Energy<br />
Measure 4.15‐2, Incorporation of Energy Efficiency Measures: Consistent with the<br />
Energy Action Plan II priorities for reducing energy usage, ensure that energy‐efficient<br />
equipment is used in all WSIP projects. Prepare a repair and maintenance plan for each<br />
facility to minimize power use. Evaluate the potential for use of renewable energy<br />
resources.<br />
N<br />
N<br />
N<br />
The project would not disturb a rock unit or soil that contains naturally occurring<br />
asbestos. See Section 5.15.1, Setting.<br />
Not applicable; an asbestos‐containing materials and lead‐based paint survey was<br />
performed in January 2011 and no asbestos was detected in any of the samples.<br />
Therefore, the potential hazards related to encountering asbestos‐containing materials<br />
during demolition would be less than significant. No mitigation would be required.<br />
Not applicable; the SFPUC would consult with the SFPUC Power Enterprise’s Energy<br />
Efficiency Group to incorporate all feasible energy efficiency measures into project<br />
design and no mitigation would be required. See Impact ME‐2, Project operations<br />
would not result in substantial adverse effects related to the long‐term use of large<br />
amounts of fuel or energy, or the use of these resources in a wasteful manner.<br />
Collective Impacts (These are considered cumulative mitigation measures in project‐level CEQA documents)<br />
Measure 4.16‐1a, Construction Coordination at Irvington Portal: If construction<br />
schedules of multiple WSIP projects occurring at and near Irvington Portal coincide or<br />
overlap, the SFPUC will coordinate with construction contractor(s) and neighbors to<br />
minimize disturbance of residents in the adjacent neighborhood to the extent<br />
practicable. Such coordination will need to balance the duration of construction with<br />
the magnitude of construction‐related impacts on the same sensitive receptors.<br />
Measure 4.16‐4a, Bioregional Habitat Restoration Measures: Address the following<br />
bioregional effects and implement conservation principles when implementing habitat<br />
compensation mitigation required for individual WSIP facility projects: compound<br />
impacts on functional units of habitat as WSIP projects simplify vegetation structure<br />
and increase “edge” (the boundary between two different habitats); increased habitat<br />
impacts due to the spread of weedy, non‐native plant species; genetic diversity impacts<br />
on small populations; impacts on wildlife movement due to habitat fragmentation;<br />
suppression of natural disturbance regimes; and reduced population recovery<br />
opportunities from stochastic events.<br />
N<br />
N<br />
The project is not located at the Irvington Portal.<br />
The project’s contribution to cumulative effects on biological resources would be<br />
mitigated with project‐specific mitigation measures and therefore would not require<br />
implementation of bioregional habitat restoration measures. See Impact C‐BI, The<br />
proposed project would not result in a considerable contribution to cumulative<br />
impacts related to special‐status species, wetlands, waters of the United States, riparian<br />
habitat, wildlife nursery sites, or conflicts with local policies and ordinances protecting<br />
biological resources.<br />
SFPUC <strong>San</strong> <strong>Francisco</strong> Groundwater Supply Project Draft EIR B‐48 March 2013<br />
Case No. 2008.1122E
Appendix B<br />
WSIP PEIR Consistency Analysis and Mitigation Measures, Applicability to the Proposed Project<br />
TABLE B‐1 (Continued)<br />
PEIR MITIGATION MEASURES – CONSISTENCY REVIEW FOR THE GROUNDWATER SUPPLY PROJECT<br />
PEIR Mitigation Measure(s)<br />
Applicable to<br />
Proposed Project<br />
(Y/N)?<br />
Discussion<br />
Collective Impacts (cont.)<br />
Measure 4.16‐4b, Coordination of Construction Staging and Access: Coordinate<br />
construction contractor(s) to minimize surface disturbance when construction<br />
schedules for WSIP projects affecting the same areas overlap.<br />
Measure 4.16‐6a, SFPUC WSIP Projects Construction Coordinator: Identify a<br />
qualified construction coordinator to coordinate project‐specific traffic control plans;<br />
develop a public information campaign to inform the public of construction activities,<br />
detour routes, and alternate routes; and work with local and regional agencies to<br />
pursue additional traffic mitigation measures and incorporate such measures into the<br />
project‐specific traffic control plans.<br />
Measure 4.16‐6b, Combined <strong>San</strong> Joaquin Traffic Control Plan: Develop a <strong>San</strong> Joaquin<br />
Traffic Control Plan that coordinates the project‐specific traffic control plans and<br />
identifies additional measures (consistent with the standards of <strong>San</strong> Joaquin County,<br />
Stanislaus County, and Caltrans) to minimize the combined impacts of multiple WSIP<br />
project construction traffic on I‐580, Chrisman Road, and Vernalis Road.<br />
Measure 4.16‐6c, Combined Sunol Valley Traffic Control Plan: Develop a Sunol<br />
Valley Traffic Control Plan that coordinates the project‐specific traffic control plans and<br />
identifies additional measures (consistent with the standards of Alameda County and<br />
Caltrans) to minimize the impacts of construction traffic on Calaveras Road and I‐680.<br />
Measure 4.16‐7a, Dust and Exhaust Control Measures for All WSIP Projects: Require<br />
implementation of Air Quality Measures 4.9‐1a thru 4.9‐1d for all WSIP projects to<br />
address collective construction‐related air quality impacts.<br />
Measure 4.16‐7b, Health Risk Screening or Use of Soot Filters for All Projects in the<br />
<strong>San</strong> Joaquin and Sunol Valley Regions: Require Measure 4.9‐2a for all WSIP projects<br />
in the <strong>San</strong> Joaquin and Sunol Valley Regions to address collective DPM impacts. When<br />
this requirement is applied to the New Irvington Tunnel project, it will be applied to<br />
both the Sunol Valley and Fremont tunnel portals, taking into account truck traffic<br />
from other WSIP projects in the vicinity of both portals.<br />
N<br />
N<br />
N<br />
N<br />
N<br />
N<br />
Not required. As described in the Section 5.6, Transportation and Circulation, as part<br />
of the TASC process, the SFPUC would work with the SFDPW and SFMTA to develop<br />
a Construction Management Plan. As part of this plan, SFPUC would be required to<br />
engage in ongoing coordination with the appropriate jurisdictional agencies through<br />
the TASC.<br />
The project is not located in <strong>San</strong> Joaquin County.<br />
The project is not located in the Sunol Valley.<br />
As specified above, the SFPUC would comply with the <strong>San</strong> <strong>Francisco</strong> Building Code<br />
and Health Code regulations and procedures identified in the Dust Control Ordinance<br />
to ensure that construction‐related fugitive dust impacts are less than significant. In<br />
addition, the project’s contribution of non‐point sources within the project vicinity<br />
would not exceed the cumulative significance criteria. Therefore, no additional<br />
mitigation would be required.<br />
The project is not located in the <strong>San</strong> Joaquin or Sunol Valley Regions.<br />
SFPUC <strong>San</strong> <strong>Francisco</strong> Groundwater Supply Project Draft EIR B‐49 March 2013<br />
Case No. 2008.1122E
Appendix B<br />
WSIP PEIR Consistency Analysis and Mitigation Measures, Applicability to the Proposed Project<br />
TABLE B‐1 (Continued)<br />
PEIR MITIGATION MEASURES – CONSISTENCY REVIEW FOR THE GROUNDWATER SUPPLY PROJECT<br />
PEIR Mitigation Measure(s)<br />
Applicable to<br />
Proposed Project<br />
(Y/N)?<br />
Discussion<br />
Collective Impacts (cont.)<br />
Measure 4.16‐7c, Vacate SFPUC Land Managers’ Residences for All Projects in the<br />
Sunol Valley Region: Require Measure 4.9‐2b for all WSIP projects in the Sunol Valley<br />
Region to address collective DPM impacts.<br />
Measure 4.16‐8a, Limiting Hourly Truck Volumes and Restricting Truck Operations<br />
on Haul Routes for Multiple WSIP Projects: Apply Measures 4.10‐2a and 4.10‐2b to<br />
total haul and delivery truck volumes attributable to all WSIP projects on any<br />
particular haul truck route (including haul routes in the Tesla Portal, Irvington Portal,<br />
and Lower Crystal Springs Dam vicinities as well as haul routes in the <strong>San</strong> <strong>Francisco</strong><br />
Region) to address collective truck‐related noise impacts.<br />
Measure 4.16‐8b, Vacate Land Manager’s Residence for All Projects in Sunol Valley<br />
Region: To address collective noise impacts, vacate Land Manager’s residence adjacent to<br />
Alameda East Portal during construction truck operations associated with all WSIP<br />
projects in this region if collective daytime truck volumes exceed the 70‐dBA speech<br />
interference criterion or nighttime truck volumes exceed the 50‐dBA sleep interference<br />
criterion.<br />
Cumulative Effects<br />
Measure 4.17‐6, SFPUC WSIP Projects Construction Coordinator – Other Agencies:<br />
The SFPUC WSIP construction coordinator designated in accordance with<br />
Measure 4.16‐6a will also consider the effects of any traffic generated by SFPUC<br />
maintenance activities and other SFPUC projects; and coordinate with Caltrans, other<br />
county agencies, and local jurisdictions regarding construction of other private and<br />
public development projects so as to minimize traffic impacts on local access roads.<br />
Measure 4.17‐8, Coordination of Truck Traffic on Local Streets: The SFPUC WSIP<br />
construction coordinator designated in Measure 4.17‐6 will also be responsible for<br />
coordinating truck traffic generated on these same streets by SFPUC maintenance<br />
activities and other SFPUC projects so that SFPUC‐related truck noise increases are<br />
maintained at or below threshold levels specified in Measures 4.10‐2a and 4.10‐2b to<br />
the extent feasible.<br />
N<br />
N<br />
N<br />
N<br />
N<br />
The project is not located in the Sunol Valley Region.<br />
Based on project traffic volumes for known projects in the vicinity of the Groundwater<br />
Supply Project, cumulative impacts related to temporary noise disturbance along<br />
construction access routes would be less than significant.<br />
The project would not be located in the Sunol Valley Region.<br />
Not required. As described above and in Section 5.6, Transportation and Circulation,<br />
the SFPUC would work with the SFDPW and SFMTA to develop a Construction<br />
Management Plan. As part of this plan, SFPUC would be required to engage in<br />
ongoing coordination with the appropriate jurisdictional agencies through the TASC.<br />
No additional mitigation would be required.<br />
SFPUC <strong>San</strong> <strong>Francisco</strong> Groundwater Supply Project Draft EIR B‐50 March 2013<br />
Case No. 2008.1122E
Appendix B<br />
WSIP PEIR Consistency Analysis and Mitigation Measures, Applicability to the Proposed Project<br />
TABLE B‐1 (Continued)<br />
PEIR MITIGATION MEASURES – CONSISTENCY REVIEW FOR THE GROUNDWATER SUPPLY PROJECT<br />
PEIR Mitigation Measure(s)<br />
Applicable to<br />
Proposed Project<br />
(Y/N)?<br />
Discussion<br />
Westside Groundwater Basin Resources<br />
Measure 5.6‐1, Groundwater Monitoring to Determine Basin Safe Yield: The SFPUC<br />
will continue ongoing studies, including the existing groundwater and lake level<br />
monitoring programs, to determine the safe yield of the North Westside Groundwater<br />
Basin in order to avoid overdraft and associated effects including adverse effects on<br />
surface water features and seawater intrusion. Using this data, the SFPUC will develop<br />
and implement a plan identifying appropriate pumping patterns to avoid overdraft<br />
and the undesirable effects associated with overdraft. The plan will establish both a<br />
regular (average annual) and an intermittent (dry year or emergency) yield as well as a<br />
strategy for modifying pumping patterns such that the pumping levels can be<br />
sustained as an ongoing reliable water supply without depletion of groundwater<br />
storage or degradation of water quality.<br />
Measure 5.6‐2, Implementation of a Lake Level Management Plan:The SFPUC will<br />
develop and implement a lake level management plan identifying strategies for<br />
altering pumping patterns or lake augmentation to maintain Lake Merced water levels<br />
within the desired long‐term range should monitoring conducted under Measure 5.6‐1<br />
indicate the potential for adverse effects on lake levels due to groundwater pumping.<br />
The SFPUC will coordinate the implementation of this measure with Measure 5.6‐1.<br />
Measure 5.6‐5, Drinking Water Source Assessments for Groundwater Wells: As<br />
required by the California <strong>Department</strong> of Health Services and incorporated as part of<br />
the WSIP, the SFPUC will prepare drinking water source assessments for groundwater<br />
wells constructed under the Local and Regional Groundwater Projects (SF‐2) and will<br />
update these assessments every five years. If the assessment indicates no potential for<br />
contamination, then no mitigation is required. However, for wells that are considered<br />
vulnerable to contamination on the basis of the drinking water source assessment, the<br />
SFPUC will develop and implement a source water protection program specifying<br />
actions and a program to be implemented to prevent contamination of the drinking<br />
water source.<br />
The source water protection program could include nonregulatory components such as<br />
watershed restoration, stormwater monitoring, groundwater monitoring, and public<br />
Y<br />
Y<br />
Y<br />
See Mitigation Measure M‐HY‐8a (Expand Coastal Monitoring Network) and<br />
Mitigation Measure M‐HY‐8b (Continuous Groundwater Monitoring in the Primary<br />
Production Aquifer) and Mitigation Measure M‐HY‐8c (Adaptive Management Program<br />
for Seawater Intrusion).<br />
The project‐level measures require the SFPUC to rehabilitate existing groundwater wells<br />
in the western portion of Golden Gate Park or install new groundwater monitoring wells<br />
between the Pacific Coast and the South Windmill Replacement and North Lake well<br />
facilities. The wells would be monitored on a quarterly basis for a minimum of one<br />
year prior to operation of the well facilities proposed in Golden Gate Park. To<br />
effectively detect for seawater intrusion, the SFPUC shall also install transducers in<br />
coastal monitoring wells in the Primary Production Aquifer. Measure M‐HY‐8c would<br />
ensure that the project is implemented in a stepwise manner, conduct monitoring to<br />
detect seawater intrusion and alter pumping to prevent seawater intrusion.<br />
See Mitigation Measure M‐HY‐9 (Lake‐Level Management for Lake Merced).<br />
The project‐level measure requires that the SFPUC implement the proposed project in<br />
a stepwise manner and to conduct monitoring to detect changes in lake level and water<br />
quality as well as groundwater‐level elevations, and respond to project‐related<br />
changes. If needed, lake levels may be augmented by adding supplemental water<br />
(SFPUC system water, treated stormwater, or recycled water) if available. The measure<br />
includes a list of procedures to be implemented for the purposes of detecting potential<br />
adverse effects on water quality at Lake Merced.<br />
See Mitigation Measure M‐HY‐11 (Prepare a Source Water Protection Program and<br />
Update Drinking Water Source Assessment).<br />
To prevent contamination of well facilities, the project‐level measure requires the<br />
SFPUC to develop and implement a source water protection program that includes<br />
various components including integration with the Westside Basin Groundwater<br />
Monitoring Program, cooperation with the <strong>San</strong> <strong>Francisco</strong> <strong>Department</strong> of Public Health,<br />
cooperation with the SFPUC Wastewater Enterprise’s Urban Watershed Management<br />
Program and coordination with the <strong>San</strong> <strong>Francisco</strong> <strong>Planning</strong> <strong>Department</strong>. In the event<br />
that potential contamination is identified, the measure also requires the SFPUC to<br />
increase monitoring frequency at the potentially affected well, investigate the potential<br />
source of contamination and coordination with the <strong>San</strong> <strong>Francisco</strong> <strong>Department</strong> of Public<br />
Health or RWQCB.<br />
SFPUC <strong>San</strong> <strong>Francisco</strong> Groundwater Supply Project Draft EIR B‐51 March 2013<br />
Case No. 2008.1122E
Appendix B<br />
WSIP PEIR Consistency Analysis and Mitigation Measures, Applicability to the Proposed Project<br />
TABLE B‐1 (Continued)<br />
PEIR MITIGATION MEASURES – CONSISTENCY REVIEW FOR THE GROUNDWATER SUPPLY PROJECT<br />
PEIR Mitigation Measure(s)<br />
Applicable to<br />
Proposed Project<br />
(Y/N)?<br />
Discussion<br />
education to protect drinking water quality. Land use planning, permitting, and<br />
possibly more restrictive regulatory methods may also be implemented by the local<br />
municipality where a threat to drinking water quality is indicated, and management of<br />
potential sources of microbiological or direct chemical contamination to eliminate or<br />
reduce the risk of contamination of the water supply may be considered. The SFPUC<br />
will encourage public participation in the development of the program and will update<br />
the program every five years along with the drinking water source assessments.<br />
NOTES:<br />
(a) See WSIP PEIR, Volume 4, Chapter 6, Table 6‐2, for description of standard programmatic biological resources mitigation measures that correspond to each special status species.<br />
SFPUC <strong>San</strong> <strong>Francisco</strong> Groundwater Supply Project Draft EIR B‐52 March 2013<br />
Case No. 2008.1122E
APPENDIX C<br />
Vegetation Change Analysis Methodology<br />
Appendix C summarizes the Lake Merced vegetation change analysis conducted by ESA for the<br />
<strong>San</strong> <strong>Francisco</strong> Groundwater Supply Project and the Groundwater Storage and Recovery Project<br />
EIRs. Both projects have the potential to result in lake level decreases and the Groundwater<br />
Storage and Recovery Project has the potential to result in lake level increases. Therefore, this<br />
methodology addresses both water level increases and decreases. Building upon prior studies,<br />
ESA updated a GIS vegetation layer created by Nomad Ecology in 2010 1 . Using ArcGIS, ESA<br />
overlaid the 2010 vegetation data on a high resolution 2011 aerial photograph and then groundtruthed<br />
the resulting imagery in the field in May 2012. In general, the 2010 data correlated well<br />
with aerial signatures of the various vegetation types on the 2010 aerial photo and conditions on<br />
the ground. All discrepancies were mapped in the field and the 2010 vegetation layer was<br />
updated using the annotated field maps and aerial interpretation comparing the 2008 and 2011<br />
aerials. To reduce the complexity of modeling vegetation change in response to water level<br />
management, many of the distinct vegetation types mapped by Nomad Ecology (2011) were<br />
combined with similar types. Table 5.14‐5 in the Approach to Analysis subsection of the<br />
Biological Resources Groundwater Pumping Impacts section presents the results of the<br />
vegetation mapping update, along with results from 2002, and 2010, for comparative purposes.<br />
See Figure 5.14‐1 in the Biological Resources Environmental Setting section for the updated Lake<br />
Merced vegetation map.<br />
A GIS database was constructed using LIDAR (Foxgrover and Barnard, 2012) surface topographic<br />
data, and bathymetric data supplied by SFPUC (Sea Survey/Entrix, 1987; Talavera & Richardson,<br />
2001). The two data sets differ substantially in precision and vertical control, such that the<br />
bathymetric data were adjusted by hand to conform more closely with the greater vertical<br />
precision of the LIDAR data 2 as well as current aerial photos (USGS, 2011). For example, in many<br />
cases, overlays of vegetation mapping and the bathymetric data resulted in the appearance of<br />
certain species or vegetation types occurring in much deeper water than field observations would<br />
support.<br />
1 The 2010 GIS vegetation layer was created by Nomad (2011) using heads up digitizing on a 2008 aerial photo base and<br />
then verifying the results in the field.<br />
2 The original bathymetric data created by Sea Survey and Entrix in 1987 was digitized from a scanned image and<br />
adjusted to “fit” a 2001 orthophoto background by Talavera & Richardson in 2001. Upon comparing the bathymetric<br />
data with April, 2011 aerial imagery it was clear that the data did not fit within the confines of lake as shown in the<br />
current aerial imagery. ESA adjusted the bathymetry again to fit the current imagery. The accuracy of the bathymetric<br />
data affects the amount of vegetation impacted with decreasing water surface elevation, which may be overestimated<br />
or underestimated.<br />
SFPUC <strong>San</strong> <strong>Francisco</strong> Groundwater Supply Project Draft EIR C‐1 March 2013<br />
Case No. 2008.1122E
Appendix C<br />
Vegetation Change Analysis Methodology<br />
A set action of ‘action rules’ was developed to predict the response of different vegetation types<br />
to changing inundation levels. Action rules were drawn from previous modeling efforts specific<br />
to Lake Merced (Stillwater Sciences, 2009; EDAW, 2004) and Lower Crystal Springs Reservoir<br />
(ESA, 2009), available literature on vegetation tolerance to inundation, and field observations.<br />
The action rules (see Table C‐1) are based on the following general principles:<br />
TABLE C‐1<br />
VEGETATION MODEL ACTION RULES<br />
Class/Vegetation Type Remove: Add: Replacer Status Conflict rule for Adding:<br />
Class1 a<br />
Bulrush wetland
Appendix C<br />
Vegetation Change Analysis Methodology<br />
The upper and lower limits of wetland vegetation depend on depth of inundation and<br />
inundation tolerance. For example, most herbaceous wetlands fringing Lake Merced occur<br />
no higher than one foot above the projected existing conditions mean WSE of 5.7 feet and at<br />
assumed depths no greater than two feet below WSE. The wetland species that make up<br />
these communities do not require year‐round inundation. In contrast, bulrush wetlands<br />
require at least 9 months inundation or soil saturation, readily tolerate permanent<br />
inundation, and are found at elevations no more than 1 foot above the seasonal high water<br />
elevation, and no greater than 5 feet lower than mean WSE.<br />
Vegetation was categorized into three classes associated with water inundation tolerance.<br />
Inundation tolerance is largely a function of seasonal fluctuations in lake levels. Monthly water<br />
levels increase up to one foot above the annual average during winter (February through May),<br />
declining to one foot below average annual water level towards the end of the growing season<br />
(August through November) (Stillwater, 2009). Class 1 includes vegetation types that are<br />
extremely tolerant and can survive permanent inundation. Class 2 vegetation is somewhat<br />
tolerant and can survive partial inundation due to seasonal variations. Class 3 vegetation is<br />
intolerant and cannot survive seasonal inundation. ESA developed action rules based on this<br />
classification that determined how vegetation would die or establish as WSE rises.<br />
Replacement criteria not only took elevation relative to WSE into account but also adjacency of<br />
vegetation types. Overlapping depth tolerance among different wetland types requires complex<br />
rules for resolving conflicts when two wetland types have the potential to occupy the same<br />
elevation zone. For the purposes of the analysis, therefore, these conflicts were resolved by<br />
creating action rules that restrict the amount of overlap. The action rules also govern interactions<br />
between vegetation types for projected WSE that would cause the loss of one type and its<br />
replacement by one or more other type. For example, bulrush and knotweed have a somewhat<br />
overlapping tolerance to inundation. Priority rules for replacement instruct the GIS‐based<br />
analysis to replace a “drowned” vegetation type with bulrush or knotweed (the most aggressive<br />
“replacer” types) based on the elevation of the replaced vegetation and its proximity to the<br />
nearest replacer type.<br />
The GIS‐based analysis was conducted to estimate vegetation response to changes in lake levels<br />
over time using the newly updated vegetation data, topography, bathymetry, slope, output from<br />
the water level models (Kennedy/Jenks, 2012), and the action rules for vegetation change. The<br />
2012 vegetation mapping update was based on an April 2011 aerial photograph, at which time,<br />
according to historic water surface elevation data (SFPUC, 2011), Lake Merced water surface<br />
elevation was at about 7 feet City Datum, and field observations made in May, 2012. Because the<br />
field mapping corresponded well with the 2011 aerial photograph, existing acreages for each<br />
vegetation type were assigned to the 7 foot water surface elevation. Based on the 2012 vegetation<br />
data and the 7 foot water surface elevation acreages and using the methods described below for<br />
rising and receding water levels, the GIS‐based analysis then calculated a predicted acreage for<br />
each vegetation type at each water surface elevation between ‐10 and 13 feet City Datum (see<br />
Table C‐18, which includes predicted acreages for all vegetation and cover types). The analysis<br />
only included vegetation at or below 13 feet City Datum, since this is the maximum possible lake<br />
water level due to the existing spillway height and therefore, elevation, at which vegetation<br />
SFPUC <strong>San</strong> <strong>Francisco</strong> Groundwater Supply Project Draft EIR C‐3 March 2013<br />
Case No. 2008.1122E
Appendix C<br />
Vegetation Change Analysis Methodology<br />
change would be expected due to changes in WSE. Therefore, for the upland vegetation types<br />
and for arroyo willow riparian scrub, acreage located above the 13 foot elevation, as mapped in<br />
Figure 15.4‐1 in Section 15.4, Biological Resources, would remain unchanged.<br />
To estimate impacts to vegetation associated with water surface elevation change it is necessary<br />
to have an accurate topographical representation of the area. For elevation above the surface of<br />
Lake Merced, ESA obtained a high resolution Lidar derived digital elevation model (DEM) to<br />
provide accurate elevation data. Past Lake Merced inundation studies used 1 foot<br />
photogrametically created elevation contour data derived from flights of the area in 1996. The<br />
Lidar derived elevation data were used in place of the photogrammetry data because they are<br />
considerably more current (2010) and determined to be a better representation of current<br />
conditions 3 . From the DEM, ESA created 1 foot elevation contour polygons so that areas could be<br />
calculated for each elevation range. For bathymetric topography ESA used contour data provided<br />
by the SFPUC. These contours were originally created from depth soundings of the lakes in 1987;<br />
the data was subsequently adjusted in 2001 to fit current aerial photos of that time. Visual<br />
analysis of the contour data compared to current aerial photos (2011) revealed inconsistencies<br />
along the shoreline. It was therefore necessary to modify the bathymetric data to match the aerial<br />
photos and surface DEM to create an accurate topographical representation. The adjusted<br />
bathymetric data was converted to a Triangular Irregular Network (TIN) which in turn was used<br />
to produce 1 foot contour polygons by interpolating elevation gaps in the original contour data.<br />
The 1 foot bathymetric elevation contours and the 1 foot DEM derived surface elevation contours<br />
were then combined to create a complete elevation dataset of the area. This finished elevation<br />
dataset was intersected with the vegetation data to determine distribution of vegetation by<br />
elevation ranges.<br />
Two different approaches were used to estimate impacts to vegetation associated with increasing<br />
and decreasing water surface elevation under the proposed project. For impacts associated with<br />
water surface increase, a GIS approach similar to past inundation studies was used. As described<br />
above, action rules were established for each vegetation type dictating how vegetation would<br />
respond to increasing water surface elevation. Once the action rules were established for a<br />
relative water surface elevation, they were applied to every 1 foot contour up to the 13 foot<br />
spillway elevation. The resulting vegetation statistics were used to determine impacts to<br />
vegetation types due to increase in water surface elevation.<br />
For decreasing water levels, a statistical approach was used to determine vegetation response.<br />
Unlike water rising scenarios in which parameters can be applied to current vegetation, the<br />
majority of land associated with decreasing water levels is currently inundated and free of<br />
vegetation (except for certain wetland species). For this approach ESA analyzed the proportions<br />
of vegetation at each elevation contour relative to the current water surface level and applied the<br />
statistics to lower water surface elevation. This approach keeps the vegetation distribution the<br />
same for each elevation range relative to the WSE, but due to differences in area for each<br />
3 Lidar tends to be superior when there is dense vegetative cover. ESA compared aerial photos where the historic<br />
WSE was known with the LIDAR and the photogrammetry derived elevation data and the LIDAR was a better<br />
match relative to the shoreline, which represents the WSE.<br />
SFPUC <strong>San</strong> <strong>Francisco</strong> Groundwater Supply Project Draft EIR C‐4 March 2013<br />
Case No. 2008.1122E
Appendix C<br />
Vegetation Change Analysis Methodology<br />
elevation range the vegetation area totals are different for each modeled WSE. For example, if the<br />
contour range of 0 to 1 foot is currently inhabited with 60 percent bulrush wetland and 40 percent<br />
knotweed wetlands, that proportion (60 percent and 40 percent) would be assigned to the ‐1 to<br />
0 foot contour range modeling a water surface decrease of 1 foot.<br />
In order to determine project impacts on wetlands it was necessary to separate project‐related<br />
impacts from those related to background hydrologic conditions absent the project. The predicted<br />
acreages for each vegetation type in Table C‐18 were used as a base to calculate vegetation<br />
changes relative to each one foot water surface elevation increment between ‐10 feet and 13 feet<br />
City Datum. Since the focus was wetlands, all upland vegetation types were combined for this<br />
analysis. For example, assuming natural hydrology resulted in a water surface elevation of ‐5 feet<br />
City Datum, the calculated increase or decrease in each wetland vegetation type was derived<br />
from their predicted values at each water surface elevation expressed as a percentage of the area<br />
for the vegetation type at ‐5 feet City Datum (see Tables C‐2 through C‐25). Thus, for each water<br />
surface elevation, it was possible to determine a range of elevations within which there would be<br />
no net loss attributable to the proposed project when compared to the impacts of background<br />
hydrology alone.<br />
_________________________<br />
References<br />
EDAW, Lake Merced Initiative to Raise and Maintain Lake Level and Improve Water Quality, Task 4<br />
Technical Memorandum, September 2004.<br />
Environmental Science Associates, Supporting Documentation for CEQA Impact Analysis of<br />
Vegetation/Habitat Impacts Due to Future Operations of Crystal Springs Reservoir Under the<br />
Lower Crystal Springs Dam Improvements Project, Technical Memorandum prepared for: <strong>San</strong><br />
<strong>Francisco</strong> Public Utilities Commission, November 2009.<br />
Foxgrover, A.C. and Barnard, P.L., A seamless, high‐resolution digital elevation model (DEM) of<br />
the north‐central California coast: U.S. Geological Survey Data Series 684, 11 p. and GIS<br />
data files, May 2012. Available online at http://pubs.usgs.gov/ds/684/. Accessed June 19,<br />
2012.<br />
Kennedy/Jenks Consultants, Assessment of Groundwater‐Surface Water Interactions for the Regional<br />
Groundwater Storage and Recovery Project and <strong>San</strong> <strong>Francisco</strong> Groundwater Supply Project, Task<br />
10.2 Technical Memorandum. Prepared for the <strong>San</strong> <strong>Francisco</strong> Public Utilities Commission,<br />
2012.<br />
May and Associates, Draft Botanical Survey Report, Lake Merced Water Level Restoration Project.<br />
Prepared for Winzler & Kelly, August 31, 2009.<br />
Nomad Ecology, Lake Merced Vegetation Mapping Update, Lake Merced Natural Area, City and County<br />
of <strong>San</strong> <strong>Francisco</strong>, California, revised draft. Prepared for <strong>San</strong> <strong>Francisco</strong> Public Utilities<br />
Commission, May 2011.<br />
<strong>San</strong> <strong>Francisco</strong> Public Utilities Commission (SFPUC), Lake Merced Watershed Report, January 2011.<br />
SFPUC <strong>San</strong> <strong>Francisco</strong> Groundwater Supply Project Draft EIR C‐5 March 2013<br />
Case No. 2008.1122E
Appendix C<br />
Vegetation Change Analysis Methodology<br />
<strong>San</strong> <strong>Francisco</strong> Recreation and Park <strong>Department</strong> (SFRPD), Significant Natural Resource Areas – Final<br />
Draft, February 2006.<br />
Sea Survey/Entrix, Bathymetry data of Lake Merced [GIS dataset], 1987; modified by Talavera &<br />
Richardson, 2001.<br />
Stillwater Sciences, Increased Lake Merced Water Level Impacts on Vegetation, Technical Memorandum.<br />
Prepared for the <strong>San</strong> <strong>Francisco</strong> Public Utilities Commission, March 11, 2009.<br />
United States Geological Survey (USGS), USGS High Resolution Orthoimagery for the <strong>San</strong> <strong>Francisco</strong><br />
Urban Area, 2011. Available online at http://seamless.usgs.gov/. Accessed June 19, 2012.<br />
SFPUC <strong>San</strong> <strong>Francisco</strong> Groundwater Supply Project Draft EIR C‐6 March 2013<br />
Case No. 2008.1122E
TABLE C-2: PREDICTED VEGETATION CHANGE AND PERCENT CHANGE RELATIVE TO WATER SURFACE ELEVATION -10 FEET CITY DATUM a<br />
Cover Type<br />
-10 -9 -8 -7 -6 -5 -4 -3 -2 -1 0 1 2 3 4 5 6 ft 7 ft 8 ft 9 ft 10 ft 11 ft 12 ft 13 ft<br />
Arroyo Willow Riparian Scrub 37.89 32.02 27.15 24.11 21.80 20.15 19.31 18.82 18.35 17.77 18.36 21.15 24.45 26.07 24.95 21.54 17.03 12.59 11.86 8.44 6.14 4.26 2.88 0.00<br />
Percent change b 0.0% -15.5% -28.4% -36.4% -42.5% -46.8% -49.1% -50.3% -51.6% -53.1% -51.5% -44.2% -35.5% -31.2% -34.1% -43.2% -55.1% -66.8% -68.7% -77.7% -83.8% -88.7% -92.4% -100.0%<br />
Bulrush Wetland 49.12 46.43 31.72 30.60 28.06 21.76 16.28 14.36 12.78 11.78 10.82 10.42 10.58 11.80 14.49 19.23 25.05 28.15 32.57 38.18 44.74 48.97 40.05 26.81<br />
Percent change 0.0% -5.5% -35.4% -37.7% -42.9% -55.7% -66.8% -70.8% -74.0% -76.0% -78.0% -78.8% -78.5% -76.0% -70.5% -60.9% -49.0% -42.7% -33.7% -22.3% -8.9% -0.3% -18.5% -45.4%<br />
Giant Vetch Wetland 0.38 0.33 0.27 0.20 0.17 0.17 0.17 0.17 0.17 0.16 0.20 0.29 0.38 0.43 0.42 0.35 0.25 0.17 0.17 0.16 0.13 0.08 0.05 0.03<br />
Percent change 0.0% -12.6% -29.6% -47.2% -53.7% -54.8% -55.2% -55.6% -56.0% -56.4% -48.0% -23.3% 1.7% 14.5% 11.7% -7.6% -34.4% -56.0% -56.0% -57.5% -66.2% -78.5% -86.2% -93.4%<br />
Knotweed Wetland 9.56 6.15 4.94 4.75 3.41 1.91 1.40 1.38 1.39 1.41 1.43 1.45 1.50 1.97 3.46 5.63 7.02 6.42 6.89 6.13 3.26 1.20 0.52 0.33<br />
Percent change 0.0% -35.7% -48.3% -50.3% -64.3% -80.0% -85.3% -85.6% -85.4% -85.2% -85.1% -84.8% -84.3% -79.4% -63.8% -41.1% -26.6% -32.8% -27.9% -35.9% -65.9% -87.4% -94.6% -96.5%<br />
Rush Meadow 0.49 0.40 0.32 0.24 0.18 0.16 0.15 0.15 0.15 0.16 0.18 0.27 0.38 0.48 0.53 0.50 0.40 0.29 0.31 0.26 0.14 0.13 0.07 0.02<br />
Percent change 0.0% -18.5% -34.7% -50.9% -63.7% -67.7% -68.8% -68.7% -68.6% -68.6% -63.1% -45.8% -22.2% -2.0% 6.5% 0.6% -19.1% -42.0% -36.8% -47.5% -71.2% -73.9% -86.6% -96.2%<br />
Cattail Wetland 0.01 0.01 0.00 0.00 0.00 0.00 0.00 0.00 0.00 0.00 0.00 0.01 0.01 0.01 0.01 0.01 0.01 0.00 0.00 0.00 0.00 0.00 0.00 0.00<br />
Percent change 0.0% -22.4% -47.0% -64.9% -71.0% -70.7% -70.3% -70.0% -69.6% -69.2% -63.3% -37.4% 6.5% 38.4% 37.3% 8.9% -26.0% -50.6% -50.6% -50.6% -50.6% -50.6% -60.5% -72.8%<br />
Sum Herbaceous Wetland 59.54 53.31 37.24 35.79 31.83 24.01 18.01 16.05 14.49 13.51 12.63 12.43 12.85 14.68 18.89 25.70 32.72 35.02 39.94 44.74 48.27 50.38 40.69 27.19<br />
Percent change 0.0% -10.5% -37.5% -39.9% -46.6% -59.7% -69.8% -73.0% -75.7% -77.3% -78.8% -79.1% -78.4% -75.3% -68.3% -56.8% -45.1% -41.2% -32.9% -24.9% -18.9% -15.4% -31.7% -54.3%<br />
Total Wetland (Willow and Herbaceous) 97.44 85.33 64.39 59.90 53.62 44.16 37.31 34.88 32.84 31.29 30.99 33.58 37.31 40.75 43.85 47.24 49.75 47.61 51.80 53.18 54.41 54.64 43.57 27.19<br />
Percent change 0.0% -12.4% -33.9% -38.5% -45.0% -54.7% -61.7% -64.2% -66.3% -67.9% -68.2% -65.5% -61.7% -58.2% -55.0% -51.5% -48.9% -51.1% -46.8% -45.4% -44.2% -43.9% -55.3% -72.1%<br />
Open Water 128.78 149.87 176.77 185.61 196.09 208.97 218.34 223.08 227.45 231.36 235.23 238.76 242.17 245.57 249.14 252.35 256.40 264.86 266.15 266.46 268.62 268.30 281.06 297.43<br />
Percent change 0.0% 16.4% 37.3% 44.1% 52.3% 62.3% 69.5% 73.2% 76.6% 79.7% 82.7% 85.4% 88.1% 90.7% 93.5% 96.0% 99.1% 105.7% 106.7% 106.9% 108.6% 108.3% 118.2% 131.0%<br />
Upland vegetation c 98.03 89.07 83.12 78.79 74.61 71.21 68.70 66.41 64.10 61.76 58.24 52.22 45.19 38.41 31.79 25.22 18.68 12.37 6.89 5.21 3.51 1.90 0.22 0.22<br />
Percent change 0.0% -9.1% -15.2% -19.6% -23.9% -27.4% -29.9% -32.3% -34.6% -37.0% -40.6% -46.7% -53.9% -60.8% -67.6% -74.3% -80.9% -87.4% -93.0% -94.7% -96.4% -98.1% -99.8% -99.8%<br />
Developed 1.17 1.17 1.17 1.17 1.17 1.17 1.17 1.17 1.17 1.17 1.17 1.17 1.17 1.17 1.17 1.17 1.17 1.17 1.17 1.17 1.17 1.17 1.17 1.17<br />
Percent change 0.0% 0.0% 0.0% 0.0% 0.0% 0.0% 0.0% 0.0% 0.0% 0.0% 0.0% 0.0% 0.0% 0.0% 0.0% 0.0% 0.0% 0.0% 0.0% 0.0% 0.0% 0.0% 0.0% 0.0%<br />
a Acreages in the table are for vegetation at and below 13 feet City Datum; for most upland vegetation types there is additional acreage above an elevation of 13 feet.<br />
b Percent change is relative to vegetation predicted to occur at -10 feet City Datum<br />
c All upland vegetation types were combined for the analysis of receding lake levels<br />
Values in bold indicate an increase in cover type<br />
Values in italic indicate a decrease in cover type<br />
Mean Annual Water Surface Elevation (City Datum)<br />
C-7
TABLE C-3: PREDICTED VEGETATION CHANGE AND PERCENT CHANGE RELATIVE TO WATER SURFACE ELEVATION -9 FEET CITY DATUM a<br />
Cover Type<br />
-10 -9 -8 -7 -6 -5 -4 -3 -2 -1 0 1 2 3 4 5 6 ft 7 ft 8 ft 9 ft 10 ft 11 ft 12 ft 13 ft<br />
Arroyo Willow Riparian Scrub 37.89 32.02 27.15 24.11 21.80 20.15 19.31 18.82 18.35 17.77 18.36 21.15 24.45 26.07 24.95 21.54 17.03 12.59 11.86 8.44 6.14 4.26 2.88 0.00<br />
Percent change b 18.3% 0.0% -15.2% -24.7% -31.9% -37.1% -39.7% -41.2% -42.7% -44.5% -42.6% -33.9% -23.6% -18.6% -22.1% -32.7% -46.8% -60.7% -63.0% -73.6% -80.8% -86.7% -91.0% -100.0%<br />
Bulrush Wetland 49.12 46.43 31.72 30.60 28.06 21.76 16.28 14.36 12.78 11.78 10.82 10.42 10.58 11.80 14.49 19.23 25.05 28.15 32.57 38.18 44.74 48.97 40.05 26.81<br />
Percent change 5.8% 0.0% -31.7% -34.1% -39.6% -53.1% -64.9% -69.1% -72.5% -74.6% -76.7% -77.6% -77.2% -74.6% -68.8% -58.6% -46.1% -39.4% -29.9% -17.8% -3.6% 5.5% -13.7% -42.3%<br />
Giant Vetch Wetland 0.38 0.33 0.27 0.20 0.17 0.17 0.17 0.17 0.17 0.16 0.20 0.29 0.38 0.43 0.42 0.35 0.25 0.17 0.17 0.16 0.13 0.08 0.05 0.03<br />
Percent change 14.4% 0.0% -19.5% -39.7% -47.1% -48.3% -48.7% -49.2% -49.6% -50.1% -40.5% -12.3% 16.2% 30.9% 27.8% 5.6% -24.9% -49.7% -49.7% -51.3% -61.4% -75.4% -84.2% -92.4%<br />
Knotweed Wetland 9.56 6.15 4.94 4.75 3.41 1.91 1.40 1.38 1.39 1.41 1.43 1.45 1.50 1.97 3.46 5.63 7.02 6.42 6.89 6.13 3.26 1.20 0.52 0.33<br />
Percent change 55.4% 0.0% -19.7% -22.8% -44.5% -68.9% -77.2% -77.6% -77.4% -77.1% -76.8% -76.4% -75.6% -68.0% -43.8% -8.5% 14.1% 4.4% 12.1% -0.3% -47.0% -80.5% -91.5% -94.6%<br />
Rush Meadow 0.49 0.40 0.32 0.24 0.18 0.16 0.15 0.15 0.15 0.16 0.18 0.27 0.38 0.48 0.53 0.50 0.40 0.29 0.31 0.26 0.14 0.13 0.07 0.02<br />
Percent change 22.7% 0.0% -19.8% -39.7% -55.5% -60.4% -61.8% -61.6% -61.5% -61.4% -54.7% -33.5% -4.5% 20.2% 30.6% 23.5% -0.7% -28.8% -22.4% -35.5% -64.7% -68.0% -83.5% -95.3%<br />
Cattail Wetland 0.01 0.01 0.00 0.00 0.00 0.00 0.00 0.00 0.00 0.00 0.00 0.01 0.01 0.01 0.01 0.01 0.01 0.00 0.00 0.00 0.00 0.00 0.00 0.00<br />
Percent change 28.8% 0.0% -31.8% -54.8% -62.7% -62.2% -61.8% -61.3% -60.8% -60.4% -52.7% -19.4% 37.1% 78.2% 76.8% 40.2% -4.7% -36.4% -36.4% -36.4% -36.4% -36.4% -49.1% -65.0%<br />
Sum Herbaceous Wetland 59.54 53.31 37.24 35.79 31.83 24.01 18.01 16.05 14.49 13.51 12.63 12.43 12.85 14.68 18.89 25.70 32.72 35.02 39.94 44.74 48.27 50.38 40.69 27.19<br />
Percent change 11.7% 0.0% -30.1% -32.9% -40.3% -55.0% -66.2% -69.9% -72.8% -74.7% -76.3% -76.7% -75.9% -72.5% -64.6% -51.8% -38.6% -34.3% -25.1% -16.1% -9.5% -5.5% -23.7% -49.0%<br />
Total Wetland (Willow and Herbaceous) 97.44 85.33 64.39 59.90 53.62 44.16 37.31 34.88 32.84 31.29 30.99 33.58 37.31 40.75 43.85 47.24 49.75 47.61 51.80 53.18 54.41 54.64 43.57 27.19<br />
Percent change 14.2% 0.0% -24.5% -29.8% -37.2% -48.2% -56.3% -59.1% -61.5% -63.3% -63.7% -60.6% -56.3% -52.2% -48.6% -44.6% -41.7% -44.2% -39.3% -37.7% -36.2% -36.0% -48.9% -68.1%<br />
Open Water 128.78 149.87 176.77 185.61 196.09 208.97 218.34 223.08 227.45 231.36 235.23 238.76 242.17 245.57 249.14 252.35 256.40 264.86 266.15 266.46 268.62 268.30 281.06 297.43<br />
Percent change -14.1% 0.0% 17.9% 23.9% 30.8% 39.4% 45.7% 48.9% 51.8% 54.4% 57.0% 59.3% 61.6% 63.9% 66.2% 68.4% 71.1% 76.7% 77.6% 77.8% 79.2% 79.0% 87.5% 98.5%<br />
Upland vegetation c 98.03 89.07 83.12 78.79 74.61 71.21 68.70 66.41 64.10 61.76 58.24 52.22 45.19 38.41 31.79 25.22 18.68 12.37 6.89 5.21 3.51 1.90 0.22 0.22<br />
Percent change 10.1% 0.0% -6.7% -11.5% -16.2% -20.1% -22.9% -25.4% -28.0% -30.7% -34.6% -41.4% -49.3% -56.9% -64.3% -71.7% -79.0% -86.1% -92.3% -94.2% -96.1% -97.9% -99.8% -99.8%<br />
Developed 1.17 1.17 1.17 1.17 1.17 1.17 1.17 1.17 1.17 1.17 1.17 1.17 1.17 1.17 1.17 1.17 1.17 1.17 1.17 1.17 1.17 1.17 1.17 1.17<br />
Percent change 0.0% 0.0% 0.0% 0.0% 0.0% 0.0% 0.0% 0.0% 0.0% 0.0% 0.0% 0.0% 0.0% 0.0% 0.0% 0.0% 0.0% 0.0% 0.0% 0.0% 0.0% 0.0% 0.0% 0.0%<br />
a Acreages in the table are for vegetation at and below 13 feet City Datum; for most upland vegetation types there is additional acreage above an elevation of 13 feet.<br />
b Percent change is relative to vegetation predicted to occur at -9 feet City Datum<br />
c<br />
All upland vegetation types were combined for the analysis of receding lake levels<br />
Values in bold indicate an increase in cover type<br />
Values in italic indicate a decrease in cover type<br />
Mean Annual Water Surface Elevation (City Datum)<br />
C-8
TABLE C-4: PREDICTED VEGETATION CHANGE AND PERCENT CHANGE RELATIVE TO WATER SURFACE ELEVATION -8 FEET CITY DATUM a<br />
Cover Type<br />
-10 -9 -8 -7 -6 -5 -4 -3 -2 -1 0 1 2 3 4 5 6 ft 7 ft 8 ft 9 ft 10 ft 11 ft 12 ft 13 ft<br />
Arroyo Willow Riparian Scrub 37.89 32.02 27.15 24.11 21.80 20.15 19.31 18.82 18.35 17.77 18.36 21.15 24.45 26.07 24.95 21.54 17.03 12.59 11.86 8.44 6.14 4.26 2.88 0.00<br />
Percent change b 39.6% 17.9% 0.0% -11.2% -19.7% -25.8% -28.9% -30.7% -32.4% -34.5% -32.4% -22.1% -9.9% -4.0% -8.1% -20.7% -37.3% -53.6% -56.3% -68.9% -77.4% -84.3% -89.4% -100.0%<br />
Bulrush Wetland 49.12 46.43 31.72 30.60 28.06 21.76 16.28 14.36 12.78 11.78 10.82 10.42 10.58 11.80 14.49 19.23 25.05 28.15 32.57 38.18 44.74 48.97 40.05 26.81<br />
Percent change 54.9% 46.4% 0.0% -3.5% -11.5% -31.4% -48.7% -54.7% -59.7% -62.8% -65.9% -67.1% -66.6% -62.8% -54.3% -39.4% -21.0% -11.2% 2.7% 20.4% 41.1% 54.4% 26.3% -15.5%<br />
Giant Vetch Wetland 0.38 0.33 0.27 0.20 0.17 0.17 0.17 0.17 0.17 0.16 0.20 0.29 0.38 0.43 0.42 0.35 0.25 0.17 0.17 0.16 0.13 0.08 0.05 0.03<br />
Percent change 42.1% 24.3% 0.0% -25.0% -34.2% -35.7% -36.3% -36.8% -37.4% -38.0% -26.1% 9.0% 44.5% 62.7% 58.8% 31.3% -6.7% -37.5% -37.5% -39.5% -52.0% -69.5% -80.3% -90.5%<br />
Knotweed Wetland 9.56 6.15 4.94 4.75 3.41 1.91 1.40 1.38 1.39 1.41 1.43 1.45 1.50 1.97 3.46 5.63 7.02 6.42 6.89 6.13 3.26 1.20 0.52 0.33<br />
Percent change 93.4% 24.5% 0.0% -3.9% -31.0% -61.3% -71.6% -72.2% -71.8% -71.5% -71.1% -70.6% -69.6% -60.1% -30.0% 13.9% 42.0% 29.9% 39.5% 24.1% -34.0% -75.7% -89.5% -93.2%<br />
Rush Meadow 0.49 0.40 0.32 0.24 0.18 0.16 0.15 0.15 0.15 0.16 0.18 0.27 0.38 0.48 0.53 0.50 0.40 0.29 0.31 0.26 0.14 0.13 0.07 0.02<br />
Percent change 53.0% 24.7% 0.0% -24.8% -44.5% -50.6% -52.3% -52.2% -52.0% -51.9% -43.5% -17.1% 19.1% 49.9% 62.9% 54.0% 23.9% -11.2% -3.2% -19.6% -56.0% -60.1% -79.5% -94.1%<br />
Cattail Wetland 0.01 0.01 0.00 0.00 0.00 0.00 0.00 0.00 0.00 0.00 0.00 0.01 0.01 0.01 0.01 0.01 0.01 0.00 0.00 0.00 0.00 0.00 0.00 0.00<br />
Percent change 88.8% 46.6% 0.0% -33.7% -45.3% -44.6% -44.0% -43.3% -42.6% -41.9% -30.7% 18.2% 101.0% 161.3% 159.2% 105.5% 39.6% -6.8% -6.8% -6.8% -6.8% -6.8% -25.4% -48.7%<br />
Sum Herbaceous Wetland 59.54 53.31 37.24 35.79 31.83 24.01 18.01 16.05 14.49 13.51 12.63 12.43 12.85 14.68 18.89 25.70 32.72 35.02 39.94 44.74 48.27 50.38 40.69 27.19<br />
Percent change 59.9% 43.1% 0.0% -3.9% -14.5% -35.5% -51.6% -56.9% -61.1% -63.7% -66.1% -66.6% -65.5% -60.6% -49.3% -31.0% -12.2% -6.0% 7.2% 20.1% 29.6% 35.3% 9.3% -27.0%<br />
Total Wetland (Willow and Herbaceous) 97.44 85.33 64.39 59.90 53.62 44.16 37.31 34.88 32.84 31.29 30.99 33.58 37.31 40.75 43.85 47.24 49.75 47.61 51.80 53.18 54.41 54.64 43.57 27.19<br />
Percent change 51.3% 32.5% 0.0% -7.0% -16.7% -31.4% -42.1% -45.8% -49.0% -51.4% -51.9% -47.9% -42.1% -36.7% -31.9% -26.6% -22.7% -26.1% -19.6% -17.4% -15.5% -15.1% -32.3% -57.8%<br />
Open Water 128.78 149.87 176.77 185.61 196.09 208.97 218.34 223.08 227.45 231.36 235.23 238.76 242.17 245.57 249.14 252.35 256.40 264.86 266.15 266.46 268.62 268.30 281.06 297.43<br />
Percent change -27.1% -15.2% 0.0% 5.0% 10.9% 18.2% 23.5% 26.2% 28.7% 30.9% 33.1% 35.1% 37.0% 38.9% 40.9% 42.8% 45.0% 49.8% 50.6% 50.7% 52.0% 51.8% 59.0% 68.3%<br />
Upland vegetation c 98.03 89.07 83.12 78.79 74.61 71.21 68.70 66.41 64.10 61.76 58.24 52.22 45.19 38.41 31.79 25.22 18.68 12.37 6.89 5.21 3.51 1.90 0.22 0.22<br />
Percent change 17.9% 7.2% 0.0% -5.2% -10.2% -14.3% -17.3% -20.1% -22.9% -25.7% -29.9% -37.2% -45.6% -53.8% -61.8% -69.7% -77.5% -85.1% -91.7% -93.7% -95.8% -97.7% -99.7% -99.7%<br />
Developed 1.17 1.17 1.17 1.17 1.17 1.17 1.17 1.17 1.17 1.17 1.17 1.17 1.17 1.17 1.17 1.17 1.17 1.17 1.17 1.17 1.17 1.17 1.17 1.17<br />
Percent change 0.0% 0.0% 0.0% 0.0% 0.0% 0.0% 0.0% 0.0% 0.0% 0.0% 0.0% 0.0% 0.0% 0.0% 0.0% 0.0% 0.0% 0.0% 0.0% 0.0% 0.0% 0.0% 0.0% 0.0%<br />
a Acreages in the table are for vegetation at and below 13 feet City Datum; for most upland vegetation types there is additional acreage above an elevation of 13 feet.<br />
b Percent change is relative to vegetation predicted to occur at -8 feet City Datum<br />
c All upland vegetation types were combined for the analysis of receding lake levels<br />
Values in bold indicate an increase in cover type<br />
Values in italic indicate a decrease in cover type<br />
Mean Annual Water Surface Elevation (City Datum)<br />
C-9
TABLE C-5: PREDICTED VEGETATION CHANGE AND PERCENT CHANGE RELATIVE TO WATER SURFACE ELEVATION -7 FEET CITY DATUM a<br />
Cover Type<br />
-10 -9 -8 -7 -6 -5 -4 -3 -2 -1 0 1 2 3 4 5 6 ft 7 ft 8 ft 9 ft 10 ft 11 ft 12 ft 13 ft<br />
Arroyo Willow Riparian Scrub 37.89 32.02 27.15 24.11 21.80 20.15 19.31 18.82 18.35 17.77 18.36 21.15 24.45 26.07 24.95 21.54 17.03 12.59 11.86 8.44 6.14 4.26 2.88 0.00<br />
Percent change b 57.2% 32.8% 12.6% 0.0% -9.6% -16.4% -19.9% -21.9% -23.9% -26.3% -23.8% -12.3% 1.4% 8.1% 3.5% -10.7% -29.4% -47.8% -50.8% -65.0% -74.5% -82.3% -88.1% -100.0%<br />
Bulrush Wetland 49.12 46.43 31.72 30.60 28.06 21.76 16.28 14.36 12.78 11.78 10.82 10.42 10.58 11.80 14.49 19.23 25.05 28.15 32.57 38.18 44.74 48.97 40.05 26.81<br />
Percent change 60.5% 51.7% 3.6% 0.0% -8.3% -28.9% -46.8% -53.1% -58.2% -61.5% -64.6% -66.0% -65.4% -61.4% -52.7% -37.2% -18.2% -8.0% 6.4% 24.8% 46.2% 60.0% 30.9% -12.4%<br />
Giant Vetch Wetland 0.38 0.33 0.27 0.20 0.17 0.17 0.17 0.17 0.17 0.16 0.20 0.29 0.38 0.43 0.42 0.35 0.25 0.17 0.17 0.16 0.13 0.08 0.05 0.03<br />
Percent change 89.6% 65.8% 33.4% 0.0% -12.3% -14.2% -15.0% -15.8% -16.5% -17.3% -1.4% 45.4% 92.7% 117.0% 111.8% 75.1% 24.4% -16.6% -16.6% -19.4% -36.0% -59.3% -73.8% -87.4%<br />
Knotweed Wetland 9.56 6.15 4.94 4.75 3.41 1.91 1.40 1.38 1.39 1.41 1.43 1.45 1.50 1.97 3.46 5.63 7.02 6.42 6.89 6.13 3.26 1.20 0.52 0.33<br />
Percent change 101.3% 29.5% 4.1% 0.0% -28.1% -59.7% -70.5% -71.0% -70.7% -70.3% -69.9% -69.4% -68.4% -58.5% -27.2% 18.5% 47.8% 35.2% 45.2% 29.1% -31.3% -74.7% -89.0% -93.0%<br />
Rush Meadow 0.49 0.40 0.32 0.24 0.18 0.16 0.15 0.15 0.15 0.16 0.18 0.27 0.38 0.48 0.53 0.50 0.40 0.29 0.31 0.26 0.14 0.13 0.07 0.02<br />
Percent change 103.5% 65.9% 33.0% 0.0% -26.2% -34.3% -36.6% -36.4% -36.2% -36.0% -24.8% 10.3% 58.4% 99.4% 116.7% 104.8% 64.7% 18.1% 28.7% 6.9% -41.4% -46.9% -72.7% -92.2%<br />
Cattail Wetland 0.01 0.01 0.00 0.00 0.00 0.00 0.00 0.00 0.00 0.00 0.00 0.01 0.01 0.01 0.01 0.01 0.01 0.00 0.00 0.00 0.00 0.00 0.00 0.00<br />
Percent change 184.9% 121.2% 50.9% 0.0% -17.5% -16.5% -15.4% -14.4% -13.4% -12.3% 4.6% 78.4% 203.4% 294.3% 291.1% 210.2% 110.7% 40.6% 40.6% 40.6% 40.6% 40.6% 12.5% -22.6%<br />
Sum Herbaceous Wetland 59.54 53.31 37.24 35.79 31.83 24.01 18.01 16.05 14.49 13.51 12.63 12.43 12.85 14.68 18.89 25.70 32.72 35.02 39.94 44.74 48.27 50.38 40.69 27.19<br />
Percent change 66.4% 48.9% 4.1% 0.0% -11.1% -32.9% -49.7% -55.1% -59.5% -62.2% -64.7% -65.3% -64.1% -59.0% -47.2% -28.2% -8.6% -2.1% 11.6% 25.0% 34.9% 40.8% 13.7% -24.0%<br />
Total Wetland (Willow and Herbaceous) 97.44 85.33 64.39 59.90 53.62 44.16 37.31 34.88 32.84 31.29 30.99 33.58 37.31 40.75 43.85 47.24 49.75 47.61 51.80 53.18 54.41 54.64 43.57 27.19<br />
Percent change 62.7% 42.5% 7.5% 0.0% -10.5% -26.3% -37.7% -41.8% -45.2% -47.8% -48.3% -43.9% -37.7% -32.0% -26.8% -21.1% -16.9% -20.5% -13.5% -11.2% -9.2% -8.8% -27.3% -54.6%<br />
Open Water 128.78 149.87 176.77 185.61 196.09 208.97 218.34 223.08 227.45 231.36 235.23 238.76 242.17 245.57 249.14 252.35 256.40 264.86 266.15 266.46 268.62 268.30 281.06 297.43<br />
Percent change -30.6% -19.3% -4.8% 0.0% 5.6% 12.6% 17.6% 20.2% 22.5% 24.6% 26.7% 28.6% 30.5% 32.3% 34.2% 36.0% 38.1% 42.7% 43.4% 43.6% 44.7% 44.5% 51.4% 60.2%<br />
Upland vegetation c 98.03 89.07 83.12 78.79 74.61 71.21 68.70 66.41 64.10 61.76 58.24 52.22 45.19 38.41 31.79 25.22 18.68 12.37 6.89 5.21 3.51 1.90 0.22 0.22<br />
Percent change 24.4% 13.0% 5.5% 0.0% -5.3% -9.6% -12.8% -15.7% -18.6% -21.6% -26.1% -33.7% -42.6% -51.2% -59.6% -68.0% -76.3% -84.3% -91.3% -93.4% -95.5% -97.6% -99.7% -99.7%<br />
Developed 1.17 1.17 1.17 1.17 1.17 1.17 1.17 1.17 1.17 1.17 1.17 1.17 1.17 1.17 1.17 1.17 1.17 1.17 1.17 1.17 1.17 1.17 1.17 1.17<br />
Percent change 0.0% 0.0% 0.0% 0.0% 0.0% 0.0% 0.0% 0.0% 0.0% 0.0% 0.0% 0.0% 0.0% 0.0% 0.0% 0.0% 0.0% 0.0% 0.0% 0.0% 0.0% 0.0% 0.0% 0.0%<br />
a Acreages in the table are for vegetation at and below 13 feet City Datum; for most upland vegetation types there is additional acreage above an elevation of 13 feet.<br />
b Percent change is relative to vegetation predicted to occur at -7 feet City Datum<br />
c All upland vegetation types were combined for the analysis of receding lake levels<br />
Values in bold indicate an increase in cover type<br />
Values in italic indicate a decrease in cover type<br />
Mean Annual Water Surface Elevation (City Datum)<br />
C-10
TABLE C-6: PREDICTED VEGETATION CHANGE AND PERCENT CHANGE RELATIVE TO WATER SURFACE ELEVATION -6 FEET CITY DATUM a<br />
Cover Type<br />
-10 -9 -8 -7 -6 -5 -4 -3 -2 -1 0 1 2 3 4 5 6 ft 7 ft 8 ft 9 ft 10 ft 11 ft 12 ft 13 ft<br />
Arroyo Willow Riparian Scrub 37.89 32.02 27.15 24.11 21.80 20.15 19.31 18.82 18.35 17.77 18.36 21.15 24.45 26.07 24.95 21.54 17.03 12.59 11.86 8.44 6.14 4.26 2.88 0.00<br />
Percent change b 73.9% 46.9% 24.6% 10.6% 0.0% -7.5% -11.4% -13.6% -15.8% -18.5% -15.7% -3.0% 12.2% 19.6% 14.5% -1.2% -21.9% -42.2% -45.6% -61.3% -71.8% -80.4% -86.8% -100.0%<br />
Bulrush Wetland 49.12 46.43 31.72 30.60 28.06 21.76 16.28 14.36 12.78 11.78 10.82 10.42 10.58 11.80 14.49 19.23 25.05 28.15 32.57 38.18 44.74 48.97 40.05 26.81<br />
Percent change 75.0% 65.5% 13.0% 9.1% 0.0% -22.4% -42.0% -48.8% -54.5% -58.0% -61.4% -62.9% -62.3% -58.0% -48.4% -31.5% -10.7% 0.3% 16.0% 36.1% 59.4% 74.5% 42.7% -4.5%<br />
Giant Vetch Wetland 0.38 0.33 0.27 0.20 0.17 0.17 0.17 0.17 0.17 0.16 0.20 0.29 0.38 0.43 0.42 0.35 0.25 0.17 0.17 0.16 0.13 0.08 0.05 0.03<br />
Percent change 116.1% 88.9% 52.0% 14.0% 0.0% -2.2% -3.1% -4.0% -4.9% -5.8% 12.4% 65.7% 119.6% 147.3% 141.4% 99.6% 41.8% -4.9% -4.9% -8.1% -27.0% -53.6% -70.1% -85.6%<br />
Knotweed Wetland 9.56 6.15 4.94 4.75 3.41 1.91 1.40 1.38 1.39 1.41 1.43 1.45 1.50 1.97 3.46 5.63 7.02 6.42 6.89 6.13 3.26 1.20 0.52 0.33<br />
Percent change 180.2% 80.3% 44.9% 39.2% 0.0% -43.9% -58.9% -59.7% -59.2% -58.7% -58.1% -57.5% -56.0% -42.2% 1.4% 65.0% 105.8% 88.2% 102.1% 79.7% -4.4% -64.8% -84.7% -90.2%<br />
Rush Meadow 0.49 0.40 0.32 0.24 0.18 0.16 0.15 0.15 0.15 0.16 0.18 0.27 0.38 0.48 0.53 0.50 0.40 0.29 0.31 0.26 0.14 0.13 0.07 0.02<br />
Percent change 175.9% 124.8% 80.2% 35.5% 0.0% -10.9% -14.0% -13.8% -13.5% -13.2% 1.9% 49.5% 114.7% 170.2% 193.7% 177.6% 123.2% 60.0% 74.5% 44.9% -20.6% -28.0% -63.0% -89.4%<br />
Cattail Wetland 0.01 0.01 0.00 0.00 0.00 0.00 0.00 0.00 0.00 0.00 0.00 0.01 0.01 0.01 0.01 0.01 0.01 0.00 0.00 0.00 0.00 0.00 0.00 0.00<br />
Percent change 245.3% 168.1% 82.9% 21.2% 0.0% 1.3% 2.5% 3.7% 5.0% 6.3% 26.8% 116.2% 267.7% 377.9% 374.1% 275.9% 155.4% 70.4% 70.4% 70.4% 70.4% 70.4% 36.4% -6.3%<br />
Sum Herbaceous Wetland 59.54 53.31 37.24 35.79 31.83 24.01 18.01 16.05 14.49 13.51 12.63 12.43 12.85 14.68 18.89 25.70 32.72 35.02 39.94 44.74 48.27 50.38 40.69 27.19<br />
Percent change 87.1% 67.5% 17.0% 12.5% 0.0% -24.6% -43.4% -49.6% -54.5% -57.5% -60.3% -61.0% -59.6% -53.9% -40.6% -19.3% 2.8% 10.0% 25.5% 40.6% 51.7% 58.3% 27.9% -14.6%<br />
Total Wetland (Willow and Herbaceous) 97.44 85.33 64.39 59.90 53.62 44.16 37.31 34.88 32.84 31.29 30.99 33.58 37.31 40.75 43.85 47.24 49.75 47.61 51.80 53.18 54.41 54.64 43.57 27.19<br />
Percent change 81.7% 59.1% 20.1% 11.7% 0.0% -17.6% -30.4% -35.0% -38.8% -41.7% -42.2% -37.4% -30.4% -24.0% -18.2% -11.9% -7.2% -11.2% -3.4% -0.8% 1.5% 1.9% -18.7% -49.3%<br />
Open Water 128.78 149.87 176.77 185.61 196.09 208.97 218.34 223.08 227.45 231.36 235.23 238.76 242.17 245.57 249.14 252.35 256.40 264.86 266.15 266.46 268.62 268.30 281.06 297.43<br />
Percent change -34.3% -23.6% -9.9% -5.3% 0.0% 6.6% 11.3% 13.8% 16.0% 18.0% 20.0% 21.8% 23.5% 25.2% 27.1% 28.7% 30.8% 35.1% 35.7% 35.9% 37.0% 36.8% 43.3% 51.7%<br />
Upland vegetation c 98.03 89.07 83.12 78.79 74.61 71.21 68.70 66.41 64.10 61.76 58.24 52.22 45.19 38.41 31.79 25.22 18.68 12.37 6.89 5.21 3.51 1.90 0.22 0.22<br />
Percent change 31.4% 19.4% 11.4% 5.6% 0.0% -4.6% -7.9% -11.0% -14.1% -17.2% -21.9% -30.0% -39.4% -48.5% -57.4% -66.2% -75.0% -83.4% -90.8% -93.0% -95.3% -97.5% -99.7% -99.7%<br />
Developed 1.17 1.17 1.17 1.17 1.17 1.17 1.17 1.17 1.17 1.17 1.17 1.17 1.17 1.17 1.17 1.17 1.17 1.17 1.17 1.17 1.17 1.17 1.17 1.17<br />
Percent change 0.0% 0.0% 0.0% 0.0% 0.0% 0.0% 0.0% 0.0% 0.0% 0.0% 0.0% 0.0% 0.0% 0.0% 0.0% 0.0% 0.0% 0.0% 0.0% 0.0% 0.0% 0.0% 0.0% 0.0%<br />
a Acreages in the table are for vegetation at and below 13 feet City Datum; for most upland vegetation types there is additional acreage above an elevation of 13 feet.<br />
b Percent change is relative to vegetation predicted to occur at -6 feet City Datum<br />
c All upland vegetation types were combined for the analysis of receding lake levels<br />
Values in bold indicate an increase in cover type<br />
Values in italic indicate a decrease in cover type<br />
Mean Annual Water Surface Elevation (City Datum)<br />
C-11
TABLE C-7: PREDICTED VEGETATION CHANGE AND PERCENT CHANGE RELATIVE TO WATER SURFACE ELEVATION -5 FEET CITY DATUM a<br />
Cover Type<br />
-10 -9 -8 -7 -6 -5 -4 -3 -2 -1 0 1 2 3 4 5 6 ft 7 ft 8 ft 9 ft 10 ft 11 ft 12 ft 13 ft<br />
Arroyo Willow Riparian Scrub 37.89 32.02 27.15 24.11 21.80 20.15 19.31 18.82 18.35 17.77 18.36 21.15 24.45 26.07 24.95 21.54 17.03 12.59 11.86 8.44 6.14 4.26 2.88 0.00<br />
Percent change b 88.1% 58.9% 34.7% 19.6% 8.2% 0.0% -4.2% -6.6% -9.0% -11.8% -8.9% 5.0% 21.4% 29.4% 23.8% 6.9% -15.5% -37.5% -41.2% -58.1% -69.5% -78.8% -85.7% -100.0%<br />
Bulrush Wetland 49.12 46.43 31.72 30.60 28.06 21.76 16.28 14.36 12.78 11.78 10.82 10.42 10.58 11.80 14.49 19.23 25.05 28.15 32.57 38.18 44.74 48.97 40.05 26.81<br />
Percent change 125.7% 113.3% 45.7% 40.6% 28.9% 0.0% -25.2% -34.0% -41.3% -45.9% -50.3% -52.1% -51.4% -45.8% -33.4% -11.7% 15.1% 29.3% 49.6% 75.4% 105.5% 125.0% 84.0% 23.2%<br />
Giant Vetch Wetland 0.38 0.33 0.27 0.20 0.17 0.17 0.17 0.17 0.17 0.16 0.20 0.29 0.38 0.43 0.42 0.35 0.25 0.17 0.17 0.16 0.13 0.08 0.05 0.03<br />
Percent change 121.0% 93.3% 55.5% 16.6% 2.3% 0.0% -0.9% -1.8% -2.7% -3.6% 15.0% 69.5% 124.7% 153.0% 146.9% 104.2% 45.1% -2.8% -2.8% -6.0% -25.4% -52.5% -69.4% -85.3%<br />
Knotweed Wetland 9.56 6.15 4.94 4.75 3.41 1.91 1.40 1.38 1.39 1.41 1.43 1.45 1.50 1.97 3.46 5.63 7.02 6.42 6.89 6.13 3.26 1.20 0.52 0.33<br />
Percent change 399.2% 221.2% 158.1% 148.0% 78.2% 0.0% -26.8% -28.1% -27.3% -26.4% -25.4% -24.2% -21.6% 2.9% 80.6% 193.9% 266.6% 235.3% 260.1% 220.2% 70.4% -37.3% -72.8% -82.5%<br />
Rush Meadow 0.49 0.40 0.32 0.24 0.18 0.16 0.15 0.15 0.15 0.16 0.18 0.27 0.38 0.48 0.53 0.50 0.40 0.29 0.31 0.26 0.14 0.13 0.07 0.02<br />
Percent change 209.6% 152.4% 102.3% 52.1% 12.3% 0.0% -3.5% -3.2% -2.9% -2.6% 14.4% 67.8% 141.0% 203.3% 229.7% 211.6% 150.6% 79.6% 95.8% 62.7% -10.9% -19.2% -58.5% -88.1%<br />
Cattail Wetland 0.01 0.01 0.00 0.00 0.00 0.00 0.00 0.00 0.00 0.00 0.00 0.01 0.01 0.01 0.01 0.01 0.01 0.00 0.00 0.00 0.00 0.00 0.00 0.00<br />
Percent change 241.0% 164.8% 80.6% 19.7% -1.2% 0.0% 1.2% 2.5% 3.7% 5.0% 25.2% 113.5% 263.1% 371.9% 368.2% 271.2% 152.2% 68.3% 68.3% 68.3% 68.3% 68.3% 34.7% -7.4%<br />
Sum Herbaceous Wetland 59.54 53.31 37.24 35.79 31.83 24.01 18.01 16.05 14.49 13.51 12.63 12.43 12.85 14.68 18.89 25.70 32.72 35.02 39.94 44.74 48.27 50.38 40.69 27.19<br />
Percent change 148.0% 122.0% 55.1% 49.1% 32.6% 0.0% -25.0% -33.1% -39.6% -43.7% -47.4% -48.2% -46.5% -38.8% -21.3% 7.0% 36.3% 45.9% 66.4% 86.3% 101.1% 109.8% 69.5% 13.3%<br />
Total Wetland (Willow and Herbaceous) 97.44 85.33 64.39 59.90 53.62 44.16 37.31 34.88 32.84 31.29 30.99 33.58 37.31 40.75 43.85 47.24 49.75 47.61 51.80 53.18 54.41 54.64 43.57 27.19<br />
Percent change 120.7% 93.2% 45.8% 35.6% 21.4% 0.0% -15.5% -21.0% -25.6% -29.2% -29.8% -24.0% -15.5% -7.7% -0.7% 7.0% 12.7% 7.8% 17.3% 20.4% 23.2% 23.7% -1.3% -38.4%<br />
Open Water 128.78 149.87 176.77 185.61 196.09 208.97 218.34 223.08 227.45 231.36 235.23 238.76 242.17 245.57 249.14 252.35 256.40 264.86 266.15 266.46 268.62 268.30 281.06 297.43<br />
Percent change -38.4% -28.3% -15.4% -11.2% -6.2% 0.0% 4.5% 6.8% 8.8% 10.7% 12.6% 14.3% 15.9% 17.5% 19.2% 20.8% 22.7% 26.7% 27.4% 27.5% 28.5% 28.4% 34.5% 42.3%<br />
Upland vegetation c 98.03 89.07 83.12 78.79 74.61 71.21 68.70 66.41 64.10 61.76 58.24 52.22 45.19 38.41 31.79 25.22 18.68 12.37 6.89 5.21 3.51 1.90 0.22 0.22<br />
Percent change 37.7% 25.1% 16.7% 10.6% 4.8% 0.0% -3.5% -6.7% -10.0% -13.3% -18.2% -26.7% -36.5% -46.1% -55.4% -64.6% -73.8% -82.6% -90.3% -92.7% -95.1% -97.3% -99.7% -99.7%<br />
Developed 1.17 1.17 1.17 1.17 1.17 1.17 1.17 1.17 1.17 1.17 1.17 1.17 1.17 1.17 1.17 1.17 1.17 1.17 1.17 1.17 1.17 1.17 1.17 1.17<br />
Percent change 0.0% 0.0% 0.0% 0.0% 0.0% 0.0% 0.0% 0.0% 0.0% 0.0% 0.0% 0.0% 0.0% 0.0% 0.0% 0.0% 0.0% 0.0% 0.0% 0.0% 0.0% 0.0% 0.0% 0.0%<br />
a Acreages in the table are for vegetation at and below 13 feet City Datum; for most upland vegetation types there is additional acreage above an elevation of 13 feet.<br />
b Percent change is relative to vegetation predicted to occur at -5 feet City Datum<br />
c All upland vegetation types were combined for the analysis of receding lake levels<br />
Values in bold indicate an increase in cover type<br />
Values in italic indicate a decrease in cover type<br />
Mean Annual Water Surface Elevation (City Datum)<br />
C-12
TABLE C-8: PREDICTED VEGETATION CHANGE AND PERCENT CHANGE RELATIVE TO WATER SURFACE ELEVATION -4 FEET CITY DATUM a<br />
Cover Type<br />
-10 -9 -8 -7 -6 -5 -4 -3 -2 -1 0 1 2 3 4 5 6 ft 7 ft 8 ft 9 ft 10 ft 11 ft 12 ft 13 ft<br />
Arroyo Willow Riparian Scrub 37.89 32.02 27.15 24.11 21.80 20.15 19.31 18.82 18.35 17.77 18.36 21.15 24.45 26.07 24.95 21.54 17.03 12.59 11.86 8.44 6.14 4.26 2.88 0.00<br />
Percent change b 96.3% 65.9% 40.6% 24.9% 12.9% 4.4% 0.0% -2.5% -5.0% -7.9% -4.9% 9.6% 26.7% 35.0% 29.3% 11.6% -11.8% -34.8% -38.6% -56.3% -68.2% -77.9% -85.1% -100.0%<br />
Bulrush Wetland 49.12 46.43 31.72 30.60 28.06 21.76 16.28 14.36 12.78 11.78 10.82 10.42 10.58 11.80 14.49 19.23 25.05 28.15 32.57 38.18 44.74 48.97 40.05 26.81<br />
Percent change 201.6% 185.1% 94.8% 87.9% 72.3% 33.7% 0.0% -11.8% -21.5% -27.6% -33.6% -36.0% -35.0% -27.5% -11.0% 18.1% 53.8% 72.9% 100.0% 134.5% 174.7% 200.7% 145.9% 64.6%<br />
Giant Vetch Wetland 0.38 0.33 0.27 0.20 0.17 0.17 0.17 0.17 0.17 0.16 0.20 0.29 0.38 0.43 0.42 0.35 0.25 0.17 0.17 0.16 0.13 0.08 0.05 0.03<br />
Percent change 123.0% 95.0% 56.9% 17.6% 3.2% 0.9% 0.0% -0.9% -1.8% -2.7% 16.0% 71.0% 126.7% 155.2% 149.1% 106.0% 46.4% -1.9% -1.9% -5.1% -24.7% -52.1% -69.2% -85.2%<br />
Knotweed Wetland 9.56 6.15 4.94 4.75 3.41 1.91 1.40 1.38 1.39 1.41 1.43 1.45 1.50 1.97 3.46 5.63 7.02 6.42 6.89 6.13 3.26 1.20 0.52 0.33<br />
Percent change 582.3% 339.0% 252.7% 238.9% 143.5% 36.7% 0.0% -1.8% -0.6% 0.6% 1.9% 3.6% 7.1% 40.6% 146.8% 301.6% 401.0% 358.3% 392.1% 337.6% 132.9% -14.3% -62.9% -76.1%<br />
Rush Meadow 0.49 0.40 0.32 0.24 0.18 0.16 0.15 0.15 0.15 0.16 0.18 0.27 0.38 0.48 0.53 0.50 0.40 0.29 0.31 0.26 0.14 0.13 0.07 0.02<br />
Percent change 220.9% 161.5% 109.7% 57.7% 16.3% 3.6% 0.0% 0.3% 0.6% 0.9% 18.6% 73.9% 149.8% 214.4% 241.7% 223.0% 159.7% 86.1% 103.0% 68.6% -7.7% -16.3% -57.0% -87.7%<br />
Cattail Wetland 0.01 0.01 0.00 0.00 0.00 0.00 0.00 0.00 0.00 0.00 0.00 0.01 0.01 0.01 0.01 0.01 0.01 0.00 0.00 0.00 0.00 0.00 0.00 0.00<br />
Percent change 236.8% 161.6% 78.4% 18.2% -2.4% -1.2% 0.0% 1.2% 2.4% 3.7% 23.7% 110.9% 258.7% 366.2% 362.5% 266.7% 149.1% 66.3% 66.3% 66.3% 66.3% 66.3% 33.0% -8.5%<br />
Sum Herbaceous Wetland 59.54 53.31 37.24 35.79 31.83 24.01 18.01 16.05 14.49 13.51 12.63 12.43 12.85 14.68 18.89 25.70 32.72 35.02 39.94 44.74 48.27 50.38 40.69 27.19<br />
Percent change 230.7% 196.0% 106.8% 98.8% 76.7% 33.3% 0.0% -10.9% -19.5% -25.0% -29.9% -31.0% -28.6% -18.5% 4.9% 42.7% 81.7% 94.5% 121.8% 148.4% 168.1% 179.8% 126.0% 51.0%<br />
Total Wetland (Willow and Herbaceous) 97.44 85.33 64.39 59.90 53.62 44.16 37.31 34.88 32.84 31.29 30.99 33.58 37.31 40.75 43.85 47.24 49.75 47.61 51.80 53.18 54.41 54.64 43.57 27.19<br />
Percent change 161.1% 128.7% 72.6% 60.5% 43.7% 18.3% 0.0% -6.5% -12.0% -16.2% -17.0% -10.0% 0.0% 9.2% 17.5% 26.6% 33.3% 27.6% 38.8% 42.5% 45.8% 46.5% 16.8% -27.1%<br />
Open Water 128.78 149.87 176.77 185.61 196.09 208.97 218.34 223.08 227.45 231.36 235.23 238.76 242.17 245.57 249.14 252.35 256.40 264.86 266.15 266.46 268.62 268.30 281.06 297.43<br />
Percent change -41.0% -31.4% -19.0% -15.0% -10.2% -4.3% 0.0% 2.2% 4.2% 6.0% 7.7% 9.4% 10.9% 12.5% 14.1% 15.6% 17.4% 21.3% 21.9% 22.0% 23.0% 22.9% 28.7% 36.2%<br />
Upland vegetation c 98.03 89.07 83.12 78.79 74.61 71.21 68.70 66.41 64.10 61.76 58.24 52.22 45.19 38.41 31.79 25.22 18.68 12.37 6.89 5.21 3.51 1.90 0.22 0.22<br />
Percent change 42.7% 29.6% 21.0% 14.7% 8.6% 3.7% 0.0% -3.3% -6.7% -10.1% -15.2% -24.0% -34.2% -44.1% -53.7% -63.3% -72.8% -82.0% -90.0% -92.4% -94.9% -97.2% -99.7% -99.7%<br />
Developed 1.17 1.17 1.17 1.17 1.17 1.17 1.17 1.17 1.17 1.17 1.17 1.17 1.17 1.17 1.17 1.17 1.17 1.17 1.17 1.17 1.17 1.17 1.17 1.17<br />
Percent change 0.0% 0.0% 0.0% 0.0% 0.0% 0.0% 0.0% 0.0% 0.0% 0.0% 0.0% 0.0% 0.0% 0.0% 0.0% 0.0% 0.0% 0.0% 0.0% 0.0% 0.0% 0.0% 0.0% 0.0%<br />
a Acreages in the table are for vegetation at and below 13 feet City Datum; for most upland vegetation types there is additional acreage above an elevation of 13 feet.<br />
b Percent change is relative to vegetation predicted to occur at -4 feet City Datum<br />
c<br />
All upland vegetation types were combined for the analysis of receding lake levels<br />
Values in bold indicate an increase in cover type<br />
Values in italic indicate a decrease in cover type<br />
Mean Annual Water Surface Elevation (City Datum)<br />
C-13
TABLE C-9: PREDICTED VEGETATION CHANGE AND PERCENT CHANGE RELATIVE TO WATER SURFACE ELEVATION -3 FEET CITY DATUM a<br />
Cover Type<br />
-10 -9 -8 -7 -6 -5 -4 -3 -2 -1 0 1 2 3 4 5 6 ft 7 ft 8 ft 9 ft 10 ft 11 ft 12 ft 13 ft<br />
Arroyo Willow Riparian Scrub 37.89 32.02 27.15 24.11 21.80 20.15 19.31 18.82 18.35 17.77 18.36 21.15 24.45 26.07 24.95 21.54 17.03 12.59 11.86 8.44 6.14 4.26 2.88 0.00<br />
Percent change b 101.3% 70.1% 44.2% 28.1% 15.8% 7.0% 2.6% 0.0% -2.5% -5.6% -2.5% 12.4% 29.9% 38.5% 32.6% 14.4% -9.5% -33.1% -37.0% -55.1% -67.4% -77.3% -84.7% -100.0%<br />
Bulrush Wetland 49.12 46.43 31.72 30.60 28.06 21.76 16.28 14.36 12.78 11.78 10.82 10.42 10.58 11.80 14.49 19.23 25.05 28.15 32.57 38.18 44.74 48.97 40.05 26.81<br />
Percent change 242.2% 223.4% 120.9% 113.2% 95.5% 51.6% 13.4% 0.0% -11.0% -17.9% -24.6% -27.4% -26.3% -17.8% 0.9% 33.9% 74.5% 96.1% 126.9% 166.0% 211.6% 241.1% 179.0% 86.8%<br />
Giant Vetch Wetland 0.38 0.33 0.27 0.20 0.17 0.17 0.17 0.17 0.17 0.16 0.20 0.29 0.38 0.43 0.42 0.35 0.25 0.17 0.17 0.16 0.13 0.08 0.05 0.03<br />
Percent change 125.0% 96.8% 58.3% 18.7% 4.1% 1.8% 0.9% 0.0% -0.9% -1.9% 17.1% 72.6% 128.7% 157.6% 151.4% 107.9% 47.7% -1.0% -1.0% -4.3% -24.0% -51.7% -68.9% -85.0%<br />
Knotweed Wetland 9.56 6.15 4.94 4.75 3.41 1.91 1.40 1.38 1.39 1.41 1.43 1.45 1.50 1.97 3.46 5.63 7.02 6.42 6.89 6.13 3.26 1.20 0.52 0.33<br />
Percent change 594.6% 346.9% 259.1% 245.0% 147.9% 39.1% 1.8% 0.0% 1.2% 2.5% 3.8% 5.4% 9.1% 43.2% 151.2% 308.9% 410.0% 366.6% 401.0% 345.5% 137.1% -12.8% -62.2% -75.7%<br />
Rush Meadow 0.49 0.40 0.32 0.24 0.18 0.16 0.15 0.15 0.15 0.16 0.18 0.27 0.38 0.48 0.53 0.50 0.40 0.29 0.31 0.26 0.14 0.13 0.07 0.02<br />
Percent change 219.9% 160.7% 109.0% 57.2% 16.0% 3.3% -0.3% 0.0% 0.3% 0.6% 18.2% 73.4% 149.0% 213.4% 240.6% 222.0% 158.9% 85.6% 102.4% 68.1% -8.0% -16.5% -57.1% -87.7%<br />
Cattail Wetland 0.01 0.01 0.00 0.00 0.00 0.00 0.00 0.00 0.00 0.00 0.00 0.01 0.01 0.01 0.01 0.01 0.01 0.00 0.00 0.00 0.00 0.00 0.00 0.00<br />
Percent change 232.8% 158.4% 76.3% 16.8% -3.6% -2.4% -1.2% 0.0% 1.2% 2.5% 22.2% 108.4% 254.4% 360.6% 356.9% 262.3% 146.1% 64.3% 64.3% 64.3% 64.3% 64.3% 31.4% -9.6%<br />
Sum Herbaceous Wetland 59.54 53.31 37.24 35.79 31.83 24.01 18.01 16.05 14.49 13.51 12.63 12.43 12.85 14.68 18.89 25.70 32.72 35.02 39.94 44.74 48.27 50.38 40.69 27.19<br />
Percent change 270.9% 232.1% 132.0% 123.0% 98.3% 49.6% 12.2% 0.0% -9.7% -15.8% -21.4% -22.6% -19.9% -8.5% 17.7% 60.1% 103.8% 118.2% 148.8% 178.7% 200.7% 213.8% 153.5% 69.4%<br />
Total Wetland (Willow and Herbaceous) 97.44 85.33 64.39 59.90 53.62 44.16 37.31 34.88 32.84 31.29 30.99 33.58 37.31 40.75 43.85 47.24 49.75 47.61 51.80 53.18 54.41 54.64 43.57 27.19<br />
Percent change 179.4% 144.7% 84.6% 71.7% 53.7% 26.6% 7.0% 0.0% -5.8% -10.3% -11.2% -3.7% 7.0% 16.8% 25.7% 35.4% 42.6% 36.5% 48.5% 52.5% 56.0% 56.7% 24.9% -22.0%<br />
Open Water 128.78 149.87 176.77 185.61 196.09 208.97 218.34 223.08 227.45 231.36 235.23 238.76 242.17 245.57 249.14 252.35 256.40 264.86 266.15 266.46 268.62 268.30 281.06 297.43<br />
Percent change -42.3% -32.8% -20.8% -16.8% -12.1% -6.3% -2.1% 0.0% 2.0% 3.7% 5.4% 7.0% 8.6% 10.1% 11.7% 13.1% 14.9% 18.7% 19.3% 19.4% 20.4% 20.3% 26.0% 33.3%<br />
Upland vegetation c 98.03 89.07 83.12 78.79 74.61 71.21 68.70 66.41 64.10 61.76 58.24 52.22 45.19 38.41 31.79 25.22 18.68 12.37 6.89 5.21 3.51 1.90 0.22 0.22<br />
Percent change 47.6% 34.1% 25.2% 18.6% 12.3% 7.2% 3.4% 0.0% -3.5% -7.0% -12.3% -21.4% -32.0% -42.2% -52.1% -62.0% -71.9% -81.4% -89.6% -92.2% -94.7% -97.1% -99.7% -99.7%<br />
Developed 1.17 1.17 1.17 1.17 1.17 1.17 1.17 1.17 1.17 1.17 1.17 1.17 1.17 1.17 1.17 1.17 1.17 1.17 1.17 1.17 1.17 1.17 1.17 1.17<br />
Percent change 0.0% 0.0% 0.0% 0.0% 0.0% 0.0% 0.0% 0.0% 0.0% 0.0% 0.0% 0.0% 0.0% 0.0% 0.0% 0.0% 0.0% 0.0% 0.0% 0.0% 0.0% 0.0% 0.0% 0.0%<br />
a Acreages in the table are for vegetation at and below 13 feet City Datum; for most upland vegetation types there is additional acreage above an elevation of 13 feet.<br />
b Percent change is relative to vegetation predicted to occur at -3 feet City Datum<br />
c All upland vegetation types were combined for the analysis of receding lake levels<br />
Values in bold indicate an increase in cover type<br />
Values in italic indicate a decrease in cover type<br />
Mean Annual Water Surface Elevation (City Datum)<br />
C-14
TABLE C-10: PREDICTED VEGETATION CHANGE AND PERCENT CHANGE RELATIVE TO WATER SURFACE ELEVATION -2 FEET CITY DATUM a<br />
Cover Type<br />
-10 -9 -8 -7 -6 -5 -4 -3 -2 -1 0 1 2 3 4 5 6 ft 7 ft 8 ft 9 ft 10 ft 11 ft 12 ft 13 ft<br />
Arroyo Willow Riparian Scrub 37.89 32.02 27.15 24.11 21.80 20.15 19.31 18.82 18.35 17.77 18.36 21.15 24.45 26.07 24.95 21.54 17.03 12.59 11.86 8.44 6.14 4.26 2.88 0.00<br />
Percent change b 106.6% 74.5% 48.0% 31.4% 18.8% 9.8% 5.2% 2.6% 0.0% -3.1% 0.1% 15.3% 33.3% 42.1% 36.0% 17.4% -7.2% -31.4% -35.4% -54.0% -66.5% -76.8% -84.3% -100.0%<br />
Bulrush Wetland 49.12 46.43 31.72 30.60 28.06 21.76 16.28 14.36 12.78 11.78 10.82 10.42 10.58 11.80 14.49 19.23 25.05 28.15 32.57 38.18 44.74 48.97 40.05 26.81<br />
Percent change 284.3% 263.3% 148.1% 139.5% 119.6% 70.3% 27.4% 12.3% 0.0% -7.8% -15.4% -18.5% -17.2% -7.7% 13.4% 50.4% 96.0% 120.2% 154.8% 198.8% 250.0% 283.1% 213.3% 109.8%<br />
Giant Vetch Wetland 0.38 0.33 0.27 0.20 0.17 0.17 0.17 0.17 0.17 0.16 0.20 0.29 0.38 0.43 0.42 0.35 0.25 0.17 0.17 0.16 0.13 0.08 0.05 0.03<br />
Percent change 127.1% 98.6% 59.8% 19.8% 5.1% 2.8% 1.9% 0.9% 0.0% -0.9% 18.2% 74.2% 130.9% 160.0% 153.8% 109.8% 49.1% -0.1% -0.1% -3.4% -23.3% -51.2% -68.6% -84.9%<br />
Knotweed Wetland 9.56 6.15 4.94 4.75 3.41 1.91 1.40 1.38 1.39 1.41 1.43 1.45 1.50 1.97 3.46 5.63 7.02 6.42 6.89 6.13 3.26 1.20 0.52 0.33<br />
Percent change 586.3% 341.6% 254.8% 240.9% 144.9% 37.5% 0.6% -1.2% 0.0% 1.2% 2.5% 4.2% 7.8% 41.5% 148.2% 304.0% 403.9% 361.0% 395.0% 340.2% 134.2% -13.8% -62.6% -76.0%<br />
Rush Meadow 0.49 0.40 0.32 0.24 0.18 0.16 0.15 0.15 0.15 0.16 0.18 0.27 0.38 0.48 0.53 0.50 0.40 0.29 0.31 0.26 0.14 0.13 0.07 0.02<br />
Percent change 219.0% 159.9% 108.4% 56.7% 15.6% 3.0% -0.6% -0.3% 0.0% 0.3% 17.8% 72.8% 148.3% 212.5% 239.6% 221.0% 158.1% 85.0% 101.7% 67.6% -8.2% -16.8% -57.2% -87.8%<br />
Cattail Wetland 0.01 0.01 0.00 0.00 0.00 0.00 0.00 0.00 0.00 0.00 0.00 0.01 0.01 0.01 0.01 0.01 0.01 0.00 0.00 0.00 0.00 0.00 0.00 0.00<br />
Percent change 228.8% 155.3% 74.2% 15.4% -4.8% -3.6% -2.4% -1.2% 0.0% 1.2% 20.7% 105.9% 250.2% 355.1% 351.5% 258.0% 143.2% 62.3% 62.3% 62.3% 62.3% 62.3% 29.9% -10.7%<br />
Sum Herbaceous Wetland 59.54 53.31 37.24 35.79 31.83 24.01 18.01 16.05 14.49 13.51 12.63 12.43 12.85 14.68 18.89 25.70 32.72 35.02 39.94 44.74 48.27 50.38 40.69 27.19<br />
Percent change 310.8% 267.8% 157.0% 146.9% 119.6% 65.6% 24.2% 10.8% 0.0% -6.8% -12.9% -14.3% -11.3% 1.3% 30.3% 77.3% 125.7% 141.6% 175.6% 208.7% 233.0% 247.6% 180.7% 87.6%<br />
Total Wetland (Willow and Herbaceous) 97.44 85.33 64.39 59.90 53.62 44.16 37.31 34.88 32.84 31.29 30.99 33.58 37.31 40.75 43.85 47.24 49.75 47.61 51.80 53.18 54.41 54.64 43.57 27.19<br />
Percent change 196.7% 159.8% 96.1% 82.4% 63.3% 34.5% 13.6% 6.2% 0.0% -4.7% -5.6% 2.3% 13.6% 24.1% 33.5% 43.8% 51.5% 45.0% 57.7% 61.9% 65.7% 66.4% 32.7% -17.2%<br />
Open Water 128.78 149.87 176.77 185.61 196.09 208.97 218.34 223.08 227.45 231.36 235.23 238.76 242.17 245.57 249.14 252.35 256.40 264.86 266.15 266.46 268.62 268.30 281.06 297.43<br />
Percent change -43.4% -34.1% -22.3% -18.4% -13.8% -8.1% -4.0% -1.9% 0.0% 1.7% 3.4% 5.0% 6.5% 8.0% 9.5% 10.9% 12.7% 16.4% 17.0% 17.1% 18.1% 18.0% 23.6% 30.8%<br />
Upland vegetation c 98.03 89.07 83.12 78.79 74.61 71.21 68.70 66.41 64.10 61.76 58.24 52.22 45.19 38.41 31.79 25.22 18.68 12.37 6.89 5.21 3.51 1.90 0.22 0.22<br />
Percent change 52.9% 39.0% 29.7% 22.9% 16.4% 11.1% 7.2% 3.6% 0.0% -3.6% -9.1% -18.5% -29.5% -40.1% -50.4% -60.7% -70.9% -80.7% -89.3% -91.9% -94.5% -97.0% -99.7% -99.7%<br />
Developed 1.17 1.17 1.17 1.17 1.17 1.17 1.17 1.17 1.17 1.17 1.17 1.17 1.17 1.17 1.17 1.17 1.17 1.17 1.17 1.17 1.17 1.17 1.17 1.17<br />
Percent change 0.0% 0.0% 0.0% 0.0% 0.0% 0.0% 0.0% 0.0% 0.0% 0.0% 0.0% 0.0% 0.0% 0.0% 0.0% 0.0% 0.0% 0.0% 0.0% 0.0% 0.0% 0.0% 0.0% 0.0%<br />
a Acreages in the table are for vegetation at and below 13 feet City Datum; for most upland vegetation types there is additional acreage above an elevation of 13 feet.<br />
b Percent change is relative to vegetation predicted to occur at -2 feet City Datum<br />
c All upland vegetation types were combined for the analysis of receding lake levels<br />
Values in bold indicate an increase in cover type<br />
Values in italic indicate a decrease in cover type<br />
Mean Annual Water Surface Elevation (City Datum)<br />
C-15
TABLE C-11: PREDICTED VEGETATION CHANGE AND PERCENT CHANGE RELATIVE TO WATER SURFACE ELEVATION -1 FOOT CITY DATUM a<br />
Cover Type<br />
Mean Annual Water Surface Elevation (City Datum)<br />
-10 -9 -8 -7 -6 -5 -4 -3 -2 -1 0 1 2 3 4 5 6 ft 7 ft 8 ft 9 ft 10 ft 11 ft 12 ft 13 ft<br />
Arroyo Willow Riparian Scrub 37.89 32.02 27.15 24.11 21.80 20.15 19.31 18.82 18.35 17.77 18.36 21.15 24.45 26.07 24.95 21.54 17.03 12.59 11.86 8.44 6.14 4.26 2.88 0.00<br />
Percent change b 113.2% 80.2% 52.8% 35.6% 22.6% 13.4% 8.6% 5.9% 3.2% 0.0% 3.3% 19.0% 37.6% 46.7% 40.4% 21.2% -4.2% -29.2% -33.3% -52.5% -65.5% -76.0% -83.8% -100.0%<br />
Bulrush Wetland 49.12 46.43 31.72 30.60 28.06 21.76 16.28 14.36 12.78 11.78 10.82 10.42 10.58 11.80 14.49 19.23 25.05 28.15 32.57 38.18 44.74 48.97 40.05 26.81<br />
Percent change 316.8% 294.0% 169.1% 159.7% 138.1% 84.7% 38.2% 21.8% 8.5% 0.0% -8.2% -11.6% -10.2% 0.1% 23.0% 63.2% 112.5% 138.9% 176.3% 224.0% 279.6% 315.5% 239.8% 127.5%<br />
Giant Vetch Wetland 0.38 0.33 0.27 0.20 0.17 0.17 0.17 0.17 0.17 0.16 0.20 0.29 0.38 0.43 0.42 0.35 0.25 0.17 0.17 0.16 0.13 0.08 0.05 0.03<br />
Percent change 129.3% 100.5% 61.3% 21.0% 6.1% 3.7% 2.8% 1.9% 0.9% 0.0% 19.3% 75.8% 133.1% 162.4% 156.2% 111.8% 50.5% 0.9% 0.9% -2.5% -22.6% -50.7% -68.3% -84.8%<br />
Knotweed Wetland 9.56 6.15 4.94 4.75 3.41 1.91 1.40 1.38 1.39 1.41 1.43 1.45 1.50 1.97 3.46 5.63 7.02 6.42 6.89 6.13 3.26 1.20 0.52 0.33<br />
Percent change 578.0% 336.2% 250.5% 236.7% 141.9% 35.8% -0.6% -2.4% -1.2% 0.0% 1.3% 2.9% 6.5% 39.8% 145.2% 299.1% 397.8% 355.4% 389.0% 334.9% 131.4% -14.9% -63.1% -76.3%<br />
Rush Meadow 0.49 0.40 0.32 0.24 0.18 0.16 0.15 0.15 0.15 0.16 0.18 0.27 0.38 0.48 0.53 0.50 0.40 0.29 0.31 0.26 0.14 0.13 0.07 0.02<br />
Percent change 218.0% 159.1% 107.8% 56.2% 15.3% 2.7% -0.9% -0.6% -0.3% 0.0% 17.5% 72.3% 147.5% 211.5% 238.5% 220.0% 157.3% 84.4% 101.1% 67.0% -8.5% -17.0% -57.4% -87.8%<br />
Cattail Wetland 0.01 0.01 0.00 0.00 0.00 0.00 0.00 0.00 0.00 0.00 0.00 0.01 0.01 0.01 0.01 0.01 0.01 0.00 0.00 0.00 0.00 0.00 0.00 0.00<br />
Percent change 224.8% 152.2% 72.1% 14.0% -5.9% -4.7% -3.6% -2.4% -1.2% 0.0% 19.2% 103.4% 245.9% 349.6% 346.0% 253.6% 140.2% 60.4% 60.4% 60.4% 60.4% 60.4% 28.3% -11.8%<br />
Sum Herbaceous Wetland 59.54 53.31 37.24 35.79 31.83 24.01 18.01 16.05 14.49 13.51 12.63 12.43 12.85 14.68 18.89 25.70 32.72 35.02 39.94 44.74 48.27 50.38 40.69 27.19<br />
Percent change 340.6% 294.5% 175.6% 164.9% 135.5% 77.7% 33.3% 18.8% 7.3% 0.0% -6.6% -8.0% -4.9% 8.7% 39.8% 90.2% 142.1% 159.2% 195.6% 231.1% 257.2% 272.8% 201.1% 101.2%<br />
Total Wetland (Willow and Herbaceous) 97.44 85.33 64.39 59.90 53.62 44.16 37.31 34.88 32.84 31.29 30.99 33.58 37.31 40.75 43.85 47.24 49.75 47.61 51.80 53.18 54.41 54.64 43.57 27.19<br />
Percent change 211.4% 172.7% 105.8% 91.5% 71.4% 41.1% 19.3% 11.5% 5.0% 0.0% -1.0% 7.3% 19.2% 30.3% 40.1% 51.0% 59.0% 52.2% 65.6% 70.0% 73.9% 74.7% 39.3% -13.1%<br />
Open Water 128.78 149.87 176.77 185.61 196.09 208.97 218.34 223.08 227.45 231.36 235.23 238.76 242.17 245.57 249.14 252.35 256.40 264.86 266.15 266.46 268.62 268.30 281.06 297.43<br />
Percent change -44.3% -35.2% -23.6% -19.8% -15.2% -9.7% -5.6% -3.6% -1.7% 0.0% 1.7% 3.2% 4.7% 6.1% 7.7% 9.1% 10.8% 14.5% 15.0% 15.2% 16.1% 16.0% 21.5% 28.6%<br />
Upland vegetation c 98.03 89.07 83.12 78.79 74.61 71.21 68.70 66.41 64.10 61.76 58.24 52.22 45.19 38.41 31.79 25.22 18.68 12.37 6.89 5.21 3.51 1.90 0.22 0.22<br />
Percent change 58.7% 44.2% 34.6% 27.6% 20.8% 15.3% 11.2% 7.5% 3.8% 0.0% -5.7% -15.4% -26.8% -37.8% -48.5% -59.2% -69.8% -80.0% -88.8% -91.6% -94.3% -96.9% -99.6% -99.6%<br />
Developed 1.17 1.17 1.17 1.17 1.17 1.17 1.17 1.17 1.17 1.17 1.17 1.17 1.17 1.17 1.17 1.17 1.17 1.17 1.17 1.17 1.17 1.17 1.17 1.17<br />
Percent change 0.0% 0.0% 0.0% 0.0% 0.0% 0.0% 0.0% 0.0% 0.0% 0.0% 0.0% 0.0% 0.0% 0.0% 0.0% 0.0% 0.0% 0.0% 0.0% 0.0% 0.0% 0.0% 0.0% 0.0%<br />
a Acreages in the table are for vegetation at and below 13 feet City Datum; for most upland vegetation types there is additional acreage above an elevation of 13 feet.<br />
b Percent change is relative to vegetation predicted to occur at -1 feet City Datum<br />
c All upland vegetation types were combined for the analysis of receding lake levels<br />
Values in bold indicate an increase in cover type<br />
Values in italic indicate a decrease in cover type<br />
C-16
TABLE C-12: PREDICTED VEGETATION CHANGE AND PERCENT CHANGE RELATIVE TO WATER SURFACE ELEVATION 0 FEET CITY DATUM a<br />
Cover Type<br />
Mean Annual Water Surface Elevation (City Datum)<br />
-10 -9 -8 -7 -6 -5 -4 -3 -2 -1 0 1 2 3 4 5 6 ft 7 ft 8 ft 9 ft 10 ft 11 ft 12 ft 13 ft<br />
Arroyo Willow Riparian Scrub 37.89 32.02 27.15 24.11 21.80 20.15 19.31 18.82 18.35 17.77 18.36 21.15 24.45 26.07 24.95 21.54 17.03 12.59 11.86 8.44 6.14 4.26 2.88 0.00<br />
Percent change b 106.4% 74.4% 47.8% 31.3% 18.7% 9.7% 5.1% 2.5% -0.1% -3.2% 0.0% 15.2% 33.2% 42.0% 35.9% 17.3% -7.3% -31.4% -35.4% -54.0% -66.6% -76.8% -84.3% -100.0%<br />
Bulrush Wetland 49.12 46.43 31.72 30.60 28.06 21.76 16.28 14.36 12.78 11.78 10.82 10.42 10.58 11.80 14.49 19.23 25.05 28.15 32.57 38.18 44.74 48.97 40.05 26.81<br />
Percent change 354.0% 329.1% 193.1% 182.9% 159.4% 101.2% 50.5% 32.7% 18.1% 8.9% 0.0% -3.7% -2.2% 9.1% 33.9% 77.7% 131.5% 160.2% 201.0% 252.9% 313.5% 352.6% 270.2% 147.8%<br />
Giant Vetch Wetland 0.38 0.33 0.27 0.20 0.17 0.17 0.17 0.17 0.17 0.16 0.20 0.29 0.38 0.43 0.42 0.35 0.25 0.17 0.17 0.16 0.13 0.08 0.05 0.03<br />
Percent change 92.2% 68.1% 35.2% 1.4% -11.0% -13.0% -13.8% -14.6% -15.4% -16.2% 0.0% 47.4% 95.4% 120.0% 114.8% 77.6% 26.2% -15.4% -15.4% -18.2% -35.1% -58.7% -73.4% -87.2%<br />
Knotweed Wetland 9.56 6.15 4.94 4.75 3.41 1.91 1.40 1.38 1.39 1.41 1.43 1.45 1.50 1.97 3.46 5.63 7.02 6.42 6.89 6.13 3.26 1.20 0.52 0.33<br />
Percent change 569.4% 330.7% 246.1% 232.5% 138.9% 34.1% -1.9% -3.6% -2.5% -1.3% 0.0% 1.6% 5.1% 38.0% 142.1% 294.1% 391.6% 349.7% 382.9% 329.4% 128.5% -15.9% -63.6% -76.6%<br />
Rush Meadow 0.49 0.40 0.32 0.24 0.18 0.16 0.15 0.15 0.15 0.16 0.18 0.27 0.38 0.48 0.53 0.50 0.40 0.29 0.31 0.26 0.14 0.13 0.07 0.02<br />
Percent change 170.7% 120.6% 76.9% 33.0% -1.9% -12.6% -15.7% -15.4% -15.1% -14.9% 0.0% 46.7% 110.7% 165.2% 188.2% 172.4% 119.1% 57.0% 71.2% 42.2% -22.1% -29.4% -63.7% -89.6%<br />
Cattail Wetland 0.01 0.01 0.00 0.00 0.00 0.00 0.00 0.00 0.00 0.00 0.00 0.01 0.01 0.01 0.01 0.01 0.01 0.00 0.00 0.00 0.00 0.00 0.00 0.00<br />
Percent change 172.4% 111.5% 44.3% -4.4% -21.1% -20.1% -19.1% -18.1% -17.2% -16.1% 0.0% 70.6% 190.1% 277.0% 274.0% 196.6% 101.5% 34.5% 34.5% 34.5% 34.5% 34.5% 7.6% -26.0%<br />
Sum Herbaceous Wetland 59.54 53.31 37.24 35.79 31.83 24.01 18.01 16.05 14.49 13.51 12.63 12.43 12.85 14.68 18.89 25.70 32.72 35.02 39.94 44.74 48.27 50.38 40.69 27.19<br />
Percent change 371.6% 322.2% 195.0% 183.5% 152.1% 90.2% 42.6% 27.2% 14.8% 7.0% 0.0% -1.6% 1.8% 16.3% 49.6% 103.6% 159.1% 177.4% 216.4% 254.4% 282.3% 299.1% 222.3% 115.4%<br />
Total Wetland (Willow and Herbaceous) 97.44 85.33 64.39 59.90 53.62 44.16 37.31 34.88 32.84 31.29 30.99 33.58 37.31 40.75 43.85 47.24 49.75 47.61 51.80 53.18 54.41 54.64 43.57 27.19<br />
Percent change 214.4% 175.4% 107.8% 93.3% 73.0% 42.5% 20.4% 12.6% 6.0% 1.0% 0.0% 8.4% 20.4% 31.5% 41.5% 52.4% 60.5% 53.7% 67.1% 71.6% 75.6% 76.3% 40.6% -12.3%<br />
Open Water 128.78 149.87 176.77 185.61 196.09 208.97 218.34 223.08 227.45 231.36 235.23 238.76 242.17 245.57 249.14 252.35 256.40 264.86 266.15 266.46 268.62 268.30 281.06 297.43<br />
Percent change -45.3% -36.3% -24.9% -21.1% -16.6% -11.2% -7.2% -5.2% -3.3% -1.6% 0.0% 1.5% 3.0% 4.4% 5.9% 7.3% 9.0% 12.6% 13.1% 13.3% 14.2% 14.1% 19.5% 26.4%<br />
Upland vegetation c 98.03 89.07 83.12 78.79 74.61 71.21 68.70 66.41 64.10 61.76 58.24 52.22 45.19 38.41 31.79 25.22 18.68 12.37 6.89 5.21 3.51 1.90 0.22 0.22<br />
Percent change 68.3% 52.9% 42.7% 35.3% 28.1% 22.3% 18.0% 14.0% 10.1% 6.1% 0.0% -10.3% -22.4% -34.0% -45.4% -56.7% -67.9% -78.8% -88.2% -91.1% -94.0% -96.7% -99.6% -99.6%<br />
Developed 1.17 1.17 1.17 1.17 1.17 1.17 1.17 1.17 1.17 1.17 1.17 1.17 1.17 1.17 1.17 1.17 1.17 1.17 1.17 1.17 1.17 1.17 1.17 1.17<br />
Percent change 0.0% 0.0% 0.0% 0.0% 0.0% 0.0% 0.0% 0.0% 0.0% 0.0% 0.0% 0.0% 0.0% 0.0% 0.0% 0.0% 0.0% 0.0% 0.0% 0.0% 0.0% 0.0% 0.0% 0.0%<br />
a Acreages in the table are for vegetation at and below 13 feet City Datum; for most upland vegetation types there is additional acreage above an elevation of 13 feet.<br />
b<br />
Percent change is relative to vegetation predicted to occur at 0 feet City Datum<br />
c All upland vegetation types were combined for the analysis of receding lake levels<br />
Values in bold indicate an increase in cover type<br />
Values in italic indicate a decrease in cover type<br />
C-17
TABLE C-13: PREDICTED VEGETATION CHANGE AND PERCENT CHANGE RELATIVE TO WATER SURFACE ELEVATION 1 FOOT CITY DATUM a<br />
Cover Type<br />
Mean Annual Water Surface Elevation (City Datum)<br />
-10 -9 -8 -7 -6 -5 -4 -3 -2 -1 0 1 2 3 4 5 6 ft 7 ft 8 ft 9 ft 10 ft 11 ft 12 ft 13 ft<br />
Arroyo Willow Riparian Scrub 37.89 32.02 27.15 24.11 21.80 20.15 19.31 18.82 18.35 17.77 18.36 21.15 24.45 26.07 24.95 21.54 17.03 12.59 11.86 8.44 6.14 4.26 2.88 0.00<br />
Percent change b 79.1% 51.4% 28.3% 14.0% 3.0% -4.7% -8.7% -11.0% -13.3% -16.0% -13.2% 0.0% 15.6% 23.2% 18.0% 1.8% -19.5% -40.5% -43.9% -60.1% -71.0% -79.8% -86.4% -100.0%<br />
Bulrush Wetland 49.12 46.43 31.72 30.60 28.06 21.76 16.28 14.36 12.78 11.78 10.82 10.42 10.58 11.80 14.49 19.23 25.05 28.15 32.57 38.18 44.74 48.97 40.05 26.81<br />
Percent change 371.4% 345.6% 204.4% 193.7% 169.3% 108.9% 56.3% 37.8% 22.7% 13.1% 3.8% 0.0% 1.6% 13.2% 39.0% 84.5% 140.4% 170.1% 212.5% 266.5% 329.3% 369.9% 284.3% 157.3%<br />
Giant Vetch Wetland 0.38 0.33 0.27 0.20 0.17 0.17 0.17 0.17 0.17 0.16 0.20 0.29 0.38 0.43 0.42 0.35 0.25 0.17 0.17 0.16 0.13 0.08 0.05 0.03<br />
Percent change 30.4% 14.0% -8.3% -31.2% -39.7% -41.0% -41.5% -42.1% -42.6% -43.1% -32.2% 0.0% 32.5% 49.2% 45.7% 20.4% -14.4% -42.6% -42.6% -44.5% -56.0% -72.0% -82.0% -91.3%<br />
Knotweed Wetland 9.56 6.15 4.94 4.75 3.41 1.91 1.40 1.38 1.39 1.41 1.43 1.45 1.50 1.97 3.46 5.63 7.02 6.42 6.89 6.13 3.26 1.20 0.52 0.33<br />
Percent change 558.8% 323.9% 240.6% 227.2% 135.1% 32.0% -3.4% -5.2% -4.0% -2.8% -1.6% 0.0% 3.5% 35.8% 138.3% 287.8% 383.7% 342.5% 375.2% 322.6% 124.8% -17.3% -64.1% -76.9%<br />
Rush Meadow 0.49 0.40 0.32 0.24 0.18 0.16 0.15 0.15 0.15 0.16 0.18 0.27 0.38 0.48 0.53 0.50 0.40 0.29 0.31 0.26 0.14 0.13 0.07 0.02<br />
Percent change 84.5% 50.4% 20.6% -9.3% -33.1% -40.4% -42.5% -42.3% -42.1% -42.0% -31.8% 0.0% 43.7% 80.8% 96.5% 85.7% 49.3% 7.0% 16.7% -3.1% -46.9% -51.8% -75.3% -92.9%<br />
Cattail Wetland 0.01 0.01 0.00 0.00 0.00 0.00 0.00 0.00 0.00 0.00 0.00 0.01 0.01 0.01 0.01 0.01 0.01 0.00 0.00 0.00 0.00 0.00 0.00 0.00<br />
Percent change 59.7% 24.0% -15.4% -43.9% -53.7% -53.2% -52.6% -52.0% -51.4% -50.8% -41.4% 0.0% 70.1% 121.0% 119.3% 73.9% 18.1% -21.2% -21.2% -21.2% -21.2% -21.2% -36.9% -56.6%<br />
Sum Herbaceous Wetland 59.54 53.31 37.24 35.79 31.83 24.01 18.01 16.05 14.49 13.51 12.63 12.43 12.85 14.68 18.89 25.70 32.72 35.02 39.94 44.74 48.27 50.38 40.69 27.19<br />
Percent change 379.1% 329.0% 199.7% 188.0% 156.1% 93.2% 44.9% 29.2% 16.6% 8.7% 1.6% 0.0% 3.4% 18.2% 52.0% 106.8% 163.3% 181.8% 221.4% 260.0% 288.4% 305.4% 227.4% 118.8%<br />
Total Wetland (Willow and Herbaceous) 97.44 85.33 64.39 59.90 53.62 44.16 37.31 34.88 32.84 31.29 30.99 33.58 37.31 40.75 43.85 47.24 49.75 47.61 51.80 53.18 54.41 54.64 43.57 27.19<br />
Percent change 190.2% 154.1% 91.8% 78.4% 59.7% 31.5% 11.1% 3.9% -2.2% -6.8% -7.7% 0.0% 11.1% 21.4% 30.6% 40.7% 48.1% 41.8% 54.2% 58.4% 62.0% 62.7% 29.7% -19.0%<br />
Open Water 128.78 149.87 176.77 185.61 196.09 208.97 218.34 223.08 227.45 231.36 235.23 238.76 242.17 245.57 249.14 252.35 256.40 264.86 266.15 266.46 268.62 268.30 281.06 297.43<br />
Percent change -46.1% -37.2% -26.0% -22.3% -17.9% -12.5% -8.6% -6.6% -4.7% -3.1% -1.5% 0.0% 1.4% 2.9% 4.3% 5.7% 7.4% 10.9% 11.5% 11.6% 12.5% 12.4% 17.7% 24.6%<br />
Upland vegetation c 98.03 89.07 83.12 78.79 74.61 71.21 68.70 66.41 64.10 61.76 58.24 52.22 45.19 38.41 31.79 25.22 18.68 12.37 6.89 5.21 3.51 1.90 0.22 0.22<br />
Percent change 87.7% 70.6% 59.2% 50.9% 42.9% 36.4% 31.6% 27.2% 22.7% 18.3% 11.5% 0.0% -13.5% -26.4% -39.1% -51.7% -64.2% -76.3% -86.8% -90.0% -93.3% -96.4% -99.6% -99.6%<br />
Developed 1.17 1.17 1.17 1.17 1.17 1.17 1.17 1.17 1.17 1.17 1.17 1.17 1.17 1.17 1.17 1.17 1.17 1.17 1.17 1.17 1.17 1.17 1.17 1.17<br />
Percent change 0.0% 0.0% 0.0% 0.0% 0.0% 0.0% 0.0% 0.0% 0.0% 0.0% 0.0% 0.0% 0.0% 0.0% 0.0% 0.0% 0.0% 0.0% 0.0% 0.0% 0.0% 0.0% 0.0% 0.0%<br />
a Acreages in the table are for vegetation at and below 13 feet City Datum; for most upland vegetation types there is additional acreage above an elevation of 13 feet.<br />
b Percent change is relative to vegetation predicted to occur at 1 feet City Datum<br />
c All upland vegetation types were combined for the analysis of receding lake levels<br />
Values in bold indicate an increase in cover type<br />
Values in italic indicate a decrease in cover type<br />
C-18
TABLE C-14: PREDICTED VEGETATION CHANGE AND PERCENT CHANGE RELATIVE TO WATER SURFACE ELEVATION 2 FEET CITY DATUM a<br />
Cover Type<br />
Mean Annual Water Surface Elevation (City Datum)<br />
-10 -9 -8 -7 -6 -5 -4 -3 -2 -1 0 1 2 3 4 5 6 ft 7 ft 8 ft 9 ft 10 ft 11 ft 12 ft 13 ft<br />
Arroyo Willow Riparian Scrub 37.89 32.02 27.15 24.11 21.80 20.15 19.31 18.82 18.35 17.77 18.36 21.15 24.45 26.07 24.95 21.54 17.03 12.59 11.86 8.44 6.14 4.26 2.88 0.00<br />
Percent change b 55.0% 30.9% 11.0% -1.4% -10.9% -17.6% -21.1% -23.0% -25.0% -27.3% -24.9% -13.5% 0.0% 6.6% 2.0% -11.9% -30.4% -48.5% -51.5% -65.5% -74.9% -82.6% -88.2% -100.0%<br />
Bulrush Wetland 49.12 46.43 31.72 30.60 28.06 21.76 16.28 14.36 12.78 11.78 10.82 10.42 10.58 11.80 14.49 19.23 25.05 28.15 32.57 38.18 44.74 48.97 40.05 26.81<br />
Percent change 364.1% 338.7% 199.7% 189.2% 165.2% 105.7% 53.9% 35.6% 20.8% 11.3% 2.2% -1.5% 0.0% 11.5% 36.9% 81.7% 136.7% 166.0% 207.7% 260.8% 322.7% 362.7% 278.4% 153.3%<br />
Giant Vetch Wetland 0.38 0.33 0.27 0.20 0.17 0.17 0.17 0.17 0.17 0.16 0.20 0.29 0.38 0.43 0.42 0.35 0.25 0.17 0.17 0.16 0.13 0.08 0.05 0.03<br />
Percent change -1.6% -14.0% -30.8% -48.1% -54.5% -55.5% -55.9% -56.3% -56.7% -57.1% -48.8% -24.6% 0.0% 12.6% 9.9% -9.1% -35.4% -56.7% -56.7% -58.1% -66.8% -78.9% -86.4% -93.5%<br />
Knotweed Wetland 9.56 6.15 4.94 4.75 3.41 1.91 1.40 1.38 1.39 1.41 1.43 1.45 1.50 1.97 3.46 5.63 7.02 6.42 6.89 6.13 3.26 1.20 0.52 0.33<br />
Percent change 536.8% 309.7% 229.2% 216.3% 127.2% 27.6% -6.7% -8.3% -7.2% -6.1% -4.9% -3.3% 0.0% 31.3% 130.3% 274.9% 367.6% 327.7% 359.3% 308.5% 117.3% -20.0% -65.3% -77.7%<br />
Rush Meadow 0.49 0.40 0.32 0.24 0.18 0.16 0.15 0.15 0.15 0.16 0.18 0.27 0.38 0.48 0.53 0.50 0.40 0.29 0.31 0.26 0.14 0.13 0.07 0.02<br />
Percent change 28.5% 4.7% -16.1% -36.9% -53.4% -58.5% -60.0% -59.8% -59.7% -59.6% -52.5% -30.4% 0.0% 25.9% 36.8% 29.3% 4.0% -25.5% -18.7% -32.5% -63.0% -66.5% -82.8% -95.1%<br />
Cattail Wetland 0.01 0.01 0.00 0.00 0.00 0.00 0.00 0.00 0.00 0.00 0.00 0.01 0.01 0.01 0.01 0.01 0.01 0.00 0.00 0.00 0.00 0.00 0.00 0.00<br />
Percent change -6.1% -27.1% -50.3% -67.0% -72.8% -72.5% -72.1% -71.8% -71.4% -71.1% -65.5% -41.2% 0.0% 30.0% 28.9% 2.2% -30.5% -53.6% -53.6% -53.6% -53.6% -53.6% -62.9% -74.5%<br />
Sum Herbaceous Wetland 59.54 53.31 37.24 35.79 31.83 24.01 18.01 16.05 14.49 13.51 12.63 12.43 12.85 14.68 18.89 25.70 32.72 35.02 39.94 44.74 48.27 50.38 40.69 27.19<br />
Percent change 363.3% 314.8% 189.8% 178.5% 147.6% 86.8% 40.1% 24.9% 12.8% 5.2% -1.8% -3.3% 0.0% 14.3% 47.0% 100.0% 154.6% 172.5% 210.8% 248.1% 275.6% 292.0% 216.6% 111.6%<br />
Total Wetland (Willow and Herbaceous) 97.44 85.33 64.39 59.90 53.62 44.16 37.31 34.88 32.84 31.29 30.99 33.58 37.31 40.75 43.85 47.24 49.75 47.61 51.80 53.18 54.41 54.64 43.57 27.19<br />
Percent change 161.2% 128.7% 72.6% 60.6% 43.7% 18.4% 0.0% -6.5% -12.0% -16.1% -16.9% -10.0% 0.0% 9.2% 17.5% 26.6% 33.4% 27.6% 38.8% 42.6% 45.8% 46.5% 16.8% -27.1%<br />
Open Water 128.78 149.87 176.77 185.61 196.09 208.97 218.34 223.08 227.45 231.36 235.23 238.76 242.17 245.57 249.14 252.35 256.40 264.86 266.15 266.46 268.62 268.30 281.06 297.43<br />
Percent change -46.8% -38.1% -27.0% -23.4% -19.0% -13.7% -9.8% -7.9% -6.1% -4.5% -2.9% -1.4% 0.0% 1.4% 2.9% 4.2% 5.9% 9.4% 9.9% 10.0% 10.9% 10.8% 16.1% 22.8%<br />
Upland vegetation c 98.03 89.07 83.12 78.79 74.61 71.21 68.70 66.41 64.10 61.76 58.24 52.22 45.19 38.41 31.79 25.22 18.68 12.37 6.89 5.21 3.51 1.90 0.22 0.22<br />
Percent change 116.9% 97.1% 84.0% 74.4% 65.1% 57.6% 52.0% 47.0% 41.9% 36.7% 28.9% 15.6% 0.0% -15.0% -29.6% -44.2% -58.7% -72.6% -84.8% -88.5% -92.2% -95.8% -99.5% -99.5%<br />
Developed 1.17 1.17 1.17 1.17 1.17 1.17 1.17 1.17 1.17 1.17 1.17 1.17 1.17 1.17 1.17 1.17 1.17 1.17 1.17 1.17 1.17 1.17 1.17 1.17<br />
Percent change 0.0% 0.0% 0.0% 0.0% 0.0% 0.0% 0.0% 0.0% 0.0% 0.0% 0.0% 0.0% 0.0% 0.0% 0.0% 0.0% 0.0% 0.0% 0.0% 0.0% 0.0% 0.0% 0.0% 0.0%<br />
a Acreages in the table are for vegetation at and below 13 feet City Datum; for most upland vegetation types there is additional acreage above an elevation of 13 feet.<br />
b Percent change is relative to vegetation predicted to occur at 2 feet City Datum<br />
c All upland vegetation types were combined for the analysis of receding lake levels<br />
Values in bold indicate an increase in cover type<br />
Values in italic indicate a decrease in cover type<br />
C-19
TABLE C-15: PREDICTED VEGETATION CHANGE AND PERCENT CHANGE RELATIVE TO WATER SURFACE ELEVATION 3 FEET CITY DATUM a<br />
Cover Type<br />
Mean Annual Water Surface Elevation (City Datum)<br />
-10 -9 -8 -7 -6 -5 -4 -3 -2 -1 0 1 2 3 4 5 6 ft 7 ft 8 ft 9 ft 10 ft 11 ft 12 ft 13 ft<br />
Arroyo Willow Riparian Scrub 37.89 32.02 27.15 24.11 21.80 20.15 19.31 18.82 18.35 17.77 18.36 21.15 24.45 26.07 24.95 21.54 17.03 12.59 11.86 8.44 6.14 4.26 2.88 0.00<br />
Percent change b 45.4% 22.8% 4.1% -7.5% -16.4% -22.7% -25.9% -27.8% -29.6% -31.8% -29.6% -18.9% -6.2% 0.0% -4.3% -17.4% -34.7% -51.7% -54.5% -67.6% -76.4% -83.6% -89.0% -100.0%<br />
Bulrush Wetland 49.12 46.43 31.72 30.60 28.06 21.76 16.28 14.36 12.78 11.78 10.82 10.42 10.58 11.80 14.49 19.23 25.05 28.15 32.57 38.18 44.74 48.97 40.05 26.81<br />
Percent change 316.3% 293.5% 168.8% 159.4% 137.8% 84.5% 38.0% 21.7% 8.3% -0.1% -8.3% -11.7% -10.3% 0.0% 22.8% 63.0% 112.3% 138.6% 176.0% 223.6% 279.1% 315.0% 239.4% 127.2%<br />
Giant Vetch Wetland 0.38 0.33 0.27 0.20 0.17 0.17 0.17 0.17 0.17 0.16 0.20 0.29 0.38 0.43 0.42 0.35 0.25 0.17 0.17 0.16 0.13 0.08 0.05 0.03<br />
Percent change -12.6% -23.6% -38.5% -53.9% -59.6% -60.5% -60.8% -61.2% -61.5% -61.9% -54.5% -33.0% -11.2% 0.0% -2.4% -19.3% -42.6% -61.6% -61.6% -62.8% -70.5% -81.2% -87.9% -94.2%<br />
Knotweed Wetland 9.56 6.15 4.94 4.75 3.41 1.91 1.40 1.38 1.39 1.41 1.43 1.45 1.50 1.97 3.46 5.63 7.02 6.42 6.89 6.13 3.26 1.20 0.52 0.33<br />
Percent change 385.1% 212.1% 150.8% 140.9% 73.1% -2.8% -28.9% -30.2% -29.3% -28.4% -27.5% -26.4% -23.8% 0.0% 75.5% 185.6% 256.2% 225.9% 249.9% 211.2% 65.6% -39.1% -73.6% -83.0%<br />
Rush Meadow 0.49 0.40 0.32 0.24 0.18 0.16 0.15 0.15 0.15 0.16 0.18 0.27 0.38 0.48 0.53 0.50 0.40 0.29 0.31 0.26 0.14 0.13 0.07 0.02<br />
Percent change 2.1% -16.8% -33.3% -49.9% -63.0% -67.0% -68.2% -68.1% -68.0% -67.9% -62.3% -44.7% -20.5% 0.0% 8.7% 2.7% -17.4% -40.8% -35.4% -46.4% -70.6% -73.4% -86.3% -96.1%<br />
Cattail Wetland 0.01 0.01 0.00 0.00 0.00 0.00 0.00 0.00 0.00 0.00 0.00 0.01 0.01 0.01 0.01 0.01 0.01 0.00 0.00 0.00 0.00 0.00 0.00 0.00<br />
Percent change -27.7% -43.9% -61.7% -74.6% -79.1% -78.8% -78.5% -78.3% -78.0% -77.8% -73.5% -54.8% -23.1% 0.0% -0.8% -21.3% -46.6% -64.3% -64.3% -64.3% -64.3% -64.3% -71.5% -80.4%<br />
Sum Herbaceous Wetland 59.54 53.31 37.24 35.79 31.83 24.01 18.01 16.05 14.49 13.51 12.63 12.43 12.85 14.68 18.89 25.70 32.72 35.02 39.94 44.74 48.27 50.38 40.69 27.19<br />
Percent change 305.5% 263.0% 153.6% 143.7% 116.7% 63.5% 22.6% 9.3% -1.3% -8.0% -14.0% -15.4% -12.5% 0.0% 28.7% 75.0% 122.8% 138.5% 172.0% 204.7% 228.7% 243.1% 177.1% 85.2%<br />
Total Wetland (Willow and Herbaceous) 97.44 85.33 64.39 59.90 53.62 44.16 37.31 34.88 32.84 31.29 30.99 33.58 37.31 40.75 43.85 47.24 49.75 47.61 51.80 53.18 54.41 54.64 43.57 27.19<br />
Percent change 139.1% 109.4% 58.0% 47.0% 31.6% 8.4% -8.4% -14.4% -19.4% -23.2% -24.0% -17.6% -8.5% 0.0% 7.6% 15.9% 22.1% 16.8% 27.1% 30.5% 33.5% 34.1% 6.9% -33.3%<br />
Open Water 128.78 149.87 176.77 185.61 196.09 208.97 218.34 223.08 227.45 231.36 235.23 238.76 242.17 245.57 249.14 252.35 256.40 264.86 266.15 266.46 268.62 268.30 281.06 297.43<br />
Percent change -47.6% -39.0% -28.0% -24.4% -20.2% -14.9% -11.1% -9.2% -7.4% -5.8% -4.2% -2.8% -1.4% 0.0% 1.5% 2.8% 4.4% 7.9% 8.4% 8.5% 9.4% 9.3% 14.4% 21.1%<br />
Upland vegetation c 98.03 89.07 83.12 78.79 74.61 71.21 68.70 66.41 64.10 61.76 58.24 52.22 45.19 38.41 31.79 25.22 18.68 12.37 6.89 5.21 3.51 1.90 0.22 0.22<br />
Percent change 155.2% 131.9% 116.4% 105.1% 94.2% 85.4% 78.9% 72.9% 66.9% 60.8% 51.6% 36.0% 17.6% 0.0% -17.2% -34.3% -51.4% -67.8% -82.1% -86.4% -90.9% -95.1% -99.4% -99.4%<br />
Developed 1.17 1.17 1.17 1.17 1.17 1.17 1.17 1.17 1.17 1.17 1.17 1.17 1.17 1.17 1.17 1.17 1.17 1.17 1.17 1.17 1.17 1.17 1.17 1.17<br />
Percent change 0.0% 0.0% 0.0% 0.0% 0.0% 0.0% 0.0% 0.0% 0.0% 0.0% 0.0% 0.0% 0.0% 0.0% 0.0% 0.0% 0.0% 0.0% 0.0% 0.0% 0.0% 0.0% 0.0% 0.0%<br />
a Acreages in the table are for vegetation at and below 13 feet City Datum; for most upland vegetation types there is additional acreage above an elevation of 13 feet.<br />
b Percent change is relative to vegetation predicted to occur at 3 feet City Datum<br />
c All upland vegetation types were combined for the analysis of receding lake levels<br />
Values in bold indicate an increase in cover type<br />
Values in italic indicate a decrease in cover type<br />
C-20
TABLE C-16: PREDICTED VEGETATION CHANGE AND PERCENT CHANGE RELATIVE TO WATER SURFACE ELEVATION 4 FEET CITY DATUM a<br />
Cover Type<br />
-10 -9 -8 -7 -6 -5 -4 -3 -2 -1 0 1 2 3 4 5 6 ft 7 ft 8 ft 9 ft 10 ft 11 ft 12 ft 13 ft<br />
Arroyo Willow Riparian Scrub 37.89 32.02 27.15 24.11 21.80 20.15 19.31 18.82 18.35 17.77 18.36 21.15 24.45 26.07 24.95 21.54 17.03 12.59 11.86 8.44 6.14 4.26 2.88 0.00<br />
Percent change b 51.9% 28.3% 8.8% -3.4% -12.7% -19.2% -22.6% -24.6% -26.5% -28.8% -26.4% -15.2% -2.0% 4.5% 0.0% -13.7% -31.7% -49.5% -52.5% -66.2% -75.4% -82.9% -88.5% -100.0%<br />
Bulrush Wetland 49.12 46.43 31.72 30.60 28.06 21.76 16.28 14.36 12.78 11.78 10.82 10.42 10.58 11.80 14.49 19.23 25.05 28.15 32.57 38.18 44.74 48.97 40.05 26.81<br />
Percent change 239.0% 220.4% 118.9% 111.2% 93.7% 50.2% 12.4% -0.9% -11.8% -18.7% -25.3% -28.1% -27.0% -18.6% 0.0% 32.7% 72.9% 94.3% 124.8% 163.5% 208.8% 238.0% 176.4% 85.0%<br />
Giant Vetch Wetland 0.38 0.33 0.27 0.20 0.17 0.17 0.17 0.17 0.17 0.16 0.20 0.29 0.38 0.43 0.42 0.35 0.25 0.17 0.17 0.16 0.13 0.08 0.05 0.03<br />
Percent change -10.5% -21.7% -37.0% -52.8% -58.6% -59.5% -59.9% -60.2% -60.6% -61.0% -53.4% -31.4% -9.0% 2.4% 0.0% -17.3% -41.2% -60.6% -60.6% -61.9% -69.8% -80.8% -87.6% -94.0%<br />
Knotweed Wetland 9.56 6.15 4.94 4.75 3.41 1.91 1.40 1.38 1.39 1.41 1.43 1.45 1.50 1.97 3.46 5.63 7.02 6.42 6.89 6.13 3.26 1.20 0.52 0.33<br />
Percent change 176.5% 77.9% 42.9% 37.3% -1.3% -44.6% -59.5% -60.2% -59.7% -59.2% -58.7% -58.0% -56.6% -43.0% 0.0% 62.8% 103.0% 85.7% 99.4% 77.3% -5.6% -65.3% -85.0% -90.3%<br />
Rush Meadow 0.49 0.40 0.32 0.24 0.18 0.16 0.15 0.15 0.15 0.16 0.18 0.27 0.38 0.48 0.53 0.50 0.40 0.29 0.31 0.26 0.14 0.13 0.07 0.02<br />
Percent change -6.1% -23.5% -38.6% -53.9% -66.0% -69.7% -70.7% -70.6% -70.6% -70.5% -65.3% -49.1% -26.9% -8.0% 0.0% -5.5% -24.0% -45.5% -40.6% -50.7% -73.0% -75.5% -87.4% -96.4%<br />
Cattail Wetland 0.01 0.01 0.00 0.00 0.00 0.00 0.00 0.00 0.00 0.00 0.00 0.01 0.01 0.01 0.01 0.01 0.01 0.00 0.00 0.00 0.00 0.00 0.00 0.00<br />
Percent change -27.2% -43.4% -61.4% -74.4% -78.9% -78.6% -78.4% -78.1% -77.8% -77.6% -73.3% -54.4% -22.4% 0.8% 0.0% -20.7% -46.1% -64.0% -64.0% -64.0% -64.0% -64.0% -71.2% -80.2%<br />
Sum Herbaceous Wetland 59.54 53.31 37.24 35.79 31.83 24.01 18.01 16.05 14.49 13.51 12.63 12.43 12.85 14.68 18.89 25.70 32.72 35.02 39.94 44.74 48.27 50.38 40.69 27.19<br />
Percent change 215.2% 182.2% 97.1% 89.4% 68.5% 27.1% -4.7% -15.0% -23.3% -28.5% -33.2% -34.2% -32.0% -22.3% 0.0% 36.0% 73.2% 85.4% 111.4% 136.8% 155.5% 166.7% 115.4% 43.9%<br />
Total Wetland (Willow and Herbaceous) 97.44 85.33 64.39 59.90 53.62 44.16 37.31 34.88 32.84 31.29 30.99 33.58 37.31 40.75 43.85 47.24 49.75 47.61 51.80 53.18 54.41 54.64 43.57 27.19<br />
Percent change 122.2% 94.6% 46.9% 36.6% 22.3% 0.7% -14.9% -20.5% -25.1% -28.6% -29.3% -23.4% -14.9% -7.1% 0.0% 7.7% 13.5% 8.6% 18.1% 21.3% 24.1% 24.6% -0.6% -38.0%<br />
Open Water 128.78 149.87 176.77 185.61 196.09 208.97 218.34 223.08 227.45 231.36 235.23 238.76 242.17 245.57 249.14 252.35 256.40 264.86 266.15 266.46 268.62 268.30 281.06 297.43<br />
Percent change -48.3% -39.8% -29.0% -25.5% -21.3% -16.1% -12.4% -10.5% -8.7% -7.1% -5.6% -4.2% -2.8% -1.4% 0.0% 1.3% 2.9% 6.3% 6.8% 7.0% 7.8% 7.7% 12.8% 19.4%<br />
Upland vegetation c 98.03 89.07 83.12 78.79 74.61 71.21 68.70 66.41 64.10 61.76 58.24 52.22 45.19 38.41 31.79 25.22 18.68 12.37 6.89 5.21 3.51 1.90 0.22 0.22<br />
Percent change 208.4% 180.2% 161.5% 147.8% 134.7% 124.0% 116.1% 108.9% 101.6% 94.3% 83.2% 64.3% 42.1% 20.8% 0.0% -20.7% -41.2% -61.1% -78.3% -83.6% -89.0% -94.0% -99.3% -99.3%<br />
Developed 1.17 1.17 1.17 1.17 1.17 1.17 1.17 1.17 1.17 1.17 1.17 1.17 1.17 1.17 1.17 1.17 1.17 1.17 1.17 1.17 1.17 1.17 1.17 1.17<br />
Percent change 0.0% 0.0% 0.0% 0.0% 0.0% 0.0% 0.0% 0.0% 0.0% 0.0% 0.0% 0.0% 0.0% 0.0% 0.0% 0.0% 0.0% 0.0% 0.0% 0.0% 0.0% 0.0% 0.0% 0.0%<br />
a Acreages in the table are for vegetation at and below 13 feet City Datum; for most upland vegetation types there is additional acreage above an elevation of 13 feet.<br />
b Percent change is relative to vegetation predicted to occur at 4 feet City Datum<br />
c All upland vegetation types were combined for the analysis of receding lake levels<br />
Values in bold indicate an increase in cover type<br />
Values in italic indicate a decrease in cover type<br />
Mean Annual Water Surface Elevation (City Datum)<br />
C-21
TABLE C-17: PREDICTED VEGETATION CHANGE AND PERCENT CHANGE RELATIVE TO WATER SURFACE ELEVATION 5 FEET CITY DATUM a<br />
Cover Type<br />
-10 -9 -8 -7 -6 -5 -4 -3 -2 -1 0 1 2 3 4 5 6 ft 7 ft 8 ft 9 ft 10 ft 11 ft 12 ft 13 ft<br />
Arroyo Willow Riparian Scrub 37.89 32.02 27.15 24.11 21.80 20.15 19.31 18.82 18.35 17.77 18.36 21.15 24.45 26.07 24.95 21.54 17.03 12.59 11.86 8.44 6.14 4.26 2.88 0.00<br />
Percent change b 75.9% 48.7% 26.1% 11.9% 1.2% -6.4% -10.4% -12.6% -14.8% -17.5% -14.7% -1.8% 13.5% 21.0% 15.9% 0.0% -20.9% -41.5% -45.0% -60.8% -71.5% -80.2% -86.6% -100.0%<br />
Bulrush Wetland 49.12 46.43 31.72 30.60 28.06 21.76 16.28 14.36 12.78 11.78 10.82 10.42 10.58 11.80 14.49 19.23 25.05 28.15 32.57 38.18 44.74 48.97 40.05 26.81<br />
Percent change 155.5% 141.5% 64.9% 59.2% 45.9% 13.2% -15.3% -25.3% -33.5% -38.7% -43.7% -45.8% -45.0% -38.6% -24.6% 0.0% 30.3% 46.4% 69.4% 98.6% 132.7% 154.7% 108.3% 39.4%<br />
Giant Vetch Wetland 0.38 0.33 0.27 0.20 0.17 0.17 0.17 0.17 0.17 0.16 0.20 0.29 0.38 0.43 0.42 0.35 0.25 0.17 0.17 0.16 0.13 0.08 0.05 0.03<br />
Percent change 8.2% -5.3% -23.8% -42.9% -49.9% -51.0% -51.5% -51.9% -52.3% -52.8% -43.7% -17.0% 10.0% 23.9% 20.9% 0.0% -28.9% -52.4% -52.4% -53.9% -63.4% -76.7% -85.0% -92.8%<br />
Knotweed Wetland 9.56 6.15 4.94 4.75 3.41 1.91 1.40 1.38 1.39 1.41 1.43 1.45 1.50 1.97 3.46 5.63 7.02 6.42 6.89 6.13 3.26 1.20 0.52 0.33<br />
Percent change 69.9% 9.3% -12.2% -15.6% -39.4% -66.0% -75.1% -75.5% -75.2% -74.9% -74.6% -74.2% -73.3% -65.0% -38.6% 0.0% 24.7% 14.1% 22.5% 9.0% -42.0% -78.7% -90.8% -94.1%<br />
Rush Meadow 0.49 0.40 0.32 0.24 0.18 0.16 0.15 0.15 0.15 0.16 0.18 0.27 0.38 0.48 0.53 0.50 0.40 0.29 0.31 0.26 0.14 0.13 0.07 0.02<br />
Percent change -0.6% -19.0% -35.1% -51.2% -64.0% -67.9% -69.0% -68.9% -68.8% -68.8% -63.3% -46.2% -22.7% -2.7% 5.8% 0.0% -19.6% -42.4% -37.2% -47.8% -71.4% -74.1% -86.7% -96.2%<br />
Cattail Wetland 0.01 0.01 0.00 0.00 0.00 0.00 0.00 0.00 0.00 0.00 0.00 0.01 0.01 0.01 0.01 0.01 0.01 0.00 0.00 0.00 0.00 0.00 0.00 0.00<br />
Percent change -8.1% -28.7% -51.3% -67.8% -73.4% -73.1% -72.7% -72.4% -72.1% -71.7% -66.3% -42.5% -2.2% 27.1% 26.1% 0.0% -32.1% -54.7% -54.7% -54.7% -54.7% -54.7% -63.7% -75.1%<br />
Sum Herbaceous Wetland 59.54 53.31 37.24 35.79 31.83 24.01 18.01 16.05 14.49 13.51 12.63 12.43 12.85 14.68 18.89 25.70 32.72 35.02 39.94 44.74 48.27 50.38 40.69 27.19<br />
Percent change 131.7% 107.4% 44.9% 39.3% 23.8% -6.6% -29.9% -37.5% -43.6% -47.4% -50.9% -51.6% -50.0% -42.9% -26.5% 0.0% 27.3% 36.3% 55.4% 74.1% 87.8% 96.0% 58.3% 5.8%<br />
Total Wetland (Willow and Herbaceous) 97.44 85.33 64.39 59.90 53.62 44.16 37.31 34.88 32.84 31.29 30.99 33.58 37.31 40.75 43.85 47.24 49.75 47.61 51.80 53.18 54.41 54.64 43.57 27.19<br />
Percent change 106.3% 80.6% 36.3% 26.8% 13.5% -6.5% -21.0% -26.2% -30.5% -33.8% -34.4% -28.9% -21.0% -13.7% -7.2% 0.0% 5.3% 0.8% 9.7% 12.6% 15.2% 15.7% -7.8% -42.4%<br />
Open Water 128.78 149.87 176.77 185.61 196.09 208.97 218.34 223.08 227.45 231.36 235.23 238.76 242.17 245.57 249.14 252.35 256.40 264.86 266.15 266.46 268.62 268.30 281.06 297.43<br />
Percent change -49.0% -40.6% -30.0% -26.4% -22.3% -17.2% -13.5% -11.6% -9.9% -8.3% -6.8% -5.4% -4.0% -2.7% -1.3% 0.0% 1.6% 5.0% 5.5% 5.6% 6.5% 6.3% 11.4% 17.9%<br />
Upland vegetation c 98.03 89.07 83.12 78.79 74.61 71.21 68.70 66.41 64.10 61.76 58.24 52.22 45.19 38.41 31.79 25.22 18.68 12.37 6.89 5.21 3.51 1.90 0.22 0.22<br />
Percent change 288.7% 253.2% 229.6% 212.4% 195.8% 182.4% 172.4% 163.3% 154.2% 144.9% 130.9% 107.1% 79.2% 52.3% 26.1% 0.0% -25.9% -51.0% -72.7% -79.3% -86.1% -92.5% -99.1% -99.1%<br />
Developed 1.17 1.17 1.17 1.17 1.17 1.17 1.17 1.17 1.17 1.17 1.17 1.17 1.17 1.17 1.17 1.17 1.17 1.17 1.17 1.17 1.17 1.17 1.17 1.17<br />
Percent change 0.0% 0.0% 0.0% 0.0% 0.0% 0.0% 0.0% 0.0% 0.0% 0.0% 0.0% 0.0% 0.0% 0.0% 0.0% 0.0% 0.0% 0.0% 0.0% 0.0% 0.0% 0.0% 0.0% 0.0%<br />
a Acreages in the table are for vegetation at and below 13 feet City Datum; for most upland vegetation types there is additional acreage above an elevation of 13 feet.<br />
b Percent change is relative to vegetation predicted to occur at 5 feet City Datum<br />
c All upland vegetation types were combined for the analysis of receding lake levels<br />
Values in bold indicate an increase in cover type<br />
Values in italic indicate a decrease in cover type<br />
Mean Annual Water Surface Elevation (City Datum)<br />
C-22
TABLE C-18: PREDICTED VEGETATION CHANGE AND PERCENT CHANGE RELATIVE TO WATER SURFACE ELEVATION 6 FEET CITY DATUM a<br />
Cover Type<br />
-10 -9 -8 -7 -6 -5 -4 -3 -2 -1 0 1 2 3 4 5 6 ft 7 ft 8 ft 9 ft 10 ft 11 ft 12 ft 13 ft<br />
Arroyo Willow Riparian Scrub 37.89 32.02 27.15 24.11 21.80 20.15 19.31 18.82 18.35 17.77 18.36 21.15 24.45 26.07 24.95 21.54 17.03 12.59 11.86 8.44 6.14 4.26 2.88 0.00<br />
Percent change b 122.5% 88.0% 59.4% 41.5% 28.0% 18.3% 13.4% 10.5% 7.7% 4.4% 7.8% 24.2% 43.6% 53.1% 46.5% 26.5% -26.1% -30.4% -50.4% -63.9% -75.0% -83.1% -100.0%<br />
Bulrush Wetland 49.12 46.43 31.72 30.60 28.06 21.76 16.28 14.36 12.78 11.78 10.82 10.42 10.58 11.80 14.49 19.23 25.05 28.15 32.57 38.18 44.74 48.97 40.05 26.81<br />
Percent change 96.1% 85.4% 26.6% 22.2% 12.0% -13.1% -35.0% -42.7% -49.0% -53.0% -56.8% -58.4% -57.7% -52.9% -42.2% -23.2% 12.4% 30.0% 52.5% 78.6% 95.5% 59.9% 7.0%<br />
Giant Vetch Wetland 0.38 0.33 0.27 0.20 0.17 0.17 0.17 0.17 0.17 0.16 0.20 0.29 0.38 0.43 0.42 0.35 0.25 0.17 0.17 0.16 0.13 0.08 0.05 0.03<br />
Percent change 52.3% 33.2% 7.2% -19.6% -29.5% -31.1% -31.7% -32.3% -32.9% -33.6% -20.7% 16.8% 54.9% 74.4% 70.2% 40.7% -33.0% -33.0% -35.2% -48.5% -67.3% -78.9% -89.9%<br />
Knotweed Wetland 9.56 6.15 4.94 4.75 3.41 1.91 1.40 1.38 1.39 1.41 1.43 1.45 1.50 1.97 3.46 5.63 7.02 6.42 6.89 6.13 3.26 1.20 0.52 0.33<br />
Percent change 36.2% -12.4% -29.6% -32.4% -51.4% -72.7% -80.0% -80.4% -80.2% -79.9% -79.7% -79.3% -78.6% -71.9% -50.7% -19.8% -8.5% -1.8% -12.6% -53.5% -82.9% -92.6% -95.2%<br />
Rush Meadow 0.49 0.40 0.32 0.24 0.18 0.16 0.15 0.15 0.15 0.16 0.18 0.27 0.38 0.48 0.53 0.50 0.40 0.29 0.31 0.26 0.14 0.13 0.07 0.02<br />
Percent change 23.6% 0.7% -19.3% -39.3% -55.2% -60.1% -61.5% -61.4% -61.3% -61.1% -54.4% -33.0% -3.8% 21.1% 31.6% 24.4% -28.3% -21.8% -35.1% -64.5% -67.8% -83.4% -95.3%<br />
Cattail Wetland 0.01 0.01 0.00 0.00 0.00 0.00 0.00 0.00 0.00 0.00 0.00 0.01 0.01 0.01 0.01 0.01 0.01 0.00 0.00 0.00 0.00 0.00 0.00 0.00<br />
Percent change 35.2% 5.0% -28.4% -52.5% -60.8% -60.4% -59.9% -59.4% -58.9% -58.4% -50.4% -15.3% 44.0% 87.1% 85.6% 47.2% -33.3% -33.3% -33.3% -33.3% -33.3% -46.6% -63.3%<br />
Sum Herbaceous Wetland 59.54 53.31 37.24 35.79 31.83 24.01 18.01 16.05 14.49 13.51 12.63 12.43 12.85 14.68 18.89 25.70 32.72 35.02 39.94 44.74 48.27 50.38 40.69 27.19<br />
Percent change 82.0% 63.0% 13.9% 9.4% -2.7% -26.6% -45.0% -50.9% -55.7% -58.7% -61.4% -62.0% -60.7% -55.1% -42.2% -21.4% 7.0% 22.1% 36.7% 47.5% 54.0% 24.4% -16.9%<br />
Total Wetland (Willow and Herbaceous) 97.44 85.33 64.39 59.90 53.62 44.16 37.31 34.88 32.84 31.29 30.99 33.58 37.31 40.75 43.85 47.24 49.75 47.61 51.80 53.18 54.41 54.64 43.57 27.19<br />
Percent change 95.9% 71.5% 29.4% 20.4% 7.8% -11.2% -25.0% -29.9% -34.0% -37.1% -37.7% -32.5% -25.0% -18.1% -11.9% -5.0% -4.3% 4.1% 6.9% 9.4% 9.8% -12.4% -45.3%<br />
Open Water 128.78 149.87 176.77 185.61 196.09 208.97 218.34 223.08 227.45 231.36 235.23 238.76 242.17 245.57 249.14 252.35 256.40 264.86 266.15 266.46 268.62 268.30 281.06 297.43<br />
Percent change -51.5% -43.6% -33.5% -30.2% -26.2% -21.4% -17.8% -16.1% -14.4% -12.9% -11.5% -10.2% -8.9% -7.6% -6.2% -5.0% 3.3% 3.8% 3.9% 4.8% 4.6% 9.6% 16.0%<br />
Annual Grassland 0.16 0.08 0.01 0.00 0.00 0.00 0.00 0.00<br />
Percent change -50.6% -90.8% -97.3% -97.8% -98.8% -100.0% -100.0%<br />
Central Dune Scrub 0.32 0.17 0.16 0.14 0.11 0.06 0.00 0.00<br />
Percent change -48.2% -51.9% -55.7% -65.9% -80.7% -100.0% -100.0%<br />
Coastal Scrub 3.64 2.31 1.77 1.34 0.90 0.43 0.00 0.00<br />
Percent change -36.5% -51.3% -63.1% -75.4% -88.1% -100.0% -100.0%<br />
Non-native Forest 12.66 8.72 4.22 2.96 1.87 0.93 0.00 0.00<br />
All upland vegetation types combined for receding water level analysis<br />
Percent change -31.2% -66.7% -76.6% -85.2% -92.6% -100.0% -100.0%<br />
Non-native Herbaceous 1.55 0.87 0.66 0.53 0.40 0.25 0.00 0.00<br />
Percent change -44.3% -57.7% -66.1% -74.2% -84.1% -100.0% -100.0%<br />
Non-native Scrub 0.32 0.22 0.07 0.22 0.22 0.22 0.22 0.22<br />
Percent change -30.7% -78.3% -30.7% -30.7% -30.7% -30.7% -30.7%<br />
Perennial Grassland 0.02 0.01 0.01 0.01 0.00 0.00 0.00 0.00<br />
Percent change -35.5% -41.4% -66.7% -81.2% -92.5% -100.0% -100.0%<br />
Upland vegetation c 98.03 89.07 83.12 78.79 74.61 71.21 68.70 66.41 64.10 61.76 58.24 52.22 45.19 38.41 31.79 25.22 18.68 12.37 6.89 5.21 3.51 1.90 0.22 0.22<br />
Percent change 424.7% 376.7% 344.9% 321.7% 299.3% 281.2% 267.7% 255.5% 243.1% 230.6% 211.7% 179.5% 141.9% 105.6% 70.2% 35.0% -33.7% -63.1% -72.1% -81.2% -89.8% -98.8% -98.8%<br />
Developed 1.17 1.17 1.17 1.17 1.17 1.17 1.17 1.17 1.17 1.17 1.17 1.17 1.17 1.17 1.17 1.17 1.17 1.17 1.17 1.17 1.17 1.17 1.17 1.17<br />
Percent change 0.0% 0.0% 0.0% 0.0% 0.0% 0.0% 0.0% 0.0% 0.0% 0.0% 0.0% 0.0% 0.0% 0.0% 0.0% 0.0% 0.0% 0.0% 0.0% 0.0% 0.0% 0.0% 0.0%<br />
a Acreages in the table are for vegetation at and below 13 feet City Datum; for most upland vegetation types there is additional acreage above an elevation of 13 feet.<br />
b Percent change is relative to vegetation predicted to occur at 6 feet City Datum<br />
c All upland vegetation types were combined for the analysis of receding lake levels<br />
Values in bold indicate an increase in cover type<br />
Values in italic indicate a decrease in cover type<br />
Mean Annual Water Surface Elevation (City Datum)<br />
C-23
TABLE C-19: PREDICTED VEGETATION CHANGE AND PERCENT CHANGE RELATIVE TO WATER SURFACE ELEVATION 7 FEET CITY DATUM a<br />
Cover Type<br />
-10 -9 -8 -7 -6 -5 -4 -3 -2 -1 0 1 2 3 4 5 6 ft 7 ft 8 ft 9 ft 10 ft 11 ft 12 ft 13 ft<br />
Arroyo Willow Riparian Scrub 37.89 32.02 27.15 24.11 21.80 20.15 19.31 18.82 18.35 17.77 18.36 21.15 24.45 26.07 24.95 21.54 17.03 12.59 11.86 8.44 6.14 4.26 2.88 0.00<br />
Percent change b 201.0% 154.3% 115.6% 91.5% 73.1% 60.0% 53.3% 49.5% 45.7% 41.2% 45.8% 68.0% 94.2% 107.0% 98.2% 71.1% 35.3% -5.8% -32.9% -51.2% -66.1% -77.1% -100.0%<br />
Bulrush Wetland 49.12 46.43 31.72 30.60 28.06 21.76 16.28 14.36 12.78 11.78 10.82 10.42 10.58 11.80 14.49 19.23 25.05 28.15 32.57 38.18 44.74 48.97 40.05 26.81<br />
Percent change 74.5% 64.9% 12.7% 8.7% -0.3% -22.7% -42.1% -49.0% -54.6% -58.1% -61.6% -63.0% -62.4% -58.1% -48.5% -31.7% -11.0% 0.0% 15.7% 35.7% 58.9% 74.0% 42.3% -4.8%<br />
Giant Vetch Wetland 0.38 0.33 0.27 0.20 0.17 0.17 0.17 0.17 0.17 0.16 0.20 0.29 0.38 0.43 0.42 0.35 0.25 0.17 0.17 0.16 0.13 0.08 0.05 0.03<br />
Percent change 127.3% 98.7% 59.9% 19.9% 5.2% 2.8% 1.9% 1.0% 0.1% -0.9% 18.2% 74.3% 131.0% 160.1% 153.9% 110.0% 49.2% 0.0% 0.0% -3.3% -23.2% -51.2% -68.6% -84.9%<br />
Knotweed Wetland 9.56 6.15 4.94 4.75 3.41 1.91 1.40 1.38 1.39 1.41 1.43 1.45 1.50 1.97 3.46 5.63 7.02 6.42 6.89 6.13 3.26 1.20 0.52 0.33<br />
Percent change 48.9% -4.2% -23.0% -26.1% -46.9% -70.2% -78.2% -78.6% -78.3% -78.0% -77.8% -77.4% -76.6% -69.3% -46.2% -12.4% 9.3% 0.0% 7.4% -4.5% -49.2% -81.3% -91.9% -94.8%<br />
Rush Meadow 0.49 0.40 0.32 0.24 0.18 0.16 0.15 0.15 0.15 0.16 0.18 0.27 0.38 0.48 0.53 0.50 0.40 0.29 0.31 0.26 0.14 0.13 0.07 0.02<br />
Percent change 72.4% 40.5% 12.7% -15.3% -37.5% -44.3% -46.3% -46.1% -45.9% -45.8% -36.3% -6.6% 34.2% 68.9% 83.6% 73.5% 39.5% 0.0% 9.0% -9.4% -50.4% -55.0% -76.9% -93.4%<br />
Cattail Wetland 0.01 0.01 0.00 0.00 0.00 0.00 0.00 0.00 0.00 0.00 0.00 0.01 0.01 0.01 0.01 0.01 0.01 0.00 0.00 0.00 0.00 0.00 0.00 0.00<br />
Percent change 102.6% 57.3% 7.3% -28.9% -41.3% -40.6% -39.9% -39.1% -38.4% -37.6% -25.6% 26.8% 115.7% 180.4% 178.1% 120.5% 49.8% 0.0% 0.0% 0.0% 0.0% 0.0% -20.0% -45.0%<br />
Sum Herbaceous Wetland 59.54 53.31 37.24 35.79 31.83 24.01 18.01 16.05 14.49 13.51 12.63 12.43 12.85 14.68 18.89 25.70 32.72 35.02 39.94 44.74 48.27 50.38 40.69 27.19<br />
Percent change 70.0% 52.2% 6.3% 2.2% -9.1% -31.4% -48.6% -54.2% -58.6% -61.4% -64.0% -64.5% -63.3% -58.1% -46.1% -26.6% -6.6% 0.0% 14.0% 27.7% 37.8% 43.8% 16.2% -22.4%<br />
Total Wetland (Willow and Herbaceous) 97.44 85.33 64.39 59.90 53.62 44.16 37.31 34.88 32.84 31.29 30.99 33.58 37.31 40.75 43.85 47.24 49.75 47.61 51.80 53.18 54.41 54.64 43.57 27.19<br />
Percent change 104.6% 79.2% 35.2% 25.8% 12.6% -7.3% -21.6% -26.8% -31.0% -34.3% -34.9% -29.5% -21.6% -14.4% -7.9% -0.8% 4.5% 0.0% 8.8% 11.7% 14.3% 14.8% -8.5% -42.9%<br />
Open Water 128.78 149.87 176.77 185.61 196.09 208.97 218.34 223.08 227.45 231.36 235.23 238.76 242.17 245.57 249.14 252.35 256.40 264.86 266.15 266.46 268.62 268.30 281.06 297.43<br />
Percent change -51.4% -43.4% -33.3% -29.9% -26.0% -21.1% -17.6% -15.8% -14.1% -12.6% -11.2% -9.9% -8.6% -7.3% -5.9% -4.7% -3.2% 0.0% 0.5% 0.6% 1.4% 1.3% 6.1% 12.3%<br />
Upland vegetation c 98.03 89.07 83.12 78.79 74.61 71.21 68.70 66.41 64.10 61.76 58.24 52.22 45.19 38.41 31.79 25.22 18.68 12.37 6.89 5.21 3.51 1.90 0.22 0.22<br />
Percent change 692.5% 620.0% 572.0% 536.9% 503.1% 475.7% 455.4% 436.9% 418.2% 399.3% 370.8% 322.2% 265.3% 210.5% 157.0% 103.9% 51.0% 0.0% -44.3% -57.9% -71.6% -84.6% -98.2% -98.2%<br />
Developed 1.17 1.17 1.17 1.17 1.17 1.17 1.17 1.17 1.17 1.17 1.17 1.17 1.17 1.17 1.17 1.17 1.17 1.17 1.17 1.17 1.17 1.17 1.17 1.17<br />
Percent change 0.0% 0.0% 0.0% 0.0% 0.0% 0.0% 0.0% 0.0% 0.0% 0.0% 0.0% 0.0% 0.0% 0.0% 0.0% 0.0% 0.0% 0.0% 0.0% 0.0% 0.0% 0.0% 0.0% 0.0%<br />
a Acreages in the table are for vegetation at and below 13 feet City Datum; for most upland vegetation types there is additional acreage above an elevation of 13 feet.<br />
b Percent change is relative to vegetation predicted to occur at 7 feet City Datum<br />
c All upland vegetation types were combined for the analysis of receding lake levels<br />
Values in bold indicate an increase in cover type<br />
Values in italic indicate a decrease in cover type<br />
Mean Annual Water Surface Elevation (City Datum)<br />
C-24
TABLE C-20: PREDICTED VEGETATION CHANGE AND PERCENT CHANGE RELATIVE TO WATER SURFACE ELEVATION 8 FEET CITY DATUM a<br />
Cover Type<br />
-10 -9 -8 -7 -6 -5 -4 -3 -2 -1 0 1 2 3 4 5 6 ft 7 ft 8 ft 9 ft 10 ft 11 ft 12 ft 13 ft<br />
Arroyo Willow Riparian Scrub 37.89 32.02 27.15 24.11 21.80 20.15 19.31 18.82 18.35 17.77 18.36 21.15 24.45 26.07 24.95 21.54 17.03 12.59 11.86 8.44 6.14 4.26 2.88 0.00<br />
Percent change b 219.6% 170.1% 129.0% 103.3% 83.8% 70.0% 62.8% 58.8% 54.7% 49.9% 54.9% 78.4% 106.3% 119.9% 110.5% 81.7% 43.7% 49.1% 0.0% -28.8% -48.2% -64.0% -75.7% -100.0%<br />
Bulrush Wetland 49.12 46.43 31.72 30.60 28.06 21.76 16.28 14.36 12.78 11.78 10.82 10.42 10.58 11.80 14.49 19.23 25.05 28.15 32.57 38.18 44.74 48.97 40.05 26.81<br />
Percent change 50.8% 42.6% -2.6% -6.0% -13.8% -33.2% -50.0% -55.9% -60.8% -63.8% -66.8% -68.0% -67.5% -63.8% -55.5% -41.0% -23.1% -13.6% 0.0% 17.3% 37.4% 50.4% 23.0% -17.7%<br />
Giant Vetch Wetland 0.38 0.33 0.27 0.20 0.17 0.17 0.17 0.17 0.17 0.16 0.20 0.29 0.38 0.43 0.42 0.35 0.25 0.17 0.17 0.16 0.13 0.08 0.05 0.03<br />
Percent change 127.3% 98.7% 59.9% 19.9% 5.2% 2.8% 1.9% 1.0% 0.1% -0.9% 18.2% 74.3% 131.0% 160.1% 153.9% 110.0% 49.2% 0.0% 0.0% -3.3% -23.2% -51.2% -68.6% -84.9%<br />
Knotweed Wetland 9.56 6.15 4.94 4.75 3.41 1.91 1.40 1.38 1.39 1.41 1.43 1.45 1.50 1.97 3.46 5.63 7.02 6.42 6.89 6.13 3.26 1.20 0.52 0.33<br />
Percent change 38.6% -10.8% -28.3% -31.1% -50.5% -72.2% -79.7% -80.0% -79.8% -79.6% -79.3% -79.0% -78.2% -71.4% -49.9% -18.4% 1.8% -6.9% 0.0% -11.1% -52.7% -82.6% -92.5% -95.1%<br />
Rush Meadow 0.49 0.40 0.32 0.24 0.18 0.16 0.15 0.15 0.15 0.16 0.18 0.27 0.38 0.48 0.53 0.50 0.40 0.29 0.31 0.26 0.14 0.13 0.07 0.02<br />
Percent change 58.1% 28.9% 3.3% -22.3% -42.7% -48.9% -50.7% -50.6% -50.4% -50.3% -41.6% -14.3% 23.1% 54.9% 68.3% 59.1% 28.0% -8.3% 0.0% -16.9% -54.5% -58.7% -78.8% -93.9%<br />
Cattail Wetland 0.01 0.01 0.00 0.00 0.00 0.00 0.00 0.00 0.00 0.00 0.00 0.01 0.01 0.01 0.01 0.01 0.01 0.00 0.00 0.00 0.00 0.00 0.00 0.00<br />
Percent change 102.6% 57.3% 7.3% -28.9% -41.3% -40.6% -39.9% -39.1% -38.4% -37.6% -25.6% 26.8% 115.7% 180.4% 178.1% 120.5% 49.8% 0.0% 0.0% 0.0% 0.0% 0.0% -20.0% -45.0%<br />
Sum Herbaceous Wetland 59.54 53.31 37.24 35.79 31.83 24.01 18.01 16.05 14.49 13.51 12.63 12.43 12.85 14.68 18.89 25.70 32.72 35.02 39.94 44.74 48.27 50.38 40.69 27.19<br />
Percent change 49.1% 33.5% -6.8% -10.4% -20.3% -39.9% -54.9% -59.8% -63.7% -66.2% -68.4% -68.9% -67.8% -63.2% -52.7% -35.7% -18.1% -12.3% 0.0% 12.0% 20.9% 26.1% 1.9% -31.9%<br />
Total Wetland (Willow and Herbaceous) 97.44 85.33 64.39 59.90 53.62 44.16 37.31 34.88 32.84 31.29 30.99 33.58 37.31 40.75 43.85 47.24 49.75 47.61 51.80 53.18 54.41 54.64 43.57 27.19<br />
Percent change 88.1% 64.7% 24.3% 15.6% 3.5% -14.7% -28.0% -32.7% -36.6% -39.6% -40.2% -35.2% -28.0% -21.3% -15.4% -8.8% -4.0% -8.1% 0.0% 2.7% 5.0% 5.5% -15.9% -47.5%<br />
Open Water 128.78 149.87 176.77 185.61 196.09 208.97 218.34 223.08 227.45 231.36 235.23 238.76 242.17 245.57 249.14 252.35 256.40 264.86 266.15 266.46 268.62 268.30 281.06 297.43<br />
Percent change -51.6% -43.7% -33.6% -30.3% -26.3% -21.5% -18.0% -16.2% -14.5% -13.1% -11.6% -10.3% -9.0% -7.7% -6.4% -5.2% -3.7% -0.5% 0.0% 0.1% 0.9% 0.8% 5.6% 11.8%<br />
Upland vegetation c 98.03 89.07 83.12 78.79 74.61 71.21 68.70 66.41 64.10 61.76 58.24 52.22 45.19 38.41 31.79 25.22 18.68 12.37 6.89 5.21 3.51 1.90 0.22 0.22<br />
Percent change 1322.8% 1192.7% 1106.4% 1043.5% 982.8% 933.5% 897.1% 863.9% 830.3% 796.4% 745.2% 658.0% 555.8% 457.5% 361.4% 266.0% 171.1% 79.5% 0.0% -24.4% -49.1% -72.4% -96.8% -96.8%<br />
Developed 1.17 1.17 1.17 1.17 1.17 1.17 1.17 1.17 1.17 1.17 1.17 1.17 1.17 1.17 1.17 1.17 1.17 1.17 1.17 1.17 1.17 1.17 1.17 1.17<br />
Percent change 0.0% 0.0% 0.0% 0.0% 0.0% 0.0% 0.0% 0.0% 0.0% 0.0% 0.0% 0.0% 0.0% 0.0% 0.0% 0.0% 0.0% 0.0% 0.0% 0.0% 0.0% 0.0% 0.0% 0.0%<br />
a Acreages in the table are for vegetation at and below 13 feet City Datum; for most upland vegetation types there is additional acreage above an elevation of 13 feet.<br />
b Percent change is relative to vegetation predicted to occur at 8 feet City Datum<br />
c All upland vegetation types were combined for the analysis of receding lake levels<br />
Values in bold indicate an increase in cover type<br />
Values in italic indicate a decrease in cover type<br />
Mean Annual Water Surface Elevation (City Datum)<br />
C-25
TABLE C-21: PREDICTED VEGETATION CHANGE AND PERCENT CHANGE RELATIVE TO WATER SURFACE ELEVATION 9 FEET CITY DATUM a<br />
Cover Type<br />
-10 -9 -8 -7 -6 -5 -4 -3 -2 -1 0 1 2 3 4 5 6 ft 7 ft 8 ft 9 ft 10 ft 11 ft 12 ft 13 ft<br />
Arroyo Willow Riparian Scrub 37.89 32.02 27.15 24.11 21.80 20.15 19.31 18.82 18.35 17.77 18.36 21.15 24.45 26.07 24.95 21.54 17.03 12.59 11.86 8.44 6.14 4.26 2.88 0.00<br />
Percent change b 348.8% 279.2% 221.5% 185.5% 158.1% 138.7% 128.6% 123.0% 117.3% 110.5% 117.5% 150.5% 189.6% 208.8% 195.5% 155.1% 101.7% 49.1% 40.4% 0.0% -27.3% -49.5% -65.9% -100.0%<br />
Bulrush Wetland 49.12 46.43 31.72 30.60 28.06 21.76 16.28 14.36 12.78 11.78 10.82 10.42 10.58 11.80 14.49 19.23 25.05 28.15 32.57 38.18 44.74 48.97 40.05 26.81<br />
Percent change 28.6% 21.6% -16.9% -19.9% -26.5% -43.0% -57.4% -62.4% -66.5% -69.1% -71.7% -72.7% -72.3% -69.1% -62.1% -49.6% -34.4% -26.3% -14.7% 0.0% 17.2% 28.2% 4.9% -29.8%<br />
Giant Vetch Wetland 0.38 0.33 0.27 0.20 0.17 0.17 0.17 0.17 0.17 0.16 0.20 0.29 0.38 0.43 0.42 0.35 0.25 0.17 0.17 0.16 0.13 0.08 0.05 0.03<br />
Percent change 135.1% 105.5% 65.4% 24.0% 8.8% 6.3% 5.4% 4.5% 3.5% 2.5% 22.3% 80.3% 138.9% 169.1% 162.6% 117.1% 54.3% 3.4% 3.4% 0.0% -20.6% -49.5% -67.5% -84.4%<br />
Knotweed Wetland 9.56 6.15 4.94 4.75 3.41 1.91 1.40 1.38 1.39 1.41 1.43 1.45 1.50 1.97 3.46 5.63 7.02 6.42 6.89 6.13 3.26 1.20 0.52 0.33<br />
Percent change 55.9% 0.3% -19.4% -22.6% -44.4% -68.8% -77.2% -77.6% -77.3% -77.0% -76.7% -76.3% -75.5% -67.9% -43.6% -8.2% 14.5% 4.7% 12.4% 0.0% -46.8% -80.4% -91.5% -94.5%<br />
Rush Meadow 0.49 0.40 0.32 0.24 0.18 0.16 0.15 0.15 0.15 0.16 0.18 0.27 0.38 0.48 0.53 0.50 0.40 0.29 0.31 0.26 0.14 0.13 0.07 0.02<br />
Percent change 90.4% 55.1% 24.4% -6.5% -31.0% -38.5% -40.7% -40.5% -40.3% -40.1% -29.7% 3.2% 48.2% 86.5% 102.7% 91.6% 54.1% 10.4% 20.4% 0.0% -45.2% -50.3% -74.5% -92.7%<br />
Cattail Wetland 0.01 0.01 0.00 0.00 0.00 0.00 0.00 0.00 0.00 0.00 0.00 0.01 0.01 0.01 0.01 0.01 0.01 0.00 0.00 0.00 0.00 0.00 0.00 0.00<br />
Percent change 102.6% 57.3% 7.3% -28.9% -41.3% -40.6% -39.9% -39.1% -38.4% -37.6% -25.6% 26.8% 115.7% 180.4% 178.1% 120.5% 49.8% 0.0% 0.0% 0.0% 0.0% 0.0% -20.0% -45.0%<br />
Sum Herbaceous Wetland 59.54 53.31 37.24 35.79 31.83 24.01 18.01 16.05 14.49 13.51 12.63 12.43 12.85 14.68 18.89 25.70 32.72 35.02 39.94 44.74 48.27 50.38 40.69 27.19<br />
Percent change 33.1% 19.2% -16.8% -20.0% -28.9% -46.3% -59.7% -64.1% -67.6% -69.8% -71.8% -72.2% -71.3% -67.2% -57.8% -42.6% -26.9% -21.7% -10.7% 0.0% 7.9% 12.6% -9.1% -39.2%<br />
Total Wetland (Willow and Herbaceous) 97.44 85.33 64.39 59.90 53.62 44.16 37.31 34.88 32.84 31.29 30.99 33.58 37.31 40.75 43.85 47.24 49.75 47.61 51.80 53.18 54.41 54.64 43.57 27.19<br />
Percent change 83.2% 60.4% 21.1% 12.6% 0.8% -17.0% -29.8% -34.4% -38.3% -41.2% -41.7% -36.9% -29.9% -23.4% -17.6% -11.2% -6.5% -10.5% -2.6% 0.0% 2.3% 2.8% -18.1% -48.9%<br />
Open Water 128.78 149.87 176.77 185.61 196.09 208.97 218.34 223.08 227.45 231.36 235.23 238.76 242.17 245.57 249.14 252.35 256.40 264.86 266.15 266.46 268.62 268.30 281.06 297.43<br />
Percent change -51.7% -43.8% -33.7% -30.3% -26.4% -21.6% -18.1% -16.3% -14.6% -13.2% -11.7% -10.4% -9.1% -7.8% -6.5% -5.3% -3.8% -0.6% -0.1% 0.0% 0.8% 0.7% 5.5% 11.6%<br />
Upland vegetation c 98.03 89.07 83.12 78.79 74.61 71.21 68.70 66.41 64.10 61.76 58.24 52.22 45.19 38.41 31.79 25.22 18.68 12.37 6.89 5.21 3.51 1.90 0.22 0.22<br />
Percent change 1781.6% 1609.6% 1495.5% 1412.2% 1332.0% 1266.8% 1218.7% 1174.7% 1130.3% 1085.5% 1017.8% 902.4% 767.3% 637.3% 510.2% 384.1% 258.5% 137.4% 32.2% 0.0% -32.6% -63.5% -95.8% -95.8%<br />
Developed 1.17 1.17 1.17 1.17 1.17 1.17 1.17 1.17 1.17 1.17 1.17 1.17 1.17 1.17 1.17 1.17 1.17 1.17 1.17 1.17 1.17 1.17 1.17 1.17<br />
Percent change 0.0% 0.0% 0.0% 0.0% 0.0% 0.0% 0.0% 0.0% 0.0% 0.0% 0.0% 0.0% 0.0% 0.0% 0.0% 0.0% 0.0% 0.0% 0.0% 0.0% 0.0% 0.0% 0.0% 0.0%<br />
a Acreages in the table are for vegetation at and below 13 feet City Datum; for most upland vegetation types there is additional acreage above an elevation of 13 feet.<br />
b Percent change is relative to vegetation predicted to occur at 9 feet City Datum<br />
c All upland vegetation types were combined for the analysis of receding lake levels<br />
Values in bold indicate an increase in cover type<br />
Values in italic indicate a decrease in cover type<br />
Mean Annual Water Surface Elevation (City Datum)<br />
C-26
TABLE C-22: PREDICTED VEGETATION CHANGE AND PERCENT CHANGE RELATIVE TO WATER SURFACE ELEVATION 10 FEET CITY DATUM a<br />
Cover Type<br />
Mean Annual Water Surface Elevation (City Datum)<br />
-10 -9 -8 -7 -6 -5 -4 -3 -2 -1 0 1 2 3 4 5 6 ft 7 ft 8 ft 9 ft 10 ft 11 ft 12 ft 13 ft<br />
Arroyo Willow Riparian Scrub 37.89 32.02 27.15 24.11 21.80 20.15 19.31 18.82 18.35 17.77 18.36 21.15 24.45 26.07 24.95 21.54 17.03 12.59 11.86 8.44 6.14 4.26 2.88 0.00<br />
Percent change b 517.1% 421.5% 342.2% 292.6% 255.0% 228.2% 214.4% 206.6% 198.8% 189.5% 199.1% 244.5% 298.3% 324.6% 306.4% 250.8% 177.4% 105.1% 93.1% 37.5% 0.0% -30.6% -53.1% -100.0%<br />
Bulrush Wetland 49.12 46.43 31.72 30.60 28.06 21.76 16.28 14.36 12.78 11.78 10.82 10.42 10.58 11.80 14.49 19.23 25.05 28.15 32.57 38.18 44.74 48.97 40.05 26.81<br />
Percent change 9.8% 3.8% -29.1% -31.6% -37.3% -51.3% -63.6% -67.9% -71.4% -73.7% -75.8% -76.7% -76.3% -73.6% -67.6% -57.0% -44.0% -37.1% -27.2% -14.6% 0.0% 9.5% -10.5% -40.1%<br />
Giant Vetch Wetland 0.38 0.33 0.27 0.20 0.17 0.17 0.17 0.17 0.17 0.16 0.20 0.29 0.38 0.43 0.42 0.35 0.25 0.17 0.17 0.16 0.13 0.08 0.05 0.03<br />
Percent change 196.1% 158.9% 108.3% 56.2% 37.0% 34.0% 32.8% 31.6% 30.4% 29.1% 54.0% 127.1% 201.0% 238.9% 230.8% 173.5% 94.4% 30.3% 30.3% 26.0% 0.0% -36.4% -59.1% -80.3%<br />
Knotweed Wetland 9.56 6.15 4.94 4.75 3.41 1.91 1.40 1.38 1.39 1.41 1.43 1.45 1.50 1.97 3.46 5.63 7.02 6.42 6.89 6.13 3.26 1.20 0.52 0.33<br />
Percent change 193.0% 88.5% 51.5% 45.5% 4.6% -41.3% -57.1% -57.8% -57.3% -56.8% -56.2% -55.5% -54.0% -39.6% 6.0% 72.5% 115.1% 96.8% 111.3% 87.9% 0.0% -63.2% -84.1% -89.7%<br />
Rush Meadow 0.49 0.40 0.32 0.24 0.18 0.16 0.15 0.15 0.15 0.16 0.18 0.27 0.38 0.48 0.53 0.50 0.40 0.29 0.31 0.26 0.14 0.13 0.07 0.02<br />
Percent change 247.6% 183.3% 127.1% 70.8% 26.0% 12.3% 8.3% 8.7% 9.0% 9.3% 28.4% 88.4% 170.6% 240.5% 270.1% 249.8% 181.3% 101.6% 119.9% 82.6% 0.0% -9.3% -53.4% -86.7%<br />
Cattail Wetland 0.01 0.01 0.00 0.00 0.00 0.00 0.00 0.00 0.00 0.00 0.00 0.01 0.01 0.01 0.01 0.01 0.01 0.00 0.00 0.00 0.00 0.00 0.00 0.00<br />
Percent change 102.6% 57.3% 7.3% -28.9% -41.3% -40.6% -39.9% -39.1% -38.4% -37.6% -25.6% 26.8% 115.7% 180.4% 178.1% 120.5% 49.8% 0.0% 0.0% 0.0% 0.0% 0.0% -20.0% -45.0%<br />
Sum Herbaceous Wetland 59.54 53.31 37.24 35.79 31.83 24.01 18.01 16.05 14.49 13.51 12.63 12.43 12.85 14.68 18.89 25.70 32.72 35.02 39.94 44.74 48.27 50.38 40.69 27.19<br />
Percent change 23.4% 10.4% -22.8% -25.9% -34.1% -50.3% -62.7% -66.7% -70.0% -72.0% -73.8% -74.3% -73.4% -69.6% -60.9% -46.8% -32.2% -27.4% -17.3% -7.3% 0.0% 4.4% -15.7% -43.7%<br />
Total Wetland (Willow and Herbaceous) 97.44 85.33 64.39 59.90 53.62 44.16 37.31 34.88 32.84 31.29 30.99 33.58 37.31 40.75 43.85 47.24 49.75 47.61 51.80 53.18 54.41 54.64 43.57 27.19<br />
Percent change 79.1% 56.8% 18.3% 10.1% -1.5% -18.8% -31.4% -35.9% -39.6% -42.5% -43.0% -38.3% -31.4% -25.1% -19.4% -13.2% -8.6% -12.5% -4.8% -2.3% 0.0% 0.4% -19.9% -50.0%<br />
Open Water 128.78 149.87 176.77 185.61 196.09 208.97 218.34 223.08 227.45 231.36 235.23 238.76 242.17 245.57 249.14 252.35 256.40 264.86 266.15 266.46 268.62 268.30 281.06 297.43<br />
Percent change -52.1% -44.2% -34.2% -30.9% -27.0% -22.2% -18.7% -17.0% -15.3% -13.9% -12.4% -11.1% -9.8% -8.6% -7.3% -6.1% -4.6% -1.4% -0.9% -0.8% 0.0% -0.1% 4.6% 10.7%<br />
Upland vegetation c 98.03 89.07 83.12 78.79 74.61 71.21 68.70 66.41 64.10 61.76 58.24 52.22 45.19 38.41 31.79 25.22 18.68 12.37 6.89 5.21 3.51 1.90 0.22 0.22<br />
Percent change 2693.0% 2437.6% 2268.2% 2144.6% 2025.6% 1928.8% 1857.3% 1792.1% 1726.2% 1659.6% 1559.2% 1387.9% 1187.4% 994.4% 805.8% 618.5% 432.2% 252.4% 96.3% 48.4% 0.0% -45.9% -93.7% -93.7%<br />
Developed 1.17 1.17 1.17 1.17 1.17 1.17 1.17 1.17 1.17 1.17 1.17 1.17 1.17 1.17 1.17 1.17 1.17 1.17 1.17 1.17 1.17 1.17 1.17 1.17<br />
Percent change 0.0% 0.0% 0.0% 0.0% 0.0% 0.0% 0.0% 0.0% 0.0% 0.0% 0.0% 0.0% 0.0% 0.0% 0.0% 0.0% 0.0% 0.0% 0.0% 0.0% 0.0% 0.0% 0.0% 0.0%<br />
a Acreages in the table are for vegetation at and below 13 feet City Datum; for most upland vegetation types there is additional acreage above an elevation of 13 feet.<br />
b Percent change is relative to vegetation predicted to occur at 10 feet City Datum<br />
c All upland vegetation types were combined for the analysis of receding lake levels<br />
Values in bold indicate an increase in cover type<br />
Values in italic indicate a decrease in cover type<br />
C-27
TABLE C-23: PREDICTED VEGETATION CHANGE AND PERCENT CHANGE RELATIVE TO WATER SURFACE ELEVATION 11 FEET CITY DATUM a<br />
Cover Type<br />
Mean Annual Water Surface Elevation (City Datum)<br />
-10 -9 -8 -7 -6 -5 -4 -3 -2 -1 0 1 2 3 4 5 6 ft 7 ft 8 ft 9 ft 10 ft 11 ft 12 ft 13 ft<br />
Arroyo Willow Riparian Scrub 37.89 32.02 27.15 24.11 21.80 20.15 19.31 18.82 18.35 17.77 18.36 21.15 24.45 26.07 24.95 21.54 17.03 12.59 11.86 8.44 6.14 4.26 2.88 0.00<br />
Percent change b 788.7% 650.9% 536.7% 465.4% 411.2% 372.6% 352.8% 341.5% 330.3% 316.8% 330.7% 396.1% 473.5% 511.4% 485.2% 405.1% 299.4% 195.3% 178.1% 98.0% 44.0% 0.0% -32.5% -100.0%<br />
Bulrush Wetland 49.12 46.43 31.72 30.60 28.06 21.76 16.28 14.36 12.78 11.78 10.82 10.42 10.58 11.80 14.49 19.23 25.05 28.15 32.57 38.18 44.74 48.97 40.05 26.81<br />
Percent change 0.3% -5.2% -35.2% -37.5% -42.7% -55.6% -66.7% -70.7% -73.9% -75.9% -77.9% -78.7% -78.4% -75.9% -70.4% -60.7% -48.9% -42.5% -33.5% -22.0% -8.6% 0.0% -18.2% -45.3%<br />
Giant Vetch Wetland 0.38 0.33 0.27 0.20 0.17 0.17 0.17 0.17 0.17 0.16 0.20 0.29 0.38 0.43 0.42 0.35 0.25 0.17 0.17 0.16 0.13 0.08 0.05 0.03<br />
Percent change 365.5% 307.0% 227.5% 145.6% 115.4% 110.6% 108.8% 106.9% 104.9% 103.0% 142.2% 257.0% 373.2% 432.8% 420.1% 330.0% 205.6% 104.8% 104.8% 98.0% 57.2% 0.0% -35.6% -69.1%<br />
Knotweed Wetland 9.56 6.15 4.94 4.75 3.41 1.91 1.40 1.38 1.39 1.41 1.43 1.45 1.50 1.97 3.46 5.63 7.02 6.42 6.89 6.13 3.26 1.20 0.52 0.33<br />
Percent change 696.5% 412.5% 311.7% 295.6% 184.2% 59.5% 16.7% 14.7% 16.1% 17.5% 19.0% 20.9% 25.1% 64.2% 188.1% 368.9% 484.8% 435.0% 474.5% 410.9% 171.8% 0.0% -56.6% -72.1%<br />
Rush Meadow 0.49 0.40 0.32 0.24 0.18 0.16 0.15 0.15 0.15 0.16 0.18 0.27 0.38 0.48 0.53 0.50 0.40 0.29 0.31 0.26 0.14 0.13 0.07 0.02<br />
Percent change 283.2% 212.3% 150.4% 88.3% 38.9% 23.8% 19.4% 19.8% 20.2% 20.5% 41.6% 107.7% 198.3% 275.4% 308.0% 285.7% 210.1% 122.3% 142.4% 101.3% 10.2% 0.0% -48.6% -85.3%<br />
Cattail Wetland 0.01 0.01 0.00 0.00 0.00 0.00 0.00 0.00 0.00 0.00 0.00 0.01 0.01 0.01 0.01 0.01 0.01 0.00 0.00 0.00 0.00 0.00 0.00 0.00<br />
Percent change 102.6% 57.3% 7.3% -28.9% -41.3% -40.6% -39.9% -39.1% -38.4% -37.6% -25.6% 26.8% 115.7% 180.4% 178.1% 120.5% 49.8% 0.0% 0.0% 0.0% 0.0% 0.0% -20.0% -45.0%<br />
Sum Herbaceous Wetland 59.54 53.31 37.24 35.79 31.83 24.01 18.01 16.05 14.49 13.51 12.63 12.43 12.85 14.68 18.89 25.70 32.72 35.02 39.94 44.74 48.27 50.38 40.69 27.19<br />
Percent change 18.2% 5.8% -26.1% -29.0% -36.8% -52.3% -64.3% -68.1% -71.2% -73.2% -74.9% -75.3% -74.5% -70.9% -62.5% -49.0% -35.1% -30.5% -20.7% -11.2% -4.2% 0.0% -19.2% -46.0%<br />
Total Wetland (Willow and Herbaceous) 97.44 85.33 64.39 59.90 53.62 44.16 37.31 34.88 32.84 31.29 30.99 33.58 37.31 40.75 43.85 47.24 49.75 47.61 51.80 53.18 54.41 54.64 43.57 27.19<br />
Percent change 78.3% 56.2% 17.8% 9.6% -1.9% -19.2% -31.7% -36.2% -39.9% -42.7% -43.3% -38.5% -31.7% -25.4% -19.8% -13.6% -9.0% -12.9% -5.2% -2.7% -0.4% 0.0% -20.3% -50.2%<br />
Open Water 128.78 149.87 176.77 185.61 196.09 208.97 218.34 223.08 227.45 231.36 235.23 238.76 242.17 245.57 249.14 252.35 256.40 264.86 266.15 266.46 268.62 268.30 281.06 297.43<br />
Percent change -52.0% -44.1% -34.1% -30.8% -26.9% -22.1% -18.6% -16.9% -15.2% -13.8% -12.3% -11.0% -9.7% -8.5% -7.1% -5.9% -4.4% -1.3% -0.8% -0.7% 0.1% 0.0% 4.8% 10.9%<br />
Upland vegetation c 98.03 89.07 83.12 78.79 74.61 71.21 68.70 66.41 64.10 61.76 58.24 52.22 45.19 38.41 31.79 25.22 18.68 12.37 6.89 5.21 3.51 1.90 0.22 0.22<br />
Percent change 5059.6% 4587.8% 4274.9% 4046.7% 3826.7% 3647.9% 3515.9% 3395.3% 3273.7% 3150.6% 2965.1% 2648.6% 2278.3% 1921.7% 1573.3% 1227.4% 883.2% 551.1% 262.6% 174.2% 84.7% 0.0% -88.4% -88.4%<br />
Developed 1.17 1.17 1.17 1.17 1.17 1.17 1.17 1.17 1.17 1.17 1.17 1.17 1.17 1.17 1.17 1.17 1.17 1.17 1.17 1.17 1.17 1.17 1.17 1.17<br />
Percent change 0.0% 0.0% 0.0% 0.0% 0.0% 0.0% 0.0% 0.0% 0.0% 0.0% 0.0% 0.0% 0.0% 0.0% 0.0% 0.0% 0.0% 0.0% 0.0% 0.0% 0.0% 0.0% 0.0% 0.0%<br />
a Acreages in the table are for vegetation at and below 13 feet City Datum; for most upland vegetation types there is additional acreage above an elevation of 13 feet.<br />
b Percent change is relative to vegetation predicted to occur at 11 feet City Datum<br />
c All upland vegetation types were combined for the analysis of receding lake levels<br />
Values in bold indicate an increase in cover type<br />
Values in italic indicate a decrease in cover type<br />
C-28
TABLE C-24: PREDICTED VEGETATION CHANGE AND PERCENT CHANGE RELATIVE TO WATER SURFACE ELEVATION 12 FEET CITY DATUM a<br />
Cover Type<br />
-10 -9 -8 -7 -6 -5 -4 -3 -2 -1 0 1 2 3 4 5 6 ft 7 ft 8 ft 9 ft 10 ft 11 ft 12 ft 13 ft<br />
Arroyo Willow Riparian Scrub 37.89 32.02 27.15 24.11 21.80 20.15 19.31 18.82 18.35 17.77 18.36 21.15 24.45 26.07 24.95 21.54 17.03 12.59 11.86 8.44 6.14 4.26 2.88 0.00<br />
Percent change b 1216.5% 1012.4% 843.2% 737.5% 657.2% 600.1% 570.7% 554.0% 537.4% 517.5% 538.0% 634.9% 749.6% 805.7% 766.9% 648.3% 491.7% 337.4% 311.9% 193.3% 113.3% 48.1% 0.0% -100.0%<br />
Bulrush Wetland 49.12 46.43 31.72 30.60 28.06 21.76 16.28 14.36 12.78 11.78 10.82 10.42 10.58 11.80 14.49 19.23 25.05 28.15 32.57 38.18 44.74 48.97 40.05 26.81<br />
Percent change 22.6% 15.9% -20.8% -23.6% -29.9% -45.7% -59.3% -64.2% -68.1% -70.6% -73.0% -74.0% -73.6% -70.5% -63.8% -52.0% -37.5% -29.7% -18.7% -4.7% 11.7% 22.3% 0.0% -33.1%<br />
Giant Vetch Wetland 0.38 0.33 0.27 0.20 0.17 0.17 0.17 0.17 0.17 0.16 0.20 0.29 0.38 0.43 0.42 0.35 0.25 0.17 0.17 0.16 0.13 0.08 0.05 0.03<br />
Percent change 623.2% 532.4% 408.8% 281.5% 234.7% 227.2% 224.3% 221.4% 218.4% 215.4% 276.2% 454.7% 635.1% 727.8% 708.0% 568.1% 374.7% 218.2% 218.2% 207.7% 144.3% 55.4% 0.0% -51.9%<br />
Knotweed Wetland 9.56 6.15 4.94 4.75 3.41 1.91 1.40 1.38 1.39 1.41 1.43 1.45 1.50 1.97 3.46 5.63 7.02 6.42 6.89 6.13 3.26 1.20 0.52 0.33<br />
Percent change 1737.1% 1082.0% 849.7% 812.5% 555.6% 268.0% 169.3% 164.5% 167.7% 171.0% 174.4% 178.9% 188.5% 278.7% 564.5% 981.5% 1249.0% 1134.0% 1225.1% 1078.4% 527.0% 130.7% 0.0% -35.7%<br />
Rush Meadow 0.49 0.40 0.32 0.24 0.18 0.16 0.15 0.15 0.15 0.16 0.18 0.27 0.38 0.48 0.53 0.50 0.40 0.29 0.31 0.26 0.14 0.13 0.07 0.02<br />
Percent change 645.6% 507.7% 387.2% 266.3% 170.3% 140.8% 132.3% 133.1% 133.8% 134.5% 175.5% 304.0% 480.4% 630.5% 693.9% 650.4% 503.4% 332.5% 371.6% 291.7% 114.5% 94.6% 0.0% -71.5%<br />
Cattail Wetland 0.01 0.01 0.00 0.00 0.00 0.00 0.00 0.00 0.00 0.00 0.00 0.01 0.01 0.01 0.01 0.01 0.01 0.00 0.00 0.00 0.00 0.00 0.00 0.00<br />
Percent change 153.2% 96.6% 34.1% -11.1% -26.7% -25.7% -24.8% -23.9% -23.0% -22.0% -7.0% 58.6% 169.6% 250.4% 247.7% 175.7% 87.3% 25.0% 25.0% 25.0% 25.0% 25.0% 0.0% -31.3%<br />
Sum Herbaceous Wetland 59.54 53.31 37.24 35.79 31.83 24.01 18.01 16.05 14.49 13.51 12.63 12.43 12.85 14.68 18.89 25.70 32.72 35.02 39.94 44.74 48.27 50.38 40.69 27.19<br />
Percent change 46.3% 31.0% -8.5% -12.0% -21.8% -41.0% -55.7% -60.5% -64.4% -66.8% -69.0% -69.5% -68.4% -63.9% -53.6% -36.8% -19.6% -13.9% -1.8% 10.0% 18.6% 23.8% 0.0% -33.2%<br />
Total Wetland (Willow and Herbaceous) 97.44 85.33 64.39 59.90 53.62 44.16 37.31 34.88 32.84 31.29 30.99 33.58 37.31 40.75 43.85 47.24 49.75 47.61 51.80 53.18 54.41 54.64 43.57 27.19<br />
Percent change 123.6% 95.9% 47.8% 37.5% 23.1% 1.4% -14.4% -19.9% -24.6% -28.2% -28.9% -22.9% -14.4% -6.5% 0.6% 8.4% 14.2% 9.3% 18.9% 22.1% 24.9% 25.4% 0.0% -37.6%<br />
Open Water 128.78 149.87 176.77 185.61 196.09 208.97 218.34 223.08 227.45 231.36 235.23 238.76 242.17 245.57 249.14 252.35 256.40 264.86 266.15 266.46 268.62 268.30 281.06 297.43<br />
Percent change -54.2% -46.7% -37.1% -34.0% -30.2% -25.6% -22.3% -20.6% -19.1% -17.7% -16.3% -15.1% -13.8% -12.6% -11.4% -10.2% -8.8% -5.8% -5.3% -5.2% -4.4% -4.5% 0.0% 5.8%<br />
Upland vegetation c 98.03 89.07 83.12 78.79 74.61 71.21 68.70 66.41 64.10 61.76 58.24 52.22 45.19 38.41 31.79 25.22 18.68 12.37 6.89 5.21 3.51 1.90 0.22 0.22<br />
Percent change 44460.5% 40385.8% 37683.3% 35712.3% 33812.5% 32268.2% 31128.1% 30086.9% 29036.9% 27973.7% 26371.2% 23638.2% 20439.8% 17359.9% 14351.1% 11363.7% 8390.9% 5522.7% 3031.8% 2268.2% 1495.5% 763.6% 0.0% 0.0%<br />
Developed 1.17 1.17 1.17 1.17 1.17 1.17 1.17 1.17 1.17 1.17 1.17 1.17 1.17 1.17 1.17 1.17 1.17 1.17 1.17 1.17 1.17 1.17 1.17 1.17<br />
Percent change 0.0% 0.0% 0.0% 0.0% 0.0% 0.0% 0.0% 0.0% 0.0% 0.0% 0.0% 0.0% 0.0% 0.0% 0.0% 0.0% 0.0% 0.0% 0.0% 0.0% 0.0% 0.0% 0.0% 0.0%<br />
a Acreages in the table are for vegetation at and below 13 feet City Datum; for most upland vegetation types there is additional acreage above an elevation of 13 feet.<br />
b Percent change is relative to vegetation predicted to occur at 12 feet City Datum<br />
c All upland vegetation types were combined for the analysis of receding lake levels<br />
Values in bold indicate an increase in cover type<br />
Values in italic indicate a decrease in cover type<br />
Mean Annual Water Surface Elevation (City Datum)<br />
C-29
TABLE C-25: PREDICTED VEGETATION CHANGE AND PERCENT CHANGE RELATIVE TO WATER SURFACE ELEVATION 13 FEET CITY DATUM a<br />
Cover Type<br />
-10 -9 -8 -7 -6 -5 -4 -3 -2 -1 0 1 2 3 4 5 6 ft 7 ft 8 ft 9 ft 10 ft 11 ft 12 ft 13 ft<br />
Arroyo Willow Riparian Scrub 37.89 32.02 27.15 24.11 21.80 20.15 19.31 18.82 18.35 17.77 18.36 21.15 24.45 26.07 24.95 21.54 17.03 12.59 11.86 8.44 6.14 4.26 2.88 0.00<br />
Percent change b All values represent an increase from the value at 13 feet, which is 0. Percent change cannot be calculated.<br />
0.0%<br />
Bulrush Wetland 49.12 46.43 31.72 30.60 28.06 21.76 16.28 14.36 12.78 11.78 10.82 10.42 10.58 11.80 14.49 19.23 25.05 28.15 32.57 38.18 44.74 48.97 40.05 26.81<br />
Percent change 83.2% 73.2% 18.3% 14.2% 4.7% -18.8% -39.3% -46.5% -52.3% -56.0% -59.6% -61.1% -60.5% -56.0% -46.0% -28.3% -6.6% 5.0% 21.5% 42.4% 66.9% 82.6% 49.4% 0.0%<br />
Giant Vetch Wetland 0.38 0.33 0.27 0.20 0.17 0.17 0.17 0.17 0.17 0.16 0.20 0.29 0.38 0.43 0.42 0.35 0.25 0.17 0.17 0.16 0.13 0.08 0.05 0.03<br />
Percent change 1404.0% 1215.2% 958.1% 693.4% 596.1% 580.5% 574.5% 568.4% 562.2% 556.0% 682.4% 1053.5% 1428.8% 1621.5% 1580.4% 1289.4% 887.3% 561.8% 561.8% 539.8% 408.0% 223.1% 108.0% 0.0%<br />
Knotweed Wetland 9.56 6.15 4.94 4.75 3.41 1.91 1.40 1.38 1.39 1.41 1.43 1.45 1.50 1.97 3.46 5.63 7.02 6.42 6.89 6.13 3.26 1.20 0.52 0.33<br />
Percent change 2756.2% 1737.7% 1376.5% 1318.6% 919.3% 472.1% 318.6% 311.2% 316.2% 321.3% 326.7% 333.6% 348.5% 488.8% 933.1% 1581.4% 1997.3% 1818.6% 1960.1% 1732.1% 874.8% 258.6% 55.5% 0.0%<br />
Rush Meadow 0.49 0.40 0.32 0.24 0.18 0.16 0.15 0.15 0.15 0.16 0.18 0.27 0.38 0.48 0.53 0.50 0.40 0.29 0.31 0.26 0.14 0.13 0.07 0.02<br />
Percent change 2511.7% 2028.5% 1606.5% 1183.1% 846.8% 743.4% 713.8% 716.3% 718.8% 721.4% 864.9% 1315.2% 1933.0% 2458.6% 2680.6% 2528.4% 2013.6% 1414.8% 1551.9% 1272.0% 651.3% 581.5% 250.3% 0.0%<br />
Cattail Wetland 0.01 0.01 0.00 0.00 0.00 0.00 0.00 0.00 0.00 0.00 0.00 0.01 0.01 0.01 0.01 0.01 0.01 0.00 0.00 0.00 0.00 0.00 0.00 0.00<br />
Percent change 268.3% 186.0% 95.1% 29.3% 6.7% 8.0% 9.3% 10.7% 12.0% 13.4% 35.2% 130.6% 292.2% 409.7% 405.7% 301.0% 172.4% 81.8% 81.8% 81.8% 81.8% 81.8% 45.5% 0.0%<br />
Sum Herbaceous Wetland 59.54 53.31 37.24 35.79 31.83 24.01 18.01 16.05 14.49 13.51 12.63 12.43 12.85 14.68 18.89 25.70 32.72 35.02 39.94 44.74 48.27 50.38 40.69 27.19<br />
Percent change 119.0% 96.1% 37.0% 31.6% 17.0% -11.7% -33.8% -41.0% -46.7% -50.3% -53.6% -54.3% -52.7% -46.0% -30.5% -5.5% 20.3% 28.8% 46.9% 64.5% 77.5% 85.3% 49.6% 0.0%<br />
Total Wetland (Willow and Herbaceous) 97.44 85.33 64.39 59.90 53.62 44.16 37.31 34.88 32.84 31.29 30.99 33.58 37.31 40.75 43.85 47.24 49.75 47.61 51.80 53.18 54.41 54.64 43.57 27.19<br />
Percent change 258.4% 213.8% 136.8% 120.3% 97.2% 62.4% 37.2% 28.3% 20.8% 15.1% 14.0% 23.5% 37.2% 49.9% 61.3% 73.7% 83.0% 75.1% 90.5% 95.6% 100.1% 101.0% 60.2% 0.0%<br />
Open Water 128.78 149.87 176.77 185.61 196.09 208.97 218.34 223.08 227.45 231.36 235.23 238.76 242.17 245.57 249.14 252.35 256.40 264.86 266.15 266.46 268.62 268.30 281.06 297.43<br />
Percent change -56.7% -49.6% -40.6% -37.6% -34.1% -29.7% -26.6% -25.0% -23.5% -22.2% -20.9% -19.7% -18.6% -17.4% -16.2% -15.2% -13.8% -11.0% -10.5% -10.4% -9.7% -9.8% -5.5% 0.0%<br />
Upland vegetation c 98.03 89.07 83.12 78.79 74.61 71.21 68.70 66.41 64.10 61.76 58.24 52.22 45.19 38.41 31.79 25.22 18.68 12.37 6.89 5.21 3.51 1.90 0.22 0.22<br />
Percent change 44460.5% 40385.8% 37683.3% 35712.3% 33812.5% 32268.2% 31128.1% 30086.9% 29036.9% 27973.7% 26371.2% 23638.2% 20439.8% 17359.9% 14351.1% 11363.7% 8390.9% 5522.7% 3031.8% 2268.2% 1495.5% 763.6% 0.0% 0.0%<br />
Developed 1.17 1.17 1.17 1.17 1.17 1.17 1.17 1.17 1.17 1.17 1.17 1.17 1.17 1.17 1.17 1.17 1.17 1.17 1.17 1.17 1.17 1.17 1.17 1.17<br />
Percent change 0.0% 0.0% 0.0% 0.0% 0.0% 0.0% 0.0% 0.0% 0.0% 0.0% 0.0% 0.0% 0.0% 0.0% 0.0% 0.0% 0.0% 0.0% 0.0% 0.0% 0.0% 0.0% 0.0% 0.0%<br />
a Acreages in the table are for vegetation at and below 13 feet City Datum; for most upland vegetation types there is additional acreage above an elevation of 13 feet.<br />
b<br />
Percent change is relative to vegetation predicted to occur at 13 feet City Datum<br />
c All upland vegetation types were combined for the analysis of receding lake levels<br />
Values in bold indicate an increase in cover type<br />
Values in italic indicate a decrease in cover type<br />
Mean Annual Water Surface Elevation (City Datum)<br />
C-30
APPENDIX D<br />
Hydrology and Water Quality<br />
Supporting Material<br />
This appendix includes historic water level and water quality information, as well as information<br />
from technical reports prepared for the <strong>San</strong> <strong>Francisco</strong> Groundwater Supply Project to support the<br />
analysis of impacts related to Hydrology and Water Quality (Section 5.16).<br />
Appendix D-1, Historic Groundwater Levels, includes hydrographs of historic groundwater<br />
levels measures in wells in the North Westside Groundwater Basin taken from the <strong>San</strong> <strong>Francisco</strong><br />
Public Utilities Commission, Final- 2011 Annual Groundwater Monitoring Report, Westside<br />
Basin, <strong>San</strong> <strong>Francisco</strong> and <strong>San</strong> Mateo Counties, California. September, 2012.<br />
Appendix D-2, Groundwater Quality Data, includes a tabulation of historic groundwater<br />
quality data for wells in the North Westside Groundwater Basin taken from the <strong>San</strong> <strong>Francisco</strong><br />
Public Utilities Commission, Final- 2011 Annual Groundwater Monitoring Report, Westside<br />
Basin, <strong>San</strong> <strong>Francisco</strong> and <strong>San</strong> Mateo Counties, California. September, 2012.<br />
Appendix D-3, Lake Merced Water Quality Data, includes a tabulation of historic Lake<br />
Merced water quality data.<br />
Appendix D-4, Lake Merced Water Quality Graphs, includes graphs of Lake Merced water<br />
quality at various lake levels over time, prepared by ESA for this environmental impact report.<br />
Appendix D-5, Task 10.1 Technical Memorandum, Groundwater Modeling Analysis for the<br />
Regional Groundwater Storage and Recovery Project and <strong>San</strong> <strong>Francisco</strong> Groundwater<br />
Supply Project.. This appendix consists of the Kennedy/Jenks Consultants, Task 10.1 Technical<br />
Memorandum, Groundwater Modeling Analysis for the Regional Groundwater Storage and<br />
Recovery Project and <strong>San</strong> <strong>Francisco</strong> Groundwater Supply Project. The hydrographs referenced<br />
in Section 5.16, Hydrology and Water Quality, are the hydrographs showing simulated<br />
groundwater levels by model layer, included in Attachment 10.1-B. These hydrographs show<br />
groundwater levels predicted by the Westside Basin Groundwater Model at representative<br />
locations under the Modeled Existing Conditions, Regional Groundwater Storage and Recovery<br />
Project, <strong>San</strong> <strong>Francisco</strong> Groundwater Supply Project, and cumulative conditions.<br />
Appendix D-6, Task 10.3 Technical Memorandum, Assessment of Potential Seawater<br />
Intrusion for the Regional Groundwater Storage and Recovery Project and the <strong>San</strong><br />
<strong>Francisco</strong> Groundwater Supply Project. This appendix consists of the Kennedy/Jenks<br />
SFPUC <strong>San</strong> <strong>Francisco</strong> Groundwater Supply Project Draft EIR D‐1 March 2013<br />
Case No. 2008.1122E
Appendix D<br />
Hydrology and Water Quality Supporting Material<br />
Consultants, Task 10.3 Technical Memorandum, Assessment of Potential Seawater Intrusion for<br />
the Regional Groundwater Storage and Recovery Project and the <strong>San</strong> <strong>Francisco</strong> Groundwater<br />
Supply Project. The hydrographs referenced in Section 5.16, Hydrology and Water Quality, are<br />
Figures 10.3-4 through 10.3-12c. These hydrographs show groundwater levels predicted by the<br />
Westside Basin Groundwater Model at locations used in the analysis of the potential for seawater<br />
intrusion. Groundwater levels at wells in the North Westside Groundwater Basin under the<br />
Modeled Existing Conditions, Regional Groundwater Storage and Recovery Project, <strong>San</strong><br />
<strong>Francisco</strong> Groundwater Supply Project, and cumulative conditions are included.<br />
Appendix D-7, Task 10.2 Technical Memorandum, Assessment of Groundwater-Surface<br />
Water Interactions for the Regional Groundwater Storage and Recovery Project and the<br />
<strong>San</strong> <strong>Francisco</strong> Groundwater Supply Project., This appendix consists of the Kennedy/Jenks<br />
Consultants, Task 10.2 Technical Memorandum, Assessment of Groundwater-Surface Water<br />
Interactions for the Regional Groundwater Storage and Recovery Project and the <strong>San</strong> <strong>Francisco</strong><br />
Groundwater Supply Project. The hydrographs referenced in Section 5.16, Hydrology and Water<br />
Quality, are Figures 10.2-11a through 10.2-14b. These hydrographs show groundwater levels<br />
predicted by the Westside Basin Groundwater Model at locations used in the analysis of the<br />
potential effects on Lake Merced water levels. Groundwater levels at wells in the North Westside<br />
Groundwater Basin under the Modeled Existing Conditions, Regional Groundwater Storage and<br />
Recovery Project, <strong>San</strong> <strong>Francisco</strong> Groundwater Supply Project, and cumulative conditions are<br />
included.<br />
In appendices D-5, D-6, and D-7, the modeling scenarios are keyed to each project as follows:<br />
Scenario 1 = Modeled Existing Conditions<br />
Scenario 2 = Regional Groundwater Storage and Recovery Project<br />
Scenario 3a = <strong>San</strong> <strong>Francisco</strong> Groundwater Supply Project, Phase 1<br />
Scenario 3b = <strong>San</strong> <strong>Francisco</strong> Groundwater Supply Project, Phase 2<br />
Scenario 4 = Cumulative conditions<br />
Model layers used in the titles correspond to specific aquifers in the Westside Groundwater<br />
Basin. Model Layer 1 corresponds to the Shallow Aquifer, Model Layer 4 corresponds to the<br />
Primary Production Aquifer, and Model Layer 5 corresponds to the Deep Aquifer.<br />
SFPUC <strong>San</strong> <strong>Francisco</strong> Groundwater Supply Project Draft EIR D‐2 March 2013<br />
Case No. 2008.1122E
Appendix D<br />
Hydrology and Water Quality Supporting Material<br />
APPENDIX D‐1<br />
Historic Groundwater Levels<br />
SFPUC <strong>San</strong> <strong>Francisco</strong> Groundwater Supply Project Draft EIR D.1‐1 March 2013<br />
Case No. 2008.1122E
Appendix D<br />
Hydrology and Water Quality Supporting Material<br />
This page intentionally left blank<br />
SFPUC <strong>San</strong> <strong>Francisco</strong> Groundwater Supply Project Draft EIR D.1‐2 March 2013<br />
Case No. 2008.1122E
Figure 6a Kirkham 130<br />
Level 1 is equal to Monitoring Wells<br />
Level 2 is equal to North Westside Basin<br />
Level 3 is in list "KIRKHAM MW130"<br />
16<br />
15<br />
14<br />
13<br />
Groundwater Elevation and Chloride Concentration Hydrograph<br />
Chloride (mg/l)<br />
Groundw ater Elevation (Feet, NAVD88)<br />
40<br />
38<br />
36<br />
34<br />
32<br />
12<br />
30<br />
D.1-3<br />
Groundwater Elevation (Feet, NAVD88)<br />
11<br />
10<br />
9<br />
8<br />
7<br />
6<br />
5<br />
28<br />
26<br />
24<br />
22<br />
20<br />
18<br />
16<br />
14<br />
12<br />
Chloride (mg/l)<br />
4<br />
3<br />
2<br />
1<br />
10<br />
8<br />
6<br />
4<br />
2<br />
0<br />
12/4/2004<br />
12/4/2005<br />
12/4/2006<br />
12/4/2007<br />
Date<br />
12/3/2008<br />
12/3/2009<br />
12/3/2010<br />
0<br />
12/3/2011<br />
2/28/2012 3:32:49 PM Seveno DataSight Page 1 of 1
Figure 6b Kirkham 255<br />
Level 1 is equal to Monitoring Wells<br />
Level 2 is equal to North Westside Basin<br />
Level 3 is equal to KIRKHAM MW255<br />
16<br />
15<br />
Groundwater Elevation and Chloride Concentration Hydrograph<br />
Groundw ater Elevation (Feet, NAVD88)<br />
Chloride (mg/l)<br />
44<br />
42<br />
14<br />
13<br />
40<br />
38<br />
36<br />
12<br />
34<br />
D.1-4<br />
Groundwater Elevation (Feet, NAVD88)<br />
11<br />
10<br />
9<br />
8<br />
7<br />
6<br />
5<br />
32<br />
30<br />
28<br />
26<br />
24<br />
22<br />
20<br />
18<br />
16<br />
14<br />
Chloride (mg/l)<br />
4<br />
3<br />
12<br />
10<br />
8<br />
2<br />
6<br />
1<br />
4<br />
2<br />
0<br />
12/4/2004<br />
12/4/2005<br />
12/4/2006<br />
12/4/2007<br />
Date<br />
12/3/2008<br />
12/3/2009<br />
12/3/2010<br />
0<br />
12/3/2011<br />
2/28/2012 3:33:22 PM Seveno DataSight Page 1 of 1
Figure 6c Kirkham 385<br />
Level 1 is equal to Monitoring Wells<br />
Level 2 is equal to North Westside Basin<br />
Level 3 is in list "KIRKHAM MW385"<br />
16<br />
15<br />
Groundwater Elevation and Chloride Concentration Hydrograph<br />
Chloride (mg/l) 44<br />
Groundw ater Elevation (Feet, NAVD88)<br />
42<br />
14<br />
13<br />
40<br />
38<br />
36<br />
12<br />
34<br />
D.1-5<br />
Groundwater Elevation (Feet, NAVD88)<br />
11<br />
10<br />
9<br />
8<br />
7<br />
6<br />
5<br />
32<br />
30<br />
28<br />
26<br />
24<br />
22<br />
20<br />
18<br />
16<br />
14<br />
Chloride (mg/l)<br />
4<br />
3<br />
12<br />
10<br />
8<br />
2<br />
6<br />
1<br />
4<br />
2<br />
0<br />
12/4/2004<br />
12/4/2005<br />
12/4/2006<br />
12/4/2007<br />
Date<br />
12/3/2008<br />
12/3/2009<br />
12/3/2010<br />
0<br />
12/3/2011<br />
9/14/2012 10:57:41 AM Seveno DataSight Page 1 of 1
Figure 6d Kirkham 435<br />
Level 1 is equal to Monitoring Wells<br />
Level 2 is equal to North Westside Basin<br />
Level 3 is in list "KIRKHAM MW435"<br />
16<br />
15<br />
Groundwater Elevation and Chloride Concentration Hydrograph<br />
Chloride (mg/l)<br />
Groundw ater Elevation (Feet, NAVD88)<br />
40<br />
38<br />
14<br />
13<br />
12<br />
36<br />
34<br />
32<br />
30<br />
D.1-6<br />
Groundwater Elevation (Feet, NAVD88)<br />
11<br />
10<br />
9<br />
8<br />
7<br />
6<br />
5<br />
4<br />
28<br />
26<br />
24<br />
22<br />
20<br />
18<br />
16<br />
14<br />
12<br />
Chloride (mg/l)<br />
3<br />
10<br />
2<br />
1<br />
8<br />
6<br />
4<br />
0<br />
2<br />
-1<br />
12/4/2004<br />
12/4/2005<br />
12/4/2006<br />
12/4/2007<br />
Date<br />
12/3/2008<br />
12/3/2009<br />
12/3/2010<br />
0<br />
12/3/2011<br />
2/28/2012 3:36:00 PM Seveno DataSight Page 1 of 1
Figure 7a Ortega 125<br />
Level 1 is equal to Monitoring Wells<br />
Level 2 is equal to North Westside Basin<br />
Level 3 is in list "ORTEGA MW120"<br />
16<br />
15<br />
Groundwater Elevation and Chloride Concentration Hydrograph<br />
Chloride (mg/l)<br />
Groundw ater Elevation (Feet, NAVD88)<br />
40<br />
38<br />
14<br />
13<br />
12<br />
36<br />
34<br />
32<br />
30<br />
D.1-7<br />
Groundwater Elevation (Feet, NAVD88)<br />
11<br />
10<br />
9<br />
8<br />
7<br />
6<br />
5<br />
4<br />
28<br />
26<br />
24<br />
22<br />
20<br />
18<br />
16<br />
14<br />
12<br />
Chloride (mg/l)<br />
3<br />
10<br />
2<br />
1<br />
8<br />
6<br />
4<br />
0<br />
2<br />
-1<br />
12/4/2004<br />
12/4/2005<br />
12/4/2006<br />
12/4/2007<br />
Date<br />
12/3/2008<br />
12/3/2009<br />
12/3/2010<br />
0<br />
12/3/2011<br />
2/28/2012 3:36:48 PM Seveno DataSight Page 1 of 1
Figure 7b Ortega 265<br />
Level 1 is equal to Monitoring Wells<br />
Level 2 is equal to North Westside Basin<br />
Level 3 is in list "ORTEGA MW265"<br />
16<br />
15<br />
Groundwater Elevation and Chloride Concentration Hydrograph<br />
Chloride (mg/l)<br />
Groundw ater Elevation (Feet, NAVD88)<br />
40<br />
38<br />
14<br />
13<br />
12<br />
36<br />
34<br />
32<br />
30<br />
D.1-8<br />
Groundwater Elevation (Feet, NAVD88)<br />
11<br />
10<br />
9<br />
8<br />
7<br />
6<br />
5<br />
4<br />
28<br />
26<br />
24<br />
22<br />
20<br />
18<br />
16<br />
14<br />
12<br />
Chloride (mg/l)<br />
3<br />
10<br />
2<br />
1<br />
8<br />
6<br />
4<br />
0<br />
2<br />
-1<br />
12/4/2004<br />
12/4/2005<br />
12/4/2006<br />
12/4/2007<br />
Date<br />
12/3/2008<br />
12/3/2009<br />
12/3/2010<br />
0<br />
12/3/2011<br />
2/28/2012 3:37:41 PM Seveno DataSight Page 1 of 1
Figure 7c Ortega 400<br />
Level 1 is equal to Monitoring Wells<br />
Level 2 is equal to North Westside Basin<br />
Level 3 is in list "ORTEGA MW400"<br />
16<br />
15<br />
Groundwater Elevation and Chloride Concentration Hydrograph<br />
Chloride (mg/l)<br />
Groundw ater Elevation (Feet, NAVD88)<br />
40<br />
38<br />
14<br />
13<br />
12<br />
36<br />
34<br />
32<br />
30<br />
D.1-9<br />
Groundwater Elevation (Feet, NAVD88)<br />
11<br />
10<br />
9<br />
8<br />
7<br />
6<br />
5<br />
4<br />
28<br />
26<br />
24<br />
22<br />
20<br />
18<br />
16<br />
14<br />
12<br />
Chloride (mg/l)<br />
3<br />
10<br />
2<br />
1<br />
8<br />
6<br />
4<br />
0<br />
2<br />
-1<br />
12/4/2004<br />
12/4/2005<br />
12/4/2006<br />
12/4/2007<br />
Date<br />
12/3/2008<br />
12/3/2009<br />
12/3/2010<br />
0<br />
12/3/2011<br />
2/28/2012 3:38:30 PM Seveno DataSight Page 1 of 1
Figure 7d Ortega 475<br />
Level 1 is equal to Monitoring Wells<br />
Level 2 is equal to North Westside Basin<br />
Level 3 is in list "ORTEGA MW475"<br />
D.1-10<br />
Groundwater Elevation (Feet, NAVD88)<br />
16<br />
15<br />
14<br />
13<br />
12<br />
11<br />
10<br />
9<br />
8<br />
7<br />
6<br />
5<br />
4<br />
3<br />
2<br />
1<br />
0<br />
-1<br />
-2<br />
-3<br />
-4<br />
-5<br />
12/4/2004<br />
12/4/2005<br />
Groundwater Elevation and Chloride Concentration Hydrograph<br />
12/4/2006<br />
12/4/2007<br />
Date<br />
12/3/2008<br />
12/3/2009<br />
Chloride (mg/l)<br />
Groundw ater Elevation (Feet, NAVD88)<br />
12/3/2010<br />
40<br />
38<br />
36<br />
34<br />
32<br />
30<br />
28<br />
26<br />
24<br />
22<br />
20<br />
18<br />
16<br />
14<br />
12<br />
10<br />
8<br />
6<br />
4<br />
2<br />
0<br />
12/3/2011<br />
Chloride (mg/l)<br />
2/28/2012 3:38:53 PM Seveno DataSight Page 1 of 1
Figure 8a Taraval 145<br />
Level 1 is equal to Monitoring Wells<br />
Level 2 is equal to North Westside Basin<br />
Level 3 is in list "TARAVAL MW145"<br />
D.1-11<br />
Groundwater Elevation (Feet, NAVD88)<br />
16<br />
15<br />
14<br />
13<br />
12<br />
11<br />
10<br />
9<br />
8<br />
7<br />
6<br />
5<br />
4<br />
3<br />
2<br />
1<br />
0<br />
12/4/2004<br />
12/4/2005<br />
Groundwater Elevation and Chloride Concentration Hydrograph<br />
12/4/2006<br />
12/4/2007<br />
Date<br />
12/3/2008<br />
12/3/2009<br />
Chloride (mg/l)<br />
Groundw ater Elevation (Feet, NAVD88)<br />
12/3/2010<br />
44<br />
42<br />
40<br />
38<br />
36<br />
34<br />
32<br />
30<br />
28<br />
26<br />
24<br />
22<br />
20<br />
18<br />
16<br />
14<br />
12<br />
10<br />
8<br />
6<br />
4<br />
2<br />
0<br />
12/3/2011<br />
Chloride (mg/l)<br />
2/28/2012 3:41:09 PM Seveno DataSight Page 1 of 1
Figure 8b Taraval 240<br />
Level 1 is equal to Monitoring Wells<br />
Level 2 is equal to North Westside Basin<br />
Level 3 is in list "TARAVAL MW240"<br />
D.1-12<br />
Groundwater Elevation (Feet, NAVD88)<br />
16<br />
15<br />
14<br />
13<br />
12<br />
11<br />
10<br />
9<br />
8<br />
7<br />
6<br />
5<br />
4<br />
3<br />
2<br />
1<br />
0<br />
12/4/2004<br />
12/4/2005<br />
Groundwater Elevation and Chloride Concentration Hydrograph<br />
12/4/2006<br />
12/4/2007<br />
Date<br />
12/3/2008<br />
12/3/2009<br />
Chloride (mg/l)<br />
Groundw ater Elevation (Feet, NAVD88)<br />
12/3/2010<br />
44<br />
42<br />
40<br />
38<br />
36<br />
34<br />
32<br />
30<br />
28<br />
26<br />
24<br />
22<br />
20<br />
18<br />
16<br />
14<br />
12<br />
10<br />
8<br />
6<br />
4<br />
2<br />
0<br />
12/3/2011<br />
Chloride (mg/l)<br />
2/28/2012 3:40:21 PM Seveno DataSight Page 1 of 1
Figure 8c Taraval 400<br />
Level 1 is equal to Monitoring Wells<br />
Level 2 is equal to North Westside Basin<br />
Level 3 is in list "TARAVAL MW400"<br />
16<br />
15<br />
14<br />
13<br />
Groundwater Elevation and Chloride Concentration Hydrograph<br />
Chloride (mg/l)<br />
Groundw ater Elevation (Feet, NAVD88)<br />
40<br />
38<br />
36<br />
34<br />
32<br />
12<br />
30<br />
D.1-13<br />
Groundwater Elevation (Feet, NAVD88)<br />
11<br />
10<br />
9<br />
8<br />
7<br />
6<br />
5<br />
28<br />
26<br />
24<br />
22<br />
20<br />
18<br />
16<br />
14<br />
12<br />
Chloride (mg/l)<br />
4<br />
3<br />
2<br />
1<br />
10<br />
8<br />
6<br />
4<br />
2<br />
0<br />
12/4/2004<br />
12/4/2005<br />
12/4/2006<br />
12/4/2007<br />
Date<br />
12/3/2008<br />
12/3/2009<br />
12/3/2010<br />
0<br />
12/3/2011<br />
2/28/2012 3:41:46 PM Seveno DataSight Page 1 of 1
Figure 8d Taraval 530<br />
Level 1 is equal to Monitoring Wells<br />
Level 2 is equal to North Westside Basin<br />
Level 3 is in list "TARAVAL MW530"<br />
16<br />
15<br />
14<br />
13<br />
12<br />
Groundwater Elevation and Chloride Concentration Hydrograph<br />
Chloride (mg/l)<br />
Groundw ater Elevation (Feet, NAVD88)<br />
40<br />
38<br />
36<br />
34<br />
D.1-14<br />
Groundwater Elevation (Feet, NAVD88)<br />
11<br />
10<br />
9<br />
8<br />
7<br />
6<br />
5<br />
4<br />
3<br />
2<br />
1<br />
0<br />
-1<br />
-2<br />
-3<br />
-4<br />
-5<br />
32<br />
30<br />
28<br />
26<br />
24<br />
22<br />
20<br />
18<br />
16<br />
14<br />
12<br />
10<br />
8<br />
Chloride (mg/l)<br />
-6<br />
-7<br />
-8<br />
-9<br />
6<br />
4<br />
2<br />
12/4/2004<br />
12/4/2005<br />
12/4/2006<br />
12/4/2007<br />
Date<br />
12/3/2008<br />
12/3/2009<br />
12/3/2010<br />
0<br />
12/3/2011<br />
2/28/2012 3:42:51 PM Seveno DataSight Page 1 of 1
Figure 9a Zoo 275<br />
Level 1 is equal to Monitoring Wells<br />
Level 2 is equal to North Westside Basin<br />
Level 3 is in list "ZOO MW275"<br />
16<br />
15<br />
Groundwater Elevation and Chloride Concentration Hydrograph<br />
Chloride (mg/l)<br />
Groundw ater Elevation (Feet, NAVD88)<br />
80<br />
75<br />
14<br />
70<br />
13<br />
65<br />
12<br />
60<br />
D.1-15<br />
Groundwater Elevation (Feet, NAVD88)<br />
11<br />
10<br />
9<br />
8<br />
7<br />
6<br />
5<br />
55<br />
50<br />
45<br />
40<br />
35<br />
30<br />
25<br />
Chloride (mg/l)<br />
4<br />
3<br />
2<br />
1<br />
20<br />
15<br />
10<br />
5<br />
0<br />
12/4/2004<br />
12/4/2005<br />
12/4/2006<br />
12/4/2007<br />
Date<br />
12/3/2008<br />
12/3/2009<br />
12/3/2010<br />
0<br />
12/3/2011<br />
2/28/2012 3:43:26 PM Seveno DataSight Page 1 of 1
Figure 9b Zoo 450<br />
Level 1 is equal to Monitoring Wells<br />
Level 2 is equal to North Westside Basin<br />
Level 3 is in list "ZOO MW450"<br />
16<br />
15<br />
14<br />
13<br />
12<br />
Groundwater Elevation and Chloride Concentration Hydrograph<br />
Chloride (mg/l)<br />
Groundw ater Elevation (Feet, NAVD88)<br />
70<br />
65<br />
60<br />
11<br />
10<br />
55<br />
D.1-16<br />
Groundwater Elevation (Feet, NAVD88)<br />
9<br />
8<br />
7<br />
6<br />
5<br />
4<br />
3<br />
2<br />
1<br />
0<br />
-1<br />
-2<br />
-3<br />
50<br />
45<br />
40<br />
35<br />
30<br />
25<br />
20<br />
Chloride (mg/l)<br />
-4<br />
-5<br />
15<br />
-6<br />
-7<br />
-8<br />
-9<br />
10<br />
5<br />
12/5/2002<br />
12/5/2003<br />
12/4/2004<br />
12/4/2005<br />
12/4/2006<br />
Date<br />
12/4/2007<br />
12/3/2008<br />
12/3/2009<br />
12/3/2010<br />
0<br />
12/3/2011<br />
2/28/2012 3:44:16 PM Seveno DataSight Page 1 of 1
Figure 9c Zoo 565<br />
Level 1 is equal to Monitoring Wells<br />
Level 2 is equal to North Westside Basin<br />
Level 3 is in list "ZOO MW565"<br />
16<br />
14<br />
Groundwater Elevation and Chloride Concentration Hydrograph<br />
Chloride (mg/l)<br />
Groundw ater Elevation (Feet, NAVD88)<br />
70<br />
65<br />
12<br />
60<br />
D.1-17<br />
Groundwater Elevation (Feet, NAVD88)<br />
10<br />
8<br />
6<br />
4<br />
2<br />
0<br />
-2<br />
-4<br />
-6<br />
-8<br />
-10<br />
55<br />
50<br />
45<br />
40<br />
35<br />
30<br />
25<br />
20<br />
15<br />
Chloride (mg/l)<br />
-12<br />
10<br />
-14<br />
5<br />
12/5/2003<br />
12/4/2004<br />
12/4/2005<br />
12/4/2006<br />
12/4/2007<br />
Date<br />
12/3/2008<br />
12/3/2009<br />
12/3/2010<br />
0<br />
12/3/2011<br />
2/28/2012 3:44:48 PM Seveno DataSight Page 1 of 1
Station Name<br />
South Windmill 140<br />
30<br />
Groundwater Hydrograph<br />
25<br />
20<br />
Groundwater Elevation (Feet, NAVD88)<br />
15<br />
10<br />
5<br />
0<br />
-5<br />
-10<br />
-15<br />
-20<br />
-25<br />
-30<br />
12/5/2002<br />
12/5/2003<br />
12/4/2004<br />
12/4/2005<br />
12/4/2006<br />
Date<br />
12/4/2007<br />
12/3/2008<br />
12/3/2009<br />
12/3/2010<br />
12/3/2011<br />
Station Name<br />
South Windmill 57<br />
30<br />
Groundwater Hydrograph<br />
25<br />
20<br />
Groundwater Elevation (Feet, NAVD88)<br />
15<br />
10<br />
5<br />
0<br />
-5<br />
-10<br />
-15<br />
-20<br />
-25<br />
-30<br />
12/5/2002<br />
12/5/2003<br />
12/4/2004<br />
12/4/2005<br />
12/4/2006<br />
Date<br />
12/4/2007<br />
12/3/2008<br />
12/3/2009<br />
12/3/2010<br />
12/3/2011<br />
D.1-18
Station Name<br />
CENTRAL PUMP 190<br />
Groundwater Elevation (Feet, NAVD88)<br />
90<br />
85<br />
80<br />
75<br />
70<br />
65<br />
60<br />
55<br />
50<br />
45<br />
40<br />
35<br />
30<br />
25<br />
20<br />
15<br />
10<br />
5<br />
0<br />
-5<br />
-10<br />
-15<br />
Groundwater Hydrograph<br />
8/19/2006<br />
2/17/2007<br />
8/18/2007<br />
2/16/2008<br />
8/16/2008<br />
2/14/2009<br />
Date<br />
8/15/2009<br />
2/13/2010<br />
8/14/2010<br />
2/12/2011<br />
8/13/2011<br />
Station Name<br />
CENTRAL PUMP 270<br />
Groundwater Elevation (Feet, NAVD88)<br />
90<br />
85<br />
80<br />
75<br />
70<br />
65<br />
60<br />
55<br />
50<br />
45<br />
40<br />
35<br />
30<br />
25<br />
20<br />
15<br />
10<br />
5<br />
0<br />
-5<br />
-10<br />
-15<br />
Groundwater Hydrograph<br />
8/19/2006<br />
2/17/2007<br />
8/18/2007<br />
2/16/2008<br />
8/16/2008<br />
2/14/2009<br />
Date<br />
8/15/2009<br />
2/13/2010<br />
8/14/2010<br />
2/12/2011<br />
8/13/2011<br />
D.1-19
Station Name<br />
LMMW-1D<br />
30<br />
Groundwater Hydrograph<br />
25<br />
20<br />
Groundwater Elevation (Feet, NAVD88)<br />
15<br />
10<br />
5<br />
0<br />
-5<br />
-10<br />
-15<br />
-20<br />
-25<br />
-30<br />
12/5/2002<br />
12/5/2003<br />
12/4/2004<br />
12/4/2005<br />
12/4/2006<br />
Date<br />
12/4/2007<br />
12/3/2008<br />
12/3/2009<br />
12/3/2010<br />
12/3/2011<br />
Station Name<br />
LMMW-1S<br />
30<br />
Groundwater Hydrograph<br />
25<br />
20<br />
Groundwater Elevation (Feet, NAVD88)<br />
15<br />
10<br />
5<br />
0<br />
-5<br />
-10<br />
-15<br />
-20<br />
-25<br />
-30<br />
12/5/2002<br />
12/5/2003<br />
12/4/2004<br />
12/4/2005<br />
12/4/2006<br />
Date<br />
12/4/2007<br />
12/3/2008<br />
12/3/2009<br />
12/3/2010<br />
12/3/2011<br />
D.1-20
Station Name<br />
LMMW-2D<br />
30<br />
Groundwater Hydrograph<br />
25<br />
20<br />
Groundwater Elevation (Feet, NAVD88)<br />
15<br />
10<br />
5<br />
0<br />
-5<br />
-10<br />
-15<br />
-20<br />
-25<br />
-30<br />
12/5/2002<br />
12/5/2003<br />
12/4/2004<br />
12/4/2005<br />
12/4/2006<br />
Date<br />
12/4/2007<br />
12/3/2008<br />
12/3/2009<br />
12/3/2010<br />
12/3/2011<br />
Station Name<br />
LMMW-2S<br />
30<br />
Groundwater Hydrograph<br />
25<br />
20<br />
Groundwater Elevation (Feet, NAVD88)<br />
15<br />
10<br />
5<br />
0<br />
-5<br />
-10<br />
-15<br />
-20<br />
-25<br />
-30<br />
12/5/2002<br />
12/5/2003<br />
12/4/2004<br />
12/4/2005<br />
12/4/2006<br />
Date<br />
12/4/2007<br />
12/3/2008<br />
12/3/2009<br />
12/3/2010<br />
D.1-21
Station Name<br />
LMMW-2SS<br />
30<br />
Groundwater Hydrograph<br />
25<br />
20<br />
Groundwater Elevation (Feet, NAVD88)<br />
15<br />
10<br />
5<br />
0<br />
-5<br />
-10<br />
-15<br />
-20<br />
-25<br />
-30<br />
12/5/2003<br />
12/4/2004<br />
12/4/2005<br />
12/4/2006<br />
12/4/2007<br />
Date<br />
12/3/2008<br />
12/3/2009<br />
12/3/2010<br />
Station Name<br />
LMMW-3D<br />
30<br />
Groundwater Hydrograph<br />
25<br />
20<br />
Groundwater Elevation (Feet, NAVD88)<br />
15<br />
10<br />
5<br />
0<br />
-5<br />
-10<br />
-15<br />
-20<br />
-25<br />
-30<br />
12/5/2002<br />
12/5/2003<br />
12/4/2004<br />
12/4/2005<br />
12/4/2006<br />
Date<br />
12/4/2007<br />
12/3/2008<br />
12/3/2009<br />
12/3/2010<br />
12/3/2011<br />
D.1-22
Station Name<br />
LMMW-3S<br />
30<br />
Groundwater Hydrograph<br />
25<br />
20<br />
Groundwater Elevation (Feet, NAVD88)<br />
15<br />
10<br />
5<br />
0<br />
-5<br />
-10<br />
-15<br />
-20<br />
-25<br />
-30<br />
12/5/2002<br />
12/5/2003<br />
12/4/2004<br />
12/4/2005<br />
12/4/2006<br />
Date<br />
12/4/2007<br />
12/3/2008<br />
12/3/2009<br />
12/3/2010<br />
Station Name<br />
LMMW-3SS<br />
30<br />
Groundwater Hydrograph<br />
25<br />
20<br />
Groundwater Elevation (Feet, NAVD88)<br />
15<br />
10<br />
5<br />
0<br />
-5<br />
-10<br />
-15<br />
-20<br />
-25<br />
-30<br />
12/5/2002<br />
12/5/2003<br />
12/4/2004<br />
12/4/2005<br />
12/4/2006<br />
Date<br />
12/4/2007<br />
12/3/2008<br />
12/3/2009<br />
12/3/2010<br />
12/3/2011<br />
D.1-23
Station Name<br />
LMMW-4S<br />
30<br />
Groundwater Hydrograph<br />
25<br />
20<br />
Groundwater Elevation (Feet, NAVD88)<br />
15<br />
10<br />
5<br />
0<br />
-5<br />
-10<br />
-15<br />
-20<br />
-25<br />
-30<br />
12/5/2003<br />
12/4/2004<br />
12/4/2005<br />
12/4/2006<br />
12/4/2007<br />
Date<br />
12/3/2008<br />
12/3/2009<br />
12/3/2010<br />
12/3/2011<br />
Station Name<br />
LMMW-4SS<br />
30<br />
Groundwater Hydrograph<br />
25<br />
20<br />
Groundwater Elevation (Feet, NAVD88)<br />
15<br />
10<br />
5<br />
0<br />
-5<br />
-10<br />
-15<br />
-20<br />
-25<br />
-30<br />
12/5/2002<br />
12/5/2003<br />
12/4/2004<br />
12/4/2005<br />
12/4/2006<br />
Date<br />
12/4/2007<br />
12/3/2008<br />
12/3/2009<br />
12/3/2010<br />
D.1-24
Station Name<br />
LMMW-5S<br />
Groundwater Elevation (Feet, NAVD88)<br />
50<br />
45<br />
40<br />
35<br />
30<br />
25<br />
20<br />
15<br />
10<br />
5<br />
0<br />
-5<br />
-10<br />
-15<br />
-20<br />
-25<br />
-30<br />
Groundwater Hydrograph<br />
12/5/2002<br />
12/5/2003<br />
12/4/2004<br />
12/4/2005<br />
12/4/2006 12/4/2007<br />
Date<br />
12/3/2008<br />
12/3/2009<br />
12/3/2010<br />
12/3/2011<br />
Station Name<br />
LMMW-5SS<br />
Groundwater Elevation (Feet, NAVD88)<br />
50<br />
45<br />
40<br />
35<br />
30<br />
25<br />
20<br />
15<br />
10<br />
5<br />
0<br />
-5<br />
-10<br />
-15<br />
-20<br />
-25<br />
-30<br />
Groundwater Hydrograph<br />
12/5/2002<br />
12/5/2003<br />
12/4/2004<br />
12/4/2005<br />
12/4/2006<br />
Date<br />
12/4/2007<br />
12/3/2008<br />
12/3/2009<br />
12/3/2010<br />
12/3/2011<br />
D.1-25
Station Name<br />
LMMW-7SS<br />
40<br />
Groundwater Hydrograph<br />
35<br />
30<br />
Groundwater Elevation (Feet, NAVD88)<br />
25<br />
20<br />
15<br />
10<br />
5<br />
0<br />
-5<br />
-10<br />
-15<br />
-20<br />
-25<br />
-30<br />
12/5/2002<br />
12/5/2003<br />
12/4/2004<br />
12/4/2005<br />
12/4/2006<br />
Date<br />
12/4/2007<br />
12/3/2008<br />
12/3/2009<br />
12/3/2010<br />
12/3/2011<br />
Station Name<br />
LMMW-9SS<br />
40<br />
Groundwater Hydrograph<br />
35<br />
30<br />
Groundwater Elevation (Feet, NAVD88)<br />
25<br />
20<br />
15<br />
10<br />
5<br />
0<br />
-5<br />
-10<br />
-15<br />
-20<br />
-25<br />
-30<br />
12/5/2002<br />
12/5/2003<br />
12/4/2004<br />
12/4/2005<br />
12/4/2006<br />
Date<br />
12/4/2007<br />
12/3/2008<br />
12/3/2009<br />
12/3/2010<br />
12/3/2011<br />
D.1-26
Station Name<br />
LMPS 155<br />
20<br />
Groundwater Hydrograph<br />
10<br />
0<br />
Groundwater Elevation (Feet, NAVD88)<br />
-10<br />
-20<br />
-30<br />
-40<br />
-50<br />
-60<br />
-70<br />
-80<br />
-90<br />
12/4/2004<br />
12/4/2005<br />
12/4/2006<br />
12/4/2007<br />
Date<br />
12/3/2008<br />
12/3/2009<br />
12/3/2010<br />
12/3/2011<br />
Station Name<br />
LMPS 270<br />
20<br />
Groundwater Hydrograph<br />
10<br />
0<br />
Groundwater Elevation (Feet, NAVD88)<br />
-10<br />
-20<br />
-30<br />
-40<br />
-50<br />
-60<br />
-70<br />
-80<br />
-90<br />
12/4/2004<br />
12/4/2005<br />
12/4/2006<br />
12/4/2007<br />
12/3/2008<br />
Date<br />
12/3/2009<br />
12/3/2010<br />
12/3/2011<br />
D.1-27
Station Name<br />
LMPS 440<br />
20<br />
Groundwater Hydrograph<br />
10<br />
0<br />
Groundwater Elevation (Feet, NAVD88)<br />
-10<br />
-20<br />
-30<br />
-40<br />
-50<br />
-60<br />
-70<br />
-80<br />
-90<br />
12/4/2005<br />
12/4/2006<br />
12/4/2007<br />
12/3/2008<br />
Date<br />
12/3/2009<br />
12/3/2010<br />
12/3/2011<br />
Station Name<br />
LMPS 575<br />
20<br />
Groundwater Hydrograph<br />
10<br />
0<br />
Groundwater Elevation (Feet, NAVD88)<br />
-10<br />
-20<br />
-30<br />
-40<br />
-50<br />
-60<br />
-70<br />
-80<br />
-90<br />
12/4/2004<br />
12/4/2005<br />
12/4/2006<br />
12/4/2007<br />
Date<br />
12/3/2008<br />
12/3/2009<br />
12/3/2010<br />
12/3/2011<br />
D.1-28
Station Name<br />
LMMW-6D<br />
Groundwater Elevation (Feet, NAVD88)<br />
0<br />
-10<br />
-20<br />
-30<br />
-40<br />
-50<br />
-60<br />
-70<br />
-80<br />
-90<br />
-100<br />
-110<br />
-120<br />
-130<br />
-140<br />
-150<br />
-160<br />
-170<br />
-180<br />
-190<br />
Groundwater Hydrograph<br />
12/5/2003<br />
12/4/2004<br />
12/4/2005<br />
12/4/2006<br />
12/4/2007<br />
Date<br />
12/3/2008<br />
12/3/2009<br />
12/3/2010<br />
12/3/2011<br />
Groundwater Elevation (Feet, NAVD88)<br />
Station Name<br />
0<br />
-10<br />
-20<br />
-30<br />
-40<br />
-50<br />
-60<br />
-70<br />
-80<br />
-90<br />
-100<br />
-110<br />
-120<br />
-130<br />
-140<br />
-150<br />
-160<br />
-170<br />
-180<br />
-190<br />
PARK PLAZA MW460<br />
Groundwater Hydrograph<br />
12/5/2003<br />
12/4/2004<br />
12/4/2005<br />
12/4/2006<br />
12/4/2007<br />
Date<br />
12/3/2008<br />
12/3/2009<br />
12/3/2010<br />
12/3/2011<br />
D.1-29
Station Name<br />
THORNTON BEACH MW225<br />
90<br />
Groundwater Hydrograph<br />
85<br />
80<br />
75<br />
Groundwater Elevation (Feet, NAVD88)<br />
70<br />
65<br />
60<br />
55<br />
50<br />
45<br />
40<br />
35<br />
30<br />
25<br />
20<br />
15<br />
10<br />
5<br />
0<br />
12/5/2003<br />
12/4/2004<br />
12/4/2005<br />
12/4/2006<br />
12/4/2007<br />
Date<br />
12/3/2008<br />
12/3/2009<br />
12/3/2010<br />
12/3/2011<br />
Station Name<br />
THORNTON BEACH MW360<br />
90<br />
Groundwater Hydrograph<br />
85<br />
80<br />
75<br />
Groundwater Elevation (Feet, NAVD88)<br />
70<br />
65<br />
60<br />
55<br />
50<br />
45<br />
40<br />
35<br />
30<br />
25<br />
20<br />
15<br />
10<br />
5<br />
0<br />
12/5/2003<br />
12/4/2004<br />
12/4/2005<br />
12/4/2006<br />
12/4/2007<br />
Date<br />
12/3/2008<br />
12/3/2009<br />
12/3/2010<br />
12/3/2011<br />
D.1-30
Station Name<br />
THORNTON BEACH MW670<br />
90<br />
Groundwater Hydrograph<br />
85<br />
80<br />
75<br />
Groundwater Elevation (Feet, NAVD88)<br />
70<br />
65<br />
60<br />
55<br />
50<br />
45<br />
40<br />
35<br />
30<br />
25<br />
20<br />
15<br />
10<br />
5<br />
0<br />
12/5/2003<br />
12/4/2004<br />
12/4/2005<br />
12/4/2006<br />
12/4/2007<br />
Date<br />
12/3/2008<br />
12/3/2009<br />
12/3/2010<br />
12/3/2011<br />
Station Name<br />
FORT FUNSTON S<br />
90<br />
Groundwater Hydrograph<br />
85<br />
80<br />
75<br />
Groundwater Elevation (Feet, NAVD88)<br />
70<br />
65<br />
60<br />
55<br />
50<br />
45<br />
40<br />
35<br />
30<br />
25<br />
20<br />
15<br />
10<br />
5<br />
0<br />
12/5/2002<br />
12/5/2003<br />
12/4/2004<br />
12/4/2005<br />
12/4/2006<br />
Date<br />
12/4/2007<br />
12/3/2008<br />
12/3/2009<br />
12/3/2010<br />
12/3/2011<br />
D.1-31
Station Name<br />
FORT FUNSTON M<br />
90<br />
Groundwater Hydrograph<br />
85<br />
80<br />
75<br />
Groundwater Elevation (Feet, NAVD88)<br />
70<br />
65<br />
60<br />
55<br />
50<br />
45<br />
40<br />
35<br />
30<br />
25<br />
20<br />
15<br />
10<br />
5<br />
0<br />
12/5/2002<br />
12/5/2003<br />
12/4/2004<br />
12/4/2005<br />
12/4/2006<br />
Date<br />
12/4/2007<br />
12/3/2008<br />
12/3/2009<br />
12/3/2010<br />
12/3/2011<br />
D.1-32
Appendix D<br />
Hydrology and Water Quality Supporting Material<br />
APPENDIX D‐2<br />
Groundwater Quality Data<br />
SFPUC <strong>San</strong> <strong>Francisco</strong> Groundwater Supply Project Draft EIR D.2‐1 March 2013<br />
Case No. 2008.1122E
Appendix D<br />
Hydrology and Water Quality Supporting Material<br />
This page intentionally left blank<br />
SFPUC <strong>San</strong> <strong>Francisco</strong> Groundwater Supply Project Draft EIR D.2‐2 March 2013<br />
Case No. 2008.1122E
Table 6<br />
Coastal Groundwater Quality<br />
Well<br />
Sample Date<br />
Calcium<br />
(mg/L)<br />
Magnesium<br />
(mg/L)<br />
Sodium<br />
(mg/L)<br />
Potassium<br />
(mg/L)<br />
Total Alkalinity<br />
(mg/L)<br />
Chloride<br />
(mg/L)<br />
Sulfate<br />
(mg/L)<br />
Nitrate as NO3<br />
(mg/L)<br />
Specific Conductance (EC)<br />
(µmhos/cm)<br />
Field EC<br />
(µmhos/cm)<br />
Total Dissolved<br />
Solids (mg/L)<br />
Hardness as CaCO3<br />
(mg/L)<br />
pH<br />
Field<br />
pH<br />
Primary MCL NE NE NE NE NE NE NE 45 NE NE NE NE NE<br />
Secondary MCL 1 NE NE NE NE NE 250/500/ 600 250/500/600 NA 900/1,600/2,200 NE 500/1,000/1,500 NE NE<br />
SF#34 - GRT HWY/KIRKHAM MW130 Apr-04 28.52 23.27 27.44 1.92 27.5 32.0 6.3** 445 -- 308 160 8.04 --<br />
Oct-04 30.82 27.45 26.76 1.51 128 32.9 34.6 28.9 465 -- 233 180 7.90 --<br />
Apr-05 26.10 26.56 24.71 1.20 120 35 34.0 31.0 457 439 284 168 7.99 7.78<br />
Nov-05 -- -- -- -- 122 -- -- 469 -- 218 180 8.01 --<br />
May-06 -- -- -- -- -- 36 -- -- 466 -- 240 -- -- --<br />
Oct-06 -- -- -- -- -- 34 -- -- 468 -- 260 -- -- --<br />
May-07 -- -- -- -- -- 34 -- -- 478 -- 278 -- -- --<br />
Oct-07 -- -- -- -- -- 34 -- -- 413 -- 255 -- -- --<br />
Apr-08 -- -- -- -- -- 34 -- -- 459 -- 278 -- -- --<br />
Sep-08 -- -- -- -- -- 33 -- -- 437 -- 257 -- -- --<br />
Apr-09 -- -- -- -- -- 36 -- -- 444 -- 257 -- -- --<br />
Nov-09 -- -- -- -- -- 32 -- -- 416 -- 260 -- -- --<br />
Apr-10 -- -- -- -- -- 32 -- -- 423 -- 248 -- -- --<br />
Nov-10 -- -- -- -- -- 33 -- -- 420 -- 238 -- -- --<br />
May-11 -- -- -- -- 36 -- -- 407 -- 241 -- -- --<br />
Nov-11 -- -- -- -- 98 32 -- -- 386 -- 250 142 8.06 --<br />
D.2-3<br />
SF#35 - GRT HWY/KIRKHAM MW255 Apr-04 26.32 29.21 21.30 1.33 32.5 29.0 6** 476 -- 316 200 7.95 7.7<br />
Oct-04 29.44 30.21 23.63 1.43 132 34.3 29.1 26.1 460 -- 241 184 7.90 --<br />
Apr-05 28.54 31.47 22.21 1.37 134 36 32.0 28.0 477 452 297 192 7.89 7.7<br />
Nov-05 -- -- -- -- 132 37 -- -- 471 -- 217 206 7.95 --<br />
May-06 -- -- -- -- -- 37 -- -- 462 -- 320 -- -- --<br />
Oct-06 -- -- -- -- -- 36 -- -- 472 -- 270 -- -- --<br />
May-07 -- -- -- -- -- -- -- 473 -- 280 -- -- --<br />
Oct-07 -- -- -- -- -- 35 -- -- 425 -- 249 -- -- --<br />
Apr-08 -- -- -- -- -- 36 -- -- 444 -- 260 -- -- --<br />
Sep-08 -- -- -- -- -- 38 -- -- 441 -- 261 -- -- --<br />
Apr-09 -- -- -- -- -- 39 -- -- 455 -- 284 -- -- --<br />
Nov-09 -- -- -- -- -- 37 -- -- 443 -- 254 -- -- --<br />
Apr-10 -- -- -- -- -- 36 -- -- 462 -- 299 -- -- --<br />
Nov-10 -- -- -- -- -- 38 -- -- 476 -- 287 -- -- --<br />
May-11 -- -- -- -- -- 40 -- -- 482 -- 268 -- -- --<br />
Nov-11 -- -- -- -- 124 39 -- -- 467 -- 260 180 7.86 --<br />
SF#36 - GRT HWY/KIRKHAM MW385 Apr-04 53.43 7.21 24.65 4.83 27.5 72.0
Table 6<br />
Coastal Groundwater Quality<br />
Well<br />
Sample Date<br />
Calcium<br />
(mg/L)<br />
Magnesium<br />
(mg/L)<br />
Sodium<br />
(mg/L)<br />
Potassium<br />
(mg/L)<br />
Total Alkalinity<br />
(mg/L)<br />
Chloride<br />
(mg/L)<br />
Sulfate<br />
(mg/L)<br />
Nitrate as NO3<br />
(mg/L)<br />
Specific Conductance (EC)<br />
(µmhos/cm)<br />
Field EC<br />
(µmhos/cm)<br />
Total Dissolved<br />
Solids (mg/L)<br />
Hardness as CaCO3<br />
(mg/L)<br />
pH<br />
Field<br />
pH<br />
Primary MCL NE NE NE NE NE NE NE 45 NE NE NE NE NE<br />
Secondary MCL 1 NE NE NE NE NE 250/500/ 600 250/500/600 NA 900/1,600/2,200 NE 500/1,000/1,500 NE NE<br />
SF#37 - GRT HWY/KIRKHAM MW435 Apr-04 44.65 4.08 32.92 7.20 25 60.0
Table 6<br />
Coastal Groundwater Quality<br />
Well<br />
Sample Date<br />
Calcium<br />
(mg/L)<br />
Magnesium<br />
(mg/L)<br />
Sodium<br />
(mg/L)<br />
Potassium<br />
(mg/L)<br />
Total Alkalinity<br />
(mg/L)<br />
Chloride<br />
(mg/L)<br />
Sulfate<br />
(mg/L)<br />
Nitrate as NO3<br />
(mg/L)<br />
Specific Conductance (EC)<br />
(µmhos/cm)<br />
Field EC<br />
(µmhos/cm)<br />
Total Dissolved<br />
Solids (mg/L)<br />
Hardness as CaCO3<br />
(mg/L)<br />
pH<br />
Field<br />
pH<br />
Primary MCL NE NE NE NE NE NE NE 45 NE NE NE NE NE<br />
Secondary MCL 1 NE NE NE NE NE 250/500/ 600 250/500/600 NA 900/1,600/2,200 NE 500/1,000/1,500 NE NE<br />
SF#32 - GRT HWY/ORTEGA MW400 Apr-04 15.20 11.80 23.11 1.47 -- 20 10.0 1.2** 277 -- 230 100 8.11 --<br />
Oct-04 17.00 12.69 23.27 1.31 92 22.1 13.5 5.8 277 -- 146 88 8.20 --<br />
Apr-05 16.36 13.54 21.77 1.28 88 24.0 8.7 6.4 272 -- 156 88 8.22 --<br />
Nov-05 -- -- -- -- -- 25 -- -- 273 -- 176 -- -- --<br />
May-06 -- -- -- -- -- 24 -- -- 272 -- 180 -- -- --<br />
Oct-06 -- -- -- -- -- 24 -- -- 272 -- 160 -- -- --<br />
May-07 -- -- -- -- -- 24 -- -- 276 -- 171 -- -- --<br />
Oct-07 -- -- -- -- -- 23 -- -- 271 -- 170 -- -- --<br />
Apr-08 -- -- -- -- -- 19 -- -- 273 -- 174 -- -- --<br />
Sep-08 -- -- -- -- -- 24 -- -- 268 -- 216 -- -- --<br />
Apr-09 -- -- -- -- -- 20 -- -- 272 -- 168 -- -- --<br />
Nov-09 -- -- -- -- -- 25 -- -- 275 -- 166 -- -- --<br />
Apr-10 -- -- -- -- -- 24 -- -- 274 -- 164 -- -- --<br />
Nov-10 -- -- -- -- -- 24 -- -- 278 -- 208 -- -- --<br />
May-11 -- -- -- -- -- 27 -- -- 279 -- 220 -- -- --<br />
Oct-11 -- -- -- -- 84 26 -- -- 272 -- 160 86 8.04 --<br />
D.2-5<br />
SF#33 - GRT HWY/ORTEGA MW475 Apr-04 12.69 2.29 40.89 2.89 20 15.0
Table 6<br />
Coastal Groundwater Quality<br />
Well<br />
Sample Date<br />
Calcium<br />
(mg/L)<br />
Magnesium<br />
(mg/L)<br />
Sodium<br />
(mg/L)<br />
Potassium<br />
(mg/L)<br />
Total Alkalinity<br />
(mg/L)<br />
Chloride<br />
(mg/L)<br />
Sulfate<br />
(mg/L)<br />
Nitrate as NO3<br />
(mg/L)<br />
Specific Conductance (EC)<br />
(µmhos/cm)<br />
Field EC<br />
(µmhos/cm)<br />
Total Dissolved<br />
Solids (mg/L)<br />
Hardness as CaCO3<br />
(mg/L)<br />
pH<br />
Field<br />
pH<br />
Primary MCL NE NE NE NE NE NE NE 45 NE NE NE NE NE<br />
Secondary MCL 1 NE NE NE NE NE 250/500/ 600 250/500/600 NA 900/1,600/2,200 NE 500/1,000/1,500 NE NE<br />
SF#27 - GRT HWY/TARAVAL MW240 Apr-04 21.63 19.49 22.20 1.88 25 17.0 2.5** 371 -- 276 150 7.95 --<br />
Oct-04 21.63 19.84 23.87 1.67 104 32.2 19.6 11.3 367 -- 196 130 7.70 --<br />
Apr-05 22.14 21.01 23.13 1.68 104 36 20.0 13.0 369 -- 243 132 7.80 --<br />
Nov-05 -- -- -- -- -- 34 -- -- 380 -- 230 -- -- --<br />
May-06 -- -- -- -- -- 36 -- -- 368 -- 240 -- -- --<br />
Oct-06 -- -- -- -- -- 33 -- -- 366 -- 230 -- -- --<br />
May-07 -- -- -- -- -- 35 -- -- 373 -- 214 -- -- --<br />
Oct-07 -- -- -- -- -- 36 -- -- 370 -- 229 -- -- --<br />
Apr-08 -- -- -- -- -- 36 -- -- 374 -- 226 -- -- --<br />
Sep-08 -- -- -- -- -- 34 -- -- 375 -- 207 -- -- --<br />
Apr-09 -- -- -- -- -- 39 -- -- 388 -- 229 -- -- --<br />
Nov-09 -- -- -- -- -- 35 -- -- 386 -- 217 -- -- --<br />
Apr-10 -- -- -- -- -- 35 -- -- 386 -- 235 -- -- --<br />
Nov-10 -- -- -- -- -- 33 -- -- 389 -- 225 -- -- --<br />
Jun-11 -- -- -- -- -- 34 -- -- 385 -- 249 -- -- --<br />
Nov-11 -- -- -- -- 108 35 -- -- 379 -- 200 138 7.45 --<br />
D.2-6<br />
SF#28 - GRT HWY/TARAVAL MW400 Apr-04 17.62 14.73 20.44 1.72 20 28.0
Table 6<br />
Coastal Groundwater Quality<br />
Well<br />
Sample Date<br />
Calcium<br />
(mg/L)<br />
Magnesium<br />
(mg/L)<br />
Sodium<br />
(mg/L)<br />
Potassium<br />
(mg/L)<br />
Total Alkalinity<br />
(mg/L)<br />
Chloride<br />
(mg/L)<br />
Sulfate<br />
(mg/L)<br />
Nitrate as NO3<br />
(mg/L)<br />
Specific Conductance (EC)<br />
(µmhos/cm)<br />
Field EC<br />
(µmhos/cm)<br />
Total Dissolved<br />
Solids (mg/L)<br />
Hardness as CaCO3<br />
(mg/L)<br />
pH<br />
Field<br />
pH<br />
Primary MCL NE NE NE NE NE NE NE 45 NE NE NE NE NE<br />
Secondary MCL 1 NE NE NE NE NE 250/500/ 600 250/500/600 NA 900/1,600/2,200 NE 500/1,000/1,500 NE NE<br />
SF#42 - ZOO MW275 Apr-04 17.89 0.77* 97.6* 3.06 60 45* 0.82** 530 -- 360 44 10.20<br />
Nov-04 24.14 14.99 45.51 5.07 110 60.2 12.2
Table 6<br />
Coastal Groundwater Quality<br />
Well<br />
Sample Date<br />
Calcium<br />
(mg/L)<br />
Magnesium<br />
(mg/L)<br />
Sodium<br />
(mg/L)<br />
Potassium<br />
(mg/L)<br />
Total Alkalinity<br />
(mg/L)<br />
Chloride<br />
(mg/L)<br />
Sulfate<br />
(mg/L)<br />
Nitrate as NO3<br />
(mg/L)<br />
Specific Conductance (EC)<br />
(µmhos/cm)<br />
Field EC<br />
(µmhos/cm)<br />
Total Dissolved<br />
Solids (mg/L)<br />
Hardness as CaCO3<br />
(mg/L)<br />
pH<br />
Field<br />
pH<br />
Primary MCL NE NE NE NE NE NE NE 45 NE NE NE NE NE<br />
Secondary MCL 1 NE NE NE NE NE 250/500/ 600 250/500/600 NA 900/1,600/2,200 NE 500/1,000/1,500 NE NE<br />
SF#57 - USGS South Windmill MW57 May-06 -- -- -- -- -- 115 -- -- 963 -- -- -- --<br />
Oct-07 -- -- -- -- -- 140 53 41 1104 -- 600 -- -- --<br />
May-08 -- -- -- -- -- 150 -- -- 1183 -- 653 -- -- --<br />
Sep-08 -- -- -- -- -- 178 -- -- 1228 -- 701 -- -- --<br />
Apr-09 -- -- -- -- -- 178 -- 1253 684 -- -- --<br />
Nov-09 -- -- -- -- -- 193 -- 1277 666 -- -- --<br />
Apr-10 -- -- -- -- -- 176 -- -- 1281 -- 705 -- -- --<br />
Nov-10 -- -- -- -- -- 151 -- -- 1240 -- 663 -- -- --<br />
May-11 -- -- -- -- 157 -- -- 1201 -- 667 -- --<br />
Nov-11 -- -- -- -- 284 154 -- -- 1217 -- 690 408 7.0 --<br />
SF#58 - USGS South Windmill MW140 May-06 -- -- -- -- -- 57 -- -- 605 -- -- -- --<br />
Oct-07 -- -- -- -- -- 48 39 31 596 -- 330 -- -- --<br />
May-08 -- -- -- -- -- 57 -- -- 636 -- 350 -- -- --<br />
Sep-08 -- -- -- -- -- 61 -- -- 658 -- 359 -- -- --<br />
Apr-09 -- -- -- -- -- 67 -- 703 -- 382 -- -- --<br />
Nov-09 -- -- -- -- -- 70 -- 744 -- 431 -- -- --<br />
Apr-10 -- -- -- -- -- 65 -- -- 720 -- 400 -- -- --<br />
Nov-10 -- -- -- -- -- 61 -- -- 739 -- 412 -- -- --<br />
May-11 -- -- -- -- 60 -- -- 693 -- 490 -- --<br />
Nov-11 -- -- -- -- 202 59 -- -- 704 -- 410 176 7.72 --<br />
D.2-8<br />
Notes<br />
* = Potentially anomalous or questionable result<br />
** = April 2004 data represents Nitrate as Nitrogen reported by laboratory, rather than Nitrate as Nitrate concentration.<br />
-- = Not tested<br />
mg/l = Milligrams per liter<br />
Shaded cell indicates data collected in 2011<br />
MCL Maximum Contaminant Level<br />
Secondary MCL 1 250/500/ 600: Recommended/ Upper/Short Term<br />
NE Not Established<br />
Page 6 of 6
Table 7<br />
General Basin Groundwater Quality<br />
Well<br />
Sample Date<br />
Calcium<br />
(mg/L)<br />
Magnesium<br />
(mg/L)<br />
Sodium<br />
(mg/L)<br />
Potassium<br />
(mg/L)<br />
Total Alkalinity<br />
(mg/L)<br />
Chloride<br />
(mg/L)<br />
Sulfate (mg/L)<br />
Nitrate as NO 3<br />
(mg/L)<br />
Specific Conductance<br />
(EC) (µmhos/cm)<br />
Field EC<br />
(µmhos/cm)<br />
Total Dissolved<br />
Solids (mg/L)<br />
Hardness as CaCO3<br />
(mg/L) pH Field pH<br />
Primary MCL NE NE NE NE NE NE NE 45.0 NE NE NE NE<br />
Secondary MCL 1 NE NE NE NE NE 250/500/ 600 250/500/600 NA 900/1,600/2,200 500/1,000/1,500 NE NE<br />
SF#02 - EDGEWOOD SCHOOL May-02 -- -- -- -- 103 30.0 36.0 46.0 445 -- -- 169 7.50 --<br />
Nov-02 -- -- -- -- 144 30.0 36.0 49.0 452 -- 227 164 7.30 --<br />
Jul-03 24.8 25.6 24.5 1.4 110 33.0 37.0 51.0 450 235 180 7.20 --<br />
Apr-04 24.5 25.0 24.5 1.4 -- -- -- -- -- -- -- -- -- --<br />
Nov-04 11.12* 0.254* 26.5 0.28* 108 29.1 34.5 47.9 446 -- 312 166 7.50 --<br />
SF#03 - ELK GLEN 2 Apr-00 30.4 32.8 24.2 ND 138 38.4 48.8 49.2 526 -- 364 211 7.65 --<br />
Apr-01 -- -- -- -- 140 41.0 52.0 55.0 580 -- 330 236 7.62 --<br />
Dec-01 34.9 37.3 27.6 1.1 140 40.4 50.8 48.9 580 -- 360 230 7.74 --<br />
Apr-04 34.4 38.5 26.9 1.1 43.0 52.0 12** 583 -- 412 240 7.61 --<br />
Nov-04 38.9 39.5 30.9 1.2 143 39.5 56.0 51.2 590 -- 374 235 7.80 --<br />
May-05 34.4 37.2 26.1 0.8 150 39.0 55.0 51.0 590 560 362 210 7.63 7.5<br />
Nov-05 -- -- -- -- -- -- -- -- -- 516 -- -- -- --<br />
SF#07 - LMMW1S Apr-09 58.4 89.7 90.6 2.7 340 235 114.0 10.7 1488 -- 859 590 7.09 --<br />
Nov-09 73.0 110.0 130.0 2.8 310 393 122.0 41.0 1936 -- 1035 700 6.74 --<br />
Apr-10 52.9 78.4 76.2 2.3 342 129 77.0
Table 7<br />
General Basin Groundwater Quality<br />
Well<br />
Sample Date<br />
Calcium<br />
(mg/L)<br />
Magnesium<br />
(mg/L)<br />
Sodium<br />
(mg/L)<br />
Potassium<br />
(mg/L)<br />
Total Alkalinity<br />
(mg/L)<br />
Chloride<br />
(mg/L)<br />
Sulfate (mg/L)<br />
Nitrate as NO 3<br />
(mg/L)<br />
Specific Conductance<br />
(EC) (µmhos/cm)<br />
Field EC<br />
(µmhos/cm)<br />
Total Dissolved<br />
Solids (mg/L)<br />
Hardness as CaCO3<br />
(mg/L) pH Field pH<br />
Primary MCL NE NE NE NE NE NE NE 45.0 NE NE NE NE<br />
Secondary MCL 1 NE NE NE NE NE 250/500/ 600 250/500/600 NA 900/1,600/2,200 500/1,000/1,500 NE NE<br />
SF#15 - LMMW6D Apr-04 31.8 34.1 42.9 1.6 50 31.0 7.9** 564 -- 380 200 7.89 --<br />
Nov-04 26.5 27.6 28.3 1.4 130 45 35.5 43.0 521 -- 321 160 8.10 --<br />
Apr-05 30.2 30.4 40.4 1.6 140 55 30.0 32.0 560 -- 349.5 194 7.95 --<br />
Nov-05 32.1 2.02* 29.2 42.5* 126 56 36.0 44.0 561 -- 384 -- 8.03 --<br />
May-06 27.8 27.8 38.7 1.7 130 54 37.0 45.0 560 -- 350 212 8.06 7.35<br />
May-07 26.4 26.9 39.0 1.2 112 50 32.0 55.0 535 -- 312 176 8.12 --<br />
May-08 27.7 28.4 39.1 1.7 118 55 33.0 49.0 549 -- 310 178 7.95 --<br />
Apr-09 24.9 26.8 39.2 1.5 134 57 29.9 36.0 562 -- 323 192 8.06 --<br />
Nov-09 27.0 27.0 37.0 1.7 120 53 34.0 43.8 558 -- 301 180 7.95 --<br />
Apr-10 28.3 29.4 40.5 0.1 134 53 31.7 41.9 572 -- 317 186 7.96 --<br />
Nov-10 23.6 25.2 31.2 1.6 122 52 28.0 47.0 578 -- 331 182 8.10<br />
May-11 26.3 29.1 38.5 1.7 104 54 29.5 45.0 569 -- 303 182 7.98 --<br />
Oct-11 29.9 30.4 40.8 1.7 136 55 29.3 40.8 572 -- 320 192 -- --<br />
D.2-10<br />
SF#16 - LMMW7SS Apr-04 44.0 48.5 54.9 1.2 -- -- -- -- -- -- -- -- -- --<br />
Oct-04 43.7 42.6 59.1 1.5 240 45.7 45.7 50.9 737 -- 456 260 7.70 --<br />
Nov-09 42.0 42.0 53.0 1.5 240 43.0 47.0 52.0 769 -- 496 282 7.58 --<br />
SF#17 - (NE) WINDMILL Nov-02 -- -- -- -- 168 48.0 39.0 28.0 574 -- 265 212 7.50 --<br />
Jul-03 28.6 36.2 30.6 1.7 180 48.0 33.0 28.0 575 -- 273 230 7.40 --<br />
SF#18 - NEW GG PARK (N) LAKE Nov-04 28.6 35.1 35.1 1.4 158 41.8 31.1 21.4 530 -- 337 198 7.50 --<br />
May-05 24.9 30.4 26.6 0.7 146 41.0 27.0 25.0 500 -- 289 178 7.69 --<br />
Nov-07 27.4 32.2 24.7 1.1 128 44 28.0 31.0 496 -- 290 200 7.52 --<br />
Apr-09 23.1 28.6 24.8 1.1 140 44 24.0 28.0 494 -- 298 194 7.79 --<br />
SF#19 - NEW GG PARK (S) WINDMILL Nov-04 35.2 40.3 31.8 1.7 162 42.1 49.0 37.4 598 -- 373 240 7.80 --<br />
May-05 25.5 34.5 25.5 1.2 146 42.0 42.0 20.0 525 507 311 230 8.04 7.94<br />
Nov-05 -- -- -- -- 140 41.0 -- -- 565 -- 358 240 7.76 --<br />
Dec-05 28.9 35.8 27.0 1.5 -- -- -- -- -- -- -- -- -- --<br />
Jun-07 -- -- -- -- 148 -- -- -- -- 521 -- -- -- 7.5<br />
Apr-09 28.4 32.5 27.6 1.4 150 46 40.0 31.0 558 -- 316 224 7.87 --<br />
SF#20 - (NW) WINDMILL May-02 -- -- -- -- 171 44.0 37.0 28.0 573 -- -- 219 7.50 --<br />
Nov-02 -- -- -- -- 120 41.0 12.0 20.0 415 -- 181 144 8.00 --<br />
Jul-03 20.0 24.3 24.6 1.3 130 43.0 11.0 18.0 414 -- 164 160 7.90 --<br />
SF#22 - OLYMPIC CLUB #8 May-02 -- -- -- -- 189 84.0 30.5 16.1 685 -- -- -- 8.10 --<br />
Apr-04 38.5 39.7 46.0 2.0 -- -- -- -- -- -- -- -- --<br />
SF#23 - PINE LAKE PROD WELL Oct-04 32.7 33.4 36.4 1.1 144 35.3 37.0 65.0 565 336 244 7.20 --<br />
SF#25 - (S) WINDMILL May-02 -- -- -- -- 133 41.0 28.0 36.0 476 -- -- 185 7.70 --<br />
Nov-02 -- -- -- -- 120 40.0 28.0 38.0 474 -- 202 184 7.70 --<br />
Jul-03 25.5 28.6 24.5 1.5 150 43.0 22.0 36.0 486 -- 202 190 7.80 --<br />
Apr-04 24.4 27.7 23.9 1.1 -- 40 24.0 8.6** 455 -- 330 180 7.70 --<br />
Nov-04 29.6 31.0 29.9 1.7 128 37.4 31.4 36.7 489 -- 312 185 7.70 --<br />
SF#41 - WEST SUNSET PLAYGROUND May-04 15.2 16.4 21.7 0.9 -- 20.0 24.0 3.2** 317 -- 266 130 8.70 --<br />
May-05 16.3 17.0 22.9 1.0 80 26.0 27.0 16.0 326 284 205 112 8.59 8.51<br />
May-06 15.0 16.6 21.2 0.7 76 29 28.0 17.0 322 -- 210 110 8.57 --<br />
May-07 17.3 16.5 22.2 0.9 75 30 26.7 17.5 317 -- 184.8 107 8.52 --<br />
May-08 18.9 20.2 24.8 1.1 88 29 29.3 22.4 355 -- 210 122 8.37 --<br />
Apr-09 18.5 19.3 24.9 1.1 96 32 29.7 22.4 382 -- 241 140 8.50 --<br />
Nov-09 19.0 19.0 23.0 1.0 94 31 31.6 21.1 380 -- 230 128 8.30 --<br />
Apr-10 20.6 20.2 24.5 1.1 96 26 31.3 23.5 397 -- 226 136 8.27 --<br />
Nov-10 17.2 18.1 21.5 1.1 100 30 31.0 20.0 382 228 134 8.54<br />
Jun-11 16.6 18.3 22.2 1.1 92 28 30.7 19.6 385 -- 213 128 -- --<br />
Oct-11 14.4 12.7 21.6 1.0 66 26 22.4 0.6 264 -- 150 84 7.90 --<br />
SF#24 - (S) SUNSET PLAYGROUND Apr-04 31.1 33.1 36.9 1.3 -- 50.0 27.0 2.9** 576 -- 394 200 7.34 --<br />
May-05 30.8 33.0 37.8 1.4 164 21.0 34.0 21.0 560 502 343 204 7.41 7.21<br />
May-06 28.8 31.6 35.6 1.2 154 54 38.0 30.0 584 -- 360 212 7.39 --<br />
WELL DECOMMISSIONED<br />
SF#52 - CENTRAL PUMP ST MW190 May-05 44.2 43.2 46.9 1.8 270 47 47.0 19.0 750 -- 433 300 7.59 --<br />
Oct-07 42.9 45.1 43.2 1.3 270 40 40.0 19.4 719 -- 425 290 7.57 --<br />
Sep-08 45.4 45.9 43.2 1.4 260 40 45.0 22.0 707 -- 382 294 7.56 --<br />
SF#53 - CENTRAL PUMP ST MW270 May-05 29.0 21.9 48.2 1.5 168 72 8.7
D.2-11
D.2-12
D.2-13
Appendix D<br />
Hydrology and Water Quality Supporting Material<br />
APPENDIX D‐3<br />
Lake Merced Water Quality Data<br />
SFPUC <strong>San</strong> <strong>Francisco</strong> Groundwater Supply Project Draft EIR D.3‐1 March 2013<br />
Case No. 2008.1122E
Appendix D<br />
Hydrology and Water Quality Supporting Material<br />
The following is a list of abbreviations used in Appendix D-3:<br />
Alk = alkalinity<br />
Br = bromide<br />
°C = degrees Centigrade<br />
Cl ‐ = chloride<br />
Cond = electrical conductivity<br />
DO = dissolved oxygen<br />
Fe = iron<br />
Fl ‐ = fluoride<br />
Ft = feet<br />
Hard = hardness<br />
mg/L = milligrams per liter<br />
mmho/cm = micromhos per centimeter<br />
Mn = manganese<br />
MPN = most probable number<br />
MTBE = methyl tertiary‐butyl ether<br />
mv = millivolts<br />
NH3‐N = ammonium<br />
NO3‐N = nitrate as nitrogen<br />
No./m 3 = number per cubic meter<br />
No./mL = number per milliliter<br />
ntu = nephelometric turbidity unit<br />
ORP = oxidation reduction potential<br />
Orth P = orthophosphate<br />
Pb = lead<br />
SO4 = sulfate<br />
TDS = total dissolved solids<br />
Temp = temperature<br />
TKN = total kjeldahl nitrogen<br />
TOC = total organic carbon<br />
Tot P = total phosphate<br />
Turb = turbidity<br />
SFPUC <strong>San</strong> <strong>Francisco</strong> Groundwater Supply Project Draft EIR D.3‐2 March 2013<br />
Case No. 2008.1122E
Lake Merced<br />
North<br />
15-May-97 10-Sep-97 3-Dec-97 16-Mar-98 8-Jul-98 23-Sep-98 17-Mar-99 21-Jun-99 15-Sep-99 8-Dec-99 21-Mar-00 21-Jun-00 9-Aug-00 19-Dec-00 7-Mar-01 20-Jun-01 1-Oct-01 18-Dec-01 5-Mar-02 30-Apr-02<br />
Depth Temp Temp Temp Temp Temp Temp Temp Temp Temp Temp Temp Temp Temp Temp Temp Temp Temp Temp Temp Temp<br />
Ft<br />
o C<br />
o C<br />
o C<br />
o C<br />
o C<br />
o C<br />
o C<br />
o C<br />
o C<br />
o C<br />
o C<br />
o C<br />
o C<br />
o C<br />
o C<br />
o C<br />
o C<br />
o C<br />
o C<br />
o C<br />
Surf 22.7 22.1 13.7 15.5 18.3 19.6 13.2 18.4 12.5 14.8 20.6 19.3 11.8 13.2 22.4 19.8 11.6 15.1 17.2<br />
5 20.9 22.1 13.7 15.5 18.3 18.9 13.1 18.2 12.3 14.5 20.3 18.7 11.6 13.0 21.5 18.5 11.2 14.9 16.7<br />
10 17.9 21.6 13.7 14.2 18.2 18.8 12.9 18.2 12.2 14.4 20.2 18.6 11.6 12.2 18.9 17.6 11.1 13.7 16.2<br />
14 18.2 12.2 11.6 17.2<br />
15 17.8 21.4 13.7 12.9 18.0 18.8 12.7 14.4 19.8 18.5 12.1 18.4 11.0 13.3 16.1<br />
16 17.8 21.1 12.9 12.1 13.2 16.1<br />
17<br />
17.4<br />
17.5<br />
18 13.7 14.4<br />
18.8<br />
19<br />
19.3<br />
19.9<br />
20<br />
20.6<br />
D.3-3<br />
Lake Merced<br />
North East<br />
15-May-97 10-Sep-97 3-Dec-97 16-Mar-98 8-Jul-98 23-Sep-98 17-Mar-99 21-Jun-99 15-Sep-99 8-Dec-99 21-Mar-00 21-Jun-00 9-Aug-00 19-Dec-00 7-Mar-01 20-Jun-01 1-Oct-01 18-Dec-01 5-Mar-02 30-Apr-02<br />
Depth Temp Temp Temp Temp Temp Temp Temp Temp Temp Temp Temp Temp Temp Temp Temp Temp Temp Temp Temp Temp<br />
Ft<br />
o C<br />
o C<br />
o C<br />
o C<br />
o C<br />
o C<br />
o C<br />
o C<br />
o C<br />
o C<br />
o C<br />
o C<br />
o C<br />
o C<br />
o C<br />
o C<br />
o C<br />
o C<br />
o C<br />
o C<br />
Surf 21.0 13.2 15.1 17.5 19.3 12.8 17.8 11.5 15.1 19.94 18.3 11.1 12.7 22.1 18.3 10.8 13.9 16.5<br />
5 19.9 13.2 14.9 17.4 18.7 12.7 17.8 11.5 14.6 19.8 17.9 10.9 12.4 20.5 17.5 10.6 13.8 16.3<br />
9 17.3<br />
10 17.7 13.2 13.9 17.3 18.6 12.5 17.8 11.3 14.5 19.7 17.8 10.9 12.0 18.4 10.4 13.3 16.0<br />
11 13.3 16.0<br />
12 13.5<br />
13 14.5<br />
13.8<br />
14<br />
14.1<br />
14.7<br />
15<br />
15.8<br />
Page 1 of 6
Lake Merced<br />
North<br />
Depth<br />
Ft<br />
Surf<br />
5<br />
10<br />
14<br />
15<br />
16<br />
17<br />
17.4<br />
17.5<br />
18<br />
18.8<br />
19<br />
19.3<br />
19.9<br />
20<br />
20.6<br />
18-Jun-02 23-Aug-02 23-Oct-02 11-Feb-03 ######## 15-Jul-03 30-Sep-03 2-Dec-03 27-May-04 29-Aug-04 27-Oct-04 9-Dec-04 9-Feb-05 18-Apr-05 23-Jun-05 17-Aug-05 28-Sep-05 31-Oct-05 29-Nov-05 29-Dec-05<br />
Temp Temp Temp Temp Temp Temp Temp Temp Temp Temp Temp Temp Temp Temp Temp Temp Temp Temp Temp Temp<br />
o C<br />
o C<br />
o C<br />
o C<br />
o C<br />
o C<br />
o C<br />
o C<br />
o C<br />
o C<br />
19.4 17.2 15.8 12.3 17.4 20.4 19.1 13.2 19.9 19.5 16.5 12.8 12.5 17.2 21.1 18.3 18.9 17.0 13.7 13.1<br />
19.2 17.2 15.8 12.0 17.4 19.7 18.9 12.4 19.8 19.5 16.4 12.0 12.3 17.1 21.1 18.2 18.5 16.1 13.7 13.1<br />
19.1 17.2 15.8 11.9 17.4 18.9 18.8 12.3 19.7 19.4 16.3 11.9 12.1 16.9 21.1 18.2 17.8 16.1 13.7 13.1<br />
18.4 17.2 15.7 11.9 17.3 18.5 18.8 12.3 19.5 19.2 16.3 11.7 11.9 16.8 19.4 18.2 17.3 16.0 13.7 13.0<br />
18.4 17.0 12.3 18.2<br />
18.8 19.3 19.1 16.3 11.9 17.2<br />
o C<br />
o C<br />
o C<br />
o C<br />
o C<br />
o C<br />
11.7 16.7 16.0 13.7 12.9<br />
19.1<br />
o C<br />
o C<br />
o C<br />
o C<br />
D.3-4<br />
Lake Merced<br />
North East<br />
Depth<br />
Ft<br />
Surf<br />
5<br />
9<br />
10<br />
11<br />
12<br />
13<br />
13.8<br />
14<br />
14.1<br />
14.7<br />
15<br />
15.8<br />
18-Jun-02 23-Aug-02 23-Oct-02 11-Feb-03 ######## 15-Jul-03 30-Sep-03 2-Dec-03 27-May-04 29-Aug-04 27-Oct-04 9-Dec-04 9-Feb-05 18-Apr-05 23-Jun-05 17-Aug-05 28-Sep-05 31-Oct-05 29-Nov-05 29-Dec-05<br />
Temp Temp Temp Temp Temp Temp Temp Temp Temp Temp Temp Temp Temp Temp Temp Temp Temp Temp Temp Temp<br />
o C<br />
o C<br />
o C<br />
o C<br />
o C<br />
o C<br />
o C<br />
o C<br />
o C<br />
o C<br />
18.7 16.4 15.2 11.8 17.0 19.9 18.4 12.6 19.2 19.2 16.2 12.2 12.5 16.9 20.9 17.7 18.5 n/a 13.0 12.7<br />
18.6 16.4 15.1 11.5 17.0 19.2 18.3 11.8 19.1 19.1 16.0 11.0 12.0 16.7 20.7 17.7 18.1 n/a 12.9 12.6<br />
18.0 16.4 15.1 11.3 17.0 18.3 18.2 11.7 18.8 18.8 15.9 10.8 11.8 16.3 20.0 17.5 17.4 n/a 12.9 12.5<br />
17.0 18.1<br />
11.3 18.2 18.7 15.8 n/a<br />
11.7 18.7 11.3 11.6 19.3 17.5 17.1 12.9<br />
o C<br />
o C<br />
o C<br />
o C<br />
o C<br />
o C<br />
o C<br />
16.2 12.3<br />
o C<br />
o C<br />
o C<br />
Page 2 of 6
Lake Merced<br />
North<br />
Depth<br />
Ft<br />
Surf<br />
5<br />
10<br />
14<br />
15<br />
16<br />
17<br />
17.4<br />
17.5<br />
18<br />
18.8<br />
19<br />
19.3<br />
19.9<br />
20<br />
20.6<br />
23-Jan-06 01-Mar-06 26-Apr-06 14-Jun-06 24-Aug-06 25-Oct-06 20-Dec-06 29-Mar-07 26-Jun-07 20-Aug-07 27-Dec-07 28-Mar-08 10-Jun-08 24-Sep-08 4-Dec-08 24-Mar-09 4-Jun-09 22-Sep-09 15-Dec-09<br />
Temp Temp Temp Temp Temp Temp Temp Temp Temp Temp Temp Temp Temp Temp Temp Temp Temp Temp Temp<br />
o C<br />
o C<br />
o C<br />
o C<br />
o C<br />
o C<br />
o C<br />
o C<br />
o C<br />
o C<br />
12.3 13.1 16.1 20.2 18.5 17.0 10.9 16.5 19.4 22.1 10.1 14.7 20.4 19.9 14.4 14.4 19.1 19.6 10.9<br />
11.9 12.9 16.0 19.6 18.5 17.0 10.8 14.1 19.3 20.0 10.2 14.5 19.3 18.9 13.9 14.2 18.5 19.3 10.4<br />
11.9 12.9 15.9 18.5 18.5 17.0 10.8 13.9 18.8 18.8 10.1 14.3 17.3 18.2 13.9 13.4 16.8 19.2 10.3<br />
11.8 12.7 15.8 18.2 18.5 16.9 10.8 13.7 18.6 18.5 9.9 14.3 17.2 18.0 13.8 13.4 16.5 18.6 10.3<br />
11.8 16.8 18.4<br />
12.6 14.7 17.5 18.5 10.8 13.5 17.2 9.9<br />
o C<br />
o C<br />
o C<br />
o C<br />
17.8<br />
o C<br />
13.8<br />
o C<br />
17.1 10.4<br />
13.6 13.3<br />
13.5<br />
o C<br />
16.4<br />
o C<br />
18.5<br />
o C<br />
D.3-5<br />
Lake Merced<br />
North East<br />
Depth<br />
Ft<br />
Surf<br />
5<br />
9<br />
10<br />
11<br />
12<br />
13<br />
13.8<br />
14<br />
14.1<br />
14.7<br />
15<br />
15.8<br />
23-Jan-06 01-Mar-06 26-Apr-06 14-Jun-06 24-Aug-06 25-Oct-06 20-Dec-06 29-Mar-07 26-Jun-07 20-Aug-07 27-Dec-07 28-Mar-08 10-Jun-08 24-Sep-08 4-Dec-08 24-Mar-09 4-Jun-09 22-Sep-09 15-Dec-09<br />
Temp Temp Temp Temp Temp Temp Temp Temp Temp Temp Temp Temp Temp Temp Temp Temp Temp Temp Temp<br />
o C<br />
o C<br />
o C<br />
o C<br />
o C<br />
o C<br />
o C<br />
o C<br />
o C<br />
o C<br />
11.6 12.8 16.1 19.5 18.1 16.7 10.2 15.4 19.4 20.7 9.29 14.8 20.1 19.3 13.6 14.0 18.1 19.3 10.4<br />
11.2 12.5 16.0 18.8 18.1 16.7 10.2 14.3 19.3 20.1 9.29 14.6 19.0 18.9 13.3 13.5 17.3 19.2 9.9<br />
11.2 12.3 16.0 18.1 18.0 16.6 10.1 14.2 19.0 18.7 9.17 14.4 17.3 18.0 13.2 13.3 16.8 19.1 9.9<br />
11.2 16.6 17.1 17.8<br />
18.6<br />
12.2 18.0 18.0 18.2<br />
13.2<br />
13.3 9.9<br />
15.9 10.1 13.9 18.7 9.21 14.2 16.3<br />
14.2<br />
o C<br />
o C<br />
o C<br />
o C<br />
o C<br />
o C<br />
o C<br />
o C<br />
o C<br />
Page 3 of 6
Lake Merced<br />
South - Pistol<br />
Range<br />
15-May-97 10-Sep-97 3-Dec-97 16-Mar-98 8-Jul-98 23-Sep-98 17-Mar-99 21-Jun-99 15-Sep-99 8-Dec-99 21-Mar-00 21-Jun-00 9-Aug-00 19-Dec-00 7-Mar-01 20-Jun-01 1-Oct-01 18-Dec-01 5-Mar-02 30-Apr-02<br />
Depth Temp Temp Temp Temp Temp Temp Temp Temp Temp Temp Temp Temp Temp Temp Temp Temp Temp Temp Temp Temp<br />
Ft<br />
o C<br />
o C<br />
o C<br />
o C<br />
o C<br />
o C<br />
o C<br />
o C<br />
o C<br />
o C<br />
o C<br />
o C<br />
o C<br />
o C<br />
o C<br />
o C<br />
o C<br />
o C<br />
o C<br />
o C<br />
Surf 20.5 21.9 13.6 15.1 17.9 19.5 12.6 17.7 18.0 12.2 14.8 19.9 18.7 11.6 12.7 21.1 19.6 11.3 14.3 16.1<br />
5 18.8 21.9 13.6 17.9 18.6 12.3 17.5 18.0 12.2 14.4 19.8 18.3 11.5 12.2 20.5 18.5 10.6 14.2 16.0<br />
6 14.1<br />
10 17.3 21.2 13.6 17.9 18.6 12.3 17.3 18.0 12.2 14.1 19.8 18.2 11.5 12.0 18.5 17.6 10.6 13.5 15.9<br />
12 14.0<br />
15 17.0 20.8 13.6 17.6 18.6 12.3 16.8 18.0 12.0 13.9 18.3 18.1 11.5 11.8 17.8 17.1 10.6 13.3 15.2<br />
16 17.0 20.7 11.5 17.8 17.0 10.7<br />
17 17.0 12.0 13.3<br />
18 13.3 17.6 18.0 18.3 18.2 11.8 15.1<br />
18.2<br />
18.9<br />
19 13.3 12.2<br />
20 16.5 14.0<br />
20.1<br />
20.6<br />
20.8<br />
21<br />
21.5<br />
22<br />
D.3-6<br />
Lake Merced<br />
South - Pump<br />
Station<br />
15-May-97 10-Sep-97 3-Dec-97 16-Mar-98 8-Jul-98 23-Sep-98 17-Mar-99 21-Jun-99 15-Sep-99 8-Dec-99 21-Mar-00 21-Jun-00 9-Aug-00 19-Dec-00 7-Mar-01 20-Jun-01 1-Oct-01 18-Dec-01 5-Mar-02 30-Apr-02<br />
Depth Temp Temp Temp Temp Temp Temp Temp Temp Temp Temp Temp Temp Temp Temp Temp Temp Temp Temp Temp Temp<br />
Ft<br />
o C<br />
o C<br />
o C<br />
o C<br />
o C<br />
o C<br />
o C<br />
o C<br />
o C<br />
o C<br />
o C<br />
o C<br />
o C<br />
o C<br />
o C<br />
o C<br />
o C<br />
o C<br />
o C<br />
o C<br />
Surf 20.8 21.8 13.5 15.6 18.5 19.6 12.8 18.2 18.5 12.2 14.5 20.3 19.0 11.7 13.2 21.6 19.5 11.5 14.7 16.4<br />
5 20.5 21.6 13.5 15.1 18.5 18.7 12.7 17.9 18.4 12.2 14.2 20.3 18.6 11.6 12.8 20.8 19.0 10.9 14.5 16.4<br />
10 17.9 21.1 13.5 18.4 18.7 12.6 17.8 18.4 12.2 14.1 19.7 18.6 11.5 12.6 18.9 17.8 10.9 13.3 15.4<br />
12 14.9<br />
15 17.2 20.8 13.5 17.7 18.7 12.5 17.1 18.3 12.1 13.9 19.1 18.6 11.5 11.9 17.8 17.1 10.9 13.2 15.4<br />
16 17.1 20.8 17.1 11.1<br />
17 11.5<br />
18 13.8 17.6 18.3 12.1 18.2 11.8 17.7 13.1 15.6<br />
19 12.5 16.8 18.5<br />
19.2<br />
20 14.0<br />
20.4<br />
21<br />
21.5<br />
22<br />
22.8<br />
23.2<br />
Page 4 of 6
Lake Merced<br />
South - Pistol<br />
Range<br />
Depth<br />
Ft<br />
Surf<br />
5<br />
6<br />
10<br />
12<br />
15<br />
16<br />
17<br />
18<br />
18.2<br />
18.9<br />
19<br />
20<br />
20.1<br />
20.6<br />
20.8<br />
21<br />
21.5<br />
22<br />
18-Jun-02 23-Aug-02 23-Oct-02 11-Feb-03 ######## 15-Jul-03 30-Sep-03 2-Dec-03 27-May-04 29-Aug-04 27-Oct-04 9-Dec-04 9-Feb-05 18-Apr-05 23-Jun-05 17-Aug-05 28-Sep-05 31-Oct-05 29-Nov-05 29-Dec-05<br />
Temp Temp Temp Temp Temp Temp Temp Temp Temp Temp Temp Temp Temp Temp Temp Temp Temp Temp Temp Temp<br />
o C<br />
o C<br />
o C<br />
o C<br />
o C<br />
o C<br />
o C<br />
o C<br />
o C<br />
o C<br />
18.6 17.3 15.6 12.1 16.6 19.3 18.5 12.8 19.1 19.0 16.1 12.5 12.1 15.8 20.5 18.2 18.3 16.5 13.5 13.0<br />
18.5 17.3 15.6 12.1 16.6 19.2 18.5 12.3 19.1 19.0 16.1 11.8 11.7 15.6 20.5 18.2 18.3 16.0 13.5 13.0<br />
18.5 17.2 15.5 12.0 16.4 18.4 18.4 12.2 18.9 18.8 16.0 11.7 11.5 15.5 19.7 18.2 18.0 15.8 13.5 13.0<br />
18.5 17.0 15.5 11.8 16.1 18.1 18.4 12.2 18.0 18.8 16.0 11.7 11.4 15.4 19.0 18.2 17.1 15.7 13.5 13.0<br />
18.5 17.0 11.8<br />
15.6 18.1 16.0 11.8 11.3<br />
16.0 18.7 16.9 13.4<br />
o C<br />
o C<br />
o C<br />
18.4 12.2 17.8 12.9<br />
15.4 18.5 18.1 15.6<br />
o C<br />
o C<br />
o C<br />
o C<br />
o C<br />
o C<br />
o C<br />
D.3-7<br />
Lake Merced<br />
South - Pump<br />
Station<br />
Depth<br />
Ft<br />
Surf<br />
5<br />
10<br />
12<br />
15<br />
16<br />
17<br />
18<br />
19<br />
19.2<br />
20<br />
20.4<br />
21<br />
21.5<br />
22<br />
22.8<br />
23.2<br />
18-Jun-02 23-Aug-02 23-Oct-02 11-Feb-03 ######## 15-Jul-03 30-Sep-03 2-Dec-03 27-May-04 29-Aug-04 27-Oct-04 9-Dec-04 9-Feb-05 18-Apr-05 23-Jun-05 17-Aug-05 28-Sep-05 31-Oct-05 29-Nov-05 29-Dec-05<br />
Temp Temp Temp Temp Temp Temp Temp Temp Temp Temp Temp Temp Temp Temp Temp Temp Temp Temp Temp Temp<br />
o C<br />
o C<br />
o C<br />
o C<br />
o C<br />
o C<br />
o C<br />
o C<br />
o C<br />
o C<br />
19.1 17.3 15.6 11.9 17.2 20.1 18.8 13.1 19.6 19.6 16.3 12.4 12.1 16.0 20.5 18.5 18.7 16.6 13.6 13.1<br />
19.1 17.3 15.6 11.9 17.2 20.0 18.7 12.2 19.5 19.6 16.3 11.7 11.6 15.6 20.5 18.5 18.3 16.2 13.6 13.1<br />
18.9 17.3 15.6 11.8 17.2 19.3 18.6 12.2 18.9 19.4 16.2 11.6 11.5 15.5 20.3 18.5 17.3 16.1 13.6 13.1<br />
18.9 17.2 15.6 11.8 16.8 18.4 18.5 12.2 18.1 18.8 16.2 11.6 11.4 15.5 19.0 18.1 16.9 16.0 13.6 13.0<br />
17.2<br />
18.8 15.6 18.1 16.1 11.4<br />
16.1<br />
11.8 18.5 18.7 11.6 16.0<br />
o C<br />
o C<br />
o C<br />
o C<br />
12.2 17.8 15.5 18.6 18.1 16.9 13.6 12.9<br />
15.5<br />
o C<br />
o C<br />
o C<br />
o C<br />
o C<br />
o C<br />
Page 5 of 6
Lake Merced<br />
South - Pistol<br />
Range<br />
Depth<br />
Ft<br />
Surf<br />
5<br />
6<br />
10<br />
12<br />
15<br />
16<br />
17<br />
18<br />
18.2<br />
18.9<br />
19<br />
20<br />
20.1<br />
20.6<br />
20.8<br />
21<br />
21.5<br />
22<br />
23-Jan-06 01-Mar-06 26-Apr-06 14-Jun-06 24-Aug-06 25-Oct-06 20-Dec-06 29-Mar-07 26-Jun-07 20-Aug-07 27-Dec-07 28-Mar-08 10-Jun-08 24-Sep-08 4-Dec-08 24-Mar-09 4-Jun-09 22-Sep-09 15-Dec-09<br />
Temp Temp Temp Temp Temp Temp Temp Temp Temp Temp Temp Temp Temp Temp Temp Temp Temp Temp Temp<br />
o C<br />
o C<br />
o C<br />
o C<br />
o C<br />
o C<br />
o C<br />
o C<br />
o C<br />
o C<br />
11.7 12.7 15.3 19.1 18.5 16.9 11.0 14.5 18.6 20.3 10.1 13.82 18.8 19.5 13.82 13.6 18.1 19.2 10.5<br />
11.6 12.6 15.3 19.0 18.5 16.9 11.0 14.0 18.6 19.9 9.8 13.7 18.1 19.1 13.71 12.8 17.5 19.1 10.4<br />
12.8<br />
11.6 12.6 15.2 18.9 18.4 16.9 11.0 13.9 18.4 18.8 9.8 13.57 17.3 18.1 13.68 16.7 19.0 10.4<br />
11.5 12.5 15.1 18.3 18.4 16.9 10.9 13.8 18.4 18.4 9.7 13.56 16.7 17.9 13.61 12.7 16.3 18.6 10.3<br />
11.5<br />
16.8 13.6<br />
12.5 15.1 18.0 18.4 10.9 13.6 18.1 18.1 9.7 13.45 16.5 12.7 16.3<br />
17.8<br />
12.7<br />
16.3<br />
18.0 13.6 18.1 9.7<br />
13.45<br />
18.0<br />
o C<br />
o C<br />
o C<br />
o C<br />
o C<br />
o C<br />
o C<br />
o C<br />
18.4<br />
o C<br />
10.4<br />
D.3-8<br />
Lake Merced<br />
South - Pump<br />
Station<br />
Depth<br />
Ft<br />
Surf<br />
5<br />
10<br />
12<br />
15<br />
16<br />
17<br />
18<br />
19<br />
19.2<br />
20<br />
20.4<br />
21<br />
21.5<br />
22<br />
22.8<br />
23.2<br />
23-Jan-06 01-Mar-06 26-Apr-06 14-Jun-06 24-Aug-06 25-Oct-06 20-Dec-06 29-Mar-07 26-Jun-07 20-Aug-07 27-Dec-07 28-Mar-08 10-Jun-08 24-Sep-08 4-Dec-08 24-Mar-09 4-Jun-09 22-Sep-09 15-Dec-09<br />
Temp Temp Temp Temp Temp Temp Temp Temp Temp Temp Temp Temp Temp Temp Temp Temp Temp Temp Temp<br />
o C<br />
o C<br />
o C<br />
o C<br />
o C<br />
o C<br />
o C<br />
o C<br />
o C<br />
o C<br />
11.9 12.5 15.7 19.5 18.6 16.9 10.9 14.5 19.2 20.9 10.0 13.9 19.5 19.2 14.0 13.6 18.7 19.6 10.6<br />
11.8 12.4 15.6 19.3 18.6 16.9 10.9 13.9 19.0 20.6 9.9 13.9 18.2 19.1 13.9 12.8 18.0 19.6 10.4<br />
11.8 12.3 15.6 18.5 18.6 16.9 10.9 13.7 18.3 18.9 9.8 13.9 17.6 18.2 13.9 12.8 16.8 19.0 10.4<br />
11.8 12.3 15.6 18.1 18.6 16.7 10.9 13.6 18.3 18.6 9.8 13.9 16.5 18.0 13.8 12.8 16.3 18.7 10.4<br />
16.7<br />
11.7 12.3 15.3 18.0 10.9 13.6 18.2 18.3 9.8 13.9 16.4 17.8 12.8 16.3<br />
12.3 18.0 18.5 18.3 9.8 16.5 17.8 13.8<br />
15.3 10.9 13.6 18.1<br />
o C<br />
o C<br />
13.9<br />
o C<br />
o C<br />
o C<br />
o C<br />
12.8<br />
o C<br />
16.3<br />
o C<br />
18.5<br />
o C<br />
10.4<br />
Page 6 of 6
Lake Merced<br />
North<br />
15-May-97 10-Sep-97 3-Dec-97 16-Mar-98 8-Jul-98 23-Sep-98 17-Mar-99 21-Jun-99 15-Sep-99 8-Dec-99 21-Mar-00 21-Jun-00 9-Aug-00 19-Dec-00 7-Mar-01 20-Jun-01 1-Oct-01 18-Dec-01 5-Mar-02 30-Apr-02 18-Jun-02<br />
Depth pH pH pH pH pH pH pH pH pH pH pH pH pH pH pH pH pH pH pH pH pH<br />
Ft pH units pH units pH units pH units pH units pH units pH units pH units pH units pH units pH units pH units pH units pH units pH units pH units pH units pH units pH units pH units pH units<br />
Surf 8.79 9.07 8.42 8.50 8.79 8.75 8.49 8.37 8.29 8.31 8.73 8.36 8.51 8.45 9.02 8.68 8.08 8.72 8.32 8.75<br />
5 8.67 8.96 8.33 8.49 8.77 8.59 8.47 8.27 8.24 8.34 8.72 8.33 8.47 8.37 9.03 8.46 7.95 8.68 8.27 8.69<br />
10 8.12 8.59 8.27 8.05 8.73 8.40 8.36 8.26 8.19 8.36 8.72 8.34 8.47 8.12 8.02 7.99 7.90 8.38 7.98 8.67<br />
14 8.21 8.17 8.37 7.76<br />
15 8.00 8.42 8.29 7.73 8.22 8.21 8.23 8.37 8.15 8.24 7.92 7.94 7.85 8.07 7.88 8.26<br />
16 7.96 8.24 7.73 7.91 8.07 7.84 8.24<br />
17<br />
17.4<br />
17.5<br />
18 8.29 8.04<br />
18.8<br />
19<br />
19.3<br />
19.9<br />
20<br />
20.6<br />
D.3-9<br />
Lake Merced<br />
North East<br />
15-May-97 10-Sep-97 3-Dec-97 16-Mar-98 8-Jul-98 23-Sep-98 17-Mar-99 21-Jun-99 15-Sep-99 8-Dec-99 21-Mar-00 21-Jun-00 9-Aug-00 19-Dec-00 7-Mar-01 20-Jun-01 1-Oct-01 18-Dec-01 5-Mar-02 30-Apr-02 18-Jun-02<br />
Depth pH pH pH pH pH pH pH pH pH pH pH pH pH pH pH pH pH pH pH pH pH<br />
Ft pH units pH units pH units pH units pH units pH units pH units pH units pH units pH units pH units pH units pH units pH units pH units pH units pH units pH units pH units pH units pH units<br />
Surf 8.37 7.96 8.00 8.16 8.31 8.35 8.12 8.18 8.26 8.19 7.89 8.48 8.28 8.74 8.12 7.96 8.36 7.97 8.39<br />
5 8.14 7.95 7.91 8.12 8.16 8.33 8.11 8.18 8.25 8.22 7.88 8.44 8.16 8.50 7.69 7.90 8.26 7.90 8.35<br />
9 7.61<br />
10 7.81 7.93 7.61 8.03 8.13 8.24 8.07 8.13 8.25 8.12 7.86 8.43 7.88 7.80 7.82 7.97 7.74 7.84<br />
11 7.96 7.66<br />
12 7.52<br />
13 7.99<br />
13.8<br />
14<br />
14.1<br />
14.7<br />
15<br />
15.8<br />
Page 1 of 6
D.3-10<br />
Lake Merced<br />
North<br />
Depth<br />
Ft<br />
Surf<br />
5<br />
10<br />
14<br />
15<br />
16<br />
17<br />
17.4<br />
17.5<br />
18<br />
18.8<br />
19<br />
19.3<br />
19.9<br />
20<br />
20.6<br />
Lake Merced<br />
North East<br />
Depth<br />
Ft<br />
Surf<br />
5<br />
9<br />
10<br />
11<br />
12<br />
13<br />
13.8<br />
14<br />
14.1<br />
14.7<br />
15<br />
15.8<br />
23-Aug-02 23-Oct-02 11-Feb-03 14-May-03 15-Jul-03 30-Sep-03 2-Dec-03 27-May-04 29-Aug-04 27-Oct-04 9-Dec-04 9-Feb-05 18-Apr-05 23-Jun-05 17-Aug-05 28-Sep-05 31-Oct-05 29-Nov-05 29-Dec-05 23-Jan-06 01-Mar-06<br />
pH pH pH pH pH pH pH pH pH pH pH pH pH pH pH pH pH pH pH pH pH<br />
pH units pH units pH units pH units pH units pH units pH units pH units pH units pH units pH units pH units pH units pH units pH units pH units pH units pH units pH units pH units pH units<br />
8.08 8.29 8.23 8.47 8.51 7.81 7.47 8.26 8.42 7.79 8.17 8.53 8.69 8.28 8.29 8.51 8.10 7.89 8.17 8.07 8.26<br />
8.07 8.26 8.13 8.46 8.42 7.75 7.39 8.24 8.39 7.75 8.15 8.52 8.68 8.26 8.27 8.45 8.04 7.88 8.10 8.03 8.24<br />
8.07 8.26 8.10 8.47 7.99 7.71 7.35 8.21 8.38 7.76 8.13 8.49 8.66 8.23 8.26 8.08 8.23 7.87 8.08 8.04 8.23<br />
8.08 8.24 8.08 8.31 7.76 7.68 7.34 8.07 8.07 7.73 8.10 8.44 8.64 7.59 8.25 7.78 8.41 7.91 8.05 8.04 8.18<br />
7.94 7.33 8.25<br />
7.68 8.03 7.65 7.73 8.44 7.7<br />
8.08 8.62 8.63 7.95 7.80 8.03<br />
7.51 8.04<br />
23-Aug-02 23-Oct-02 11-Feb-03 14-May-03 15-Jul-03 30-Sep-03 2-Dec-03 27-May-04 29-Aug-04 27-Oct-04 9-Dec-04 9-Feb-05 18-Apr-05 23-Jun-05 17-Aug-05 28-Sep-05 31-Oct-05 29-Nov-05 29-Dec-05 23-Jan-06 01-Mar-06<br />
pH pH pH pH pH pH pH pH pH pH pH pH pH pH pH pH pH pH pH pH pH<br />
pH units pH units pH units pH units pH units pH units pH units pH units pH units pH units pH units pH units pH units pH units pH units pH units pH units pH units pH units pH units pH units<br />
8.03 8.20 7.99 7.91 8.19 7.70 7.41 8.39 8.16 7.65 8.11 8.40 8.81 8.00 8.22 8.25 n/a 7.80 8.11 7.91 8.29<br />
8.04 8.12 7.95 7.85 8.03 7.63 7.31 8.35 8.14 7.64 8.06 8.44 8.78 7.94 8.21 8.15 n/a 7.81 7.92 7.86 8.22<br />
8.05 8.10 7.80 7.85 7.55 7.57 7.29 8.15 7.98 7.63 8.03 8.43 8.60 7.55 8.17 7.72 n/a 7.86 7.79 7.85 8.03<br />
7.87 7.53<br />
7.80 7.60 8.09 7.61 n/a<br />
7.29 7.73 8.00 8.36 7.46 8.13 7.65 7.95 7.84<br />
8.52 7.67 7.92<br />
Page 2 of 6
Lake Merced<br />
North<br />
Depth<br />
Ft<br />
Surf<br />
5<br />
10<br />
14<br />
15<br />
16<br />
17<br />
17.4<br />
17.5<br />
18<br />
18.8<br />
19<br />
19.3<br />
19.9<br />
20<br />
20.6<br />
26-Apr-06 14-Jun-06 24-Aug-06 25-Oct-06 20-Dec-06 29-Mar-07 26-Jun-07 20-Aug-07 27-Dec-07 28-Mar-08 10-Jun-08 24-Sep-08 4-Dec-08 24-Mar-09 4-Jun-09 22-Sep-09 15-Dec-09<br />
pH pH pH pH pH pH pH pH pH pH pH pH pH pH pH pH pH<br />
pH units pH units pH units pH units pH units pH units pH units pH units pH units pH units pH units pH units pH units pH units pH units pH units pH units<br />
8.37 8.89 8.15 8.37 8.40 8.96 8.66 9.09 7.75 8.36 8.83 8.79 7.97 8.30 8.66 8.84 8.20<br />
8.31 8.75 8.13 8.36 8.31 8.77 8.62 8.72 7.75 8.32 8.67 8.39 7.92 8.30 8.62 8.84 8.13<br />
8.25 8.20 8.11 8.34 8.30 8.34 8.26 8.44 7.72 8.31 8.09 8.13 7.90 8.21 8.30 8.91 8.07<br />
8.04 8.10 8.08 8.31 8.30 8.22 8.03 8.08 7.64 8.32 7.99 8.02 7.86 8.19 8.19 8.99 8.07<br />
8.10 7.96<br />
7.84 7.97 8.03 8.29 8.00 7.66 7.64<br />
7.77<br />
7.85 7.85<br />
7.72 8.03<br />
8.12 8.17<br />
8.18<br />
8.15<br />
8.94<br />
D.3-11<br />
Lake Merced<br />
North East<br />
Depth<br />
Ft<br />
Surf<br />
5<br />
9<br />
10<br />
11<br />
12<br />
13<br />
13.8<br />
14<br />
14.1<br />
14.7<br />
15<br />
15.8<br />
26-Apr-06 14-Jun-06 24-Aug-06 25-Oct-06 20-Dec-06 29-Mar-07 26-Jun-07 20-Aug-07 27-Dec-07 28-Mar-08 10-Jun-08 24-Sep-08 4-Dec-08 24-Mar-09 4-Jun-09 22-Sep-09 15-Dec-09<br />
pH pH pH pH pH pH pH pH pH pH pH pH pH pH pH pH pH<br />
pH units pH units pH units pH units pH units pH units pH units pH units pH units pH units pH units pH units pH units pH units pH units pH units pH units<br />
8.08 8.35 8.05 8.23 8.13 8.87 8.36 8.83 7.49 8.15 8.59 8.55 7.66 8.26 8.44 8.62 8.09<br />
8.08 7.97 8.02 8.24 8.07 8.61 8.28 8.69 7.48 8.16 8.38 8.44 7.60 8.27 8.28 8.64 8.05<br />
8.06 7.88 7.93 8.24 8.05 8.20 7.99 8.01 7.42 8.10 7.72 7.82 7.60 8.25 8.23 8.59 8.09<br />
8.23 7.71 7.63<br />
8.64<br />
7.88 7.91 8.00<br />
7.57<br />
8.35 8.06<br />
7.95 8.06 7.98 7.72 7.43 8.01 7.92<br />
8.01<br />
Page 3 of 6
Lake Merced<br />
South - Pistol<br />
Range<br />
15-May-97 10-Sep-97 3-Dec-97 16-Mar-98 8-Jul-98 23-Sep-98 17-Mar-99 21-Jun-99 15-Sep-99 8-Dec-99 21-Mar-00 21-Jun-00 9-Aug-00 19-Dec-00 7-Mar-01 20-Jun-01 1-Oct-01 18-Dec-01 5-Mar-02 30-Apr-02 18-Jun-02<br />
Depth pH pH pH pH pH pH pH pH pH pH pH pH pH pH pH pH pH pH pH pH pH<br />
Ft pH units pH units pH units pH units pH units pH units pH units pH units pH units pH units pH units pH units pH units pH units pH units pH units pH units pH units pH units pH units pH units<br />
Surf 8.70 8.72 8.03 8.16 8.44 8.41 8.21 8.63 8.17 8.29 8.25 8.54 8.39 8.19 8.14 8.61 8.44 8.17 8.52 8.03 8.30<br />
5 8.41 8.67 8.03 8.42 8.22 8.16 8.63 8.13 8.33 8.46 8.47 8.18 8.16 8.10 8.60 8.39 8.16 8.49 8.03 8.26<br />
6 8.02<br />
10 8.02 7.91 8.03 8.41 8.16 8.11 8.58 8.12 8.31 8.53 8.20 8.11 8.15 8.05 8.01 7.96 8.11 8.35 8.03 8.24<br />
12 7.97<br />
15 7.66 7.77 8.00 7.78 8.00 8.09 8.32 8.12 8.18 8.49 7.56 8.22 8.14 7.94 7.61 7.53 8.06 8.18 7.93 8.24<br />
16 7.66 7.78 8.08 7.55 7.48 7.60 8.09<br />
17 7.72 8.17 8.01<br />
18 7.74 7.73 8.11 7.62 7.70 7.82 7.44<br />
18.2<br />
18.9<br />
19 7.75 8.06<br />
20 8.14 8.10<br />
20.1<br />
20.6<br />
20.8<br />
21<br />
21.5<br />
22<br />
D.3-12<br />
Lake Merced<br />
South - Pump<br />
Station<br />
15-May-97 10-Sep-97 3-Dec-97 16-Mar-98 8-Jul-98 23-Sep-98 17-Mar-99 21-Jun-99 15-Sep-99 8-Dec-99 21-Mar-00 21-Jun-00 9-Aug-00 19-Dec-00 7-Mar-01 20-Jun-01 1-Oct-01 18-Dec-01 5-Mar-02 30-Apr-02 18-Jun-02<br />
Depth pH pH pH pH pH pH pH pH pH pH pH pH pH pH pH pH pH pH pH pH pH<br />
Ft pH units pH units pH units pH units pH units pH units pH units pH units pH units pH units pH units pH units pH units pH units pH units pH units pH units pH units pH units pH units pH units<br />
Surf 8.70 8.62 7.99 8.29 8.70 8.46 8.28 8.70 8.53 8.33 8.29 8.66 8.33 8.17 8.19 8.63 8.40 8.18 8.55 8.04 8.41<br />
5 8.68 8.40 7.96 8.26 8.63 8.38 8.27 8.69 8.40 8.34 8.24 8.65 8.25 8.14 8.14 8.60 8.36 8.15 8.49 8.04 8.37<br />
10 8.22 7.85 7.94 8.57 8.33 8.20 8.68 8.37 8.28 8.24 7.86 8.30 8.13 8.03 8.17 8.10 8.14 8.08 7.89 8.36<br />
12 8.16<br />
15 7.92 7.73 7.93 7.85 8.32 8.18 8.46 8.37 8.19 8.18 7.52 8.48 8.13 7.89 7.66 7.52 8.10 7.92 7.91 8.36<br />
16 7.87 7.76 7.42 7.50<br />
17 8.10 8.35<br />
18 7.68 7.68 8.34 8.14 7.50 7.71 7.61 7.85 7.42<br />
19 8.13 8.29 7.93<br />
19.2<br />
20 7.84<br />
20.4<br />
21<br />
21.5<br />
22<br />
22.8<br />
23.2<br />
Page 4 of 6
Lake Merced<br />
South - Pistol<br />
Range<br />
Depth<br />
Ft<br />
Surf<br />
5<br />
6<br />
10<br />
12<br />
15<br />
16<br />
17<br />
18<br />
18.2<br />
18.9<br />
19<br />
20<br />
20.1<br />
20.6<br />
20.8<br />
21<br />
21.5<br />
22<br />
23-Aug-02 23-Oct-02 11-Feb-03 14-May-03 15-Jul-03 30-Sep-03 2-Dec-03 27-May-04 29-Aug-04 27-Oct-04 9-Dec-04 9-Feb-05 18-Apr-05 23-Jun-05 17-Aug-05 28-Sep-05 31-Oct-05 29-Nov-05 29-Dec-05 23-Jan-06 01-Mar-06<br />
pH pH pH pH pH pH pH pH pH pH pH pH pH pH pH pH pH pH pH pH pH<br />
pH units pH units pH units pH units pH units pH units pH units pH units pH units pH units pH units pH units pH units pH units pH units pH units pH units pH units pH units pH units pH units<br />
8.23 8.08 7.92 8.03 8.27 7.49 7.66 8.54 8.15 7.70 7.87 8.31 8.81 8.53 7.97 8.34 6.89 7.77 7.97 8.03 8.23<br />
8.21 8.06 7.91 8.01 8.21 7.48 7.63 8.51 8.08 7.69 7.83 8.21 8.78 8.50 7.95 8.32 6.85 7.77 7.95 8.01 8.21<br />
8.16 7.94 7.90 7.92 7.74 7.44 7.63 8.40 8.01 7.68 7.82 8.13 8.73 7.95 7.92 8.18 6.79 7.79 7.94 7.98 8.20<br />
8.14 7.94 7.84 7.71 7.47 7.44 7.62 7.90 7.84 7.67 7.82 8.19 8.73 7.53 7.88 7.68 6.78 7.81 7.92 7.95 8.19<br />
8.11 7.82<br />
7.96 7.42 7.63 7.79 8.12<br />
7.57 7.75 7.54 7.81 7.93<br />
7.47 7.61 7.76 7.75<br />
8.67 7.40 7.75 6.83 8.18<br />
D.3-13<br />
Lake Merced<br />
South - Pump<br />
Station<br />
Depth<br />
Ft<br />
Surf<br />
5<br />
10<br />
12<br />
15<br />
16<br />
17<br />
18<br />
19<br />
19.2<br />
20<br />
20.4<br />
21<br />
21.5<br />
22<br />
22.8<br />
23.2<br />
23-Aug-02 23-Oct-02 11-Feb-03 14-May-03 15-Jul-03 30-Sep-03 2-Dec-03 27-May-04 29-Aug-04 27-Oct-04 9-Dec-04 9-Feb-05 18-Apr-05 23-Jun-05 17-Aug-05 28-Sep-05 31-Oct-05 29-Nov-05 29-Dec-05 23-Jan-06 01-Mar-06<br />
pH pH pH pH pH pH pH pH pH pH pH pH pH pH pH pH pH pH pH pH pH<br />
pH units pH units pH units pH units pH units pH units pH units pH units pH units pH units pH units pH units pH units pH units pH units pH units pH units pH units pH units pH units pH units<br />
8.24 8.16 7.89 8.19 8.34 7.58 7.52 8.61 8.37 7.62 7.90 8.24 8.84 8.53 8.09 8.44 8.19 7.86 8.09 8.03 8.22<br />
8.22 8.15 7.86 8.18 8.32 7.48 7.47 8.60 8.36 7.61 7.88 8.17 8.81 8.49 8.07 8.24 8.15 7.84 8.03 8.00 8.19<br />
8.24 8.15 7.86 8.18 8.15 7.36 7.46 8.29 8.13 7.58 7.87 8.12 8.79 8.42 7.99 7.81 8.14 7.84 8.01 7.98 8.17<br />
8.24 8.14 7.87 8.00 7.74 7.31 7.46 8.02 7.66 7.52 7.85 7.93 8.77 7.49 7.78 7.58 6.83 7.86 7.91 7.97 8.16<br />
8.19<br />
8.14 7.45 7.52 7.93<br />
7.61<br />
7.83 7.31 7.56 7.84 6.90<br />
7.43 7.91 8.75 7.41 7.84 7.49 7.89 7.82 7.95 8.13<br />
8.74 8.12<br />
Page 5 of 6
Lake Merced<br />
South - Pistol<br />
Range<br />
Depth<br />
Ft<br />
Surf<br />
5<br />
6<br />
10<br />
12<br />
15<br />
16<br />
17<br />
18<br />
18.2<br />
18.9<br />
19<br />
20<br />
20.1<br />
20.6<br />
20.8<br />
21<br />
21.5<br />
22<br />
26-Apr-06 14-Jun-06 24-Aug-06 25-Oct-06 20-Dec-06 29-Mar-07 26-Jun-07 20-Aug-07 27-Dec-07 28-Mar-08 10-Jun-08 24-Sep-08 4-Dec-08 24-Mar-09 4-Jun-09 22-Sep-09 15-Dec-09<br />
pH pH pH pH pH pH pH pH pH pH pH pH pH pH pH pH pH<br />
pH units pH units pH units pH units pH units pH units pH units pH units pH units pH units pH units pH units pH units pH units pH units pH units pH units<br />
8.19 8.53 7.97 8.20 8.26 8.67 8.24 8.60 7.91 8.14 8.32 8.70 7.85 8.07 8.40 8.56 8.01<br />
8.15 8.49 7.94 8.18 8.17 8.66 8.20 8.48 7.85 8.13 8.24 8.64 7.83 8.08 8.36 8.54 7.97<br />
8.10 8.32 7.90 8.16 8.06 8.53 8.05 8.17 7.84 8.12 8.10 8.03 7.82 8.04 8.18 8.54 7.94<br />
8.06 7.90 7.88 8.13 8.04 8.27 7.99 7.88 7.83 8.13 8.02 7.90 7.81 8.04 8.03 8.29 7.90<br />
7.96 7.80<br />
7.90 7.79 7.83 8.08 8.20 7.62 7.59 7.78 8.13 7.49 8.03 8.05<br />
7.53<br />
7.58<br />
7.95<br />
7.78 8.20 7.59 7.69<br />
8.17<br />
7.60<br />
8.37<br />
7.85<br />
D.3-14<br />
Lake Merced<br />
South - Pump<br />
Station<br />
Depth<br />
Ft<br />
Surf<br />
5<br />
10<br />
12<br />
15<br />
16<br />
17<br />
18<br />
19<br />
19.2<br />
20<br />
20.4<br />
21<br />
21.5<br />
22<br />
22.8<br />
23.2<br />
26-Apr-06 14-Jun-06 24-Aug-06 25-Oct-06 20-Dec-06 29-Mar-07 26-Jun-07 20-Aug-07 27-Dec-07 28-Mar-08 10-Jun-08 24-Sep-08 4-Dec-08 24-Mar-09 4-Jun-09 22-Sep-09 15-Dec-09<br />
pH pH pH pH pH pH pH pH pH pH pH pH pH pH pH pH pH<br />
pH units pH units pH units pH units pH units pH units pH units pH units pH units pH units pH units pH units pH units pH units pH units pH units pH units<br />
8.49 8.57 8.06 8.19 8.23 8.60 8.33 8.66 7.84 8.13 8.39 8.63 7.86 8.43 8.49 8.57 8.06<br />
8.44 8.52 8.04 8.16 8.18 8.57 8.27 8.64 7.84 8.13 8.28 8.60 7.82 8.43 8.49 8.56 8.05<br />
8.42 8.05 8.04 8.09 8.10 8.38 7.94 8.15 7.78 8.14 8.19 7.93 7.79 8.44 8.20 8.15 8.05<br />
8.35 7.93 8.01 7.87 8.04 8.11 7.80 7.92 7.79 8.14 7.70 7.88 7.78 8.52 7.99 8.10 8.05<br />
7.89<br />
8.11 7.81 8.04 8.07 7.72 7.77 7.79 8.17 7.65 7.81 8.61 7.90<br />
7.77 7.86 7.71 7.83 7.49 7.56 7.74<br />
8.02 8.05 8.11 7.70<br />
8.19<br />
8.57<br />
7.89<br />
8.16<br />
8.05<br />
Page 6 of 6
Lake Merced<br />
North<br />
15-May-97 10-Sep-97 3-Dec-97 16-Mar-98 8-Jul-98 23-Sep-98 17-Mar-99 21-Jun-99 15-Sep-99 8-Dec-99 21-Mar-00 21-Jun-00 9-Aug-00 19-Dec-00 7-Mar-01 20-Jun-01 1-Oct-01 18-Dec-01 5-Mar-02 30-Apr-02<br />
Depth Cond Cond Cond Cond Cond Cond Cond Cond Cond Cond Cond Cond Cond Cond Cond Cond Cond Cond Cond Cond<br />
Ft mmho/cm mmho/cm mmho/cm mmho/cm mmho/cm mmho/cm mmho/cm mmho/cm mmho/cm mmho/cm mmho/cm mmho/cm mmho/cm mmho/cm mmho/cm mmho/cm mmho/cm mmho/cm mmho/cm mmho/cm<br />
Surf 742 842 888 864 728 774 726 793 851 711 729 755 780 738 808 861 811 757 755<br />
5 744 844 902 883 728 757 726 795 850 712 734 760 781 736 807 866 812 757 757<br />
10 754 855 917 974 728 761 727 795 862 714 737 762 781 740 826 874 814 760 766<br />
14 796 864 778 881<br />
15 758 871 919 1020 737 764 729 724 753 764 743 834 812 763 769<br />
16 757 882 1070 742 766 769<br />
17<br />
17.4<br />
17.5<br />
18 949 716<br />
18.8<br />
19<br />
19.3<br />
19.9<br />
20<br />
20.6<br />
D.3-15<br />
Lake Merced<br />
North East<br />
15-May-97 10-Sep-97 3-Dec-97 16-Mar-98 8-Jul-98 23-Sep-98 17-Mar-99 21-Jun-99 15-Sep-99 8-Dec-99 21-Mar-00 21-Jun-00 9-Aug-00 19-Dec-00 7-Mar-01 20-Jun-01 1-Oct-01 18-Dec-01 5-Mar-02 30-Apr-02<br />
Depth Cond Cond Cond Cond Cond Cond Cond Cond Cond Cond Cond Cond Cond Cond Cond Cond Cond Cond Cond Cond<br />
Ft mmho/cm mmho/cm mmho/cm mmho/cm mmho/cm mmho/cm mmho/cm mmho/cm mmho/cm mmho/cm mmho/cm mmho/cm mmho/cm mmho/cm mmho/cm mmho/cm mmho/cm mmho/cm mmho/cm mmho/cm<br />
Surf 716 818 736 706 762 689 784 822 664 724 749 745 686 787 832 753 693 722<br />
5 718 821 741 706 763 689 784 824 667 728 756 745 687 792 835 753 695 724<br />
9 843<br />
10 720 822 742 706 763 690 784 834 670 731 764 746 689 803 754 697 727<br />
11 697 726<br />
12 747<br />
13 684<br />
13.8<br />
14<br />
14.1<br />
14.7<br />
15<br />
15.8<br />
Page 1 of 6
Lake Merced<br />
North<br />
Depth<br />
Ft<br />
Surf<br />
5<br />
10<br />
14<br />
15<br />
16<br />
17<br />
17.4<br />
17.5<br />
18<br />
18.8<br />
19<br />
19.3<br />
19.9<br />
20<br />
20.6<br />
18-Jun-02 23-Aug-02 23-Oct-02 11-Feb-03 14-May-03 15-Jul-03 30-Sep-03 2-Dec-03 27-May-04 29-Aug-04 27-Oct-04 9-Dec-04 9-Feb-05 18-Apr-05 23-Jun-05 17-Aug-05 28-Sep-05 31-Oct-05 29-Nov-05 29-Dec-05<br />
Cond Cond Cond Cond Cond Cond Cond Cond Cond Cond Cond Cond Cond Cond Cond Cond Cond Cond Cond Cond<br />
mmho/cm mmho/cm mmho/cm mmho/cm mmho/cm mmho/cm mmho/cm mmho/cm mmho/cm mmho/cm mmho/cm mmho/cm mmho/cm mmho/cm mmho/cm mmho/cm mmho/cm mmho/cm mmho/cm mmho/cm<br />
755 802 820 753 747 778 674 633 717 342 752 717 673 676 703 745 794 781 806 678<br />
757 803 821 753 748 779 638 647 717 613 755 717 675 676 703 746 795 730 806 680<br />
759 803 821 754 748 787 639 642 717 613 759 718 677 675 703 745 799 734 807 681<br />
769 804 822 754 752 792 640 644 718 620 760 724 679 675 704 745 801 734 806 682<br />
769 759 646 745<br />
640 724 627 760 679 806<br />
723 675 732 807 692<br />
716<br />
D.3-16<br />
Lake Merced<br />
North East<br />
Depth<br />
Ft<br />
Surf<br />
5<br />
9<br />
10<br />
11<br />
12<br />
13<br />
13.8<br />
14<br />
14.1<br />
14.7<br />
15<br />
15.8<br />
18-Jun-02 23-Aug-02 23-Oct-02 11-Feb-03 14-May-03 15-Jul-03 30-Sep-03 2-Dec-03 27-May-04 29-Aug-04 27-Oct-04 9-Dec-04 9-Feb-05 18-Apr-05 23-Jun-05 17-Aug-05 28-Sep-05 31-Oct-05 29-Nov-05 29-Dec-05<br />
Cond Cond Cond Cond Cond Cond Cond Cond Cond Cond Cond Cond Cond Cond Cond Cond Cond Cond Cond Cond<br />
mmho/cm mmho/cm mmho/cm mmho/cm mmho/cm mmho/cm mmho/cm mmho/cm mmho/cm mmho/cm mmho/cm mmho/cm mmho/cm mmho/cm mmho/cm mmho/cm mmho/cm mmho/cm mmho/cm mmho/cm<br />
740 775 785 696 711 754 650 640 709 613 750 716 667 666 702 742 794 n/a 795 664<br />
741 775 786 697 712 756 651 644 709 612 750 724 668 665 702 742 796 n/a 795 668<br />
748 776 787 697 712 761 651 645 712 614 750 731 672 665 703 743 800 n/a 795 672<br />
712 765<br />
697 651 714 752 n/a<br />
646 609 726 670 710 744 806 796<br />
667 683<br />
Page 2 of 6
Lake Merced<br />
North<br />
Depth<br />
Ft<br />
Surf<br />
5<br />
10<br />
14<br />
15<br />
16<br />
17<br />
17.4<br />
17.5<br />
18<br />
18.8<br />
19<br />
19.3<br />
19.9<br />
20<br />
20.6<br />
23-Jan-06 01-Mar-06 26-Apr-06 14-Jun-06 24-Aug-06 25-Oct-06 20-Dec-06 29-Mar-07 26-Jun-07 20-Aug-07 27-Dec-07 28-Mar-08 10-Jun-08 24-Sep-08 4-Dec-08 24-Mar-09 4-Jun-09 22-Sep-09 15-Dec-09<br />
Cond Cond Cond Cond Cond Cond Cond Cond Cond Cond Cond Cond Cond Cond Cond Cond Cond Cond Cond<br />
mmho/cm mmho/cm mmho/cm mmho/cm mmho/cm mmho/cm mmho/cm mmho/cm mmho/cm mmho/cm mmho/cm mmho/cm mmho/cm mmho/cm mmho/cm mmho/cm mmho/cm mmho/cm mmho/cm<br />
658 700 634 666 717 733 596 563 724 717 731 696 713 774 809 751 774 692 697<br />
660 699 634 669 717 733 593 565 726 724 731 696 718 786 810 751 774 697 697<br />
661 699 635 675 718 734 594 567 734 732 731 697 730 790 810 752 780 704 698<br />
662 698 638 677 718 735 594 569 738 736 732 697 731 792 811 753 781 717 698<br />
662 744 740<br />
699 656 696 720 593 576 753 732<br />
798<br />
811<br />
736 698<br />
702 753<br />
703<br />
782<br />
726<br />
D.3-17<br />
Lake Merced<br />
North East<br />
Depth<br />
Ft<br />
Surf<br />
5<br />
9<br />
10<br />
11<br />
12<br />
13<br />
13.8<br />
14<br />
14.1<br />
14.7<br />
15<br />
15.8<br />
23-Jan-06 01-Mar-06 26-Apr-06 14-Jun-06 24-Aug-06 25-Oct-06 20-Dec-06 29-Mar-07 26-Jun-07 20-Aug-07 27-Dec-07 28-Mar-08 10-Jun-08 24-Sep-08 4-Dec-08 24-Mar-09 4-Jun-09 22-Sep-09 15-Dec-09<br />
Cond Cond Cond Cond Cond Cond Cond Cond Cond Cond Cond Cond Cond Cond Cond Cond Cond Cond Cond<br />
mmho/cm mmho/cm mmho/cm mmho/cm mmho/cm mmho/cm mmho/cm mmho/cm mmho/cm mmho/cm mmho/cm mmho/cm mmho/cm mmho/cm mmho/cm mmho/cm mmho/cm mmho/cm mmho/cm<br />
649 690 646 678 725 739 598 565 735 730 724.3 697 726 780 796 738 770 692 679<br />
651 690 645 678 726 740 600 568 738 732 724.5 696 731 782 796 738 773 695 679<br />
652 692 645 679 727 740 597 569 743 740 724.9 697 738 792 796 739 773 703 678<br />
652 740 744 799<br />
718<br />
696 682 727 749<br />
796<br />
739 679<br />
647 597 573 749 726.8 697 777<br />
697<br />
Page 3 of 6
Lake Merced<br />
South - Pistol<br />
Range<br />
15-May-97 10-Sep-97 3-Dec-97 16-Mar-98 8-Jul-98 23-Sep-98 17-Mar-99 21-Jun-99 15-Sep-99 8-Dec-99 21-Mar-00 21-Jun-00 9-Aug-00 19-Dec-00 7-Mar-01 20-Jun-01 1-Oct-01 18-Dec-01 5-Mar-02 30-Apr-02<br />
Depth Cond Cond Cond Cond Cond Cond Cond Cond Cond Cond Cond Cond Cond Cond Cond Cond Cond Cond Cond Cond<br />
Ft mmho/cm mmho/cm mmho/cm mmho/cm mmho/cm mmho/cm mmho/cm mmho/cm mmho/cm mmho/cm mmho/cm mmho/cm mmho/cm mmho/cm mmho/cm mmho/cm mmho/cm mmho/cm mmho/cm mmho/cm<br />
Surf 490 573 639 590 547 585 560 565 597 635 557 580 599 620 600 673 707 667 639 648<br />
5 492 573 664 547 585 558 565 597 643 563 584 603 620 600 673 707 667 626 649<br />
6 603<br />
10 492 576 674 547 585 558 565 597 646 562 588 605 619 599 671 710 668 627 650<br />
12 613<br />
15 494 578 689 550 584 555 567 597 650 562 598 606 619 600 674 713 668 629 652<br />
16 494 580 619 675 714 665<br />
17 494 650 630<br />
18 621 552 596 599 605 601 660<br />
18.2<br />
18.9<br />
19 629 557<br />
20 568 560<br />
20.1<br />
20.6<br />
20.8<br />
21<br />
21.5<br />
22<br />
D.3-18<br />
Lake Merced<br />
South - Pump<br />
Station<br />
15-May-97 10-Sep-97 3-Dec-97 16-Mar-98 8-Jul-98 23-Sep-98 17-Mar-99 21-Jun-99 15-Sep-99 8-Dec-99 21-Mar-00 21-Jun-00 9-Aug-00 19-Dec-00 7-Mar-01 20-Jun-01 1-Oct-01 18-Dec-01 5-Mar-02 30-Apr-02<br />
Depth Cond Cond Cond Cond Cond Cond Cond Cond Cond Cond Cond Cond Cond Cond Cond Cond Cond Cond Cond Cond<br />
Ft mmho/cm mmho/cm mmho/cm mmho/cm mmho/cm mmho/cm mmho/cm mmho/cm mmho/cm mmho/cm mmho/cm mmho/cm mmho/cm mmho/cm mmho/cm mmho/cm mmho/cm mmho/cm mmho/cm mmho/cm<br />
Surf 490 574 594 555 544 585 561 565 595 637 588 579 598 619 601 674 708 668 639 646<br />
5 490 575 595 554 545 584 561 565 597 639 587 580 601 620 601 673 707 666 639 647<br />
10 492 577 594 546 585 561 566 597 642 587 595 600 620 601 671 709 666 641 648<br />
12 560<br />
15 493 578 594 548 585 561 566 597 646 588 591 605 620 601 674 712 666 641 649<br />
16 493 579 715 673<br />
17 620<br />
18 563 552 597 647 668 602 678 643 651<br />
19 561 567 601<br />
19.2<br />
20 599<br />
20.4<br />
21<br />
21.5<br />
22<br />
22.8<br />
23.2<br />
Page 4 of 6
D.3-19<br />
Lake Merced<br />
South - Pistol<br />
Range<br />
Depth<br />
Ft<br />
Surf<br />
5<br />
6<br />
10<br />
12<br />
15<br />
16<br />
17<br />
18<br />
18.2<br />
18.9<br />
19<br />
20<br />
20.1<br />
20.6<br />
20.8<br />
21<br />
21.5<br />
22<br />
Lake Merced<br />
South - Pump<br />
Station<br />
Depth<br />
Ft<br />
Surf<br />
5<br />
10<br />
12<br />
15<br />
16<br />
17<br />
18<br />
19<br />
19.2<br />
20<br />
20.4<br />
21<br />
21.5<br />
22<br />
22.8<br />
23.2<br />
18-Jun-02 23-Aug-02 23-Oct-02 11-Feb-03 14-May-03 15-Jul-03 30-Sep-03 2-Dec-03 27-May-04 29-Aug-04 27-Oct-04 9-Dec-04 9-Feb-05 18-Apr-05 23-Jun-05 17-Aug-05 28-Sep-05 31-Oct-05 29-Nov-05 29-Dec-05<br />
Cond Cond Cond Cond Cond Cond Cond Cond Cond Cond Cond Cond Cond Cond Cond Cond Cond Cond Cond Cond<br />
mmho/cm mmho/cm mmho/cm mmho/cm mmho/cm mmho/cm mmho/cm mmho/cm mmho/cm mmho/cm mmho/cm mmho/cm mmho/cm mmho/cm mmho/cm mmho/cm mmho/cm mmho/cm mmho/cm mmho/cm<br />
659 683 630 602 594 622 437 434 411 454 538 490 532 517 533 535 616 522 625 536<br />
659 684 632 602 594 624 522 455 461 455 538 490 532 517 533 536 592 524 624 537<br />
660 684 645 602 595 627 522 441 463 452 538 466 535 516 534 537 593 528 625 538<br />
660 684 646 603 596 628 522 441 465 454 539 461 535 517 534 538 595 526 626 539<br />
659 684 603<br />
647 629 540 453 536<br />
597 450 601 627<br />
522 440 470 540<br />
517 538 539 528<br />
18-Jun-02 23-Aug-02 23-Oct-02 11-Feb-03 14-May-03 15-Jul-03 30-Sep-03 2-Dec-03 27-May-04 29-Aug-04 27-Oct-04 9-Dec-04 9-Feb-05 18-Apr-05 23-Jun-05 17-Aug-05 28-Sep-05 31-Oct-05 29-Nov-05 29-Dec-05<br />
Cond Cond Cond Cond Cond Cond Cond Cond Cond Cond Cond Cond Cond Cond Cond Cond Cond Cond Cond Cond<br />
mmho/cm mmho/cm mmho/cm mmho/cm mmho/cm mmho/cm mmho/cm mmho/cm mmho/cm mmho/cm mmho/cm mmho/cm mmho/cm mmho/cm mmho/cm mmho/cm mmho/cm mmho/cm mmho/cm mmho/cm<br />
659 684 620 598 592 621 436 431 469 525 538 449 532 515 533 536 611 546 619 537<br />
659 684 621 598 593 622 437 444 467 525 538 443 531 515 533 536 612 529 620 538<br />
660 684 621 598 593 623 436 453 466 527 538 444 531 515 533 537 613 535 620 539<br />
660 685 621 598 594 624 438 451 468 529 539 443 532 515 532 540 614 533 621 540<br />
685<br />
660 621 627 539 533<br />
595<br />
598 438 532 444 533<br />
450 468 515 534 527 616 621 541<br />
515<br />
Page 5 of 6
D.3-20<br />
Lake Merced<br />
South - Pistol<br />
Range<br />
Depth<br />
Ft<br />
Surf<br />
5<br />
6<br />
10<br />
12<br />
15<br />
16<br />
17<br />
18<br />
18.2<br />
18.9<br />
19<br />
20<br />
20.1<br />
20.6<br />
20.8<br />
21<br />
21.5<br />
22<br />
Lake Merced<br />
South - Pump<br />
Station<br />
Depth<br />
Ft<br />
Surf<br />
5<br />
10<br />
12<br />
15<br />
16<br />
17<br />
18<br />
19<br />
19.2<br />
20<br />
20.4<br />
21<br />
21.5<br />
22<br />
22.8<br />
23.2<br />
23-Jan-06 01-Mar-06 26-Apr-06 14-Jun-06 24-Aug-06 25-Oct-06 20-Dec-06 29-Mar-07 26-Jun-07 20-Aug-07 27-Dec-07 28-Mar-08 10-Jun-08 24-Sep-08 4-Dec-08 24-Mar-09 4-Jun-09 22-Sep-09 15-Dec-09<br />
Cond Cond Cond Cond Cond Cond Cond Cond Cond Cond Cond Cond Cond Cond Cond Cond Cond Cond Cond<br />
mmho/cm mmho/cm mmho/cm mmho/cm mmho/cm mmho/cm mmho/cm mmho/cm mmho/cm mmho/cm mmho/cm mmho/cm mmho/cm mmho/cm mmho/cm mmho/cm mmho/cm mmho/cm mmho/cm<br />
529 569 542 562 600 564 520 473 610 611 612 597.6 623 662 685.2 656 682 611 610<br />
530 569 542 562 600 564 524 474 613 613 613 597.4 623 663 685.4 655 681 613 610<br />
531 569 542 562 609 564 525 474 615 613 613 597.3 623 669 685.3 656 682 614 610<br />
532 569 543 563 607 564 528 479 616 614 614 597.2 622 670 685.5 656 683 620 610<br />
533<br />
566 685.3<br />
567 544 564 609 522 481 618 616 614 597.2 624 656 683<br />
702<br />
652<br />
683<br />
564 482 617 613<br />
597<br />
619<br />
23-Jan-06 01-Mar-06 26-Apr-06 14-Jun-06 24-Aug-06 25-Oct-06 20-Dec-06 29-Mar-07 26-Jun-07 20-Aug-07 27-Dec-07 28-Mar-08 10-Jun-08 24-Sep-08 4-Dec-08 24-Mar-09 4-Jun-09 22-Sep-09 15-Dec-09<br />
Cond Cond Cond Cond Cond Cond Cond Cond Cond Cond Cond Cond Cond Cond Cond Cond Cond Cond Cond<br />
mmho/cm mmho/cm mmho/cm mmho/cm mmho/cm mmho/cm mmho/cm mmho/cm mmho/cm mmho/cm mmho/cm mmho/cm mmho/cm mmho/cm mmho/cm mmho/cm mmho/cm mmho/cm mmho/cm<br />
531 569 538 562 594 566 498 475 610 612 613 597 624 662 684 656 682 610 611<br />
531 569 539 562 595 566 500 476 612 611 613 598 623 662 684 655 681 610 610<br />
532 568 539 564 595 566 500 476 615 614 613 597 623 669 685 655 683 618 611<br />
533 568 540 563 596 568 502 479 616 614 613 597 625 670 685 656 684 618 610<br />
570<br />
533 567 541 564 501 481 617 614 614 597 625 670 655 684<br />
566 564 598 615 613 625 684 686<br />
542 500 481 621<br />
598<br />
656<br />
685<br />
625<br />
623<br />
610<br />
611<br />
Page 6 of 6
Lake Merced<br />
North<br />
15-May-97 10-Sep-97 3-Dec-97 16-Mar-98 8-Jul-98 23-Sep-98 17-Mar-99 21-Jun-99 15-Sep-99 8-Dec-99 21-Mar-00 21-Jun-00 9-Aug-00 19-Dec-00 7-Mar-01 20-Jun-01 1-Oct-01 18-Dec-01 5-Mar-02 30-Apr-02<br />
Depth TDS TDS TDS TDS TDS TDS TDS TDS TDS TDS TDS TDS TDS TDS TDS TDS TDS TDS TDS TDS<br />
Ft mg/L mg/L mg/L mg/L mg/L mg/L mg/L mg/L mg/L mg/L mg/L mg/L mg/L mg/L mg/L mg/L mg/L mg/L mg/L mg/L<br />
Surf 569 518 466 495 465 508 544 455 466 484 499 472 517 551 519 485 483<br />
5 578 530 466 484 465 509 544 456 470 486 500 471 517 554 520 485 484<br />
10 587 584 466 487 465 509 551 457 471 488 500 474 529 560 521 486 490<br />
14 509 553 498 564<br />
15 588 612 472 489 466 463 482 489 475 534 520 488 492<br />
16 642 475 490 492<br />
17<br />
17.4<br />
17.5<br />
18 608 459<br />
18.8<br />
19<br />
19.3<br />
19.9<br />
20<br />
20.6<br />
D.3-21<br />
Lake Merced<br />
North East<br />
15-May-97 10-Sep-97 3-Dec-97 16-Mar-98 8-Jul-98 23-Sep-98 17-Mar-99 21-Jun-99 15-Sep-99 8-Dec-99 21-Mar-00 21-Jun-00 9-Aug-00 19-Dec-00 7-Mar-01 20-Jun-01 1-Oct-01 18-Dec-01 5-Mar-02 30-Apr-02<br />
Depth TDS TDS TDS TDS TDS TDS TDS TDS TDS TDS TDS TDS TDS TDS TDS TDS TDS TDS TDS TDS<br />
Ft mg/L mg/L mg/L mg/L mg/L mg/L mg/L mg/L mg/L mg/L mg/L mg/L mg/L mg/L mg/L mg/L mg/L mg/L mg/L mg/L<br />
Surf 524 442 452 488 441 502 526 426 464 479 477 439 503 533 482 444 462<br />
5 525 445 452 488 441 502 527 427 466 484 477 440 507 534 482 445 463<br />
9 539<br />
10 526 445 452 488 442 502 533 429 468 489 478 441 514 482 446 465<br />
11 446 464<br />
12 448<br />
13 438<br />
13.8<br />
14<br />
14.1<br />
14.7<br />
15<br />
15.8<br />
Page 1 of 6
D.3-22<br />
Lake Merced<br />
North<br />
Depth<br />
Ft<br />
Surf<br />
5<br />
10<br />
14<br />
15<br />
16<br />
17<br />
17.4<br />
17.5<br />
18<br />
18.8<br />
19<br />
19.3<br />
19.9<br />
20<br />
20.6<br />
Lake Merced<br />
North East<br />
Depth<br />
Ft<br />
Surf<br />
5<br />
9<br />
10<br />
11<br />
12<br />
13<br />
13.8<br />
14<br />
14.1<br />
14.7<br />
15<br />
15.8<br />
18-Jun-02 23-Aug-02 23-Oct-02 11-Feb-03 14-May-03 15-Jul-03 30-Sep-03 2-Dec-03 27-May-04 29-Aug-04 27-Oct-04 9-Dec-04 9-Feb-05 18-Apr-05 23-Jun-05 17-Aug-05 28-Sep-05 31-Oct-05 29-Nov-05 29-Dec-05 23-Jan-06<br />
TDS TDS TDS TDS TDS TDS TDS TDS TDS TDS TDS TDS TDS TDS TDS TDS TDS TDS TDS TDS TDS<br />
mg/L mg/L mg/L mg/L mg/L mg/L mg/L mg/L mg/L mg/L mg/L mg/L mg/L mg/L mg/L mg/L mg/L mg/L mg/L mg/L mg/L<br />
483 514 525 482 478 498 431 405 459 219 482 459 431 432 450 477 508 500 516 434 421<br />
485 514 525 482 479 499 408 414 459 393 483 459 432 432 450 477 509 467 516 435 422<br />
486 514 525 482 479 504 409 411 459 392 485 459 433 432 450 477 511 470 516 436 423<br />
492 514 526 483 481 507 410 412 460 397 486 463 435 432 451 477 513 469 516 436 423<br />
492 485 414 477<br />
410 463 401 487 435 516<br />
462 432 469 516 443 424<br />
18-Jun-02 23-Aug-02 23-Oct-02 11-Feb-03 14-May-03 15-Jul-03 30-Sep-03 2-Dec-03 27-May-04 29-Aug-04 27-Oct-04 9-Dec-04 9-Feb-05 18-Apr-05 23-Jun-05 17-Aug-05 28-Sep-05 31-Oct-05 29-Nov-05 29-Dec-05 23-Jan-06<br />
TDS TDS TDS TDS TDS TDS TDS TDS TDS TDS TDS TDS TDS TDS TDS TDS TDS TDS TDS TDS TDS<br />
mg/L mg/L mg/L mg/L mg/L mg/L mg/L mg/L mg/L mg/L mg/L mg/L mg/L mg/L mg/L mg/L mg/L mg/L mg/L mg/L mg/L<br />
474 496 502 446 455 483 416 409 454 392 458 426 426 449 475 508 n/a 509 425 415<br />
474 496 503 446 456 484 417 412 454 392 463 427 426 449 475 509 n/a 509 427 416<br />
479 497 504 446 456 487 417 413 455 393 468 429 426 450 475 512 n/a 509 430 417<br />
456 490<br />
446 417 457 n/a<br />
413 390 465 429 454 476 516 509 418<br />
458<br />
427 437<br />
Page 2 of 6
D.3-23<br />
Lake Merced<br />
North<br />
Depth<br />
Ft<br />
Surf<br />
5<br />
10<br />
14<br />
15<br />
16<br />
17<br />
17.4<br />
17.5<br />
18<br />
18.8<br />
19<br />
19.3<br />
19.9<br />
20<br />
20.6<br />
Lake Merced<br />
North East<br />
Depth<br />
Ft<br />
Surf<br />
5<br />
9<br />
10<br />
11<br />
12<br />
13<br />
13.8<br />
14<br />
14.1<br />
14.7<br />
15<br />
15.8<br />
01-Mar-06 26-Apr-06 14-Jun-06 24-Aug-06 25-Oct-06 20-Dec-06 29-Mar-07 26-Jun-07 20-Aug-07 27-Dec-07 28-Mar-08 10-Jun-08 24-Sep-08 4-Dec-08 24-Mar-09 4-Jun-09 22-Sep-09 15-Dec-09<br />
TDS TDS TDS TDS TDS TDS TDS TDS TDS TDS TDS TDS TDS TDS TDS TDS TDS TDS<br />
mg/L mg/L mg/L mg/L mg/L mg/L mg/L mg/L mg/L mg/L mg/L mg/L mg/L mg/L mg/L mg/L mg/L mg/L<br />
448 406 426 459 469 382 360 463 459 468 446 456 495 518 481 495 443 446<br />
448 406 428 459 469 380 362 465 463 468 446 460 503 518 481 495 446 446<br />
448 406 432 459 470 380 363 470 468 468 446 467 505 518 481 499 451 447<br />
447 409 433 459 470 380 364 472 470 468 446 468 507 519 482 500 459 447<br />
476 473<br />
448 420 445 461 379 369 482 468<br />
511<br />
519<br />
471 447<br />
449 482<br />
450<br />
01-Mar-06 26-Apr-06 14-Jun-06 24-Aug-06 25-Oct-06 20-Dec-06 29-Mar-07 26-Jun-07 20-Aug-07 27-Dec-07 28-Mar-08 10-Jun-08 24-Sep-08 4-Dec-08 24-Mar-09 4-Jun-09 22-Sep-09 15-Dec-09<br />
TDS TDS TDS TDS TDS TDS TDS TDS TDS TDS TDS TDS TDS TDS TDS TDS TDS TDS<br />
mg/L mg/L mg/L mg/L mg/L mg/L mg/L mg/L mg/L mg/L mg/L mg/L mg/L mg/L mg/L mg/L mg/L mg/L<br />
442 413 434 464 473 383 362 470 467 464 446 465 499 510 472 493 443 434<br />
442 413 434 465 474 384 363 472 468 464 446 468 501 510 472 495 445 434<br />
443 413 434 465 473 382 364 476 474 464 446 472 507 510 473 495 450 434<br />
474 476 511<br />
459<br />
445 436 465 479<br />
510<br />
473 434<br />
414 382 366 479 465 446 497<br />
446<br />
501<br />
465<br />
Page 3 of 6
Lake Merced<br />
South - Pistol<br />
Range<br />
15-May-97 10-Sep-97 3-Dec-97 16-Mar-98 8-Jul-98 23-Sep-98 17-Mar-99 21-Jun-99 15-Sep-99 8-Dec-99 21-Mar-00 21-Jun-00 9-Aug-00 19-Dec-00 7-Mar-01 20-Jun-01 1-Oct-01 18-Dec-01 5-Mar-02 30-Apr-02<br />
Depth TDS TDS TDS TDS TDS TDS TDS TDS TDS TDS TDS TDS TDS TDS TDS TDS TDS TDS TDS TDS<br />
Ft mg/L mg/L mg/L mg/L mg/L mg/L mg/L mg/L mg/L mg/L mg/L mg/L mg/L mg/L mg/L mg/L mg/L mg/L mg/L mg/L<br />
Surf 409 354 350 375 358 361 382 406 357 371 383 397 384 431 452 427 409 415<br />
5 425 350 374 358 361 382 412 360 374 386 397 384 431 452 427 400 415<br />
6 362<br />
10 431 350 374 357 362 382 413 360 377 387 396 384 430 454 427 401 416<br />
12 368<br />
15 441 352 374 355 363 382 416 360 383 388 396 384 432 456 427 402 417<br />
16 396 432 457 425<br />
17 416 403<br />
18 373 353 381 384 388 384 422<br />
18.2<br />
18.9<br />
19 377 356<br />
20 363 358<br />
20.1<br />
20.6<br />
20.8<br />
21<br />
21.5<br />
22<br />
D.3-24<br />
Lake Merced<br />
South - Pump<br />
Station<br />
15-May-97 10-Sep-97 3-Dec-97 16-Mar-98 8-Jul-98 23-Sep-98 17-Mar-99 21-Jun-99 15-Sep-99 8-Dec-99 21-Mar-00 21-Jun-00 9-Aug-00 19-Dec-00 7-Mar-01 20-Jun-01 1-Oct-01 18-Dec-01 5-Mar-02 30-Apr-02<br />
Depth TDS TDS TDS TDS TDS TDS TDS TDS TDS TDS TDS TDS TDS TDS TDS TDS TDS TDS TDS TDS<br />
Ft mg/L mg/L mg/L mg/L mg/L mg/L mg/L mg/L mg/L mg/L mg/L mg/L mg/L mg/L mg/L mg/L mg/L mg/L mg/L mg/L<br />
Surf 380 333 348 374 359 362 381 408 376 370 383 396 385 431 453 427 409 414<br />
5 381 332 349 374 359 362 382 409 376 371 384 397 384 431 453 426 409 414<br />
10 380 349 374 359 362 382 411 376 381 384 397 384 429 454 426 410 415<br />
12 336<br />
15 380 351 374 359 362 382 414 376 377 387 397 385 431 456 426 410 416<br />
16 458 431<br />
17 397<br />
18 338 353 382 414 427 385 434 412 417<br />
19 359 363 385<br />
19.2<br />
20 383<br />
20.4<br />
21<br />
21.5<br />
22<br />
22.8<br />
23.2<br />
Page 4 of 6
D.3-25<br />
Lake Merced<br />
South - Pistol<br />
Range<br />
Depth<br />
Ft<br />
Surf<br />
5<br />
6<br />
10<br />
12<br />
15<br />
16<br />
17<br />
18<br />
18.2<br />
18.9<br />
19<br />
20<br />
20.1<br />
20.6<br />
20.8<br />
21<br />
21.5<br />
22<br />
Lake Merced<br />
South - Pump<br />
Station<br />
Depth<br />
Ft<br />
Surf<br />
5<br />
10<br />
12<br />
15<br />
16<br />
17<br />
18<br />
19<br />
19.2<br />
20<br />
20.4<br />
21<br />
21.5<br />
22<br />
22.8<br />
23.2<br />
18-Jun-02 23-Aug-02 23-Oct-02 11-Feb-03 14-May-03 15-Jul-03 30-Sep-03 2-Dec-03 27-May-04 29-Aug-04 27-Oct-04 9-Dec-04 9-Feb-05 18-Apr-05 23-Jun-05 17-Aug-05 28-Sep-05 31-Oct-05 29-Nov-05 29-Dec-05 23-Jan-06<br />
TDS TDS TDS TDS TDS TDS TDS TDS TDS TDS TDS TDS TDS TDS TDS TDS TDS TDS TDS TDS TDS<br />
mg/L mg/L mg/L mg/L mg/L mg/L mg/L mg/L mg/L mg/L mg/L mg/L mg/L mg/L mg/L mg/L mg/L mg/L mg/L mg/L mg/L<br />
422 437 403 385 380 398 280 278 265 291 344 314 340 331 341 342 394 334 400 343 338<br />
422 438 405 385 380 399 334 291 295 291 344 313 340 331 341 343 379 335 400 344 339<br />
422 438 413 385 381 401 334 282 296 289 345 298 343 330 342 344 380 338 400 345 340<br />
422 438 413 386 381 402 334 282 297 290 345 295 343 331 342 344 381 336 401 345 341<br />
422 438 386<br />
414 402 346 290 343<br />
382 288 384 401 341<br />
334 282 301 346<br />
331 344 345 338<br />
18-Jun-02 23-Aug-02 23-Oct-02 11-Feb-03 14-May-03 15-Jul-03 30-Sep-03 2-Dec-03 27-May-04 29-Aug-04 27-Oct-04 9-Dec-04 9-Feb-05 18-Apr-05 23-Jun-05 17-Aug-05 28-Sep-05 31-Oct-05 29-Nov-05 29-Dec-05 23-Jan-06<br />
TDS TDS TDS TDS TDS TDS TDS TDS TDS TDS TDS TDS TDS TDS TDS TDS TDS TDS TDS TDS TDS<br />
mg/L mg/L mg/L mg/L mg/L mg/L mg/L mg/L mg/L mg/L mg/L mg/L mg/L mg/L mg/L mg/L mg/L mg/L mg/L mg/L mg/L<br />
422 438 397 383 379 397 279 276 300 336 344 287 340 330 341 342 391 350 396 344 340<br />
422 438 397 383 379 398 279 284 299 336 344 284 340 330 341 343 392 339 397 344 340<br />
422 438 397 383 379 398 279 290 298 337 344 284 340 330 341 344 393 342 397 345 341<br />
422 438 397 383 380 399 280 289 300 339 345 284 341 330 341 346 393 341 397 346 341<br />
438<br />
422 398 401 345 341<br />
381<br />
383 280 340 284 341<br />
288 299 330 342 342 394 397 346 341<br />
330<br />
Page 5 of 6
Lake Merced<br />
South - Pistol<br />
Range<br />
Depth<br />
Ft<br />
Surf<br />
5<br />
6<br />
10<br />
12<br />
15<br />
16<br />
17<br />
18<br />
18.2<br />
18.9<br />
19<br />
20<br />
20.1<br />
20.6<br />
20.8<br />
21<br />
21.5<br />
22<br />
01-Mar-06 26-Apr-06 14-Jun-06 24-Aug-06 25-Oct-06 20-Dec-06 29-Mar-07 26-Jun-07 20-Aug-07 27-Dec-07 28-Mar-08 10-Jun-08 24-Sep-08 4-Dec-08 24-Mar-09 4-Jun-09 22-Sep-09 15-Dec-09<br />
TDS TDS TDS TDS TDS TDS TDS TDS TDS TDS TDS TDS TDS TDS TDS TDS TDS TDS<br />
mg/L mg/L mg/L mg/L mg/L mg/L mg/L mg/L mg/L mg/L mg/L mg/L mg/L mg/L mg/L mg/L mg/L mg/L<br />
364 347 360 384 361 333 303 391 391 392 382 399 423 439 420 436 391 390<br />
364 347 359 384 361 335 304 392 392 393 382 399 424 439 419 436 392 390<br />
364 347 360 389 361 336 304 393 392 393 382 399 428 439 420 437 393 390<br />
364 347 361 389 361 338 307 394 393 393 382 398 429 439 420 437 397 390<br />
362 439<br />
363 348 361 390 334 308 396 394 393 382 399 420 437<br />
449<br />
418<br />
437<br />
361 309 394 392<br />
382<br />
396<br />
400<br />
391<br />
D.3-26<br />
Lake Merced<br />
South - Pump<br />
Station<br />
Depth<br />
Ft<br />
Surf<br />
5<br />
10<br />
12<br />
15<br />
16<br />
17<br />
18<br />
19<br />
19.2<br />
20<br />
20.4<br />
21<br />
21.5<br />
22<br />
22.8<br />
23.2<br />
01-Mar-06 26-Apr-06 14-Jun-06 24-Aug-06 25-Oct-06 20-Dec-06 29-Mar-07 26-Jun-07 20-Aug-07 27-Dec-07 28-Mar-08 10-Jun-08 24-Sep-08 4-Dec-08 24-Mar-09 4-Jun-09 22-Sep-09 15-Dec-09<br />
TDS TDS TDS TDS TDS TDS TDS TDS TDS TDS TDS TDS TDS TDS TDS TDS TDS TDS<br />
mg/L mg/L mg/L mg/L mg/L mg/L mg/L mg/L mg/L mg/L mg/L mg/L mg/L mg/L mg/L mg/L mg/L mg/L<br />
364 345 359 380 362 319 304 391 391 392 382 399 424 438 420 436 390 391<br />
364 345 359 381 362 320 305 392 391 392 382 399 424 438 419 436 390 391<br />
364 345 361 381 362 321 305 393 393 392 382 399 428 438 419 437 396 391<br />
364 345 361 381 364 321 307 394 393 393 382 400 429 438 420 437 396 391<br />
365<br />
363 346 361 321 308 395 393 393 382 400 429 419 438<br />
362 361 383 394 393 400 438 439<br />
347 320 308 398<br />
383<br />
420<br />
438<br />
398<br />
391<br />
Page 6 of 6
Lake Merced<br />
North<br />
15-May-97 10-Sep-97 3-Dec-97 16-Mar-98 8-Jul-98 23-Sep-98 17-Mar-99 21-Jun-99 15-Sep-99 8-Dec-99 21-Mar-00 21-Jun-00 9-Aug-00 19-Dec-00 7-Mar-01 20-Jun-01 1-Oct-01 18-Dec-01 5-Mar-02 30-Apr-02 18-Jun-02<br />
Depth DO DO DO DO DO DO DO DO DO DO DO DO DO DO DO DO DO DO DO DO DO<br />
Ft mg/L mg/L mg/L mg/L mg/L mg/L mg/L mg/L mg/L mg/L mg/L mg/L mg/L mg/L mg/L mg/L mg/L mg/L mg/L mg/L mg/L<br />
Surf 14.5 10.2 6.7 9.6 9.3 8.6 9.1 7.6 7.9 7.7 10.8 7.3 7.9 9.9 13.1 13.0 9.4 10.6 11.0 10.8<br />
5 10.0 9.8 5.2 9.5 9.1 6.4 9.0 6.2 7.1 7.3 9.2 6.4 7.5 9.0 12.5 8.8 8.0 10.3 10.2 9.3<br />
10 2.0 2.4 4.7 4.9 8.5 4.2 7.6 6.2 6.6 7.1 8.9 5.9 7.3 6.4 0.4 3.1 8.2 6.3 4.4 8.2<br />
14 5.7 6.6 4.4 0.7<br />
15 0.5 0.2 4.7 0.37 3.4 1.1 6.2 6.7 1.0 4.6 3.8 0.6 8.6 1.5 2.5 1.2<br />
16 0.2 0.2 0.27 3.9 0.6 1.2 1.1<br />
17<br />
17.4<br />
17.5<br />
18 4.5 0.1<br />
18.8<br />
19<br />
19.3<br />
19.9<br />
20<br />
20.6<br />
D.3-27<br />
Lake Merced<br />
North East<br />
15-May-97 10-Sep-97 3-Dec-97 16-Mar-98 8-Jul-98 23-Sep-98 17-Mar-99 21-Jun-99 15-Sep-99 8-Dec-99 21-Mar-00 21-Jun-00 9-Aug-00 19-Dec-00 7-Mar-01 20-Jun-01 1-Oct-01 18-Dec-01 5-Mar-02 30-Apr-02 18-Jun-02<br />
Depth DO DO DO DO DO DO DO DO DO DO DO DO DO DO DO DO DO DO DO DO DO<br />
Ft mg/L mg/L mg/L mg/L mg/L mg/L mg/L mg/L mg/L mg/L mg/L mg/L mg/L mg/L mg/L mg/L mg/L mg/L mg/L mg/L mg/L<br />
Surf 11.5 5.9 8.0 6.9 7.6 9.5 6.8 9.5 8.7 7.6 6.0 9.7 9.5 11.1 8.1 9.6 8.8 9.1 10.0<br />
5 9.1 5.7 7.3 6.5 6.1 9.3 6.6 9.0 8.1 7.3 5.2 9.3 8.5 7.0 2.7 9.3 8.2 8.1 9.1<br />
9 1.2<br />
10 3.0 5.4 3.2 5.6 5.7 8.5 6.1 8.1 7.2 5.9 4.7 9.0 6.4 0.4 8.9 3.6 5.5 3.2<br />
11 3.3 2.0<br />
12 0.86<br />
13 0.1<br />
13.8<br />
14<br />
14.1<br />
14.7<br />
15<br />
15.8<br />
Page 1 of 6
Lake Merced<br />
North<br />
Depth<br />
Ft<br />
Surf<br />
5<br />
10<br />
14<br />
15<br />
16<br />
17<br />
17.4<br />
17.5<br />
18<br />
18.8<br />
19<br />
19.3<br />
19.9<br />
20<br />
20.6<br />
23-Aug-02 23-Oct-02 11-Feb-03 14-May-03 15-Jul-03 30-Sep-03 2-Dec-03 27-May-04 29-Aug-04 27-Oct-04 9-Dec-04 9-Feb-05 18-Apr-05 23-Jun-05 28-Sep-05 31-Oct-05 29-Nov-05 29-Dec-05 23-Jan-06 01-Mar-06 26-Apr-06<br />
DO DO DO DO DO DO DO DO DO DO DO DO DO DO DO DO DO DO DO DO DO<br />
mg/L mg/L mg/L mg/L mg/L mg/L mg/L mg/L mg/L mg/L mg/L mg/L mg/L mg/L mg/L mg/L mg/L mg/L mg/L mg/L mg/L<br />
6.3 6.6 9.6 9.7 10.8 6.7 8.7 5.8 9.4 8.1 8.2 7.9 7.0 7.1 11.3 8.6 7.4 8.5 8.1 8.1 8.5<br />
6.1 6.3 8.4 9.4 9.4 5.7 5.9 5.4 9.0 6.4 7.6 7.8 6.8 7.0 10.5 6.6 7.0 7.8 7.5 7.8 8.0<br />
5.9 6.2 8.0 9.2 3.2 5.1 4.1 5.1 8.9 6.6 6.9 7.6 6.8 6.8 6.5 6.1 6.8 7.5 7.5 7.8 7.5<br />
5.8 5.8 7.4 7.2 0.3 4.7 3.5 2.4 5.2 5.9 5.3 6.9 6.6 0.2 2.6 5.9 6.9 6.9 7.6 7.3 5.0<br />
3.8 3.5<br />
4.6 0.9 0.2 5.7 6.8<br />
4.1 6.5 3.5 7.5<br />
0.2 4.9 0.3<br />
D.3-28<br />
Lake Merced<br />
North East<br />
Depth<br />
Ft<br />
Surf<br />
5<br />
9<br />
10<br />
11<br />
12<br />
13<br />
13.8<br />
14<br />
14.1<br />
14.7<br />
15<br />
15.8<br />
23-Aug-02 23-Oct-02 11-Feb-03 14-May-03 15-Jul-03 30-Sep-03 2-Dec-03 27-May-04 29-Aug-04 27-Oct-04 9-Dec-04 9-Feb-05 18-Apr-05 23-Jun-05 28-Sep-05 31-Oct-05 29-Nov-05 29-Dec-05 23-Jan-06 01-Mar-06 26-Apr-06<br />
DO DO DO DO DO DO DO DO DO DO DO DO DO DO DO DO DO DO DO DO DO<br />
mg/L mg/L mg/L mg/L mg/L mg/L mg/L mg/L mg/L mg/L mg/L mg/L mg/L mg/L mg/L mg/L mg/L mg/L mg/L mg/L mg/L<br />
8.5 8.7 10.1 7.4 9.6 7.4 9.1 7.6 8.3 8.1 9.5 9.1 8.0 6.6 9.9 7.8 9.4 7.9 9.6 7.9<br />
8.4 7.6 9.6 6.9 7.7 6.5 5.9 7.2 7.9 7.7 7.6 9.3 7.8 5.9 8.7 7.6 7.5 7.3 9.2 8.0<br />
7.7 7.5 7.7 6.6 1.4 5.4 4.1 4.7 5.7 7.6 5.6 9.1 6.4 1.2 3.1 7.3 5.6 6.9 6.6 7.7<br />
6.7 0.8<br />
6.7 5.7 3.4 5.8<br />
4.1 0.2 0.3 8.2 0.2 6.7<br />
4.9 3.3 3.8<br />
5.6<br />
Page 2 of 6
Lake Merced<br />
North<br />
Depth<br />
Ft<br />
Surf<br />
5<br />
10<br />
14<br />
15<br />
16<br />
17<br />
17.4<br />
17.5<br />
18<br />
18.8<br />
19<br />
19.3<br />
19.9<br />
20<br />
20.6<br />
14-Jun-06 24-Aug-06 25-Oct-06 20-Dec-06 29-Mar-07 26-Jun-07 20-Aug-07 27-Dec-07 28-Mar-08 10-Jun-08 24-Sep-08 4-Dec-08 24-Mar-09 4-Jun-09 22-Sep-09 15-Dec-09<br />
DO DO DO DO DO DO DO DO DO DO DO DO DO DO DO DO<br />
mg/L mg/L mg/L mg/L mg/L mg/L mg/L mg/L mg/L mg/L mg/L mg/L mg/L mg/L mg/L mg/L<br />
12.3 6.5 5.5 8.2 9.8 10.2 17.9 8.2 8.9 17.9 13.4 5.9 9.3 13.5 10.5 8.9<br />
10.5 6.4 5.3 8.0 8.1 9.4 9.4 8.1 8.5 14.1 6.1 4.9 9.2 12.5 6.5 7.7<br />
3.7 6.1 5.1 7.9 5.8 4.8 6.6 7.7 8.3 4.4 2.5 4.5 7.3 6.6 1.3 7.1<br />
2.2 6.0 5.1 7.9 4.8 2.5 2.7 6.2 8.0 3.2 0.1 3.7 7.0 4.9 0.3 6.8<br />
0.8 0.5<br />
0.3 5.7 7.7 1.1 0.5 6.3<br />
0.1<br />
3.7 3.7<br />
0.9 6.7<br />
0.6 5.5<br />
0.4<br />
2.4<br />
0.3<br />
D.3-29<br />
Lake Merced<br />
North East<br />
Depth<br />
Ft<br />
Surf<br />
5<br />
9<br />
10<br />
11<br />
12<br />
13<br />
13.8<br />
14<br />
14.1<br />
14.7<br />
15<br />
15.8<br />
14-Jun-06 24-Aug-06 25-Oct-06 20-Dec-06 29-Mar-07 26-Jun-07 20-Aug-07 27-Dec-07 28-Mar-08 10-Jun-08 24-Sep-08 4-Dec-08 24-Mar-09 4-Jun-09 22-Sep-09 15-Dec-09<br />
DO DO DO DO DO DO DO DO DO DO DO DO DO DO DO DO<br />
mg/L mg/L mg/L mg/L mg/L mg/L mg/L mg/L mg/L mg/L mg/L mg/L mg/L mg/L mg/L mg/L<br />
8.9 7.5 6.5 7.0 10.5 9.6 14.0 6.37 8.7 14.3 12.7 4.9 8.6 11.5 9.7 9.8<br />
4.8 7.1 6.5 6.9 8.0 8.2 10.9 6.20 8.8 10.4 10.6 4.0 8.2 9.1 7.2 8.9<br />
3.3 6.0 6.5 6.7 5.7 5.2 3.9 5.38 7.9 2.8 1.8 4.0 6.7 8.1 1.0 8.9<br />
6.4 0.7 0.1<br />
0.4<br />
1.1 4.8 0.3<br />
3.9<br />
0.8 6.0<br />
6.6 1.4 1.6 0.58 6.5 3.0<br />
6.2<br />
Page 3 of 6
Lake Merced<br />
South - Pistol<br />
15-May-97 10-Sep-97 3-Dec-97 16-Mar-98 8-Jul-98 23-Sep-98 17-Mar-99 21-Jun-99 15-Sep-99 8-Dec-99 21-Mar-00 21-Jun-00 9-Aug-00 19-Dec-00 7-Mar-01 20-Jun-01 1-Oct-01 18-Dec-01 5-Mar-02 30-Apr-02 18-Jun-02<br />
Depth DO DO DO DO DO DO DO DO DO DO DO DO DO DO DO DO DO DO DO DO DO<br />
Ft mg/L mg/L mg/L mg/L mg/L mg/L mg/L mg/L mg/L mg/L mg/L mg/L mg/L mg/L mg/L mg/L mg/L mg/L mg/L mg/L mg/L<br />
0 12.4 8.5 7.4 8.6 8.7 7.9 8.9 8.0 6.6 9.8 9.2 9.4 7.9 7.4 9.0 9.5 11.2 9.5 9.8 9.9 8.0<br />
5 9.2 7.9 7.3 8.5 6.6 8.6 7.9 6.4 9.7 8.8 8.2 6.2 7.3 8.5 9.3 10.4 9.2 9.7 9.8 7.7<br />
6 7.9<br />
10 6.7 1.6 7.3 8.4 6.1 8.3 7.5 6.2 9.5 8.4 6.0 5.6 7.2 8.1 5.2 6.5 8.7 8.7 9.3 7.5<br />
12 7.5<br />
15 3.5 0.2 6.6 4.6 4.9 8.2 5.9 6.2 8.5 7.7 0.1 5.5 7.0 7.2 1.3 1.9 8.3 6.7 8.3 7.0<br />
16 3.3 0.2 6.8 1.2 1.4 0.4 1.7<br />
17 3.4 8.7 1.6<br />
18 5.5 4.5 6.3 0.1 0.05 6.2 0.2<br />
18.2<br />
18.9<br />
19 5.4 8.1<br />
20 4.7 0.2<br />
20.1<br />
20.6<br />
20.8<br />
21<br />
21.5<br />
22<br />
D.3-30<br />
Lake Merced<br />
South -<br />
15-May-97 10-Sep-97 3-Dec-97 16-Mar-98 8-Jul-98 23-Sep-98 17-Mar-99 21-Jun-99 15-Sep-99 8-Dec-99 21-Mar-00 21-Jun-00 9-Aug-00 19-Dec-00 7-Mar-01 20-Jun-01 1-Oct-01 18-Dec-01 5-Mar-02 30-Apr-02 18-Jun-02<br />
Depth DO DO DO DO DO DO DO DO DO DO DO DO DO DO DO DO DO DO DO DO DO<br />
Ft mg/L mg/L mg/L mg/L mg/L mg/L mg/L mg/L mg/L mg/L mg/L mg/L mg/L mg/L mg/L mg/L mg/L mg/L mg/L mg/L mg/L<br />
Surf 12.2 7.6 6.8 9.2 10.1 8.0 9.5 8.3 9.0 10.2 8.8 10.5 8.9 6.8 9.2 9.7 10.7 10.1 10.0 9.8 8.7<br />
5 12.1 5.0 6.6 9.2 9.7 7.4 9.4 8.2 7.7 9.8 8.6 10.0 7.7 6.7 8.8 9.3 10.2 9.7 9.9 9.8 8.6<br />
10 7.8 1.9 6.3 9.1 7.0 8.9 7.9 7.6 9.6 8.4 3.3 7.4 6.6 8.2 6.3 7.7 9.6 6.0 8.1 8.2<br />
12 8.7<br />
15 5.5 0.2 6.2 4.9 6.9 8.8 6.6 7.7 8.9 7.8 0.1 7.1 6.3 6.5 1.6 2.0 9.2 3.0 7.9 8.0<br />
16 4.5 0.2 1.1 0.6<br />
17 6.1 7.5<br />
18 4.4 3.2 7.4 8.7 0.1 4.6 0.7 0.5 0.1<br />
19 8.3 5.2 0.1<br />
19.2<br />
20 0.1<br />
20.4<br />
21<br />
21.5<br />
22<br />
22.8<br />
23.2<br />
Note: Bold, italicized formats indicate half the reported value for statistical purposes.<br />
Page 4 of 6
Lake Merced<br />
South - Pistol<br />
Depth<br />
Ft<br />
0<br />
5<br />
6<br />
10<br />
12<br />
15<br />
16<br />
17<br />
18<br />
18.2<br />
18.9<br />
19<br />
20<br />
20.1<br />
20.6<br />
20.8<br />
21<br />
21.5<br />
22<br />
23-Aug-02 23-Oct-02 11-Feb-03 14-May-03 15-Jul-03 30-Sep-03 2-Dec-03 27-May-04 29-Aug-04 27-Oct-04 9-Dec-04 9-Feb-05 18-Apr-05 23-Jun-05 28-Sep-05 31-Oct-05 29-Nov-05 29-Dec-05 23-Jan-06 01-Mar-06 26-Apr-06<br />
DO DO DO DO DO DO DO DO DO DO DO DO DO DO DO DO DO DO DO DO DO<br />
mg/L mg/L mg/L mg/L mg/L mg/L mg/L mg/L mg/L mg/L mg/L mg/L mg/L mg/L mg/L mg/L mg/L mg/L mg/L mg/L mg/L<br />
8.0 6.5 10.1 8.5 9.8 6.7 9.1 8.3 7.5 7.4 8.1 9.5 8.0 8.1 9.9 8.6 8.3 8.9 9.1 8.8 8.1<br />
7.8 6.2 10.0 8.4 9.1 6.7 8.4 8.0 6.9 7.1 7.3 8.8 7.9 8.1 9.6 8.1 8.3 8.7 8.9 8.8 7.9<br />
7.4 5.2 10.0 7.7 5.5 6.3 8.1 7.5 6.4 6.7 6.8 8.2 7.6 5.3 8.6 7.0 8.2 8.7 8.7 8.8 7.7<br />
6.7 4.9 9.6 5.9 2.6 6.2 7.9 3.2 4.9 6.5 6.5 8.6 7.6 2.2 4.2 6.6 8.2 8.6 8.6 8.7 7.4<br />
5.8 9.3<br />
3.2 2.0 3.8 3.7 7.8<br />
4.5 3.5 8.6<br />
5.8 7.8 0.3 7.4<br />
7.2 8.6 5.9<br />
D.3-31<br />
Lake Merced<br />
South -<br />
Depth<br />
Ft<br />
Surf<br />
5<br />
10<br />
12<br />
15<br />
16<br />
17<br />
18<br />
19<br />
19.2<br />
20<br />
20.4<br />
21<br />
21.5<br />
22<br />
22.8<br />
23.2<br />
23-Aug-02 23-Oct-02 11-Feb-03 14-May-03 15-Jul-03 30-Sep-03 2-Dec-03 27-May-04 29-Aug-04 27-Oct-04 9-Dec-04 9-Feb-05 18-Apr-05 23-Jun-05 28-Sep-05 31-Oct-05 29-Nov-05 29-Dec-05 23-Jan-06 01-Mar-06 26-Apr-06<br />
DO DO DO DO DO DO DO DO DO DO DO DO DO DO DO DO DO DO DO DO DO<br />
mg/L mg/L mg/L mg/L mg/L mg/L mg/L mg/L mg/L mg/L mg/L mg/L mg/L mg/L mg/L mg/L mg/L mg/L mg/L mg/L mg/L<br />
7.9 7.3 9.4 9.5 9.9 7.6 9.0 8.8 9.6 6.5 7.9 9.5 8.1 8.3 10.5 8.8 8.5 9.0 9.2 8.8 9.7<br />
7.6 7.2 9.2 9.4 9.4 6.5 8.0 8.6 9.3 6.1 7.5 9.0 7.9 8.1 8.6 8.2 8.2 8.7 8.8 8.6 9.5<br />
7.7 7.2 9.1 9.3 8.0 4.8 7.7 6.6 7.2 5.5 6.5 9.0 7.8 7.7 6.0 7.2 8.1 8.5 8.6 8.4 9.4<br />
7.6 7.1 9.2 7.8 4.6 3.9 7.6 4.4 3.0 3.6 6.1 7.0 7.8 1.9 2.6 5.0 8.1 7.8 8.7 8.3 8.9<br />
7.0<br />
6.9 1.2 3.5 6.9<br />
4.7<br />
8.5 3.9 0.3 5.3<br />
7.0 2.0 7.6 7.6 8.7 8.0 7.3<br />
7.6 7.9<br />
6.4<br />
Page 5 of 6
Lake Merced<br />
South - Pistol<br />
Depth<br />
Ft<br />
0<br />
5<br />
6<br />
10<br />
12<br />
15<br />
16<br />
17<br />
18<br />
18.2<br />
18.9<br />
19<br />
20<br />
20.1<br />
20.6<br />
20.8<br />
21<br />
21.5<br />
22<br />
14-Jun-06 24-Aug-06 25-Oct-06 20-Dec-06 29-Mar-07 26-Jun-07 20-Aug-07 27-Dec-07 28-Mar-08 10-Jun-08 24-Sep-08 4-Dec-08 24-Mar-09 4-Jun-09 22-Sep-09 15-Dec-09<br />
DO DO DO DO DO DO DO DO DO DO DO DO DO DO DO DO<br />
mg/L mg/L mg/L mg/L mg/L mg/L mg/L mg/L mg/L mg/L mg/L mg/L mg/L mg/L mg/L mg/L<br />
9.4 6.5 7.1 8.4 9.1 8.4 11.5 10.9 8.9 11.5 11.9 7.1 10.0 10.5 9.8 9.8<br />
9.1 6.2 7.0 8.4 8.9 7.7 10.1 10.2 9.0 10.9 10.9 6.7 9.9 9.9 8.0 9.5<br />
8.2 5.9 7.0 7.7 8.8 6.8 8.0 10.1 8.6 10.2 4.5 6.6 9.2 8.0 6.7 9.3<br />
5.0 5.9 6.7 7.4 8.5 6.7 5.2 10.0 8.5 9.5 3.0 6.4 9.1 6.6 0.3 8.7<br />
4.1 6.3<br />
3.6 5.9 4.4 7.2 3.2 1.5 9.7 8.2 0.6 8.3 6.5<br />
0.2<br />
2.8<br />
0.7<br />
3.3 6.9 1.4 9.3<br />
7.9<br />
1.9<br />
0.4<br />
7.8<br />
D.3-32<br />
Lake Merced<br />
South -<br />
Depth<br />
Ft<br />
Surf<br />
5<br />
10<br />
12<br />
15<br />
16<br />
17<br />
18<br />
19<br />
19.2<br />
20<br />
20.4<br />
21<br />
21.5<br />
22<br />
22.8<br />
23.2<br />
14-Jun-06 24-Aug-06 25-Oct-06 20-Dec-06 29-Mar-07 26-Jun-07 20-Aug-07 27-Dec-07 28-Mar-08 10-Jun-08 24-Sep-08 4-Dec-08 24-Mar-09 4-Jun-09 22-Sep-09 15-Dec-09<br />
DO DO DO DO DO DO DO DO DO DO DO DO DO DO DO DO<br />
mg/L mg/L mg/L mg/L mg/L mg/L mg/L mg/L mg/L mg/L mg/L mg/L mg/L mg/L mg/L mg/L<br />
9.7 6.2 6.6 7.8 8.6 8.9 11.8 10.9 9.2 11.7 11.2 8.4 10.2 10.9 11.0 9.22<br />
9.4 6.0 6.4 7.6 8.5 8.0 11.5 10.9 9.3 11.0 10.6 8.0 9.7 10.8 9.8 9.12<br />
5.9 6.0 5.5 7.3 6.7 6.0 7.4 10.2 9.3 10.3 3.7 7.7 9.6 7.8 2.3 8.86<br />
4.7 5.9 0.7 7.2 6.2 4.5 5.3 10.0 9.2 6.3 3.3 7.6 9.5 5.2 0.3 8.65<br />
0.5<br />
3.3 7.2 6.1 3.7 3.4 9.9 9.2 5.4 2.6 9.4 3.6<br />
2.4 4.0 3.2 9.9 0.5 0.2 7.2<br />
7.1 5.7 2.1<br />
9.0<br />
0.5<br />
0.4<br />
0.4<br />
8.59<br />
Page 6 of 6
Lake Merced<br />
North<br />
15-May-97 10-Sep-97 3-Dec-97 16-Mar-98 8-Jul-98 23-Sep-98 17-Mar-99 21-Jun-99 15-Sep-99 8-Dec-99 21-Mar-00 21-Jun-00 9-Aug-00 19-Dec-00 7-Mar-01 20-Jun-01 1-Oct-01 18-Dec-01 5-Mar-02 30-Apr-02<br />
Depth ORP ORP ORP ORP ORP ORP ORP ORP ORP ORP ORP ORP ORP ORP ORP ORP ORP ORP ORP ORP<br />
Ft mV mV mV mV mV mV mV mV mV mV mV mV mV mV mV mV mV mV mV mV<br />
Surf 295 186 305 274 290 264 395 352 328 191 202 269 302 366 166 232 319 261 215<br />
5 302 173 305 262 286 251 394 353 328 178 192 271 293 366 159 233 318 253 205<br />
10 319 138 305 231 280 232 393 352 329 168 168 269 276 364 47 236 315 234 176<br />
14 353 330 240 231<br />
15 328 9 305 206 271 202 393 141 128 267 359 25 308 188 136<br />
16 329 13 205 354 94 40<br />
17<br />
17.4<br />
17.5<br />
18 309 54<br />
18.8<br />
19<br />
19.3<br />
19.9<br />
20<br />
20.6<br />
D.3-33<br />
Lake Merced<br />
North East<br />
15-May-97 10-Sep-97 3-Dec-97 16-Mar-98 8-Jul-98 23-Sep-98 17-Mar-99 21-Jun-99 15-Sep-99 8-Dec-99 21-Mar-00 21-Jun-00 9-Aug-00 19-Dec-00 7-Mar-01 20-Jun-01 1-Oct-01 18-Dec-01 5-Mar-02 30-Apr-02<br />
Depth ORP ORP ORP ORP ORP ORP ORP ORP ORP ORP ORP ORP ORP ORP ORP ORP ORP ORP ORP ORP<br />
Ft mV mV mV mV mV mV mV mV mV mV mV mV mV mV mV mV mV mV mV mV<br />
Surf 338 281 262 315 299 423 344 278 186 346 253 296 351 169 223 272 268 218<br />
5 347 276 253 315 297 424 343 265 166 341 252 284 349 143 223 264 264 203<br />
9 214<br />
10 361 271 244 315 297 426 343 236 110 335 249 265 343 44 246 241 168<br />
11 207 62<br />
12 237<br />
13 -48<br />
13.8<br />
14<br />
14.1<br />
14.7<br />
15<br />
15.8<br />
Page 1 of 6
Lake Merced<br />
North<br />
Depth<br />
Ft<br />
Surf<br />
5<br />
10<br />
14<br />
15<br />
16<br />
17<br />
17.4<br />
17.5<br />
18<br />
18.8<br />
19<br />
19.3<br />
19.9<br />
20<br />
20.6<br />
18-Jun-02 23-Aug-02 23-Oct-02 11-Feb-03 14-May-03 15-Jul-03 30-Sep-03 2-Dec-03 27-May-04 29-Aug-04 27-Oct-04 9-Dec-04 9-Feb-05 18-Apr-05 23-Jun-05 17-Aug-05 28-Sep-05 31-Oct-05 29-Nov-05 29-Dec-05 23-Jan-06<br />
ORP ORP ORP ORP ORP ORP ORP ORP ORP ORP ORP ORP ORP ORP ORP ORP ORP ORP ORP ORP ORP<br />
mV mV mV mV mV mV mV mV mV mV mV mV mV mV mV mV mV mV mV mV mV<br />
457 451 528 547 540 470 498 473 437 299 373 330 328 323 173 378 265 427 319 298 228<br />
455 451 528 547 540 471 498 474 436 294 372 330 323 309 169 378 258 419 316 297 229<br />
451 450 527 547 538 473 498 475 435 287 371 331 313 304 151 377 248 391 309 296 229<br />
443 446 525 544 537 471 497 475 429 268 370 332 303 298 102 376 233 367 297 293 229<br />
332 530 475 373<br />
497 409 69 368 293 219<br />
334 290 338 281 295 228<br />
-3<br />
D.3-34<br />
Lake Merced<br />
North East<br />
Depth<br />
Ft<br />
Surf<br />
5<br />
9<br />
10<br />
11<br />
12<br />
13<br />
13.8<br />
14<br />
14.1<br />
14.7<br />
15<br />
15.8<br />
18-Jun-02 23-Aug-02 23-Oct-02 11-Feb-03 14-May-03 15-Jul-03 30-Sep-03 2-Dec-03 27-May-04 29-Aug-04 27-Oct-04 9-Dec-04 9-Feb-05 18-Apr-05 23-Jun-05 17-Aug-05 28-Sep-05 31-Oct-05 29-Nov-05 29-Dec-05 23-Jan-06<br />
ORP ORP ORP ORP ORP ORP ORP ORP ORP ORP ORP ORP ORP ORP ORP ORP ORP ORP ORP ORP ORP<br />
mV mV mV mV mV mV mV mV mV mV mV mV mV mV mV mV mV mV mV mV mV<br />
416 438 529 542 538 469 494 474 442 205 339 276 319 275 147 374 264 n/a 289 239 216<br />
376 433 529 541 538 469 493 475 441 186 333 269 313 259 132 374 257 n/a 276 228 211<br />
323 397 529 540 537 468 491 474 442 143 325 256 304 244 71 374 236 n/a 255 214 202<br />
535 448<br />
533 485 441 314 n/a<br />
471 55 213 290 -21 374 218 227 184<br />
198 190<br />
Page 2 of 6
Lake Merced<br />
North<br />
Depth<br />
Ft<br />
Surf<br />
5<br />
10<br />
14<br />
15<br />
16<br />
17<br />
17.4<br />
17.5<br />
18<br />
18.8<br />
19<br />
19.3<br />
19.9<br />
20<br />
20.6<br />
01-Mar-06 26-Apr-06 14-Jun-06 24-Aug-06 25-Oct-06 20-Dec-06 29-Mar-07 26-Jun-07 20-Aug-07 27-Dec-07 28-Mar-08 10-Jun-08 24-Sep-08 4-Dec-08 24-Mar-09 4-Jun-09 22-Sep-09 15-Dec-09<br />
ORP ORP ORP ORP ORP ORP ORP ORP ORP ORP ORP ORP ORP ORP ORP ORP ORP ORP<br />
mV mV mV mV mV mV mV mV mV mV mV mV mV mV mV mV mV mV<br />
285 213 278 315 369 356 230 185 304 296 278 280 227 447 324 305 255 381<br />
285 209 259 314 368 359 231 175 296 294 269 274 191 448 322 298 226 382<br />
285 203 232 313 367 358 242 139 295 293 260 240 152 448 322 274 140 382<br />
285 186 208 309 364 355 242 76 269 288 242 211 88 448 319 255 89 381<br />
368 268<br />
287 130 161 305 350 239 -31 287<br />
-4<br />
448<br />
93 381<br />
77 317<br />
58<br />
199<br />
79<br />
D.3-35<br />
Lake Merced<br />
North East<br />
Depth<br />
Ft<br />
Surf<br />
5<br />
9<br />
10<br />
11<br />
12<br />
13<br />
13.8<br />
14<br />
14.1<br />
14.7<br />
15<br />
15.8<br />
01-Mar-06 26-Apr-06 14-Jun-06 24-Aug-06 25-Oct-06 20-Dec-06 29-Mar-07 26-Jun-07 20-Aug-07 27-Dec-07 28-Mar-08 10-Jun-08 24-Sep-08 4-Dec-08 24-Mar-09 4-Jun-09 22-Sep-09 15-Dec-09<br />
ORP ORP ORP ORP ORP ORP ORP ORP ORP ORP ORP ORP ORP ORP ORP ORP ORP ORP<br />
mV mV mV mV mV mV mV mV mV mV mV mV mV mV mV mV mV mV<br />
268 244 328 310 379 360 204 243 295 251 316 276 263 515 273 333 292 347<br />
268 238 328 308 378 361 204 234 277 239 312 260 249 518 263 331 260 343<br />
267 232 323 303 377 360 210 227 251 202 294 187 136 519 248 323 186 331<br />
376 31 10<br />
133<br />
266 318 296 74<br />
521<br />
199 318<br />
215 357 203 220 103 278 319<br />
260<br />
Page 3 of 6
Lake Merced<br />
South - Pistol<br />
Range<br />
15-May-97 10-Sep-97 3-Dec-97 16-Mar-98 8-Jul-98 23-Sep-98 17-Mar-99 21-Jun-99 15-Sep-99 8-Dec-99 21-Mar-00 21-Jun-00 9-Aug-00 19-Dec-00 7-Mar-01 20-Jun-01 1-Oct-01 18-Dec-01 5-Mar-02 30-Apr-02<br />
Depth ORP ORP ORP ORP ORP ORP ORP ORP ORP ORP ORP ORP ORP ORP ORP ORP ORP ORP ORP ORP<br />
Ft mV mV mV mV mV mV mV mV mV mV mV mV mV mV mV mV mV mV mV mV<br />
Surf 311 276 233 292 286 287 404 349 340 301 225 174 184 429 431 216 262 280 266 224<br />
5 325 276 228 282 287 403 347 340 294 207 148 175 429 432 215 264 276 259 211<br />
6 291<br />
10 336 290 214 275 283 402 344 339 288 196 119 164 429 431 219 274 266 248 200<br />
12 289<br />
15 346 287 197 273 274 400 343 339 283 181 -56 136 429 431 217 284 254 221 183<br />
16 346 288 431 206 283 175<br />
17 344 277 139<br />
18 287 265 339 -57 56 430 61<br />
18.2<br />
18.9<br />
19 287 398<br />
20 346 172<br />
20.1<br />
20.6<br />
20.8<br />
21<br />
21.5<br />
22<br />
D.3-36<br />
Lake Merced<br />
South - Pump<br />
Station<br />
15-May-97 10-Sep-97 3-Dec-97 16-Mar-98 8-Jul-98 23-Sep-98 17-Mar-99 21-Jun-99 15-Sep-99 8-Dec-99 21-Mar-00 21-Jun-00 9-Aug-00 19-Dec-00 7-Mar-01 20-Jun-01 1-Oct-01 18-Dec-01 5-Mar-02 30-Apr-02<br />
Depth ORP ORP ORP ORP ORP ORP ORP ORP ORP ORP ORP ORP ORP ORP ORP ORP ORP ORP ORP ORP<br />
Ft mV mV mV mV mV mV mV mV mV mV mV mV mV mV mV mV mV mV mV mV<br />
Surf 303 242 269 297 289 287 366 313 336 316 176 203 198 421 410 225 243 264 268 232<br />
5 305 241 264 299 286 284 361 309 337 313 173 193 190 421 411 226 243 262 263 225<br />
10 318 244 258 278 265 350 298 337 312 159 159 170 421 411 227 246 256 249 212<br />
12 285<br />
15 326 241 257 273 252 337 280 336 311 140 105 132 418 412 231 255 239 214 181<br />
16 324 246 259 138<br />
17 418<br />
18 286 269 335 309 30 411 228 114 66<br />
19 320 258 29<br />
19.2<br />
20 63<br />
20.4<br />
21<br />
21.5<br />
22<br />
22.8<br />
23.2<br />
Page 4 of 6
Lake Merced<br />
South - Pistol<br />
Range<br />
Depth<br />
Ft<br />
Surf<br />
5<br />
6<br />
10<br />
12<br />
15<br />
16<br />
17<br />
18<br />
18.2<br />
18.9<br />
19<br />
20<br />
20.1<br />
20.6<br />
20.8<br />
21<br />
21.5<br />
22<br />
18-Jun-02 23-Aug-02 23-Oct-02 11-Feb-03 14-May-03 15-Jul-03 30-Sep-03 2-Dec-03 27-May-04 29-Aug-04 27-Oct-04 9-Dec-04 9-Feb-05 18-Apr-05 23-Jun-05 17-Aug-05 28-Sep-05 31-Oct-05 29-Nov-05 29-Dec-05 23-Jan-06<br />
ORP ORP ORP ORP ORP ORP ORP ORP ORP ORP ORP ORP ORP ORP ORP ORP ORP ORP ORP ORP ORP<br />
mV mV mV mV mV mV mV mV mV mV mV mV mV mV mV mV mV mV mV mV mV<br />
348 453 526 547 542 482 502 431 414 318 341 315 319 321 221 355 284 309 315 318 235<br />
336 453 523 547 542 481 497 431 407 314 338 316 312 310 214 353 277 307 312 316 232<br />
315 453 518 547 541 481 486 430 385 305 322 315 305 291 203 349 267 302 306 315 228<br />
286 451 507 544 537 477 466 430 358 298 315 313 293 275 190 344 255 295 298 313 223<br />
208 445 540<br />
423 467 311 316 252<br />
526 232 210 289 212<br />
430 429 159 313<br />
258 157 341 278<br />
D.3-37<br />
Lake Merced<br />
South - Pump<br />
Station<br />
Depth<br />
Ft<br />
Surf<br />
5<br />
10<br />
12<br />
15<br />
16<br />
17<br />
18<br />
19<br />
19.2<br />
20<br />
20.4<br />
21<br />
21.5<br />
22<br />
22.8<br />
23.2<br />
18-Jun-02 23-Aug-02 23-Oct-02 11-Feb-03 14-May-03 15-Jul-03 30-Sep-03 2-Dec-03 27-May-04 29-Aug-04 27-Oct-04 9-Dec-04 9-Feb-05 18-Apr-05 23-Jun-05 17-Aug-05 28-Sep-05 31-Oct-05 29-Nov-05 29-Dec-05 23-Jan-06<br />
ORP ORP ORP ORP ORP ORP ORP ORP ORP ORP ORP ORP ORP ORP ORP ORP ORP ORP ORP ORP ORP<br />
mV mV mV mV mV mV mV mV mV mV mV mV mV mV mV mV mV mV mV mV mV<br />
414 449 518 543 533 468 506 402 445 260 341 338 335 321 260 376 279 349 323 318 231<br />
401 449 516 543 532 466 506 401 445 251 342 338 332 312 254 377 275 345 322 318 231<br />
374 448 513 542 529 464 506 400 446 236 342 339 325 303 238 378 263 321 318 318 230<br />
334 445 505 537 524 457 503 398 446 207 344 340 317 297 222 383 251 294 312 318 230<br />
438<br />
260 491 447 345 295<br />
510<br />
530 502 155 340 278<br />
398 446 293 193 386 237 301 318 229<br />
290<br />
Page 5 of 6
Lake Merced<br />
South - Pistol<br />
Range<br />
Depth<br />
Ft<br />
Surf<br />
5<br />
6<br />
10<br />
12<br />
15<br />
16<br />
17<br />
18<br />
18.2<br />
18.9<br />
19<br />
20<br />
20.1<br />
20.6<br />
20.8<br />
21<br />
21.5<br />
22<br />
01-Mar-06 26-Apr-06 14-Jun-06 24-Aug-06 25-Oct-06 20-Dec-06 29-Mar-07 26-Jun-07 20-Aug-07 27-Dec-07 28-Mar-08 10-Jun-08 24-Sep-08 4-Dec-08 24-Mar-09 4-Jun-09 22-Sep-09 15-Dec-09<br />
ORP ORP ORP ORP ORP ORP ORP ORP ORP ORP ORP ORP ORP ORP ORP ORP ORP ORP<br />
mV mV mV mV mV mV mV mV mV mV mV mV mV mV mV mV mV mV<br />
276 303 417 254 428 343 357 356 364 304 356 283 240 472 350 322 337 374<br />
276 301 416 250 428 346 356 358 360 305 352 277 230 472 346 315 316 374<br />
275 299 412 243 428 350 361 361 357 303 345 255 214 471 342 305 296 372<br />
274 294 411 235 428 349 373 364 343 299 337 234 152 470 338 298 254 368<br />
430 468<br />
272 290 409 220 344 370 372 317 296 324 128 328 273<br />
19<br />
326<br />
198<br />
404 368 290 295<br />
299<br />
373<br />
237<br />
366<br />
D.3-38<br />
Lake Merced<br />
South - Pump<br />
Station<br />
01-Mar-06 26-Apr-06 14-Jun-06 24-Aug-06 25-Oct-06 20-Dec-06 29-Mar-07 26-Jun-07 20-Aug-07 27-Dec-07 28-Mar-08 10-Jun-08 24-Sep-08 4-Dec-08 24-Mar-09 4-Jun-09 22-Sep-09 15-Dec-09<br />
Depth ORP ORP ORP ORP ORP ORP ORP ORP ORP ORP ORP ORP ORP ORP ORP ORP ORP ORP<br />
Ft<br />
Surf<br />
5<br />
10<br />
12<br />
15<br />
16<br />
17<br />
18<br />
19<br />
19.2<br />
20<br />
20.4<br />
21<br />
21.5<br />
22<br />
22.8<br />
23.2<br />
mV mV mV mV mV mV mV mV mV mV mV mV mV mV mV mV mV mV<br />
281 289 396 284 416 364 331 326 339 415 472 272 260 82 284 306 344 385<br />
282 288 396 283 416 366 332 327 337 415 472 266 254 77 282 296 332 384<br />
282 287 399 282 417 370 333 334 339 417 471 256 242 74 278 286 320 383<br />
282 286 399 279 419 372 343 335 331 417 469 243 217 73 263 265 301 380<br />
419<br />
281 288 399 371 344 336 314 416 464 217 185 244 241<br />
281 398 277 292 414 91 35 70<br />
287 369 339 335<br />
455<br />
170<br />
195<br />
294<br />
377<br />
Page 6 of 6
Lake Merced<br />
North<br />
15-May-97 10-Sep-97 3-Dec-97 16-Mar-98 8-Jul-98 23-Sep-98 17-Mar-99 21-Jun-99 15-Sep-99 8-Dec-99 21-Mar-00 21-Jun-00 9-Aug-00 19-Dec-00 7-Mar-01 20-Jun-01 1-Oct-01 18-Dec-01 5-Mar-02 30-Apr-02<br />
Depth Turb Turb Turb Turb Turb Turb Turb Turb Turb Turb Turb Turb Turb Turb Turb Turb Turb Turb Turb Turb<br />
Ft ntu ntu ntu ntu ntu ntu ntu ntu ntu ntu ntu ntu ntu ntu ntu ntu ntu ntu ntu ntu<br />
Surf 10.0 25 28 10 32.6 20.0 32.0 26.1 19.0 28.8 28.2 26.7 21.1 30.3 27.0 3.7 11.0 31.9<br />
5 10.0 24 25 11 31.1 20.5 32.0 25.0 19.0 27.3 25.0 26.6 21.6 34.8 30.0 3.2 9.2 33.7<br />
10 7.4 26 29 11 25.6 20.8 33.0 24.6 19.1 28.0 28.5 27.6 23.7 32.0 30.0 3.9 13.6 33.3<br />
14 30.0 27.9 27.8 30.0<br />
15 7.4 28 24 13 28.5 22.1 28.2 28.7 21.9 21.8 4.6 13.4 23.9<br />
16<br />
17<br />
17.4<br />
17.5<br />
18 20.0<br />
18.8<br />
19<br />
19.3<br />
20<br />
20.6<br />
D.3-39<br />
Lake Merced<br />
North East<br />
15-May-97 10-Sep-97 3-Dec-97 16-Mar-98 8-Jul-98 23-Sep-98 17-Mar-99 21-Jun-99 15-Sep-99 8-Dec-99 21-Mar-00 21-Jun-00 9-Aug-00 19-Dec-00 7-Mar-01 20-Jun-01 1-Oct-01 18-Dec-01 5-Mar-02 30-Apr-02<br />
Depth Turb Turb Turb Turb Turb Turb Turb Turb Turb Turb Turb Turb Turb Turb Turb Turb Turb Turb Turb Turb<br />
Ft ntu ntu ntu ntu ntu ntu ntu ntu ntu ntu ntu ntu ntu ntu ntu ntu ntu ntu ntu ntu<br />
Surf 8.2 7.0 6.7 19.4 32.3 23.0 24.1 25.4 22.7 21.7 36.4 33.1 30.0 20.0 3.9 16.1 24.1<br />
5 7.5 5.2 8.3 20.3 29.6 22.0 26.6 25.4 27.4 20.4 32.8 32.7 30.0 21.0 3.0 17.2 24.1<br />
9 20.0<br />
10 8.1 7.1 10 18.3 31.1 23.0 24.9 26.1 48.7 32.3 32.9 33.3 3.5 17.0 24.9<br />
12<br />
13 32.6<br />
13.8<br />
14<br />
14.1<br />
14.7<br />
15<br />
15.8<br />
Page 1 of 6
D.3-40<br />
Lake Merced<br />
North<br />
Depth<br />
Ft<br />
Surf<br />
5<br />
10<br />
14<br />
15<br />
16<br />
17<br />
17.4<br />
17.5<br />
18<br />
18.8<br />
19<br />
19.3<br />
20<br />
20.6<br />
Lake Merced<br />
North East<br />
Depth<br />
Ft<br />
Surf<br />
5<br />
9<br />
10<br />
12<br />
13<br />
13.8<br />
14<br />
14.1<br />
14.7<br />
15<br />
15.8<br />
18-Jun-02 23-Aug-02 23-Oct-02 11-Feb-03 14-May-03 15-Jul-03 30-Sep-03 2-Dec-03 27-May-04 29-Aug-04 27-Oct-04 9-Dec-04 9-Feb-05 18-Apr-05 23-Jun-05 17-Aug-05 28-Sep-05 31-Oct-05 29-Nov-05 29-Dec-05<br />
Turb Turb Turb Turb Turb Turb Turb Turb Turb Turb Turb Turb Turb Turb Turb Turb Turb Turb Turb Turb<br />
ntu ntu ntu ntu ntu ntu ntu ntu ntu ntu ntu ntu ntu ntu ntu ntu ntu ntu ntu ntu<br />
23.0 23.0 14.9 20.4 22.0 32.5 24.3 29.6 1.6 14.0 11.0 3.4 3.7 1.2 8.2 11.3 11.0 13.6 10.0 9.4<br />
23.0 28.0 4.5 18.5 25.1 34.7 22.1 28.2 1.9 14.0 13.0 3.5 4.1 1.4 8.6 11.0 12.0 13.5 12.0 7.7<br />
23.0 23.0 9.7 22.4 25.0 32.6 22.9 25.8 1.2 13.0 13.0 5.6 3.9 1.6 8.3 11.9 11.0 13.5 11.0 8.4<br />
16.0 25.0 19.6 21.8 24.0 28.1 25.5 24.8 1.5 14.0 11.0 7.5 4.4 1.5 8.2 13.1 11.0 13.4 10.0 6.5<br />
12.6<br />
14.0 5.0 8.0<br />
7.6 1.5 12.8 10.0 7.3<br />
18-Jun-02 23-Aug-02 23-Oct-02 11-Feb-03 14-May-03 15-Jul-03 30-Sep-03 2-Dec-03 27-May-04 29-Aug-04 27-Oct-04 9-Dec-04 9-Feb-05 18-Apr-05 23-Jun-05 17-Aug-05 28-Sep-05 31-Oct-05 29-Nov-05 29-Dec-05<br />
Turb Turb Turb Turb Turb Turb Turb Turb Turb Turb Turb Turb Turb Turb Turb Turb Turb Turb Turb Turb<br />
ntu ntu ntu ntu ntu ntu ntu ntu ntu ntu ntu ntu ntu ntu ntu ntu ntu ntu ntu ntu<br />
29.0 20.0 19.0 19.6 17.0 23.4 28.1 29.8 12.2 14.0 11.0 6.1 8.2 7.6 10.8 15.1 12.0 12.6 9.5 10.0<br />
26.0 19.0 16.3 20.7 16.8 21.2 31.4 24.7 11.3 15.0 11.0 6.6 4.6 9.1 11.0 16.0 12.0 13.6 10.0 8.5<br />
25.0 21.0 25.8 20.2 17.4 20.6 22.7 18.4 10.5 15.0 11.0 5.5 8.7 9.5 9.2 16.8 12.0 12.6 9.0 6.5<br />
14.0 5.5 4.8 10.3 15.5 11.0 11.0 10.0<br />
8.8<br />
9.7 5.3<br />
Page 2 of 6
D.3-41<br />
Lake Merced<br />
North<br />
Depth<br />
Ft<br />
Surf<br />
5<br />
10<br />
14<br />
15<br />
16<br />
17<br />
17.4<br />
17.5<br />
18<br />
18.8<br />
19<br />
19.3<br />
20<br />
20.6<br />
Lake Merced<br />
North East<br />
Depth<br />
Ft<br />
Surf<br />
5<br />
9<br />
10<br />
12<br />
13<br />
13.8<br />
14<br />
14.1<br />
14.7<br />
15<br />
15.8<br />
23-Jan-06 01-Mar-06 26-Apr-06 14-Jun-06 24-Aug-06 25-Oct-06 20-Dec-06 29-Mar-07 26-Jun-07 20-Aug-07 27-Dec-07 28-Mar-08 10-Jun-08 24-Sep-08 4-Dec-08 24-Mar-09 4-Jun-09<br />
Turb Turb Turb Turb Turb Turb Turb Turb Turb Turb Turb Turb Turb Turb Turb Turb Turb<br />
ntu ntu ntu ntu ntu ntu ntu ntu ntu ntu ntu ntu ntu ntu ntu ntu ntu<br />
11.0 8.2 10.5 23.5 23.0 27.0 25.0 19.0 21.0 32.0 15.2 7.2 32.0 14.7 15.4<br />
10.0 6.7 9.6 23.5 23.0 24.0 24.0 18.0 22.0 36.1 15.0 7.3 30.0 14 18.1<br />
8.9 7.5 11.0 18.2 21.5 20.0 23.0 18.0 18.0 33.4 14.2 7.6 22.0 13.8<br />
11.0 6.8 11.0 14.9 22.2 21.0 21.0 21.0 18.0 36.1 14.5 7.5 25.0 14.7<br />
10.0 21.0 24.3<br />
8.4 7.3 13.4 22.0 23.0 20.0 18.0 14.2<br />
23-Jan-06 01-Mar-06 26-Apr-06 14-Jun-06 24-Aug-06 25-Oct-06 20-Dec-06 29-Mar-07 26-Jun-07 20-Aug-07 27-Dec-07 28-Mar-08 10-Jun-08 24-Sep-08 4-Dec-08 24-Mar-09 4-Jun-09<br />
Turb Turb Turb Turb Turb Turb Turb Turb Turb Turb Turb Turb Turb Turb Turb Turb Turb<br />
ntu ntu ntu ntu ntu ntu ntu ntu ntu ntu ntu ntu ntu ntu ntu ntu ntu<br />
11.0 13.0 2.1 20.8 18.0 23.0 17.0 17.0 21.0 27.0 8.2 9.2 22.0 13.4 19.3<br />
11.0 13.0 1.9 20.5 18.0 23.0 16.0 18.0 21.0 28.0 8.8 10.0 23.0 14.7 18.4<br />
11.0 13.0 1.9 17.2 18.0 25.0 16.0 17.0 19.0 26.0 8.6 9.5 22.0 14<br />
11.0 24.0 19.0<br />
12.0 14.4 20.0 27.0<br />
2.0 17.0 16.0 19.0 8.7<br />
10.3<br />
9.4<br />
20.0<br />
15.2<br />
14.8<br />
Page 3 of 6
Lake Merced<br />
South - Pistol<br />
Range<br />
15-May-97 10-Sep-97 3-Dec-97 16-Mar-98 8-Jul-98 23-Sep-98 17-Mar-99 21-Jun-99 15-Sep-99 8-Dec-99 21-Mar-00 21-Jun-00 9-Aug-00 19-Dec-00 7-Mar-01 20-Jun-01 1-Oct-01 18-Dec-01 5-Mar-02 30-Apr-02<br />
Depth Turb Turb Turb Turb Turb Turb Turb Turb Turb Turb Turb Turb Turb Turb Turb Turb Turb Turb Turb Turb<br />
Ft ntu ntu ntu ntu ntu ntu ntu ntu ntu ntu ntu ntu ntu ntu ntu ntu ntu ntu ntu ntu<br />
Surf 20.0 32 22 8.4 13.2 12.1 16.1 25.0 23.9 20.6 16.6 19.1 10.7 9.4 14.0 13.0 2.2 9.0 13.0<br />
5 20.0 28 22 12.3 12.0 17.1 23.0 27.1 17.0 15.4 19.1 11.8 10.9 14.4 13.0 2.7 8.8 12.5<br />
6 9.9<br />
10 20.0 26 22 10.5 12.2 16.0 22.0 28.5 18.0 15.8 19.0 10.6 10.3 13.5 13.0 3.6 8.8 12.3<br />
12 11<br />
15 18.0 25 24 9.7 11.3 16.3 22.0 28.6 12.0 13.1 16.5 13.0 3.0 8.8 13.6<br />
16 18.0 28<br />
17<br />
18 11 12.1 16.8<br />
18.9<br />
19<br />
20 17.0<br />
20.6<br />
21<br />
21.5<br />
22<br />
D.3-42<br />
Lake Merced<br />
South - Pump<br />
Station<br />
15-May-97 10-Sep-97 3-Dec-97 16-Mar-98 8-Jul-98 23-Sep-98 17-Mar-99 21-Jun-99 15-Sep-99 8-Dec-99 21-Mar-00 21-Jun-00 9-Aug-00 19-Dec-00 7-Mar-01 20-Jun-01 1-Oct-01 18-Dec-01 5-Mar-02 30-Apr-02<br />
Depth Turb Turb Turb Turb Turb Turb Turb Turb Turb Turb Turb Turb Turb Turb Turb Turb Turb Turb Turb Turb<br />
Ft ntu ntu ntu ntu ntu ntu ntu ntu ntu ntu ntu ntu ntu ntu ntu ntu ntu ntu ntu ntu<br />
Surf 20.0 28 22 9.8 10.8 10.2 16.0 30.0 28.2 18.2 17.7 21.2 9.8 10.1 12.8 13.0 2.5 7.9 13.2<br />
5 18.0 30 19 10 12.5 10.4 15.4 26.0 28.9 18.0 15.1 19.2 10.1 9.7 12.2 14.0 3.2 10.1 12.4<br />
10 18.0 24 20 10.2 11.7 15.1 24.0 33.3 16.8 14.5 19.1 10.7 9.6 12.3 15.0 2.5 10.0 12.7<br />
12 8.6<br />
15 17.0 26 19 9.1 11.8 16.3 25.0 31.6 11.9 10.1 14.4 13.0 3.0 10.3 13.0<br />
16<br />
17<br />
18 12 15.3<br />
19 19.1<br />
19.2<br />
20 17.1<br />
21<br />
22<br />
22.8<br />
23.2<br />
Page 4 of 6
D.3-43<br />
Lake Merced<br />
South - Pistol<br />
Range<br />
Depth<br />
Ft<br />
Surf<br />
5<br />
6<br />
10<br />
12<br />
15<br />
16<br />
17<br />
18<br />
18.9<br />
19<br />
20<br />
20.6<br />
21<br />
21.5<br />
22<br />
Lake Merced<br />
South - Pump<br />
Station<br />
Depth<br />
Ft<br />
Surf<br />
5<br />
10<br />
12<br />
15<br />
16<br />
17<br />
18<br />
19<br />
19.2<br />
20<br />
21<br />
22<br />
22.8<br />
23.2<br />
18-Jun-02 23-Aug-02 23-Oct-02 11-Feb-03 14-May-03 15-Jul-03 30-Sep-03 2-Dec-03 27-May-04 29-Aug-04 27-Oct-04 9-Dec-04 9-Feb-05 18-Apr-05 23-Jun-05 17-Aug-05 28-Sep-05 31-Oct-05 29-Nov-05 29-Dec-05<br />
Turb Turb Turb Turb Turb Turb Turb Turb Turb Turb Turb Turb Turb Turb Turb Turb Turb Turb Turb Turb<br />
ntu ntu ntu ntu ntu ntu ntu ntu ntu ntu ntu ntu ntu ntu ntu ntu ntu ntu ntu ntu<br />
17.0 20.0 12.6 14.3 12.8 15.6 16.2 19.5 11.8 22.0 19.0 15.0 11.3 7.8 10.2 9.1 7.0 12.8 10.0 9.4<br />
14.0 20.0 13.0 14.5 12.0 17.4 14.1 17.9 12.3 21.0 18.0 15.0 10.7 8.2 11.4 9.9 7.0 11.0 11.0 9.4<br />
13.0 17.0 12.1 14.9 9.5 18.8 15.2 16.2 11.8 20.0 18.0 17.0 12.3 8.2 10.6 9.6 7.0 9.7 10.0 8.7<br />
13.0 20.0 6.9 13.4 12.3 15.3 15.1 19.2 12.5 20.0 18.0 14.0 17.2 7.6 11.2 8.3 7.0 9.7 11.0 9.0<br />
16.0 11.5<br />
18.0 7.0 11.0<br />
9.2 9.1 8.3 9.6<br />
18-Jun-02 23-Aug-02 23-Oct-02 11-Feb-03 14-May-03 15-Jul-03 30-Sep-03 2-Dec-03 27-May-04 29-Aug-04 27-Oct-04 9-Dec-04 9-Feb-05 18-Apr-05 23-Jun-05 17-Aug-05 28-Sep-05 31-Oct-05 29-Nov-05 29-Dec-05<br />
Turb Turb Turb Turb Turb Turb Turb Turb Turb Turb Turb Turb Turb Turb Turb Turb Turb Turb Turb Turb<br />
ntu ntu ntu ntu ntu ntu ntu ntu ntu ntu ntu ntu ntu ntu ntu ntu ntu ntu ntu ntu<br />
13.0 22.0 8.0 15.0 11.2 16.3 14.4 17.3 11.4 20.0 18.0 14.0 2.5 8.1 10.2 10.4 7.0 10.7 11.0 11.0<br />
12.0 16.0 7.6 14.6 9.8 17.5 18.2 19.5 11.3 20.0 18.0 12.0 11.4 7.5 11.0 11.1 7.0 10.4 10.0 9.6<br />
12.0 17.0 8.0 13.7 11.0 17.1 11.9 18.6 11.1 23.0 18.0 13.0 12.7 7.8 9.7 11.7 7.8 9.9 10.0 8.6<br />
12.0 17.0 7.3 13.3 10.8 18.0 13.3 15.7 12.7 17.0 19.0 12.0 10.4 7.6 11.1 9.5 7.5 8.8 10.0 9.2<br />
12.3<br />
16.0 13.0 8.8<br />
7.6<br />
10.0<br />
10.1 10.2 7.5 9.6 9.2<br />
Page 5 of 6
Lake Merced<br />
South - Pistol<br />
Range<br />
Depth<br />
Ft<br />
Surf<br />
5<br />
6<br />
10<br />
12<br />
15<br />
16<br />
17<br />
18<br />
18.9<br />
19<br />
20<br />
20.6<br />
21<br />
21.5<br />
22<br />
23-Jan-06 01-Mar-06 26-Apr-06 14-Jun-06 24-Aug-06 25-Oct-06 20-Dec-06 29-Mar-07 26-Jun-07 20-Aug-07 27-Dec-07 28-Mar-08 10-Jun-08 24-Sep-08 4-Dec-08 24-Mar-09 4-Jun-09<br />
Turb Turb Turb Turb Turb Turb Turb Turb Turb Turb Turb Turb Turb Turb Turb Turb Turb<br />
ntu ntu ntu ntu ntu ntu ntu ntu ntu ntu ntu ntu ntu ntu ntu ntu ntu<br />
9.9 11.0 11.0 11.8 22.5 24.0 10.0 7.0 12.5 10.5 14.3 7.2 8.7 8.6 10.4<br />
9.6 10.0 11.8 14.1 21.0 20.0 11.0 6.7 12.0 11.0 15.3 7.3 9.3 8.9 9.6<br />
11.0 10.0 11.0 14.2 21.0 20.0 10.0 7.3 12.0 15.1 7.6 9.0 7.5<br />
11.0 11.0 10.5 13.8 23.0 18.0 11.0 7.0 11.0 11.0 14.1 7.5 9.2 7.8<br />
11.0<br />
22.0<br />
10.0 9.8 21.0 11.0 8.7<br />
15.4 6.8 14.2<br />
11.0<br />
10.3<br />
8.5<br />
D.3-44<br />
Lake Merced<br />
South - Pump<br />
Station<br />
Depth<br />
Ft<br />
Surf<br />
5<br />
10<br />
12<br />
15<br />
16<br />
17<br />
18<br />
19<br />
19.2<br />
20<br />
21<br />
22<br />
22.8<br />
23.2<br />
23-Jan-06 01-Mar-06 26-Apr-06 14-Jun-06 24-Aug-06 25-Oct-06 20-Dec-06 29-Mar-07 26-Jun-07 20-Aug-07 27-Dec-07 28-Mar-08 10-Jun-08 24-Sep-08 4-Dec-08 24-Mar-09 4-Jun-09<br />
Turb Turb Turb Turb Turb Turb Turb Turb Turb Turb Turb Turb Turb Turb Turb Turb Turb<br />
ntu ntu ntu ntu ntu ntu ntu ntu ntu ntu ntu ntu ntu ntu ntu ntu ntu<br />
10.0 10.0 10.3 12.0 20.5 21.0 10.0 7.2 12.0 11.0 14.1 8.5 8.5 9.1 9.52<br />
9.8 10.0 10.5 14.5 22.0 21.0 10.0 7.1 12.8 11.0 14.1 7.2 8.7 9.8 9.08<br />
11.0 9.4 10.3 12.8 21.5 22.0 10.0 6.9 11.0 7.0 14.0 7.0 8.5 9.5<br />
11.0 9.1 11.5 11.8 21.0 17.0 11.0 6.7 11.0 9.5 14.2 7.2 9.0 10.3<br />
11.0<br />
12.0<br />
9.4 12.2 21.0 12.0 14.9 8.9<br />
11.4 11.0 6.8 10.0<br />
7.2<br />
10.3<br />
Page 6 of 6
Lake Merced<br />
North<br />
15-May-97 10-Sep-97 3-Dec-97 16-Mar-98 8-Jul-98 23-Sep-98 17-Mar-99 21-Jun-99 15-Sep-99 8-Dec-99 21-Mar-00 21-Jun-00 9-Aug-00 19-Dec-00 7-Mar-01 20-Jun-01 1-Oct-01 18-Dec-01 5-Mar-02 30-Apr-02<br />
Depth Alk Alk Alk Alk Alk Alk Alk Alk Alk Alk Alk Alk Alk Alk Alk Alk Alk Alk Alk Alk<br />
Ft mg/L mg/L mg/L mg/L mg/L mg/L mg/L mg/L mg/L mg/L mg/L mg/L mg/L mg/L mg/L mg/L mg/L mg/L mg/L mg/L<br />
Surf 274 304 300 233 244 232 276 264 248 228 210 264 220 256 280 --- 230 260<br />
5 274 304 300 236 234 234 272 276 240 228 220 264 244 248 280 --- 225 250<br />
10 272 304 300 231 236 240 268 272 240 236 225 268 252 248 280 --- 220 245<br />
14 260 272 268 280<br />
15 272 304 300 240 242 236 236 220 244 248 --- 235 245<br />
16<br />
17<br />
17.4<br />
17.5<br />
18 240<br />
18.8<br />
19<br />
20<br />
20.6<br />
D.3-45<br />
Lake Merced<br />
North East<br />
15-May-97 10-Sep-97 3-Dec-97 16-Mar-98 8-Jul-98 23-Sep-98 17-Mar-99 21-Jun-99 15-Sep-99 8-Dec-99 21-Mar-00 21-Jun-00 9-Aug-00 19-Dec-00 7-Mar-01 20-Jun-01 1-Oct-01 18-Dec-01 5-Mar-02 30-Apr-02<br />
Depth Alk Alk Alk Alk Alk Alk Alk Alk Alk Alk Alk Alk Alk Alk Alk Alk Alk Alk Alk Alk<br />
Ft mg/L mg/L mg/L mg/L mg/L mg/L mg/L mg/L mg/L mg/L mg/L mg/L mg/L mg/L mg/L mg/L mg/L mg/L mg/L mg/L<br />
Surf 262 285 214 224 220 268 244 216 224 210 236 216 240 260 --- 225 230<br />
5 260 288 202 232 220 268 240 220 232 220 252 224 244 260 --- 240 235<br />
9 264<br />
10 260 286 205 234 232 272 240 228 220 252 224 252 --- 245 240<br />
12<br />
13 228<br />
13.8<br />
14<br />
14.1<br />
15<br />
15.8<br />
Page 1 of 6
D.3-46<br />
Lake Merced<br />
North<br />
Depth<br />
Ft<br />
Surf<br />
5<br />
10<br />
14<br />
15<br />
16<br />
17<br />
17.4<br />
17.5<br />
18<br />
18.8<br />
19<br />
20<br />
20.6<br />
Lake Merced<br />
North East<br />
Depth<br />
Ft<br />
Surf<br />
5<br />
9<br />
10<br />
12<br />
13<br />
13.8<br />
14<br />
14.1<br />
15<br />
15.8<br />
18-Jun-02 23-Aug-02 23-Oct-02 11-Feb-03 14-May-03 15-Jul-03 30-Sep-03 2-Dec-03 27-May-04 29-Aug-04 27-Oct-04 9-Dec-04 9-Feb-05 18-Apr-05 23-Jun-05 17-Aug-05 28-Sep-05 31-Oct-05 29-Nov-05 29-Dec-05 23-Jan-06<br />
Alk Alk Alk Alk Alk Alk Alk Alk Alk Alk Alk Alk Alk Alk Alk Alk Alk Alk Alk Alk Alk<br />
mg/L mg/L mg/L mg/L mg/L mg/L mg/L mg/L mg/L mg/L mg/L mg/L mg/L mg/L mg/L mg/L mg/L mg/L mg/L mg/L mg/L<br />
235 232 235 225 210 235 255 260 204 264 220 255 204 200 220 220 240 248 232 230 225<br />
240 240 240 230 220 260 270 265 204 264 224 255 200 200 252 225 244 244 232 235 235<br />
250 248 250 240 230 270 275 270 204 264 224 250 200 205 248 230 252 240 234 235 230<br />
255 252 260 240 230 270 275 270 204 266 226 250 204 205 244 235 248 240 236 235 225<br />
235<br />
266 204 244<br />
250 210 244 236 230 225<br />
18-Jun-02 23-Aug-02 23-Oct-02 11-Feb-03 14-May-03 15-Jul-03 30-Sep-03 2-Dec-03 27-May-04 29-Aug-04 27-Oct-04 9-Dec-04 9-Feb-05 18-Apr-05 23-Jun-05 17-Aug-05 28-Sep-05 31-Oct-05 29-Nov-05 29-Dec-05 23-Jan-06<br />
Alk Alk Alk Alk Alk Alk Alk Alk Alk Alk Alk Alk Alk Alk Alk Alk Alk Alk Alk Alk Alk<br />
mg/L mg/L mg/L mg/L mg/L mg/L mg/L mg/L mg/L mg/L mg/L mg/L mg/L mg/L mg/L mg/L mg/L mg/L mg/L mg/L mg/L<br />
255 256 255 230 230 270 280 280 208 262 226 235 204 195 236 240 244 240 234 215 215<br />
250 256 255 230 225 270 280 285 208 264 226 235 204 190 240 225 244 240 234 215 215<br />
250 256 260 235 225 270 280 285 210 266 228 235 208 190 244 200 248 240 236 225 210<br />
216<br />
266 235 208 244 235 256 240 238 210<br />
185 235<br />
Page 2 of 6
D.3-47<br />
Lake Merced<br />
North<br />
Depth<br />
Ft<br />
Surf<br />
5<br />
10<br />
14<br />
15<br />
16<br />
17<br />
17.4<br />
17.5<br />
18<br />
18.8<br />
19<br />
20<br />
20.6<br />
Lake Merced<br />
North East<br />
Depth<br />
Ft<br />
Surf<br />
5<br />
9<br />
10<br />
12<br />
13<br />
13.8<br />
14<br />
14.1<br />
15<br />
15.8<br />
01-Mar-06 26-Apr-06 14-Jun-06 24-Aug-06 25-Oct-06 20-Dec-06 29-Mar-07 26-Jun-07 20-Aug-07 27-Dec-07 28-Mar-08 10-Jun-08 24-Sep-08 4-Dec-08<br />
Alk Alk Alk Alk Alk Alk Alk Alk Alk Alk Alk Alk Alk Alk<br />
mg/L mg/L mg/L mg/L mg/L mg/L mg/L mg/L mg/L mg/L mg/L mg/L mg/L mg/L<br />
210 194 195 240 228 224 230 250 248 244 208 220<br />
208 194 200 220 228 224 230 250 248 244 228 232<br />
206 194 200 205 232 224 225 248 244 244 208 240<br />
204 195 205 225 228 212 225 248 244 248 208 240<br />
220 244<br />
206 196 210 235 204 225 246 264<br />
01-Mar-06 26-Apr-06 14-Jun-06 24-Aug-06 25-Oct-06 20-Dec-06 29-Mar-07 26-Jun-07 20-Aug-07 27-Dec-07 28-Mar-08 10-Jun-08 24-Sep-08 4-Dec-08<br />
Alk Alk Alk Alk Alk Alk Alk Alk Alk Alk Alk Alk Alk Alk<br />
mg/L mg/L mg/L mg/L mg/L mg/L mg/L mg/L mg/L mg/L mg/L mg/L mg/L mg/L<br />
180 196 200 215 228 220 235 248 256 252 212 244<br />
152 196 200 225 228 220 235 248 264 248 200 232<br />
114 195 205 240 224 216 235 250 268 244 224 232<br />
216 228<br />
88 210 210 268<br />
194 216 215 250 236<br />
228<br />
220<br />
240<br />
Page 3 of 6
Lake Merced<br />
South - Pistol<br />
Range<br />
15-May-97 10-Sep-97 3-Dec-97 16-Mar-98 8-Jul-98 23-Sep-98 17-Mar-99 21-Jun-99 15-Sep-99 8-Dec-99 21-Mar-00 21-Jun-00 9-Aug-00 19-Dec-00 7-Mar-01 20-Jun-01 1-Oct-01 18-Dec-01 5-Mar-02 30-Apr-02<br />
Depth Alk Alk Alk Alk Alk Alk Alk Alk Alk Alk Alk Alk Alk Alk Alk Alk Alk Alk Alk Alk<br />
Ft mg/L mg/L mg/L mg/L mg/L mg/L mg/L mg/L mg/L mg/L mg/L mg/L mg/L mg/L mg/L mg/L mg/L mg/L mg/L mg/L<br />
Surf 172 190 204 162 170 170 176 180 196 188 180 160 188 184 180 196 --- 190 190<br />
5 172 190 198 170 168 172 178 180 184 172 165 180 172 184 196 --- 190 190<br />
6 155<br />
10 172 190 198 170 166 168 180 204 184 176 160 184 188 184 200 --- 195 195<br />
12 158<br />
15 172 190 197 170 166 176 180 184 196 180 188 200 --- 195 195<br />
16 172 190<br />
17<br />
18 161 172 170<br />
19<br />
20 172<br />
21<br />
21.5<br />
22<br />
D.3-48<br />
Lake Merced<br />
South - Pump<br />
Station<br />
15-May-97 10-Sep-97 3-Dec-97 16-Mar-98 8-Jul-98 23-Sep-98 17-Mar-99 21-Jun-99 15-Sep-99 8-Dec-99 21-Mar-00 21-Jun-00 9-Aug-00 19-Dec-00 7-Mar-01 20-Jun-01 1-Oct-01 18-Dec-01 5-Mar-02 30-Apr-02<br />
Depth Alk Alk Alk Alk Alk Alk Alk Alk Alk Alk Alk Alk Alk Alk Alk Alk Alk Alk Alk Alk<br />
Ft mg/L mg/L mg/L mg/L mg/L mg/L mg/L mg/L mg/L mg/L mg/L mg/L mg/L mg/L mg/L mg/L mg/L mg/L mg/L mg/L<br />
Surf 172 192 196 155 166 166 168 178 200 178 176 170 196 176 196 204 --- 200 200<br />
5 172 190 198 160 166 170 180 186 184 184 180 175 188 184 188 204 --- 200 190<br />
10 172 190 200 170 170 176 182 180 176 180 160 200 184 192 208 --- 195 180<br />
12 158<br />
15 172 190 196 170 170 172 182 200 200 180 176 208 --- 190 180<br />
16<br />
17<br />
18 157 168<br />
19 165<br />
20 176<br />
21<br />
22<br />
23.2<br />
Page 4 of 6
D.3-49<br />
Lake Merced<br />
South - Pistol<br />
Range<br />
Depth<br />
Ft<br />
Surf<br />
5<br />
6<br />
10<br />
12<br />
15<br />
16<br />
17<br />
18<br />
19<br />
20<br />
21<br />
21.5<br />
22<br />
Lake Merced<br />
South - Pump<br />
Station<br />
Depth<br />
Ft<br />
Surf<br />
5<br />
10<br />
12<br />
15<br />
16<br />
17<br />
18<br />
19<br />
20<br />
21<br />
22<br />
23.2<br />
18-Jun-02 23-Aug-02 23-Oct-02 11-Feb-03 14-May-03 15-Jul-03 30-Sep-03 2-Dec-03 27-May-04 29-Aug-04 27-Oct-04 9-Dec-04 9-Feb-05 18-Apr-05 23-Jun-05 17-Aug-05 28-Sep-05 31-Oct-05 29-Nov-05 29-Dec-05 23-Jan-06<br />
Alk Alk Alk Alk Alk Alk Alk Alk Alk Alk Alk Alk Alk Alk Alk Alk Alk Alk Alk Alk Alk<br />
mg/L mg/L mg/L mg/L mg/L mg/L mg/L mg/L mg/L mg/L mg/L mg/L mg/L mg/L mg/L mg/L mg/L mg/L mg/L mg/L mg/L<br />
200 208 190 190 170 195 155 150 132 170 150 160 152 150 170 150 176 160 162 155 170<br />
205 208 190 190 170 190 150 155 132 170 150 165 152 135 164 175 172 160 162 155 170<br />
215 208 200 185 175 180 150 160 132 168 150 170 148 125 156 170 164 170 160 158 168<br />
220 208 200 185 175 190 145 165 132 168 150 170 144 135 158 165 168 168 160 158 166<br />
170 136<br />
166 172 160 163<br />
162<br />
155 158 150 164<br />
18-Jun-02 23-Aug-02 23-Oct-02 11-Feb-03 14-May-03 15-Jul-03 30-Sep-03 2-Dec-03 27-May-04 29-Aug-04 27-Oct-04 9-Dec-04 9-Feb-05 18-Apr-05 23-Jun-05 17-Aug-05 28-Sep-05 31-Oct-05 29-Nov-05 29-Dec-05 23-Jan-06<br />
Alk Alk Alk Alk Alk Alk Alk Alk Alk Alk Alk Alk Alk Alk Alk Alk Alk Alk Alk Alk Alk<br />
mg/L mg/L mg/L mg/L mg/L mg/L mg/L mg/L mg/L mg/L mg/L mg/L mg/L mg/L mg/L mg/L mg/L mg/L mg/L mg/L mg/L<br />
210 200 190 170 165 200 175 150 144 168 152 160 136 145 158 165 168 166 160 162 155<br />
210 200 190 180 165 200 180 155 144 168 152 165 136 140 158 145 164 168 160 165 155<br />
205 208 195 185 170 200 180 150 144 168 152 170 140 140 160 160 160 176 158 168 155<br />
205 212 195 185 170 200 180 145 144 168 152 160 140 145 160 170 164 170 158 168 162<br />
140<br />
168 155 160<br />
158 140 168 158 165 162<br />
145<br />
Page 5 of 6
D.3-50<br />
Lake Merced<br />
South - Pistol<br />
Range<br />
Depth<br />
Ft<br />
Surf<br />
5<br />
6<br />
10<br />
12<br />
15<br />
16<br />
17<br />
18<br />
19<br />
20<br />
21<br />
21.5<br />
22<br />
Lake Merced<br />
South - Pump<br />
Station<br />
Depth<br />
Ft<br />
Surf<br />
5<br />
10<br />
12<br />
15<br />
16<br />
17<br />
18<br />
19<br />
20<br />
21<br />
22<br />
23.2<br />
01-Mar-06 26-Apr-06 14-Jun-06 24-Aug-06 25-Oct-06 20-Dec-06 29-Mar-07 26-Jun-07 20-Aug-07 27-Dec-07 28-Mar-08 10-Jun-08 24-Sep-08 4-Dec-08<br />
Alk Alk Alk Alk Alk Alk Alk Alk Alk Alk Alk Alk Alk Alk<br />
mg/L mg/L mg/L mg/L mg/L mg/L mg/L mg/L mg/L mg/L mg/L mg/L mg/L mg/L<br />
146 148 170 170 156 168 160 178 180 184 168 160<br />
146 150 165 165 164 168 160 178 180 184 156 164<br />
148 146 160 160 172 168 160 178 182 152 168<br />
148 144 155 170 164 160 160 178 192 182 156 172<br />
156<br />
154 142 175 156 184<br />
150 160 186<br />
172<br />
178<br />
01-Mar-06 26-Apr-06 14-Jun-06 24-Aug-06 25-Oct-06 20-Dec-06 29-Mar-07 26-Jun-07 20-Aug-07 27-Dec-07 28-Mar-08 10-Jun-08 24-Sep-08 4-Dec-08<br />
Alk Alk Alk Alk Alk Alk Alk Alk Alk Alk Alk Alk Alk Alk<br />
mg/L mg/L mg/L mg/L mg/L mg/L mg/L mg/L mg/L mg/L mg/L mg/L mg/L mg/L<br />
154 142 170 225 172 172 162 180 180 184 168 156<br />
152 140 145 210 160 168 162 180 180 184 160 172<br />
150 140 150 210 148 164 162 182 180 184 164 184<br />
148 138 155 230 156 160 162 182 188 184 168 188<br />
164<br />
146 160 210 196 182 160<br />
142 152 162 182<br />
152<br />
Page 6 of 6
Lake Merced<br />
North<br />
15-May-97 10-Sep-97 3-Dec-97 16-Mar-98 8-Jul-98 23-Sep-98 17-Mar-99 21-Jun-99 15-Sep-99 8-Dec-99 21-Mar-00 21-Jun-00 9-Aug-00 19-Dec-00 7-Mar-01 20-Jun-01 1-Oct-01 18-Dec-01 5-Mar-02 30-Apr-02<br />
Depth Hard Hard Hard Hard Hard Hard Hard Hard Hard Hard Hard Hard Hard Hard Hard Hard Hard Hard Hard Hard<br />
Ft mg/L mg/L mg/L mg/L mg/L mg/L mg/L mg/L mg/L mg/L mg/L mg/L mg/L mg/L mg/L mg/L mg/L mg/L mg/L mg/L<br />
Surf 272 290 277 231 240 240 266 280 256 248 270 252 232 260 276 --- 245 250<br />
5 272 290 280 227 244 240 276 272 252 244 260 256 252 264 280 --- 260 250<br />
10 272 290 280 229 244 246 270 260 248 244 245 268 260 272 284 --- 250 255<br />
14 260 256 268 284<br />
15 272 290 280 232 244 246 244 245 252 272 --- 260 260<br />
16<br />
17<br />
17.4<br />
17.5<br />
18 244<br />
18.8<br />
19<br />
19.3<br />
19.9<br />
20<br />
20.6<br />
D.3-51<br />
Lake Merced<br />
North East<br />
15-May-97 10-Sep-97 3-Dec-97 16-Mar-98 8-Jul-98 23-Sep-98 17-Mar-99 21-Jun-99 15-Sep-99 8-Dec-99 21-Mar-00 21-Jun-00 9-Aug-00 19-Dec-00 7-Mar-01 20-Jun-01 1-Oct-01 18-Dec-01 5-Mar-02 30-Apr-02<br />
Depth Hard Hard Hard Hard Hard Hard Hard Hard Hard Hard Hard Hard Hard Hard Hard Hard Hard Hard Hard Hard<br />
Ft mg/L mg/L mg/L mg/L mg/L mg/L mg/L mg/L mg/L mg/L mg/L mg/L mg/L mg/L mg/L mg/L mg/L mg/L mg/L mg/L<br />
Surf 268 272 218 235 228 240 252 220 244 255 240 236 272 280 --- 260 260<br />
5 268 273 214 245 250 256 280 232 236 245 260 240 272 284 --- 250 260<br />
9 284<br />
10 268 273 212 255 252 274 280 240 265 256 244 272 --- 250 265<br />
12<br />
13 228<br />
13.8<br />
14<br />
14.1<br />
14.4<br />
14.7<br />
15<br />
15.8<br />
Page 1 of 6
D.3-52<br />
Lake Merced<br />
North<br />
Depth<br />
Ft<br />
Surf<br />
5<br />
10<br />
14<br />
15<br />
16<br />
17<br />
17.4<br />
17.5<br />
18<br />
18.8<br />
19<br />
19.3<br />
19.9<br />
20<br />
20.6<br />
Lake Merced<br />
North East<br />
Depth<br />
Ft<br />
Surf<br />
5<br />
9<br />
10<br />
12<br />
13<br />
13.8<br />
14<br />
14.1<br />
14.4<br />
14.7<br />
15<br />
15.8<br />
18-Jun-02 23-Aug-02 23-Oct-02 11-Feb-03 14-May-03 15-Jul-03 30-Sep-03 2-Dec-03 27-May-04 29-Aug-04 27-Oct-04 9-Dec-04 9-Feb-05 18-Apr-05 23-Jun-05 17-Aug-05 28-Sep-05 31-Oct-05 29-Nov-05 29-Dec-05 23-Jan-06<br />
Hard Hard Hard Hard Hard Hard Hard Hard Hard Hard Hard Hard Hard Hard Hard Hard Hard Hard Hard Hard Hard<br />
mg/L mg/L mg/L mg/L mg/L mg/L mg/L mg/L mg/L mg/L mg/L mg/L mg/L mg/L mg/L mg/L mg/L mg/L mg/L mg/L mg/L<br />
260 260 285 265 240 255 265 250 236 262 256 255 240 245 252 220 240 244 248 240 220<br />
260 264 280 255 255 250 245 255 238 264 256 255 232 230 244 225 244 240 248 245 215<br />
255 264 280 250 250 280 225 250 242 265 258 255 228 220 220 230 248 240 248 240 235<br />
255 268 275 250 250 280 225 240 244 264 258 255 224 220 220 235 252 244 246 235 235<br />
235<br />
262 224 260<br />
255 220 256 244 220 210<br />
18-Jun-02 23-Aug-02 23-Oct-02 11-Feb-03 14-May-03 15-Jul-03 30-Sep-03 2-Dec-03 27-May-04 29-Aug-04 27-Oct-04 9-Dec-04 9-Feb-05 18-Apr-05 23-Jun-05 17-Aug-05 28-Sep-05 31-Oct-05 29-Nov-05 29-Dec-05 23-Jan-06<br />
Hard Hard Hard Hard Hard Hard Hard Hard Hard Hard Hard Hard Hard Hard Hard Hard Hard Hard Hard Hard Hard<br />
mg/L mg/L mg/L mg/L mg/L mg/L mg/L mg/L mg/L mg/L mg/L mg/L mg/L mg/L mg/L mg/L mg/L mg/L mg/L mg/L mg/L<br />
280 276 280 260 255 255 240 265 246 262 266 260 236 250 256 260 248 276 250 240 235<br />
275 276 260 245 255 270 240 275 246 264 266 260 236 245 252 245 252 260 250 245 235<br />
270 280 265 245 255 280 245 280 248 267 266 265 236 235 230 275 264 248 250 235 220<br />
220<br />
264 270 236 224 275 256 254 250 215<br />
220 215<br />
Page 2 of 6
D.3-53<br />
Lake Merced<br />
North<br />
Depth<br />
Ft<br />
Surf<br />
5<br />
10<br />
14<br />
15<br />
16<br />
17<br />
17.4<br />
17.5<br />
18<br />
18.8<br />
19<br />
19.3<br />
19.9<br />
20<br />
20.6<br />
Lake Merced<br />
North East<br />
Depth<br />
Ft<br />
Surf<br />
5<br />
9<br />
10<br />
12<br />
13<br />
13.8<br />
14<br />
14.1<br />
14.4<br />
14.7<br />
15<br />
15.8<br />
01-Mar-06 26-Apr-06 14-Jun-06 24-Aug-06 25-Oct-06 20-Dec-06 29-Mar-07 26-Jun-07 20-Aug-07 27-Dec-07 28-Mar-08 10-Jun-08 24-Sep-08 4-Dec-08 24-Mar-09 4-Jun-09 22-Sep-09 15-Dec-09<br />
Hard Hard Hard Hard Hard Hard Hard Hard Hard Hard Hard Hard Hard Hard Hard Hard Hard Hard<br />
mg/L mg/L mg/L mg/L mg/L mg/L mg/L mg/L mg/L mg/L mg/L mg/L mg/L mg/L mg/L mg/L mg/L mg/L<br />
222 200 205 235 236 224 230 244 248 244 240 232 244 240 232 250 272 264<br />
218 202 215 240 240 224 230 244 248 244 240 232 260 268 264 246 278 256<br />
218 202 225 245 248 228 226 244 244 244 240 256 260 268 260 258 266 268<br />
220 204 225 235 244 232 228 244 244 248 240 252 272 224 252 272 276<br />
240 244<br />
220 204 220 230 236 232 244 264<br />
272<br />
280<br />
244 284<br />
01-Mar-06 26-Apr-06 14-Jun-06 24-Aug-06 25-Oct-06 20-Dec-06 29-Mar-07 26-Jun-07 20-Aug-07 27-Dec-07 28-Mar-08 10-Jun-08 24-Sep-08 4-Dec-08 24-Mar-09 4-Jun-09 22-Sep-09 15-Dec-09<br />
Hard Hard Hard Hard Hard Hard Hard Hard Hard Hard Hard Hard Hard Hard Hard Hard Hard Hard<br />
mg/L mg/L mg/L mg/L mg/L mg/L mg/L mg/L mg/L mg/L mg/L mg/L mg/L mg/L mg/L mg/L mg/L mg/L<br />
218 206 215 230 236 236 235 246 246 248 220 260 252 256 232 256 274 264<br />
220 206 220 235 236 236 235 246 246 240 232 264 260 208 228 250 270 256<br />
222 206 230 240 232 232 235 244 246 244 236 260 256 272 224 256 272 256<br />
228 232 256<br />
222 235 240 250<br />
240 272<br />
206 232 225 242 244 254<br />
244<br />
228<br />
252<br />
228<br />
252<br />
276<br />
274<br />
Page 3 of 6
Lake Merced<br />
South - Pistol<br />
Range<br />
15-May-97 10-Sep-97 3-Dec-97 16-Mar-98 8-Jul-98 23-Sep-98 17-Mar-99 21-Jun-99 15-Sep-99 8-Dec-99 21-Mar-00 21-Jun-00 9-Aug-00 19-Dec-00 7-Mar-01 20-Jun-01 1-Oct-01 18-Dec-01 5-Mar-02 30-Apr-02<br />
Depth Hard Hard Hard Hard Hard Hard Hard Hard Hard Hard Hard Hard Hard Hard Hard Hard Hard Hard Hard Hard<br />
Ft mg/L mg/L mg/L mg/L mg/L mg/L mg/L mg/L mg/L mg/L mg/L mg/L mg/L mg/L mg/L mg/L mg/L mg/L mg/L mg/L<br />
Surf 172 185 185 157 185 176 168 188 196 184 180 200 200 200 212 228 --- 200 205<br />
5 170 186 182 185 174 188 188 204 188 172 195 188 188 212 228 --- 200 205<br />
6 156<br />
10 170 186 182 195 180 192 190 200 192 176 180 192 192 216 224 --- 200 210<br />
12 163<br />
15 170 186 182 195 176 192 188 180 208 200 216 220 --- 200 210<br />
16 170 186<br />
17<br />
18 158 172 200<br />
18.2<br />
18.5<br />
18.9<br />
19<br />
20 188<br />
20.1<br />
20.6<br />
20.8<br />
21<br />
21.5<br />
22<br />
D.3-54<br />
Lake Merced<br />
South - Pump<br />
Station<br />
15-May-97 10-Sep-97 3-Dec-97 16-Mar-98 8-Jul-98 23-Sep-98 17-Mar-99 21-Jun-99 15-Sep-99 8-Dec-99 21-Mar-00 21-Jun-00 9-Aug-00 19-Dec-00 7-Mar-01 20-Jun-01 1-Oct-01 18-Dec-01 5-Mar-02 30-Apr-02<br />
Depth Hard Hard Hard Hard Hard Hard Hard Hard Hard Hard Hard Hard Hard Hard Hard Hard Hard Hard Hard Hard<br />
Ft mg/L mg/L mg/L mg/L mg/L mg/L mg/L mg/L mg/L mg/L mg/L mg/L mg/L mg/L mg/L mg/L mg/L mg/L mg/L mg/L<br />
Surf 172 186 182 156 185 176 184 184 192 192 180 185 204 196 216 220 --- 215 210<br />
5 170 186 182 161 185 176 180 186 204 188 184 195 188 192 208 220 --- 210 210<br />
10 170 186 184 185 180 168 184 192 184 180 185 184 200 208 224 --- 210 210<br />
12 154<br />
15 170 186 178 190 182 184 188 180 200 188 204 224 --- 210 205<br />
16<br />
17<br />
18 157 180<br />
19 200<br />
19.2<br />
20 176<br />
20.4<br />
20.9<br />
21<br />
21.5<br />
22<br />
22.8<br />
23.2<br />
Page 4 of 6
Lake Merced<br />
South - Pistol<br />
Range<br />
Depth<br />
Ft<br />
Surf<br />
5<br />
6<br />
10<br />
12<br />
15<br />
16<br />
17<br />
18<br />
18.2<br />
18.5<br />
18.9<br />
19<br />
20<br />
20.1<br />
20.6<br />
20.8<br />
21<br />
21.5<br />
22<br />
18-Jun-02 23-Aug-02 23-Oct-02 11-Feb-03 14-May-03 15-Jul-03 30-Sep-03 2-Dec-03 27-May-04 29-Aug-04 27-Oct-04 9-Dec-04 9-Feb-05 18-Apr-05 23-Jun-05 17-Aug-05 28-Sep-05 31-Oct-05 29-Nov-05 29-Dec-05 23-Jan-06<br />
Hard Hard Hard Hard Hard Hard Hard Hard Hard Hard Hard Hard Hard Hard Hard Hard Hard Hard Hard Hard Hard<br />
mg/L mg/L mg/L mg/L mg/L mg/L mg/L mg/L mg/L mg/L mg/L mg/L mg/L mg/L mg/L mg/L mg/L mg/L mg/L mg/L mg/L<br />
205 224 200 195 210 205 175 170 162 168 175 175 164 160 174 220 176 176 178 167 170<br />
210 224 200 180 190 205 160 170 162 168 175 175 164 160 170 195 180 176 178 172 175<br />
215 220 205 180 180 210 150 175 162 168 174 175 160 160 168 170 188 184 178 170 180<br />
215 216 205 180 170 210 145 175 162 168 174 170 160 165 166 190 180 190 180 170 175<br />
170 160<br />
168 172 180 165<br />
175 164 210 188<br />
172<br />
D.3-55<br />
Lake Merced<br />
South - Pump<br />
Station<br />
Depth<br />
Ft<br />
Surf<br />
5<br />
10<br />
12<br />
15<br />
16<br />
17<br />
18<br />
19<br />
19.2<br />
20<br />
20.4<br />
20.9<br />
21<br />
21.5<br />
22<br />
22.8<br />
23.2<br />
18-Jun-02 23-Aug-02 23-Oct-02 11-Feb-03 14-May-03 15-Jul-03 30-Sep-03 2-Dec-03 27-May-04 29-Aug-04 27-Oct-04 9-Dec-04 9-Feb-05 18-Apr-05 23-Jun-05 17-Aug-05 28-Sep-05 31-Oct-05 29-Nov-05 29-Dec-05 23-Jan-06<br />
Hard Hard Hard Hard Hard Hard Hard Hard Hard Hard Hard Hard Hard Hard Hard Hard Hard Hard Hard Hard Hard<br />
mg/L mg/L mg/L mg/L mg/L mg/L mg/L mg/L mg/L mg/L mg/L mg/L mg/L mg/L mg/L mg/L mg/L mg/L mg/L mg/L mg/L<br />
230 220 195 210 180 205 175 170 162 162 170 180 156 145 156 175 160 180 176 168 168<br />
220 220 195 195 190 210 165 175 162 164 170 180 160 150 156 195 164 176 176 168 172<br />
210 228 200 200 165 210 160 175 160 166 170 180 160 155 156 175 172 172 176 168 175<br />
210 230 200 200 165 210 155 170 160 165 170 175 164 150 156 200 172 168 176 170 175<br />
164<br />
164 170 196<br />
140<br />
158 175 192 176 172 178<br />
Page 5 of 6
Lake Merced<br />
South - Pistol<br />
Range<br />
Depth<br />
Ft<br />
Surf<br />
5<br />
6<br />
10<br />
12<br />
15<br />
16<br />
17<br />
18<br />
18.2<br />
18.5<br />
18.9<br />
19<br />
20<br />
20.1<br />
20.6<br />
20.8<br />
21<br />
21.5<br />
22<br />
01-Mar-06 26-Apr-06 14-Jun-06 24-Aug-06 25-Oct-06 20-Dec-06 29-Mar-07 26-Jun-07 20-Aug-07 27-Dec-07 28-Mar-08 10-Jun-08 24-Sep-08 4-Dec-08 24-Mar-09 4-Jun-09 22-Sep-09 15-Dec-09<br />
Hard Hard Hard Hard Hard Hard Hard Hard Hard Hard Hard Hard Hard Hard Hard Hard Hard Hard<br />
mg/L mg/L mg/L mg/L mg/L mg/L mg/L mg/L mg/L mg/L mg/L mg/L mg/L mg/L mg/L mg/L mg/L mg/L<br />
165 160 165 175 192 180 180 188 188 194 168 164 208 220 196 200 220 220<br />
166 160 175 170 184 172 180 188 188 194 168 184 208 212 196 202 220 208<br />
168 160 185 170 176 168 178 188 194 168 200 208 200 196 204 214 216<br />
168 160 190 175 180 176 178 186 188 194 188 192 192 200 200 204 218 220<br />
184<br />
168 160 190 180 200<br />
165 180 192<br />
186<br />
200<br />
200<br />
196<br />
188<br />
200<br />
218<br />
208<br />
D.3-56<br />
Lake Merced<br />
South - Pump<br />
Station<br />
Depth<br />
Ft<br />
Surf<br />
5<br />
10<br />
12<br />
15<br />
16<br />
17<br />
18<br />
19<br />
19.2<br />
20<br />
20.4<br />
20.9<br />
21<br />
21.5<br />
22<br />
22.8<br />
23.2<br />
01-Mar-06 26-Apr-06 14-Jun-06 24-Aug-06 25-Oct-06 20-Dec-06 29-Mar-07 26-Jun-07 20-Aug-07 27-Dec-07 28-Mar-08 10-Jun-08 24-Sep-08 4-Dec-08 24-Mar-09 4-Jun-09 22-Sep-09 15-Dec-09<br />
Hard Hard Hard Hard Hard Hard Hard Hard Hard Hard Hard Hard Hard Hard Hard Hard Hard Hard<br />
mg/L mg/L mg/L mg/L mg/L mg/L mg/L mg/L mg/L mg/L mg/L mg/L mg/L mg/L mg/L mg/L mg/L mg/L<br />
170 157 165 170 176 184 180 192 188 192 168 172 192 228 196 200 218 216<br />
168 160 165 170 180 176 180 192 188 192 172 204 208 196 206 220 228<br />
168 162 170 180 184 172 180 190 188 194 188 200 208 196 196 204 224 208<br />
166 162 175 190 176 172 178 186 188 192 192 176 208 196 196 204 224 220<br />
168<br />
162 170 180 188 190 200<br />
162 168 178 184<br />
180<br />
196<br />
196<br />
204<br />
232<br />
228<br />
Page 6 of 6
Lake Merced<br />
North<br />
15-May-97 10-Sep-97 3-Dec-97 16-Mar-98 8-Jul-98 23-Sep-98 17-Mar-99 21-Jun-99 15-Sep-99 8-Dec-99 21-Mar-00 21-Jun-00 9-Aug-00 19-Dec-00 7-Mar-01 20-Jun-01 1-Oct-01 18-Dec-01 5-Mar-02 30-Apr-02<br />
Depth Cl - Cl - Cl - Cl - Cl - Cl - Cl - Cl - Cl - Cl - Cl - Cl - Cl - Cl - Cl - Cl - Cl - Cl - Cl - Cl -<br />
Ft mg/L mg/L mg/L mg/L mg/L mg/L mg/L mg/L mg/L mg/L mg/L mg/L mg/L mg/L mg/L mg/L mg/L mg/L mg/L mg/L<br />
Surf 93 100 110 82 83 101 84 91 93 90 87 90 91 89 94 101 98 89 91<br />
5 92 98 110 82 81 100 84 91 93 88 87 90 91 89 94 100 91 95 91<br />
10 93 97 110 82 81 101 84 91 93 85 87 90 91 89 93 101 91 96 91<br />
14 91 93 91 100<br />
15 94 97 100 82 81 100 84 87 90 89 93 92 96 91<br />
16<br />
17<br />
17.4<br />
17.5<br />
18 85<br />
18.8<br />
19<br />
20<br />
20.6<br />
D.3-57<br />
Lake Merced<br />
North East<br />
15-May-97 10-Sep-97 3-Dec-97 16-Mar-98 8-Jul-98 23-Sep-98 17-Mar-99 21-Jun-99 15-Sep-99 8-Dec-99 21-Mar-00 21-Jun-00 9-Aug-00 19-Dec-00 7-Mar-01 20-Jun-01 1-Oct-01 18-Dec-01 5-Mar-02 30-Apr-02<br />
Depth Cl - Cl - Cl - Cl - Cl - Cl - Cl - Cl - Cl - Cl - Cl - Cl - Cl - Cl - Cl - Cl - Cl - Cl - Cl - Cl -<br />
Ft mg/L mg/L mg/L mg/L mg/L mg/L mg/L mg/L mg/L mg/L mg/L mg/L mg/L mg/L mg/L mg/L mg/L mg/L mg/L mg/L<br />
Surf 84 87 66 73 88 76 86 85 86 80 83 82 78 83 88 74 80 82<br />
5 84 88 66 73 88 76 86 86 80 80 83 82 77 83 88 75 77 81<br />
9 87<br />
10 84 88 66 73 87 76 86 86 80 83 82 77 83 78 78 80<br />
12<br />
13 76<br />
14<br />
14.1<br />
15<br />
15.8<br />
Page 1 of 6
D.3-58<br />
Lake Merced<br />
North<br />
Depth<br />
Ft<br />
Surf<br />
5<br />
10<br />
14<br />
15<br />
16<br />
17<br />
17.4<br />
17.5<br />
18<br />
18.8<br />
19<br />
20<br />
20.6<br />
Lake Merced<br />
North East<br />
Depth<br />
Ft<br />
Surf<br />
5<br />
9<br />
10<br />
12<br />
13<br />
14<br />
14.1<br />
15<br />
15.8<br />
18-Jun-02 23-Aug-02 23-Oct-02 11-Feb-03 14-May-03 15-Jul-03 30-Sep-03 2-Dec-03 27-May-04 29-Aug-04 27-Oct-04 9-Dec-04 9-Feb-05 18-Apr-05 23-Jun-05 17-Aug-05 28-Sep-05 31-Oct-05 29-Nov-05 29-Dec-05<br />
Cl - Cl - Cl - Cl - Cl - Cl - Cl - Cl - Cl - Cl - Cl - Cl - Cl - Cl - Cl - Cl - Cl - Cl - Cl - Cl -<br />
mg/L mg/L mg/L mg/L mg/L mg/L mg/L mg/L mg/L mg/L mg/L mg/L mg/L mg/L mg/L mg/L mg/L mg/L mg/L mg/L<br />
95 96 100 86 83 94 102 103 87 87 87 98 93 83 85 91 91 89 89 78<br />
93 98 100 86 83 94 102 105 86 87 89 98 93 82 86 91 90 89 89 78<br />
93 100 100 87 83 94 102 105 86 89 90 98 92 82 87 90 89 90 88 78<br />
93 100 100 87 83 94 102 105 85 92 91 98 92 81 86 90 89 90 89 78<br />
90<br />
93 91 89<br />
98 80 90 90 78<br />
18-Jun-02 23-Aug-02 23-Oct-02 11-Feb-03 14-May-03 15-Jul-03 30-Sep-03 2-Dec-03 27-May-04 29-Aug-04 27-Oct-04 9-Dec-04 9-Feb-05 18-Apr-05 23-Jun-05 17-Aug-05 28-Sep-05 31-Oct-05 29-Nov-05 29-Dec-05<br />
Cl - Cl - Cl - Cl - Cl - Cl - Cl - Cl - Cl - Cl - Cl - Cl - Cl - Cl - Cl - Cl - Cl - Cl - Cl - Cl -<br />
mg/L mg/L mg/L mg/L mg/L mg/L mg/L mg/L mg/L mg/L mg/L mg/L mg/L mg/L mg/L mg/L mg/L mg/L mg/L mg/L<br />
83 86 86 74 70 88 96 104 88 88 85 100 86 75 83 85 87 86 90 74<br />
82 88 86 74 70 87 96 106 88 88 84 100 86 75 83 84 87 86 90 74<br />
82 88 86 74 70 87 96 106 88 88 84 100 86 76 82 83 88 86 89 73<br />
86<br />
88 100 86 82 83 88 86 89<br />
76 72<br />
Page 2 of 6
Lake Merced<br />
North<br />
Depth<br />
Ft<br />
Surf<br />
5<br />
10<br />
14<br />
15<br />
16<br />
17<br />
17.4<br />
17.5<br />
18<br />
18.8<br />
19<br />
20<br />
20.6<br />
23-Jan-06 01-Mar-06 26-Apr-06 14-Jun-06 24-Aug-06 25-Oct-06 20-Dec-06 29-Mar-07 26-Jun-07 20-Aug-07 27-Dec-07 28-Mar-08 10-Jun-08 24-Sep-08 4-Dec-08<br />
Cl - Cl - Cl - Cl - Cl - Cl - Cl - Cl - Cl - Cl - Cl - Cl - Cl - Cl - Cl -<br />
mg/L mg/L mg/L mg/L mg/L mg/L mg/L mg/L mg/L mg/L mg/L mg/L mg/L mg/L mg/L<br />
84 84 78 83 84 86 95 83 91 90 96 100 100<br />
84 84 78 83 85 86 95 84 91 90 96 100 100<br />
84 84 78 83 86 87 95 86 90 89 94 100 100<br />
83 84 78 82 86 87 96 87 89 89 93 100 100<br />
83 87 90<br />
84 78 82 86 96 88 89 92<br />
100<br />
100<br />
D.3-59<br />
Lake Merced<br />
North East<br />
Depth<br />
Ft<br />
Surf<br />
5<br />
9<br />
10<br />
12<br />
13<br />
14<br />
14.1<br />
15<br />
15.8<br />
23-Jan-06 01-Mar-06 26-Apr-06 14-Jun-06 24-Aug-06 25-Oct-06 20-Dec-06 29-Mar-07 26-Jun-07 20-Aug-07 27-Dec-07 28-Mar-08 10-Jun-08 24-Sep-08 4-Dec-08<br />
Cl - Cl - Cl - Cl - Cl - Cl - Cl - Cl - Cl - Cl - Cl - Cl - Cl - Cl - Cl -<br />
mg/L mg/L mg/L mg/L mg/L mg/L mg/L mg/L mg/L mg/L mg/L mg/L mg/L mg/L mg/L<br />
90 82 75 80 82 93 92 86 90 90 91 100 100<br />
88 82 75 80 82 93 94 87 90 89 91 100 100<br />
88 80 76 80 82 93 95 87 88 89 90 98 100<br />
86 93 100<br />
80 80 82 88<br />
76 95 87 87 90<br />
98<br />
Page 3 of 6
Lake Merced<br />
South - Pistol<br />
Range<br />
15-May-97 10-Sep-97 3-Dec-97 16-Mar-98 8-Jul-98 23-Sep-98 17-Mar-99 21-Jun-99 15-Sep-99 8-Dec-99 21-Mar-00 21-Jun-00 9-Aug-00 19-Dec-00 7-Mar-01 20-Jun-01 1-Oct-01 18-Dec-01 5-Mar-02 30-Apr-02<br />
Depth Cl - Cl - Cl - Cl - Cl - Cl - Cl - Cl - Cl - Cl - Cl - Cl - Cl - Cl - Cl - Cl - Cl - Cl - Cl - Cl -<br />
Ft mg/L mg/L mg/L mg/L mg/L mg/L mg/L mg/L mg/L mg/L mg/L mg/L mg/L mg/L mg/L mg/L mg/L mg/L mg/L mg/L<br />
Surf 61 63 70 58 59 83 65 64 69 71 75 70 71 74 74 78 83 75 83 80<br />
5 61 63 69 58 83 65 64 69 71 75 69 71 74 73 78 83 76 82 80<br />
6 58<br />
10 60 63 69 58 83 65 64 69 71 75 69 71 74 73 78 83 77 83 82<br />
12 58<br />
15 61 63 69 58 83 65 64 69 71 73 73 78 83 78 82 82<br />
16 60 63<br />
17<br />
18 58 69 71<br />
19<br />
20 77<br />
21<br />
21.5<br />
22<br />
D.3-60<br />
Lake Merced<br />
South -<br />
Pump Station<br />
15-May-97 10-Sep-97 3-Dec-97 16-Mar-98 8-Jul-98 23-Sep-98 17-Mar-99 21-Jun-99 15-Sep-99 8-Dec-99 21-Mar-00 21-Jun-00 9-Aug-00 19-Dec-00 7-Mar-01 20-Jun-01 1-Oct-01 18-Dec-01 5-Mar-02 30-Apr-02<br />
Depth Cl - Cl - Cl - Cl - Cl - Cl - Cl - Cl - Cl - Cl - Cl - Cl - Cl - Cl - Cl - Cl - Cl - Cl - Cl - Cl -<br />
Ft mg/L mg/L mg/L mg/L mg/L mg/L mg/L mg/L mg/L mg/L mg/L mg/L mg/L mg/L mg/L mg/L mg/L mg/L mg/L mg/L<br />
Surf 61 63 69 58 60 83 66 64 69 71 76 70 71 73 73 77 83 79 80 83<br />
5 61 63 69 58 59 83 66 64 69 71 76 69 71 73 73 77 83 81 81 83<br />
10 61 63 69 58 83 65 64 69 71 77 69 71 73 73 77 83 79 83 82<br />
12 58<br />
15 61 63 69 58 83 66 64 69 71 73 73 77 83 80 82 82<br />
16<br />
17<br />
18 58 69<br />
19 70<br />
20 72<br />
21<br />
22<br />
23.2<br />
Page 4 of 6
Lake Merced<br />
South - Pistol<br />
Range<br />
Depth<br />
Ft<br />
Surf<br />
5<br />
6<br />
10<br />
12<br />
15<br />
16<br />
17<br />
18<br />
19<br />
20<br />
21<br />
21.5<br />
22<br />
18-Jun-02 23-Aug-02 23-Oct-02 11-Feb-03 14-May-03 15-Jul-03 30-Sep-03 2-Dec-03 27-May-04 29-Aug-04 27-Oct-04 9-Dec-04 9-Feb-05 18-Apr-05 23-Jun-05 17-Aug-05 28-Sep-05 31-Oct-05 29-Nov-05 29-Dec-05<br />
Cl - Cl - Cl - Cl - Cl - Cl - Cl - Cl - Cl - Cl - Cl - Cl - Cl - Cl - Cl - Cl - Cl - Cl - Cl - Cl -<br />
mg/L mg/L mg/L mg/L mg/L mg/L mg/L mg/L mg/L mg/L mg/L mg/L mg/L mg/L mg/L mg/L mg/L mg/L mg/L mg/L<br />
83 88 78 73 68 75 80 75 56 67 68 84 67 65 71 72 72 72 78 68<br />
83 88 78 73 68 75 80 75 56 66 67 84 67 65 71 73 72 72 78 66<br />
82 88 78 72 68 76 80 76 57 65 65 85 67 64 71 74 72 73 77 65<br />
82 88 78 72 68 76 80 76 58 63 65 85 67 64 71 72 72 73 77 66<br />
85 67<br />
62 72 76<br />
64 71 71 72<br />
69<br />
D.3-61<br />
Lake Merced<br />
South -<br />
Pump Station<br />
Depth<br />
Ft<br />
Surf<br />
5<br />
10<br />
12<br />
15<br />
16<br />
17<br />
18<br />
19<br />
20<br />
21<br />
22<br />
23.2<br />
18-Jun-02 23-Aug-02 23-Oct-02 11-Feb-03 14-May-03 15-Jul-03 30-Sep-03 2-Dec-03 27-May-04 29-Aug-04 27-Oct-04 9-Dec-04 9-Feb-05 18-Apr-05 23-Jun-05 17-Aug-05 28-Sep-05 31-Oct-05 29-Nov-05 29-Dec-05<br />
Cl - Cl - Cl - Cl - Cl - Cl - Cl - Cl - Cl - Cl - Cl - Cl - Cl - Cl - Cl - Cl - Cl - Cl - Cl - Cl -<br />
mg/L mg/L mg/L mg/L mg/L mg/L mg/L mg/L mg/L mg/L mg/L mg/L mg/L mg/L mg/L mg/L mg/L mg/L mg/L mg/L<br />
82 87 76 73 68 76 78 74 61 65 63 82 63 65 71 72 73 73 77 73<br />
82 84 76 73 68 76 78 74 60 65 63 82 63 65 71 72 73 73 77 72<br />
81 84 75 73 68 77 78 75 60 65 64 84 64 65 71 71 73 73 77 72<br />
81 82 75 73 68 77 78 75 59 64 65 84 64 65 70 71 73 72 76 82<br />
64<br />
64 85 72<br />
70 72 73 76 84<br />
65<br />
Page 5 of 6
Lake Merced<br />
South - Pistol<br />
Range<br />
Depth<br />
Ft<br />
Surf<br />
5<br />
6<br />
10<br />
12<br />
15<br />
16<br />
17<br />
18<br />
19<br />
20<br />
21<br />
21.5<br />
22<br />
23-Jan-06 01-Mar-06 26-Apr-06 14-Jun-06 24-Aug-06 25-Oct-06 20-Dec-06 29-Mar-07 26-Jun-07 20-Aug-07 27-Dec-07 28-Mar-08 10-Jun-08 24-Sep-08 4-Dec-08<br />
Cl - Cl - Cl - Cl - Cl - Cl - Cl - Cl - Cl - Cl - Cl - Cl - Cl - Cl - Cl -<br />
mg/L mg/L mg/L mg/L mg/L mg/L mg/L mg/L mg/L mg/L mg/L mg/L mg/L mg/L mg/L<br />
73 74 70 70 75 88 87 84 82 84 87 94 98<br />
73 74 70 70 75 88 88 84 82 84 87 94 97<br />
73 74 70 71 75 88 88 83 82 88 94 96<br />
73 74 70 71 75 90 88 83 81 83 88 94 98<br />
73<br />
90<br />
74 70 75 88 98<br />
71 82 88<br />
94<br />
81<br />
D.3-62<br />
Lake Merced<br />
South -<br />
Pump Station<br />
Depth<br />
Ft<br />
Surf<br />
5<br />
10<br />
12<br />
15<br />
16<br />
17<br />
18<br />
19<br />
20<br />
21<br />
22<br />
23.2<br />
23-Jan-06 01-Mar-06 26-Apr-06 14-Jun-06 24-Aug-06 25-Oct-06 20-Dec-06 29-Mar-07 26-Jun-07 20-Aug-07 27-Dec-07 28-Mar-08 10-Jun-08 24-Sep-08 4-Dec-08<br />
Cl - Cl - Cl - Cl - Cl - Cl - Cl - Cl - Cl - Cl - Cl - Cl - Cl - Cl - Cl -<br />
mg/L mg/L mg/L mg/L mg/L mg/L mg/L mg/L mg/L mg/L mg/L mg/L mg/L mg/L mg/L<br />
74 74 70 71 75 90 89 83 81 83 86 93 98<br />
74 74 70 71 75 90 88 80 81 83 86 93 98<br />
73 74 70 72 74 90 88 76 81 83 86 94 96<br />
73 74 72 72 74 90 88 76 80 83 86 94 98<br />
73<br />
90<br />
74 72 74 83 86 98<br />
72 88 76 80<br />
94<br />
Page 6 of 6
Lake Merced<br />
North<br />
15-May-97 10-Sep-97 3-Dec-97 16-Mar-98 8-Jul-98 23-Sep-98 17-Mar-99 21-Jun-99 15-Sep-99 8-Dec-99 21-Mar-00 21-Jun-00 9-Aug-00 19-Dec-00 7-Mar-01 20-Jun-01 1-Oct-01 18-Dec-01 5-Mar-02 30-Apr-02 18-Jun-02<br />
Depth NO 3-N NO 3-N NO 3-N NO 3-N NO 3-N NO 3-N NO 3-N NO 3-N NO 3-N NO 3-N NO 3-N NO 3-N NO 3-N NO 3-N NO 3-N NO 3-N NO 3-N NO 3-N NO 3-N NO 3-N NO 3-N<br />
Ft mg/L mg/L mg/L mg/L mg/L mg/L mg/L mg/L mg/L mg/L mg/L mg/L mg/L mg/L mg/L mg/L mg/L mg/L mg/L mg/L mg/L<br />
Surf 0.045 0.045 0.045 0.045 0.045 0.045 0.025 0.025 0.025 0.025 0.025 0.025 0.005 0.025 0.025 0.005 0.005 0.01 0.05 0.005<br />
5 0.045 0.045 0.045 0.045 0.045 0.045 0.025 0.025 0.025 0.025 0.025 0.025 0.005 0.025 0.025 0.005 0.005 0.01 0.06 0.005<br />
10 0.045 0.045 0.045 0.045 0.045 0.045 0.025 0.025 0.025 0.025 0.025 0.025 0.005 0.025 0.025 0.005 0.005 0.01 0.005 0.005<br />
14 0.025 0.025 0.005 0.005<br />
15 0.045 0.045 0.045 0.045 0.045 0.045 0.025 0.025 0.025 0.025 0.025 0.005 0.01 0.005 0.005<br />
16<br />
17<br />
17.4<br />
17.5<br />
18 0.025<br />
18.8<br />
19<br />
19.3<br />
19.9<br />
20<br />
20.6<br />
D.3-63<br />
Lake Merced<br />
North East<br />
15-May-97 10-Sep-97 3-Dec-97 16-Mar-98 8-Jul-98 23-Sep-98 17-Mar-99 21-Jun-99 15-Sep-99 8-Dec-99 21-Mar-00 21-Jun-00 9-Aug-00 19-Dec-00 7-Mar-01 20-Jun-01 1-Oct-01 18-Dec-01 5-Mar-02 30-Apr-02 18-Jun-02<br />
Depth NO 3-N NO 3-N NO 3-N NO 3-N NO 3-N NO 3-N NO 3-N NO 3-N NO 3-N NO 3-N NO 3-N NO 3-N NO 3-N NO 3-N NO 3-N NO 3-N NO 3-N NO 3-N NO 3-N NO 3-N NO 3-N<br />
Ft mg/L mg/L mg/L mg/L mg/L mg/L mg/L mg/L mg/L mg/L mg/L mg/L mg/L mg/L mg/L mg/L mg/L mg/L mg/L mg/L mg/L<br />
Surf 0.045 0.16 0.045 0.045 0.045 0.025 0.025 0.025 0.025 0.025 0.025 0.005 0.025 0.025 0.005 0.005 0.01 0.005 0.005<br />
5 0.045 0.16 0.045 0.045 0.045 0.025 0.025 0.025 0.025 0.025 0.025 0.005 0.025 0.025 0.005 0.005 0.01 0.005 0.005<br />
9 0.005<br />
10 0.045 0.16 0.045 0.045 0.045 0.025 0.025 0.025 0.025 0.025 0.005 0.025 0.025 0.005 0.01 0.005 0.005<br />
11<br />
12<br />
13 0.025<br />
13.8<br />
14<br />
14.1<br />
14.7<br />
15<br />
15.8<br />
Page 1 of 6
D.3-64<br />
Lake Merced<br />
North<br />
Depth<br />
Ft<br />
Surf<br />
5<br />
10<br />
14<br />
15<br />
16<br />
17<br />
17.4<br />
17.5<br />
18<br />
18.8<br />
19<br />
19.3<br />
19.9<br />
20<br />
20.6<br />
Lake Merced<br />
North East<br />
Depth<br />
Ft<br />
Surf<br />
5<br />
9<br />
10<br />
11<br />
12<br />
13<br />
13.8<br />
14<br />
14.1<br />
14.7<br />
15<br />
15.8<br />
23-Aug-02 23-Oct-02 11-Feb-03 14-May-03 15-Jul-03 30-Sep-03 2-Dec-03 27-May-04 29-Aug-04 27-Oct-04 9-Dec-04 9-Feb-05 18-Apr-05 23-Jun-05 17-Aug-05 28-Sep-05 31-Oct-05 29-Nov-05 29-Dec-05 23-Jan-06 01-Mar-06 26-Apr-06<br />
NO 3-N NO 3-N NO 3-N NO 3-N NO 3-N NO 3-N NO 3-N NO 3-N NO 3-N NO 3-N NO 3-N NO 3-N NO 3-N NO 3-N NO 3-N NO 3-N NO 3-N NO 3-N NO 3-N NO 3-N NO 3-N NO 3-N<br />
mg/L mg/L mg/L mg/L mg/L mg/L mg/L mg/L mg/L mg/L mg/L mg/L mg/L mg/L mg/L mg/L mg/L mg/L mg/L mg/L mg/L mg/L<br />
0.005 0.34 0.02 0.005 1.42 1.10 0.86 0.32 0.005 0.005 0.005 0.005 0.005 0.005 0.005 0.005 0.005 0.005 0.11 0.005 0.005 0.005<br />
0.005 1.06 0.02 0.005 1.48 1.10 0.90 0.50 0.005 0.005 0.005 0.005 0.005 0.005 0.005 0.005 0.005 0.005 0.42 0.005 0.005 0.005<br />
0.005 0.48 0.005 0.005 1.54 1.20 0.90 0.66 0.005 0.005 0.005 0.005 0.005 0.005 0.005 0.005 0.005 0.005 0.24 0.005 0.02 0.005<br />
0.005 0.46 0.005 0.005 1.48 1.20 0.78 0.48 0.005 0.005 0.005 0.005 0.005 0.005 0.005 0.005 0.005 0.005 0.14 0.005 0.09 0.005<br />
0.005<br />
0.005 0.005 0.005<br />
0.005 0.005 0.005 0.005 0.005 0.005<br />
0.005 0.13 0.005<br />
23-Aug-02 23-Oct-02 11-Feb-03 14-May-03 15-Jul-03 30-Sep-03 2-Dec-03 27-May-04 29-Aug-04 27-Oct-04 9-Dec-04 9-Feb-05 18-Apr-05 23-Jun-05 17-Aug-05 28-Sep-05 31-Oct-05 29-Nov-05 29-Dec-05 23-Jan-06 01-Mar-06 26-Apr-06<br />
NO 3-N NO 3-N NO 3-N NO 3-N NO 3-N NO 3-N NO 3-N NO 3-N NO 3-N NO 3-N NO 3-N NO 3-N NO 3-N NO 3-N NO 3-N NO 3-N NO 3-N NO 3-N NO 3-N NO 3-N NO 3-N NO 3-N<br />
mg/L mg/L mg/L mg/L mg/L mg/L mg/L mg/L mg/L mg/L mg/L mg/L mg/L mg/L mg/L mg/L mg/L mg/L mg/L mg/L mg/L mg/L<br />
0.005 0.005 0.005 0.005 1.00 0.82 1.50 0.32 0.005 0.005 0.005 0.005 0.005 0.005 0.005 0.005 0.005 0.005 0.31 0.005 0.005 0.005<br />
0.005 0.005 0.005 0.005 1.00 0.64 0.90 0.48 0.005 0.005 0.005 0.005 0.005 0.005 0.005 0.005 0.005 0.005 0.24 0.005 0.005 0.005<br />
0.005 0.005 0.02 0.005 0.64 0.66 0.86 0.48 0.005 0.005 0.005 0.005 0.005 0.005 0.005 0.005 0.005 0.005 0.005 0.005 0.005 0.005<br />
0.005 0.005 0.005 0.005 0.005 0.005 0.005 0.005 0.005<br />
0.005 0.48 0.005<br />
0.005<br />
Page 2 of 6
Lake Merced<br />
North<br />
Depth<br />
Ft<br />
Surf<br />
5<br />
10<br />
14<br />
15<br />
16<br />
17<br />
17.4<br />
17.5<br />
18<br />
18.8<br />
19<br />
19.3<br />
19.9<br />
20<br />
20.6<br />
14-Jun-06 24-Aug-06 25-Oct-06 20-Dec-06 29-Mar-07 26-Jun-07 20-Aug-07 27-Dec-07 28-Mar-08 10-Jun-08 24-Sep-08 4-Dec-08 24-Mar-09 4-Jun-09 22-Sep-09 15-Dec-09<br />
NO 3-N NO 3-N NO 3-N NO 3-N NO 3-N NO 3-N NO 3-N NO 3-N NO 3-N NO 3-N NO 3-N NO 3-N NO 3-N NO 3-N NO 3-N NO 3-N<br />
mg/L mg/L mg/L mg/L mg/L mg/L mg/L mg/L mg/L mg/L mg/L mg/L mg/L mg/L mg/L mg/L<br />
0.005 0.005 0.005 0.005 0.005 0.005 0.005 0.05 0.005 0.005 0.005 0.93 0.005 0.005 0.005 0.07<br />
0.005 0.005 0.005 0.005 0.005 0.005 0.005 0.03 0.005 0.005 0.005 1.10 0.005 0.005 0.005 0.08<br />
0.005 0.005 0.005 0.005 0.005 0.005 0.005 0.05 0.005 0.005 0.005 0.96 0.005 0.005 0.005 0.07<br />
0.005 0.005 0.005 0.005 0.005 0.005 0.005 0.04 0.005 0.005 0.93 0.005 0.005 0.005 0.10<br />
0.005 0.005<br />
0.005 0.005 0.005 0.005 0.005 0.04<br />
0.005<br />
0.005<br />
0.96<br />
0.005 0.12<br />
0.005<br />
0.005<br />
0.005<br />
D.3-65<br />
Lake Merced<br />
North East<br />
Depth<br />
Ft<br />
Surf<br />
5<br />
9<br />
10<br />
11<br />
12<br />
13<br />
13.8<br />
14<br />
14.1<br />
14.7<br />
15<br />
15.8<br />
14-Jun-06 24-Aug-06 25-Oct-06 20-Dec-06 29-Mar-07 26-Jun-07 20-Aug-07 27-Dec-07 28-Mar-08 10-Jun-08 24-Sep-08 4-Dec-08 24-Mar-09 4-Jun-09 22-Sep-09 15-Dec-09<br />
NO 3-N NO 3-N NO 3-N NO 3-N NO 3-N NO 3-N NO 3-N NO 3-N NO 3-N NO 3-N NO 3-N NO 3-N NO 3-N NO 3-N NO 3-N NO 3-N<br />
mg/L mg/L mg/L mg/L mg/L mg/L mg/L mg/L mg/L mg/L mg/L mg/L mg/L mg/L mg/L mg/L<br />
0.005 0.005 0.005 0.06 0.005 0.005 0.005 0.11 0.005 0.005 0.005 0.37 0.005 0.005 0.005 0.09<br />
0.005 0.005 0.005 0.06 0.005 0.005 0.005 0.10 0.005 0.005 0.005 0.17 0.005 0.005 0.005 0.11<br />
0.005 0.005 0.005 0.05 0.005 0.005 0.005 0.12 0.005 0.005 0.02 0.63 0.005 0.005 0.005 0.12<br />
0.005 0.005 0.01<br />
0.005<br />
0.005 0.005 0.005<br />
0.78<br />
0.005 0.12<br />
0.05 0.005 0.005 0.10 0.005<br />
0.005<br />
Page 3 of 6
Lake Merced<br />
South - Pistol<br />
Range<br />
15-May-97 10-Sep-97 3-Dec-97 16-Mar-98 8-Jul-98 23-Sep-98 17-Mar-99 21-Jun-99 15-Sep-99 8-Dec-99 21-Mar-00 21-Jun-00 9-Aug-00 19-Dec-00 7-Mar-01 20-Jun-01 1-Oct-01 18-Dec-01 5-Mar-02 30-Apr-02 18-Jun-02<br />
Depth NO 3-N NO 3-N NO 3-N NO 3-N NO 3-N NO 3-N NO 3-N NO 3-N NO 3-N NO 3-N NO 3-N NO 3-N NO 3-N NO 3-N NO 3-N NO 3-N NO 3-N NO 3-N NO 3-N NO 3-N NO 3-N<br />
Ft mg/L mg/L mg/L mg/L mg/L mg/L mg/L mg/L mg/L mg/L mg/L mg/L mg/L mg/L mg/L mg/L mg/L mg/L mg/L mg/L mg/L<br />
Surf 0.045 0.045 0.045 0.045 0.045 0.045 0.025 0.025 0.025 0.025 0.025 0.025 0.025 0.005 0.025 0.025 0.005 0.005 0.01 0.005 0.005<br />
5 0.045 0.045 0.045 0.045 0.045 0.025 0.025 0.025 0.025 0.025 0.025 0.025 0.005 0.025 0.025 0.005 0.005 0.01 0.005 0.005<br />
6 0.045<br />
10 0.045 0.045 0.045 0.045 0.045 0.025 0.025 0.025 0.025 0.025 0.025 0.025 0.005 0.025 0.025 0.005 0.005 0.01 0.005 0.005<br />
12 0.045<br />
15 0.045 0.045 0.045 0.045 0.045 0.025 0.025 0.025 0.025 0.005 0.025 0.025 0.005 0.005 0.01 0.005 0.005<br />
16 0.045 0.045<br />
17<br />
18 0.045 0.025 0.025<br />
18.2<br />
18.5<br />
18.9<br />
19<br />
20 0.025<br />
20.1<br />
20.6<br />
20.8<br />
21<br />
21.5<br />
22<br />
D.3-66<br />
Lake Merced<br />
South - Pump<br />
Station<br />
15-May-97 10-Sep-97 3-Dec-97 16-Mar-98 8-Jul-98 23-Sep-98 17-Mar-99 21-Jun-99 15-Sep-99 8-Dec-99 21-Mar-00 21-Jun-00 9-Aug-00 19-Dec-00 7-Mar-01 20-Jun-01 1-Oct-01 18-Dec-01 5-Mar-02 30-Apr-02 18-Jun-02<br />
Depth NO 3-N NO 3-N NO 3-N NO 3-N NO 3-N NO 3-N NO 3-N NO 3-N NO 3-N NO 3-N NO 3-N NO 3-N NO 3-N NO 3-N NO 3-N NO 3-N NO 3-N NO 3-N NO 3-N NO 3-N NO 3-N<br />
Ft mg/L mg/L mg/L mg/L mg/L mg/L mg/L mg/L mg/L mg/L mg/L mg/L mg/L mg/L mg/L mg/L mg/L mg/L mg/L mg/L mg/L<br />
Surf 0.045 0.045 0.045 0.045 0.045 0.045 0.025 0.025 0.025 0.025 0.025 0.025 0.025 0.005 0.025 0.025 0.005 0.005 0.01 0.005 0.005<br />
5 0.045 0.045 0.045 0.045 0.045 0.045 0.025 0.025 0.025 0.025 0.025 0.025 0.025 0.005 0.025 0.025 0.005 0.01 0.01 0.005 0.005<br />
10 0.045 0.045 0.045 0.045 0.045 0.025 0.025 0.025 0.025 0.025 0.025 0.025 0.005 0.025 0.025 0.005 0.005 0.01 0.005 0.005<br />
12 0.045<br />
15 0.045 0.045 0.045 0.045 0.045 0.025 0.025 0.025 0.025 0.005 0.025 0.025 0.005 0.005 0.01 0.005 0.005<br />
16<br />
17<br />
18 0.045 0.025<br />
19 0.025<br />
19.2<br />
20 0.025<br />
20.4<br />
20.9<br />
21<br />
21.5<br />
22<br />
22.8<br />
23.2<br />
Note: Bold, italicized formats indicate half the reported value for statistical purposes.<br />
Page 4 of 6
Lake Merced<br />
South - Pistol<br />
Range<br />
Depth<br />
Ft<br />
Surf<br />
5<br />
6<br />
10<br />
12<br />
15<br />
16<br />
17<br />
18<br />
18.2<br />
18.5<br />
18.9<br />
19<br />
20<br />
20.1<br />
20.6<br />
20.8<br />
21<br />
21.5<br />
22<br />
23-Aug-02 23-Oct-02 11-Feb-03 14-May-03 15-Jul-03 30-Sep-03 2-Dec-03 27-May-04 29-Aug-04 27-Oct-04 9-Dec-04 9-Feb-05 18-Apr-05 23-Jun-05 17-Aug-05 28-Sep-05 31-Oct-05 29-Nov-05 29-Dec-05 23-Jan-06 01-Mar-06 26-Apr-06<br />
NO 3-N NO 3-N NO 3-N NO 3-N NO 3-N NO 3-N NO 3-N NO 3-N NO 3-N NO 3-N NO 3-N NO 3-N NO 3-N NO 3-N NO 3-N NO 3-N NO 3-N NO 3-N NO 3-N NO 3-N NO 3-N NO 3-N<br />
mg/L mg/L mg/L mg/L mg/L mg/L mg/L mg/L mg/L mg/L mg/L mg/L mg/L mg/L mg/L mg/L mg/L mg/L mg/L mg/L mg/L mg/L<br />
0.005 0.04 0.02 0.005 0.05 0.54 0.14 0.05 0.005 0.005 0.005 0.005 0.005 0.005 0.005 0.005 0.005 0.005 0.005 0.005 0.005 0.005<br />
0.005 0.06 0.005 0.005 0.20 0.55 0.15 0.09 0.005 0.005 0.005 0.005 0.005 0.005 0.005 0.005 0.005 0.005 0.005 0.005 0.005 0.005<br />
0.005 0.04 0.01 0.005 0.35 0.52 0.08 0.11 0.005 0.005 0.005 0.005 0.005 0.005 0.005 0.005 0.005 0.005 0.005 0.005 0.005 0.005<br />
0.005 0.23 0.005 0.005 0.40 0.49 0.07 0.32 0.005 0.005 0.005 0.005 0.005 0.005 0.005 0.005 0.005 0.005 0.005 0.005 0.005 0.005<br />
0.005 0.005<br />
0.005 0.005 0.005 0.005<br />
0.005<br />
0.005 0.005 0.005 0.005 0.005 0.005<br />
D.3-67<br />
Lake Merced<br />
South - Pump<br />
Station<br />
Depth<br />
Ft<br />
Surf<br />
5<br />
10<br />
12<br />
15<br />
16<br />
17<br />
18<br />
19<br />
19.2<br />
20<br />
20.4<br />
20.9<br />
21<br />
21.5<br />
22<br />
22.8<br />
23.2<br />
23-Aug-02 23-Oct-02 11-Feb-03 14-May-03 15-Jul-03 30-Sep-03 2-Dec-03 27-May-04 29-Aug-04 27-Oct-04 9-Dec-04 9-Feb-05 18-Apr-05 23-Jun-05 17-Aug-05 28-Sep-05 31-Oct-05 29-Nov-05 29-Dec-05 23-Jan-06 01-Mar-06 26-Apr-06<br />
NO 3-N NO 3-N NO 3-N NO 3-N NO 3-N NO 3-N NO 3-N NO 3-N NO 3-N NO 3-N NO 3-N NO 3-N NO 3-N NO 3-N NO 3-N NO 3-N NO 3-N NO 3-N NO 3-N NO 3-N NO 3-N NO 3-N<br />
mg/L mg/L mg/L mg/L mg/L mg/L mg/L mg/L mg/L mg/L mg/L mg/L mg/L mg/L mg/L mg/L mg/L mg/L mg/L mg/L mg/L mg/L<br />
0.005 0.01 0.02 0.005 0.005 0.49 0.03 0.23 0.005 0.005 0.005 0.005 0.005 0.005 0.005 0.005 0.005 0.005 0.005 0.005 0.005 0.005<br />
0.005 0.005 0.01 0.005 0.62 0.48 0.35 0.11 0.005 0.005 0.005 0.005 0.005 0.005 0.005 0.005 0.005 0.005 0.005 0.005 0.005 0.005<br />
0.005 0.005 0.005 0.005 0.44 0.46 0.05 0.31 0.005 0.005 0.005 0.005 0.005 0.005 0.005 0.005 0.005 0.005 0.005 0.005 0.005 0.005<br />
0.005 0.01 0.005 0.005 0.40 0.45 0.10 0.50 0.005 0.005 0.005 0.005 0.005 0.005 0.005 0.005 0.005 0.005 0.005 0.005 0.005 0.005<br />
0.005<br />
0.005 0.005 0.005<br />
0.005 0.005 0.005 0.005 0.005 0.005<br />
0.005 0.005<br />
0.005<br />
Page 5 of 6
Lake Merced<br />
South - Pistol<br />
Range<br />
Depth<br />
Ft<br />
Surf<br />
5<br />
6<br />
10<br />
12<br />
15<br />
16<br />
17<br />
18<br />
18.2<br />
18.5<br />
18.9<br />
19<br />
20<br />
20.1<br />
20.6<br />
20.8<br />
21<br />
21.5<br />
22<br />
14-Jun-06 24-Aug-06 25-Oct-06 20-Dec-06 29-Mar-07 26-Jun-07 20-Aug-07 27-Dec-07 28-Mar-08 10-Jun-08 24-Sep-08 4-Dec-08 24-Mar-09 4-Jun-09 22-Sep-09 15-Dec-09<br />
NO 3-N NO 3-N NO 3-N NO 3-N NO 3-N NO 3-N NO 3-N NO 3-N NO 3-N NO 3-N NO 3-N NO 3-N NO 3-N NO 3-N NO 3-N NO 3-N<br />
mg/L mg/L mg/L mg/L mg/L mg/L mg/L mg/L mg/L mg/L mg/L mg/L mg/L mg/L mg/L mg/L<br />
0.005 0.005 0.005 0.005 0.005 0.005 0.005 0.005 0.005 0.005 0.005 0.06 0.005 0.005 0.005 0.005<br />
0.005 0.005 0.005 0.005 0.005 0.005 0.005 0.005 0.005 0.005 0.005 0.06 0.005 0.005 0.005 0.005<br />
0.005 0.005 0.005 0.005 0.005 0.005 0.005 0.005 0.005 0.005 0.11 0.005 0.005 0.005 0.005<br />
0.005 0.005 0.005 0.005 0.005 0.005 0.005 0.005 0.005 0.005 0.08 0.21 0.005 0.005 0.005 0.005<br />
0.005<br />
0.005 0.005 0.005<br />
0.005 0.01 0.005<br />
0.005<br />
0.005<br />
0.15<br />
0.31<br />
0.005<br />
0.005<br />
0.005<br />
0.005<br />
D.3-68<br />
Lake Merced<br />
South - Pump<br />
Station<br />
Depth<br />
Ft<br />
Surf<br />
5<br />
10<br />
12<br />
15<br />
16<br />
17<br />
18<br />
19<br />
19.2<br />
20<br />
20.4<br />
20.9<br />
21<br />
21.5<br />
22<br />
22.8<br />
23.2<br />
14-Jun-06 24-Aug-06 25-Oct-06 20-Dec-06 29-Mar-07 26-Jun-07 20-Aug-07 27-Dec-07 28-Mar-08 10-Jun-08 24-Sep-08 4-Dec-08 24-Mar-09 4-Jun-09 22-Sep-09 15-Dec-09<br />
NO 3-N NO 3-N NO 3-N NO 3-N NO 3-N NO 3-N NO 3-N NO 3-N NO 3-N NO 3-N NO 3-N NO 3-N NO 3-N NO 3-N NO 3-N NO 3-N<br />
mg/L mg/L mg/L mg/L mg/L mg/L mg/L mg/L mg/L mg/L mg/L mg/L mg/L mg/L mg/L mg/L<br />
0.005 0.005 0.005 0.005 0.005 0.005 0.005 0.005 0.005 0.005 0.005 0.03 0.005 0.005 0.005 0.005<br />
0.005 0.005 0.005 0.005 0.005 0.005 0.005 0.005 0.005 0.005 0.005 0.005 0.005 0.005 0.005<br />
0.005 0.005 0.005 0.005 0.005 0.005 0.005 0.005 0.005 0.005 0.005 0.04 0.005 0.005 0.005 0.005<br />
0.005 0.005 0.005 0.005 0.005 0.005 0.005 0.005 0.005 0.005 0.005 0.06 0.005 0.005 0.005 0.005<br />
0.005<br />
0.005 0.005 0.005 0.005 0.005<br />
0.005 0.005 0.005<br />
0.005<br />
0.14<br />
0.005<br />
0.005<br />
0.005<br />
0.005<br />
Page 6 of 6
Lake<br />
Merced<br />
North<br />
15-May-97 10-Sep-97 3-Dec-97 16-Mar-98 8-Jul-98 23-Sep-98 17-Mar-99 21-Jun-99 15-Sep-99 8-Dec-99 21-Mar-00 21-Jun-00 9-Aug-00 19-Dec-00 7-Mar-01 20-Jun-01 1-Oct-01 18-Dec-01 5-Mar-02 30-Apr-02<br />
Depth TKN TKN TKN TKN TKN TKN TKN TKN TKN TKN TKN TKN TKN TKN TKN TKN TKN TKN TKN TKN<br />
Ft mg/L mg/L mg/L mg/L mg/L mg/L mg/L mg/L mg/L mg/L mg/L mg/L mg/L mg/L mg/L mg/L mg/L mg/L mg/L mg/L<br />
Surf 5.30 2.13 0.90 4.26 1.70 --- 2.6<br />
5 9.64 0.25 0.95 1.50 --- 2.9<br />
10 4.09 0.50 1.68 1.20 --- 3.0<br />
14 3.40 2.35<br />
15 2.58 5.80 1.40 --- 1.9<br />
16<br />
17<br />
17.4<br />
17.5<br />
18<br />
18.8<br />
19<br />
19.3<br />
19.9<br />
20<br />
20.6<br />
D.3-69<br />
Lake<br />
Merced<br />
North East<br />
15-May-97 10-Sep-97 3-Dec-97 16-Mar-98 8-Jul-98 23-Sep-98 17-Mar-99 21-Jun-99 15-Sep-99 8-Dec-99 21-Mar-00 21-Jun-00 9-Aug-00 19-Dec-00 7-Mar-01 20-Jun-01 1-Oct-01 18-Dec-01 5-Mar-02 30-Apr-02<br />
Depth TKN TKN TKN TKN TKN TKN TKN TKN TKN TKN TKN TKN TKN TKN TKN TKN TKN TKN TKN TKN<br />
Ft mg/L mg/L mg/L mg/L mg/L mg/L mg/L mg/L mg/L mg/L mg/L mg/L mg/L mg/L mg/L mg/L mg/L mg/L mg/L mg/L<br />
Surf 9.40 5.66 0.25 2.35 1.00 --- 1.9<br />
5 3.42 0.25 1.56 1.60 --- 1.6<br />
9 3.08<br />
10 6.60 3.70 1.10 1.40 --- 1.8<br />
11<br />
12<br />
13<br />
13.8<br />
14<br />
14.1<br />
14.7<br />
15<br />
15.8<br />
Page 1 of 6
D.3-70<br />
Lake<br />
Merced<br />
North<br />
Depth<br />
Ft<br />
Surf<br />
5<br />
10<br />
14<br />
15<br />
16<br />
17<br />
17.4<br />
17.5<br />
18<br />
18.8<br />
19<br />
19.3<br />
19.9<br />
20<br />
20.6<br />
Lake<br />
Merced<br />
North East<br />
Depth<br />
Ft<br />
Surf<br />
5<br />
9<br />
10<br />
11<br />
12<br />
13<br />
13.8<br />
14<br />
14.1<br />
14.7<br />
15<br />
15.8<br />
18-Jun-02 23-Aug-02 23-Oct-02 11-Feb-03 14-May-03 15-Jul-03 30-Sep-03 2-Dec-03 27-May-04 29-Aug-04 27-Oct-04 9-Dec-04 9-Feb-05 18-Apr-05 23-Jun-05 17-Aug-05 28-Sep-05 31-Oct-05 29-Nov-05 29-Dec-05<br />
TKN TKN TKN TKN TKN TKN TKN TKN TKN TKN TKN TKN TKN TKN TKN TKN TKN TKN TKN TKN<br />
mg/L mg/L mg/L mg/L mg/L mg/L mg/L mg/L mg/L mg/L mg/L mg/L mg/L mg/L mg/L mg/L mg/L mg/L mg/L mg/L<br />
23.0 10.0 2.2 1.5 8.0 4.1 11.30 5.7 10.2 6.4 6.3 4.1 4.7 5.2 1.13 7.90 1.85 3.50 6.6 NA<br />
21.3 7.3 2.2 1.5 4.4 2.8 9.50 5.3 8.3 3.5 5.9 1.3 6.3 4.4 0.98 5.70 2.27 2.97 3.5 NA<br />
9.0 7.8 2.4 1.6 2.9 2.0 5.50 4.4 8.1 9.1 11.4 0.6 6.9 3.8 0.84 3.80 2.07 4.48 4.5 NA<br />
11.0 12.2 2.9 1.8 1.5 1.9 4.30 2.9 7.4 7.6 6.8 3.2 7.8 3.3 0.47 5.50 2.13 4.48 2.5 NA<br />
3.00<br />
10.5 9.2 4.03<br />
1.1 2.4 5.88 2.8 NA<br />
18-Jun-02 23-Aug-02 23-Oct-02 11-Feb-03 14-May-03 15-Jul-03 30-Sep-03 2-Dec-03 27-May-04 29-Aug-04 27-Oct-04 9-Dec-04 9-Feb-05 18-Apr-05 23-Jun-05 17-Aug-05 28-Sep-05 31-Oct-05 29-Nov-05 29-Dec-05<br />
TKN TKN TKN TKN TKN TKN TKN TKN TKN TKN TKN TKN TKN TKN TKN TKN TKN TKN TKN TKN<br />
mg/L mg/L mg/L mg/L mg/L mg/L mg/L mg/L mg/L mg/L mg/L mg/L mg/L mg/L mg/L mg/L mg/L mg/L mg/L mg/L<br />
24.0 9.4 1.9 1.6 5.9 3.4 9.80 6.6 5.8 7.5 4.4 5.6 5.7 7.5 1.04 8.40 5.74 5.94 0.9 NA<br />
10.2 6.2 2.0 1.6 4.2 2.3 3.20 5.2 1.5 18.0 13.3 3.4 3.72 7.00 6.0 NA<br />
6.5 6.8 1.8 1.4 7.7 1.2 1.90 3.0 4.8 5.2 12.1 6.0 6.7 7.0 0.93 8.80 5.57 3.78 7.7 NA<br />
6.3 3.5 9.9 0.71 5.3 2.80 4.59 2.8<br />
0.59<br />
6.6 NA<br />
Page 2 of 6
D.3-71<br />
Lake<br />
Merced<br />
North<br />
Depth<br />
Ft<br />
Surf<br />
5<br />
10<br />
14<br />
15<br />
16<br />
17<br />
17.4<br />
17.5<br />
18<br />
18.8<br />
19<br />
19.3<br />
19.9<br />
20<br />
20.6<br />
Lake<br />
Merced<br />
North East<br />
Depth<br />
Ft<br />
Surf<br />
5<br />
9<br />
10<br />
11<br />
12<br />
13<br />
13.8<br />
14<br />
14.1<br />
14.7<br />
15<br />
15.8<br />
23-Jan-06 01-Mar-06 26-Apr-06 14-Jun-06 24-Aug-06 25-Oct-06 20-Dec-06 29-Mar-07 26-Jun-07 20-Aug-07 27-Dec-07 28-Mar-08 10-Jun-08 24-Sep-08 4-Dec-08 24-Mar-09 4-Jun-09 22-Sep-09 15-Dec-09<br />
TKN TKN TKN TKN TKN TKN TKN TKN TKN TKN TKN TKN TKN TKN TKN TKN TKN TKN TKN<br />
mg/L mg/L mg/L mg/L mg/L mg/L mg/L mg/L mg/L mg/L mg/L mg/L mg/L mg/L mg/L mg/L mg/L mg/L mg/L<br />
3.42 1.13 1.82 3.96 4.60 2.53 1.74 2.33 2.70 2.2 0.78 2.49 2.9 4.0 3.22 3.95 1.26<br />
1.51 1.15 1.86 2.86 2.62 2.65 1.81 2.73 1.50 2.1 0.93 2.69 2.8 2.6 3.16 3.95 1.32<br />
2.52 0.99 1.92 4.56 2.81 2.72 1.68 2.35 1.50 2.6 0.52 2.27 2.7 2.9 2.72 6.92 2.49<br />
3.36 0.99 1.85 3.19 5.94 2.62 1.27 2.41 2.20 1.8 0.56 2.18 2.3 2.91 7.48 2.58<br />
4.54 2.42<br />
0.45 1.95 2.80 2.38 1.39 1.95 2.0<br />
2.1<br />
2.9<br />
3.02 2.63<br />
23-Jan-06 01-Mar-06 26-Apr-06 14-Jun-06 24-Aug-06 25-Oct-06 20-Dec-06 29-Mar-07 26-Jun-07 20-Aug-07 27-Dec-07 28-Mar-08 10-Jun-08 24-Sep-08 4-Dec-08 24-Mar-09 4-Jun-09 22-Sep-09 15-Dec-09<br />
TKN TKN TKN TKN TKN TKN TKN TKN TKN TKN TKN TKN TKN TKN TKN TKN TKN TKN TKN<br />
mg/L mg/L mg/L mg/L mg/L mg/L mg/L mg/L mg/L mg/L mg/L mg/L mg/L mg/L mg/L mg/L mg/L mg/L mg/L<br />
1.06 0.45 2.25 3.56 4.62 2.02 2.1 1.57 1.50 1.4 0.36 1.79 2.6 2.7 2.97 3.92 2.91<br />
0.45 1.37 3.18 3.86 2.10 1.7 2.00 2.00 1.6 0.36 2.55 2.4 2.5 2.44 4.00 0.98<br />
2.02 0.45 1.43 3.05 5.85 3.40 1.7 1.89 1.60 1.6 0.57 2.07 2.4 2.2 2.32 3.42 2.55<br />
1.57 4.66 1.54 2.4<br />
1.21 1.32 3.57 1.50<br />
1.0<br />
2.21 1.2 1.99 1.5 2.27<br />
0.80<br />
2.7<br />
2.74<br />
4.20<br />
4.06<br />
2.94<br />
Page 3 of 6
Lake<br />
Merced<br />
South -<br />
Pistol<br />
Range<br />
15-May-97 10-Sep-97 3-Dec-97 16-Mar-98 8-Jul-98 23-Sep-98 17-Mar-99 21-Jun-99 15-Sep-99 8-Dec-99 21-Mar-00 21-Jun-00 9-Aug-00 19-Dec-00 7-Mar-01 20-Jun-01 1-Oct-01 18-Dec-01 5-Mar-02 30-Apr-02<br />
Depth TKN TKN TKN TKN TKN TKN TKN TKN TKN TKN TKN TKN TKN TKN TKN TKN TKN TKN TKN TKN<br />
Ft mg/L mg/L mg/L mg/L mg/L mg/L mg/L mg/L mg/L mg/L mg/L mg/L mg/L mg/L mg/L mg/L mg/L mg/L mg/L mg/L<br />
0 3.60 7.45 0.25 2.91 0.97 --- 1.3<br />
5 5.36 0.25 0.73 1.00 --- 1.3<br />
6<br />
10 5.99 0.40 1.62 1.10 --- 1.4<br />
12<br />
15 4.93 1.50 1.23 0.98 --- 1.3<br />
16 2.00<br />
17<br />
18<br />
18.2<br />
18.9<br />
19<br />
20<br />
20.1<br />
20.8<br />
21<br />
21.5<br />
22<br />
D.3-72<br />
Lake<br />
Merced<br />
South -<br />
Pump<br />
Station<br />
15-May-97 10-Sep-97 3-Dec-97 16-Mar-98 8-Jul-98 23-Sep-98 17-Mar-99 21-Jun-99 15-Sep-99 8-Dec-99 21-Mar-00 21-Jun-00 9-Aug-00 19-Dec-00 7-Mar-01 20-Jun-01 1-Oct-01 18-Dec-01 5-Mar-02 30-Apr-02<br />
Depth TKN TKN TKN TKN TKN TKN TKN TKN TKN TKN TKN TKN TKN TKN TKN TKN TKN TKN TKN TKN<br />
Ft mg/L mg/L mg/L mg/L mg/L mg/L mg/L mg/L mg/L mg/L mg/L mg/L mg/L mg/L mg/L mg/L mg/L mg/L mg/L mg/L<br />
Surf 5.70 7.62 3.59 0.97 1.4<br />
5 6.61 1.00 5.10 1.10 1.3<br />
10 3.70 1.50 5.43 1.20 1.3<br />
12<br />
15 2.30 0.25 8.46 1.10 1.5<br />
16<br />
17 3.40<br />
18<br />
19<br />
19.2<br />
20<br />
20.4<br />
21<br />
21.5<br />
22<br />
23.2<br />
Note: Bold, italicized formats indicate half the reported value for statistical purposes.<br />
Page 4 of 6
D.3-73<br />
Lake<br />
Merced<br />
South -<br />
Pistol<br />
Range<br />
Depth<br />
Ft<br />
0<br />
5<br />
6<br />
10<br />
12<br />
15<br />
16<br />
17<br />
18<br />
18.2<br />
18.9<br />
19<br />
20<br />
20.1<br />
20.8<br />
21<br />
21.5<br />
22<br />
Lake<br />
Merced<br />
South -<br />
Pump<br />
Station<br />
Depth<br />
Ft<br />
Surf<br />
5<br />
10<br />
12<br />
15<br />
16<br />
17<br />
18<br />
19<br />
19.2<br />
20<br />
20.4<br />
21<br />
21.5<br />
22<br />
23.2<br />
18-Jun-02 23-Aug-02 23-Oct-02 11-Feb-03 14-May-03 15-Jul-03 30-Sep-03 2-Dec-03 27-May-04 29-Aug-04 27-Oct-04 9-Dec-04 9-Feb-05 18-Apr-05 23-Jun-05 17-Aug-05 28-Sep-05 31-Oct-05 29-Nov-05 29-Dec-05<br />
TKN TKN TKN TKN TKN TKN TKN TKN TKN TKN TKN TKN TKN TKN TKN TKN TKN TKN TKN TKN<br />
mg/L mg/L mg/L mg/L mg/L mg/L mg/L mg/L mg/L mg/L mg/L mg/L mg/L mg/L mg/L mg/L mg/L mg/L mg/L mg/L<br />
7.9 15.0 1.9 1.1 13.8 3.3 9.10 2.6 12.0 12.7 6.4 6.5 7.9 7.5 1.16 3.70 1.88 6.16 1.8 NA<br />
10.5 5.5 2.0 1.3 9.9 9.0 6.00 1.5 7.2 8.8 5.4 5.3 6.0 5.1 0.91 5.10 4.20 3.92 2.3 NA<br />
9.7 8.8 1.9 1.3 7.3 1.9 1.80 2.6 5.8 6.2 4.8 2.7 7.1 4.5 0.64 6.50 2.18 6.27 2.4 NA<br />
5.8 6.2 2.0 1.3 1.9 0.4 1.10 0.9 4.4 4.0 4.0 2.1 8.0 3.9 0.49 5.60 2.30 4.20 2.3 NA<br />
0.60 12.8<br />
5.10 1.79 3.6<br />
2.6 0.30 3.20 5.82<br />
18-Jun-02 23-Aug-02 23-Oct-02 11-Feb-03 14-May-03 15-Jul-03 30-Sep-03 2-Dec-03 27-May-04 29-Aug-04 27-Oct-04 9-Dec-04 9-Feb-05 18-Apr-05 23-Jun-05 17-Aug-05 28-Sep-05 31-Oct-05 29-Nov-05 29-Dec-05<br />
TKN TKN TKN TKN TKN TKN TKN TKN TKN TKN TKN TKN TKN TKN TKN TKN TKN TKN TKN TKN<br />
mg/L mg/L mg/L mg/L mg/L mg/L mg/L mg/L mg/L mg/L mg/L mg/L mg/L mg/L mg/L mg/L mg/L mg/L mg/L mg/L<br />
8.7 10.9 1.8 1.1 9.4 3.3 5.80 1.7 8.5 11.7 7.3 4.2 5.6 5.5 1.05 5.10 2.52 3.71 2.7 NA<br />
3.2 9.2 1.9 1.4 7.9 9.0 18.80 8.1 28.2 9.2 14.8 2.6 7.1 5.3 0.88 5.60 3.95 3.08 2.7 NA<br />
10.9 9.9 1.8 1.2 5.2 1.9 8.50 3.2 11.8 18.6 6.5 2.3 7.7 4.5 0.69 8.40 2.55 2.41 1.4 NA<br />
4.9 6.0 2.1 1.2 4.4 0.4 2.20 3.1 10.6 5.9 4.9 1.7 8.7 4.0 0.50 7.00 2.80 3.64 2.4 NA<br />
9.7<br />
4.50 0.90 4.48<br />
5.1<br />
0.29 6.60 3.30 9.7 NA<br />
NA<br />
Page 5 of 6
D.3-74<br />
Lake<br />
Merced<br />
South -<br />
Pistol<br />
Range<br />
Depth<br />
Ft<br />
0<br />
5<br />
6<br />
10<br />
12<br />
15<br />
16<br />
17<br />
18<br />
18.2<br />
18.9<br />
19<br />
20<br />
20.1<br />
20.8<br />
21<br />
21.5<br />
22<br />
Lake<br />
Merced<br />
South -<br />
Pump<br />
Station<br />
Depth<br />
Ft<br />
Surf<br />
5<br />
10<br />
12<br />
15<br />
16<br />
17<br />
18<br />
19<br />
19.2<br />
20<br />
20.4<br />
21<br />
21.5<br />
22<br />
23.2<br />
23-Jan-06 01-Mar-06 26-Apr-06 14-Jun-06 24-Aug-06 25-Oct-06 20-Dec-06 29-Mar-07 26-Jun-07 20-Aug-07 27-Dec-07 28-Mar-08 10-Jun-08 24-Sep-08 4-Dec-08 24-Mar-09 4-Jun-09 22-Sep-09 15-Dec-09<br />
TKN TKN TKN TKN TKN TKN TKN TKN TKN TKN TKN TKN TKN TKN TKN TKN TKN TKN TKN<br />
mg/L mg/L mg/L mg/L mg/L mg/L mg/L mg/L mg/L mg/L mg/L mg/L mg/L mg/L mg/L mg/L mg/L mg/L mg/L<br />
0.95 1.16 1.78 2.7 3.58 1.4 0.90 1.37 1.50 1.4 0.47 0.84 2.3 2.6 2.60 9.16 2.13<br />
2.46 1.11 0.71 3.2 2.20 4.2 1.05 2.49 1.10 1.2 0.42 1.57 2.2 2.6 1.79 3.44 2.44<br />
0.95 0.45 0.94 2.7 2.16 2.3 1.04 1.36 1.50 1.2 0.89 1.01 2.7 2.5 1.85 3.42 2.16<br />
1.12<br />
1.16 1.55 2.4 2.10 1.6 1.06 0.25 1.00 1.3 0.64 1.12 2.2 2.4 1.90 3.00 2.58<br />
2.16 2.3<br />
0.45 2.4 2.2 1.15<br />
2.1<br />
1.78 0.91 1.3<br />
1.37<br />
23-Jan-06 01-Mar-06 26-Apr-06 14-Jun-06 24-Aug-06 25-Oct-06 20-Dec-06 29-Mar-07 26-Jun-07 20-Aug-07 27-Dec-07 28-Mar-08 10-Jun-08 24-Sep-08 4-Dec-08 24-Mar-09 4-Jun-09 22-Sep-09 15-Dec-09<br />
TKN TKN TKN TKN TKN TKN TKN TKN TKN TKN TKN TKN TKN TKN TKN TKN TKN TKN TKN<br />
mg/L mg/L mg/L mg/L mg/L mg/L mg/L mg/L mg/L mg/L mg/L mg/L mg/L mg/L mg/L mg/L mg/L mg/L mg/L<br />
1.18 0.45 0.95 3.58 3.6 2.28 0.94 1.22 1.10 1.5 0.81 1.12 2.6 2.0 3.11 3.42 2.32<br />
1.34 1.23 1.72 2.30 3.4 2.50 1.09 1.60 1.20 1.1 0.33 0.95 2.7 2.5 2.10 3.81 2.10<br />
1.09 0.45 2.27 3.43 2.3 2.67 1.06 1.56 1.30 1.4 0.76 1.04 2.4 2.6 1.88 3.81 2.02<br />
2.52 0.92 2.14 2.90 2.3 4.21 1.16 1.40 1.20 1.2 0.82 2.21 2.2 2.4 1.88 3.08 2.49<br />
2.35<br />
2.0<br />
0.45 1.37 5.33 1.60 1.3 1.51 1.9 2.3<br />
1.57 1.62 1.57<br />
0.45<br />
0.17<br />
1.85<br />
1.90<br />
3.28<br />
3.00<br />
2.41<br />
2.16<br />
Page 6 of 6
Lake Merced<br />
North<br />
15-May-97 10-Sep-97 3-Dec-97 16-Mar-98 8-Jul-98 23-Sep-98 17-Mar-99 21-Jun-99 15-Sep-99 8-Dec-99 21-Mar-00 21-Jun-00 9-Aug-00 19-Dec-00 7-Mar-01 20-Jun-01 1-Oct-01 18-Dec-01 5-Mar-02 30-Apr-02 18-Jun-02 23-Aug-02<br />
Depth NH 3-N NH 3-N NH 3-N NH 3-N NH 3-N NH 3-N NH 3-N NH 3-N NH 3-N NH 3-N NH 3-N NH 3-N NH 3-N NH 3-N NH 3-N NH 3-N NH 3-N NH 3-N NH 3-N NH 3-N NH 3-N NH 3-N<br />
Ft mg/L mg/L mg/L mg/L mg/L mg/L mg/L mg/L mg/L mg/L mg/L mg/L mg/L mg/L mg/L mg/L mg/L mg/L mg/L mg/L mg/L mg/L<br />
Surf 0.05 0.05 0.05 0.03 0.02 0.11 0.04 0.05 0.03 0.025 0.025 0.05 0.05 0.05 0.12 0.06 0.06 0.11 0.04<br />
5 0.05 0.05 0.05 0.02 0.05 0.14 0.01 0.05 0.03 0.025 0.025 0.04 0.07 0.03 0.09 0.06 0.08 0.07 0.06<br />
10 0.05 0.05 0.05 0.02 0.03 0.17 0.07 0.05 0.03 0.025 0.025 0.04 0.05 0.09 0.10 0.03 0.03 0.06 0.05<br />
14 0.02 0.05 0.05<br />
15 0.13 0.66 0.05 0.04 0.02 0.20 0.025 0.025 0.05 0.24 0.04 0.04 0.05 0.09 0.04<br />
16<br />
17<br />
17.4<br />
17.5<br />
18 0.03<br />
18.8<br />
19<br />
19.3<br />
19.9<br />
20<br />
20.6<br />
D.3-75<br />
Lake Merced<br />
North East<br />
15-May-97 10-Sep-97 3-Dec-97 16-Mar-98 8-Jul-98 23-Sep-98 17-Mar-99 21-Jun-99 15-Sep-99 8-Dec-99 21-Mar-00 21-Jun-00 9-Aug-00 19-Dec-00 7-Mar-01 20-Jun-01 1-Oct-01 18-Dec-01 5-Mar-02 30-Apr-02 18-Jun-02 23-Aug-02<br />
Depth NH 3-N NH 3-N NH 3-N NH 3-N NH 3-N NH 3-N NH 3-N NH 3-N NH 3-N NH 3-N NH 3-N NH 3-N NH 3-N NH 3-N NH 3-N NH 3-N NH 3-N NH 3-N NH 3-N NH 3-N NH 3-N NH 3-N<br />
Ft mg/L mg/L mg/L mg/L mg/L mg/L mg/L mg/L mg/L mg/L mg/L mg/L mg/L mg/L mg/L mg/L mg/L mg/L mg/L mg/L mg/L mg/L<br />
0 0.05 0.05 0.03 0.03 0.05 0.005 0.05 0.03 0.04 0.025 0.26 0.05 0.05 0.10 0.08 0.05 0.09 0.03<br />
5 0.05 0.1 0.02 0.02 0.04 0.005 0.05 0.04 0.04 0.025 0.05 0.06 0.06 0.07 0.11 0.05 0.09 0.06<br />
9 0.05<br />
10 0.05 0.05 0.04 0.03 0.05 0.01 0.03 0.04 0.025 0.05 0.06 0.04 0.09 0.04 0.08 0.04<br />
11<br />
12<br />
13 0.04<br />
13.8<br />
14<br />
14.1<br />
14.7<br />
15<br />
15.8<br />
Page 1 of 6
D.3-76<br />
Lake Merced<br />
North<br />
Depth<br />
Ft<br />
Surf<br />
5<br />
10<br />
14<br />
15<br />
16<br />
17<br />
17.4<br />
17.5<br />
18<br />
18.8<br />
19<br />
19.3<br />
19.9<br />
20<br />
20.6<br />
Lake Merced<br />
North East<br />
Depth<br />
Ft<br />
0<br />
5<br />
9<br />
10<br />
11<br />
12<br />
13<br />
13.8<br />
14<br />
14.1<br />
14.7<br />
15<br />
15.8<br />
23-Oct-02 11-Feb-03 14-May-03 15-Jul-03 30-Sep-03 2-Dec-03 27-May-04 29-Aug-04 27-Oct-04 9-Dec-04 9-Feb-05 18-Apr-05 23-Jun-05 17-Aug-05 28-Sep-05 31-Oct-05 29-Nov-05 29-Dec-05 23-Jan-06 01-Mar-06 26-Apr-06 14-Jun-06 24-Aug-06<br />
NH 3-N NH 3-N NH 3-N NH 3-N NH 3-N NH 3-N NH 3-N NH 3-N NH 3-N NH 3-N NH 3-N NH 3-N NH 3-N NH 3-N NH 3-N NH 3-N NH 3-N NH 3-N NH 3-N NH 3-N NH 3-N NH 3-N NH 3-N<br />
mg/L mg/L mg/L mg/L mg/L mg/L mg/L mg/L mg/L mg/L mg/L mg/L mg/L mg/L mg/L mg/L mg/L mg/L mg/L mg/L mg/L mg/L mg/L<br />
0.10 0.08 0.31 0.13 0.09 0.11 0.01 0.12 0.03 0.03 0.09 0.09 0.09 0.005 0.03 0.04 0.06 0.05 0.03 0.005 0.03 0.04 0.07<br />
0.11 0.13 0.35 0.53 0.15 0.12 0.01 0.05 0.06 0.02 0.07 0.04 0.10 0.04 0.03 0.05 0.06 0.04 0.09 0.01 0.04 0.04 0.02<br />
0.10 0.06 0.31 0.18 0.21 0.06 0.01 0.04 0.11 0.05 0.06 0.06 0.08 0.005 0.02 0.05 0.08 0.05 0.09 0.02 0.05 0.05 0.02<br />
0.10 0.07 0.36 0.12 0.16 0.10 0.01 0.08 0.10 0.02 0.02 0.04 0.11 0.005 0.01 0.05 0.11 0.02 0.07 0.02 0.05 0.08 0.03<br />
0.04<br />
0.08 0.04 0.03<br />
0.06 0.03 0.03 0.09 0.03 0.04<br />
0.11 0.02 0.04 0.10 0.03<br />
23-Oct-02 11-Feb-03 14-May-03 15-Jul-03 30-Sep-03 2-Dec-03 27-May-04 29-Aug-04 27-Oct-04 9-Dec-04 9-Feb-05 18-Apr-05 23-Jun-05 17-Aug-05 28-Sep-05 31-Oct-05 29-Nov-05 29-Dec-05 23-Jan-06 01-Mar-06 26-Apr-06 14-Jun-06 24-Aug-06<br />
NH 3-N NH 3-N NH 3-N NH 3-N NH 3-N NH 3-N NH 3-N NH 3-N NH 3-N NH 3-N NH 3-N NH 3-N NH 3-N NH 3-N NH 3-N NH 3-N NH 3-N NH 3-N NH 3-N NH 3-N NH 3-N NH 3-N NH 3-N<br />
mg/L mg/L mg/L mg/L mg/L mg/L mg/L mg/L mg/L mg/L mg/L mg/L mg/L mg/L mg/L mg/L mg/L mg/L mg/L mg/L mg/L mg/L mg/L<br />
0.05 0.03 0.22 0.08 0.19 0.10 0.005 0.03 0.03 0.03 0.03 0.04 0.11 0.01 0.01 0.02 0.05 0.06 0.02 0.03 0.15 0.07 0.13<br />
0.07 0.03 0.19 0.08 0.16 0.08 0.005 0.03 0.05 0.01 0.08 0.05 0.15 0.15 0.04 0.04 0.08 0.03 0.03 0.02 0.15 0.07 0.02<br />
0.06 0.07 0.29 0.12 0.09 0.09 0.005 0.28 0.03 0.02 0.06 0.03 0.10 0.06 0.04 0.05 0.07 0.03 0.06 0.03 0.13 0.06 0.12<br />
0.05 0.04 0.07 0.10 0.06 0.03 0.05 0.07 0.05<br />
0.02 0.01 0.02 0.02 0.10<br />
0.15<br />
Page 2 of 6
D.3-77<br />
Lake Merced<br />
North<br />
Depth<br />
Ft<br />
Surf<br />
5<br />
10<br />
14<br />
15<br />
16<br />
17<br />
17.4<br />
17.5<br />
18<br />
18.8<br />
19<br />
19.3<br />
19.9<br />
20<br />
20.6<br />
Lake Merced<br />
North East<br />
Depth<br />
Ft<br />
0<br />
5<br />
9<br />
10<br />
11<br />
12<br />
13<br />
13.8<br />
14<br />
14.1<br />
14.7<br />
15<br />
15.8<br />
25-Oct-06 20-Dec-06 29-Mar-07 26-Jun-07 20-Aug-07 27-Dec-07 28-Mar-08 10-Jun-08 24-Sep-08 4-Dec-08 24-Mar-09 4-Jun-09 22-Sep-09 15-Dec-09<br />
NH 3-N NH 3-N NH 3-N NH 3-N NH 3-N NH 3-N NH 3-N NH 3-N NH 3-N NH 3-N NH 3-N NH 3-N NH 3-N NH 3-N<br />
mg/L mg/L mg/L mg/L mg/L mg/L mg/L mg/L mg/L mg/L mg/L mg/L mg/L mg/L<br />
0.03 0.21 0.02 0.03 0.05 0.07 0.06 0.05 0.06 0.58 0.17 0.06 0.05 0.25<br />
0.10 0.25 0.02 0.04 0.05 0.06 0.03 0.10 0.08 0.60 0.04 0.05 0.04 0.30<br />
0.09 0.18 0.005 0.02 0.05 0.06 0.05 0.11 0.09 0.64 0.07 0.05 0.02 0.27<br />
0.08 0.22 0.04 0.02 0.06 0.10 0.03 0.06 0.70 0.03 0.05 0.09 0.35<br />
0.04 0.09 0.05<br />
0.22 0.04 0.10<br />
0.03<br />
0.18<br />
0.78 0.78<br />
0.11 0.37<br />
25-Oct-06 20-Dec-06 29-Mar-07 26-Jun-07 20-Aug-07 27-Dec-07 28-Mar-08 10-Jun-08 24-Sep-08 4-Dec-08 24-Mar-09 4-Jun-09 22-Sep-09 15-Dec-09<br />
NH 3-N NH 3-N NH 3-N NH 3-N NH 3-N NH 3-N NH 3-N NH 3-N NH 3-N NH 3-N NH 3-N NH 3-N NH 3-N NH 3-N<br />
mg/L mg/L mg/L mg/L mg/L mg/L mg/L mg/L mg/L mg/L mg/L mg/L mg/L mg/L<br />
0.05 0.40 0.04 0.24 0.08 0.25 0.01 0.10 0.07 0.72 0.01 0.04 0.03 0.19<br />
0.09 0.40 0.03 0.17 0.06 0.23 0.02 0.05 0.06 0.70 0.03 0.03 0.01 0.20<br />
0.09 0.42 0.03 0.03 0.09 0.24 0.10 0.05 0.21 0.76 0.13 0.04 0.02 0.23<br />
0.05 0.03 0.25<br />
0.14<br />
0.04<br />
0.72<br />
0.02 0.22<br />
0.37 0.03 0.05 0.29 0.03<br />
0.04<br />
0.03<br />
0.04<br />
0.75<br />
Page 3 of 6
Lake Merced<br />
South - Pistol<br />
Range<br />
15-May-97 10-Sep-97 3-Dec-97 16-Mar-98 8-Jul-98 23-Sep-98 17-Mar-99 21-Jun-99 15-Sep-99 8-Dec-99 21-Mar-00 21-Jun-00 9-Aug-00 19-Dec-00 7-Mar-01 20-Jun-01 1-Oct-01 18-Dec-01 5-Mar-02 30-Apr-02 18-Jun-02 23-Aug-02<br />
Depth NH 3-N NH 3-N NH 3-N NH 3-N NH 3-N NH 3-N NH 3-N NH 3-N NH 3-N NH 3-N NH 3-N NH 3-N NH 3-N NH 3-N NH 3-N NH 3-N NH 3-N NH 3-N NH 3-N NH 3-N NH 3-N NH 3-N<br />
Ft mg/L mg/L mg/L mg/L mg/L mg/L mg/L mg/L mg/L mg/L mg/L mg/L mg/L mg/L mg/L mg/L mg/L mg/L mg/L mg/L mg/L mg/L<br />
0 0.05 0.13 0.05 0.04 0.06 0.02 0.02 0.005 0.04 0.02 0.04 0.05 0.02 0.06 0.04 0.03 0.05 0.04 0.05 0.06<br />
5 0.05 0.05 0.05 0.03 0.03 0.03 0.005 0.04 0.03 0.04 0.025 0.02 0.05 0.04 0.13 0.04 0.05 0.04 0.04<br />
6 0.03<br />
10 0.05 0.05 0.05 0.03 0.04 0.04 0.005 0.04 0.03 0.04 0.025 0.005 0.07 0.05 0.02 0.01 0.04 0.06 0.04<br />
12 0.03<br />
15 0.05 0.05 0.05 0.03 0.04 0.04 0.005 0.04 0.02 0.03 0.04 0.19 0.14 0.04 0.05 0.03<br />
16 0.05 0.05<br />
17<br />
18 0.03 0.04 0.025<br />
18.2<br />
18.9<br />
19<br />
20 0.04<br />
20.1<br />
20.6<br />
20.8<br />
21<br />
21.5<br />
22<br />
D.3-78<br />
Lake Merced<br />
South - Pump<br />
Station<br />
15-May-97 10-Sep-97 3-Dec-97 16-Mar-98 8-Jul-98 23-Sep-98 17-Mar-99 21-Jun-99 15-Sep-99 8-Dec-99 21-Mar-00 21-Jun-00 9-Aug-00 19-Dec-00 7-Mar-01 20-Jun-01 1-Oct-01 18-Dec-01 5-Mar-02 30-Apr-02 18-Jun-02 23-Aug-02<br />
Depth NH 3-N NH 3-N NH 3-N NH 3-N NH 3-N NH 3-N NH 3-N NH 3-N NH 3-N NH 3-N NH 3-N NH 3-N NH 3-N NH 3-N NH 3-N NH 3-N NH 3-N NH 3-N NH 3-N NH 3-N NH 3-N NH 3-N<br />
Ft mg/L mg/L mg/L mg/L mg/L mg/L mg/L mg/L mg/L mg/L mg/L mg/L mg/L mg/L mg/L mg/L mg/L mg/L mg/L mg/L mg/L mg/L<br />
Surf 0.05 0.05 0.05 0.03 0.03 0.005 0.005 0.01 0.05 0.03 0.01 0.025 0.03 0.11 0.05 0.05 0.06 0.03 0.03 0.04<br />
5 0.05 0.05 0.05 0.03 0.04 0.04 0.04 0.02 0.07 0.03 0.07 0.025 0.03 0.05 0.05 0.12 0.05 0.04 0.09 0.03<br />
10 0.05 0.12 0.05 0.04 0.01 0.01 0.02 0.05 0.03 0.06 0.025 0.06 0.03 0.04 0.04 0.05 0.11 0.05 0.04<br />
12 0.07<br />
15 0.05 0.05 0.05 0.03 0.01 0.01 0.01 0.04 0.03 0.03 0.05 0.12 0.04 0.04 0.04 0.03<br />
16<br />
17<br />
18 0.07 0.005<br />
19 0.025<br />
19.2<br />
20 0.04<br />
20.4<br />
21<br />
21.5<br />
22<br />
22.8<br />
23.2<br />
Note: Bold, italicized formats indicate half the reported value for statistical purposes.<br />
Page 4 of 6
D.3-79<br />
Lake Merced<br />
South - Pistol<br />
Range<br />
Depth<br />
Ft<br />
0<br />
5<br />
6<br />
10<br />
12<br />
15<br />
16<br />
17<br />
18<br />
18.2<br />
18.9<br />
19<br />
20<br />
20.1<br />
20.6<br />
20.8<br />
21<br />
21.5<br />
22<br />
Lake Merced<br />
South - Pump<br />
Station<br />
Depth<br />
Ft<br />
Surf<br />
5<br />
10<br />
12<br />
15<br />
16<br />
17<br />
18<br />
19<br />
19.2<br />
20<br />
20.4<br />
21<br />
21.5<br />
22<br />
22.8<br />
23.2<br />
23-Oct-02 11-Feb-03 14-May-03 15-Jul-03 30-Sep-03 2-Dec-03 27-May-04 29-Aug-04 27-Oct-04 9-Dec-04 9-Feb-05 18-Apr-05 23-Jun-05 17-Aug-05 28-Sep-05 31-Oct-05 29-Nov-05 29-Dec-05 23-Jan-06 01-Mar-06 26-Apr-06 14-Jun-06 24-Aug-06<br />
NH 3-N NH 3-N NH 3-N NH 3-N NH 3-N NH 3-N NH 3-N NH 3-N NH 3-N NH 3-N NH 3-N NH 3-N NH 3-N NH 3-N NH 3-N NH 3-N NH 3-N NH 3-N NH 3-N NH 3-N NH 3-N NH 3-N NH 3-N<br />
mg/L mg/L mg/L mg/L mg/L mg/L mg/L mg/L mg/L mg/L mg/L mg/L mg/L mg/L mg/L mg/L mg/L mg/L mg/L mg/L mg/L mg/L mg/L<br />
0.11 0.13 0.03 0.04 0.07 0.16 0.005 0.06 0.04 0.04 0.02 0.02 0.03 0.04 0.02 0.01 0.02 0.07 0.04 0.02 0.03 0.05 0.08<br />
0.06 0.03 0.16 0.07 0.11 0.04 0.005 0.08 0.03 0.01 0.05 0.04 0.09 0.06 0.04 0.04 0.02 0.09 0.04 0.02 0.03 0.04 0.10<br />
0.03 0.03 0.05 0.07 0.11 0.05 0.04 0.04 0.03 0.04 0.06 0.03 0.07 0.07 0.03 0.03 0.02 0.08 0.03 0.02 0.04 0.05 0.06<br />
0.18 0.02 0.15 0.07 0.06 0.21 0.005 0.07 0.05 0.04 0.03 0.02 0.06 0.06 0.02 0.05 0.02 0.10 0.04 0.02 0.04 0.07 0.12<br />
0.03 0.02<br />
0.04 0.02 0.02 0.04<br />
0.06<br />
0.005 0.06 0.03 0.03 0.04 0.04 0.03<br />
23-Oct-02 11-Feb-03 14-May-03 15-Jul-03 30-Sep-03 2-Dec-03 27-May-04 29-Aug-04 27-Oct-04 9-Dec-04 9-Feb-05 18-Apr-05 23-Jun-05 17-Aug-05 28-Sep-05 31-Oct-05 29-Nov-05 29-Dec-05 23-Jan-06 01-Mar-06 26-Apr-06 14-Jun-06 24-Aug-06<br />
NH 3-N NH 3-N NH 3-N NH 3-N NH 3-N NH 3-N NH 3-N NH 3-N NH 3-N NH 3-N NH 3-N NH 3-N NH 3-N NH 3-N NH 3-N NH 3-N NH 3-N NH 3-N NH 3-N NH 3-N NH 3-N NH 3-N NH 3-N<br />
mg/L mg/L mg/L mg/L mg/L mg/L mg/L mg/L mg/L mg/L mg/L mg/L mg/L mg/L mg/L mg/L mg/L mg/L mg/L mg/L mg/L mg/L mg/L<br />
0.07 0.02 0.04 0.07 0.05 0.07 0.32 0.04 0.04 0.02 0.04 0.05 0.03 0.05 0.005 0.02 0.01 0.07 0.02 0.06 0.04 0.06 0.06<br />
0.06 0.08 0.08 0.08 0.05 0.04 0.44 0.02 0.04 0.01 0.03 0.03 0.05 0.03 0.03 0.02 0.02 0.07 0.02 0.03 0.04 0.02 0.03<br />
0.65 0.03 0.11 0.12 0.07 0.04 0.34 0.07 0.03 0.05 0.02 0.03 0.06 0.005 0.005 0.03 0.02 0.06 0.02 0.03 0.03 0.07 0.04<br />
0.06 0.03 0.09 0.06 0.07 0.03 0.08 0.05 0.02 0.03 0.03 0.04 0.05 0.02 0.005 0.02 0.02 0.06 0.02 0.03 0.04 0.05 0.03<br />
0.02<br />
0.05 0.04 0.02<br />
0.05 0.01 0.01 0.04 0.06 0.03<br />
0.01 0.06 0.02 0.08<br />
0.03<br />
0.02<br />
Page 5 of 6
D.3-80<br />
Lake Merced<br />
South - Pistol<br />
Range<br />
Depth<br />
Ft<br />
0<br />
5<br />
6<br />
10<br />
12<br />
15<br />
16<br />
17<br />
18<br />
18.2<br />
18.9<br />
19<br />
20<br />
20.1<br />
20.6<br />
20.8<br />
21<br />
21.5<br />
22<br />
Lake Merced<br />
South - Pump<br />
Station<br />
Depth<br />
Ft<br />
Surf<br />
5<br />
10<br />
12<br />
15<br />
16<br />
17<br />
18<br />
19<br />
19.2<br />
20<br />
20.4<br />
21<br />
21.5<br />
22<br />
22.8<br />
23.2<br />
25-Oct-06 20-Dec-06 29-Mar-07 26-Jun-07 20-Aug-07 27-Dec-07 28-Mar-08 10-Jun-08 24-Sep-08 4-Dec-08 24-Mar-09 4-Jun-09 22-Sep-09 15-Dec-09<br />
NH 3-N NH 3-N NH 3-N NH 3-N NH 3-N NH 3-N NH 3-N NH 3-N NH 3-N NH 3-N NH 3-N NH 3-N NH 3-N NH 3-N<br />
mg/L mg/L mg/L mg/L mg/L mg/L mg/L mg/L mg/L mg/L mg/L mg/L mg/L mg/L<br />
0.08 0.09 0.02 0.03 0.04 0.19 0.005 0.01 0.09 0.06 0.01 0.03 0.04 0.07<br />
0.10 0.07 0.01 0.03 0.04 0.15 0.01 0.11 0.09 0.08 0.01 0.03 0.04 0.09<br />
0.10 0.07 0.02 0.03 0.01 0.005 0.04 0.07 0.06 0.01 0.02 0.05 0.06<br />
0.11 0.09 0.02 0.04 0.03 0.05 0.01 0.09 0.12 0.07 0.01 0.03 0.04 0.07<br />
0.12 0.06<br />
0.09 0.03 0.02<br />
0.18<br />
0.02 0.01<br />
0.03<br />
0.04<br />
25-Oct-06 20-Dec-06 29-Mar-07 26-Jun-07 20-Aug-07 27-Dec-07 28-Mar-08 10-Jun-08 24-Sep-08 4-Dec-08 24-Mar-09 4-Jun-09 22-Sep-09 15-Dec-09<br />
NH 3-N NH 3-N NH 3-N NH 3-N NH 3-N NH 3-N NH 3-N NH 3-N NH 3-N NH 3-N NH 3-N NH 3-N NH 3-N NH 3-N<br />
mg/L mg/L mg/L mg/L mg/L mg/L mg/L mg/L mg/L mg/L mg/L mg/L mg/L mg/L<br />
0.12 0.07 0.02 0.03 0.02 0.03 0.005 0.08 0.09 0.04 0.01 0.04 0.05 0.08<br />
0.09 0.07 0.02 0.04 0.03 0.13 0.005 0.11 0.08 0.005 0.04 0.06 0.08<br />
0.09 0.06 0.02 0.03 0.02 0.01 0.03 0.05 0.08 0.04 0.05 0.02 0.05 0.06<br />
0.32 0.07 0.08 0.12 0.03 0.19 0.03 0.10 0.10 0.06 0.07 0.03 0.04 0.06<br />
0.47<br />
0.08 0.09 0.06<br />
0.05 0.04 0.06 0.04<br />
0.04<br />
0.005<br />
0.12<br />
0.02<br />
0.01<br />
0.04<br />
0.04<br />
0.04<br />
0.03<br />
Page 6 of 6
Lake Merced<br />
North<br />
15-May-97 10-Sep-97 3-Dec-97 16-Mar-98 8-Jul-98 23-Sep-98 17-Mar-99 21-Jun-99 15-Sep-99 8-Dec-99 21-Mar-00 21-Jun-00 9-Aug-00 19-Dec-00 7-Mar-01 20-Jun-01 1-Oct-01 18-Dec-01 5-Mar-02 30-Apr-02<br />
Depth Orth P Orth P Orth P Orth P Orth P Orth P Orth P Orth P Orth P Orth P Orth P Orth P Orth P Orth P Orth P Orth P Orth P Orth P Orth P Orth P<br />
Ft mg/L mg/L mg/L mg/L mg/L mg/L mg/L mg/L mg/L mg/L mg/L mg/L mg/L mg/L mg/L mg/L mg/L mg/L mg/L mg/L<br />
Surf 0.01 0.12 0.07 0.01 0.12 0.03 0.01 0.08 0.05 0.01 0.04 0.05 0.02 0.01 0.01 0.03 0.03 0.01 0.08<br />
5 0.01 0.13 0.07 0.01 0.13 0.03 0.01 0.08 0.05 0.01 0.03 0.08 0.04 0.01 0.03 0.03 0.05 0.01 0.10<br />
10 0.01 0.14 0.09 0.01 0.12 0.03 0.01 0.08 0.06 0.01 0.04 0.05 0.03 0.03 0.04 0.03 0.04 0.01 0.07<br />
14 0.09 0.05 0.03 0.05<br />
15 0.01 0.23 0.07 0.03 0.17 0.05 0.01 0.06 0.05 0.01 0.13 0.04 0.01 0.10<br />
16<br />
17<br />
17.4<br />
17.5<br />
18 0.01<br />
18.8<br />
19<br />
19.3<br />
19.9<br />
20<br />
20.6<br />
D.3-81<br />
Lake Merced<br />
North East<br />
15-May-97 10-Sep-97 3-Dec-97 16-Mar-98 8-Jul-98 23-Sep-98 17-Mar-99 21-Jun-99 15-Sep-99 8-Dec-99 21-Mar-00 21-Jun-00 9-Aug-00 19-Dec-00 7-Mar-01 20-Jun-01 1-Oct-01 18-Dec-01 5-Mar-02 30-Apr-02<br />
Depth Orth P Orth P Orth P Orth P Orth P Orth P Orth P Orth P Orth P Orth P Orth P Orth P Orth P Orth P Orth P Orth P Orth P Orth P Orth P Orth P<br />
Ft mg/L mg/L mg/L mg/L mg/L mg/L mg/L mg/L mg/L mg/L mg/L mg/L mg/L mg/L mg/L mg/L mg/L mg/L mg/L mg/L<br />
0 0.01 0.06 0.01 0.19 0.01 0.03 0.06 0.05 0.01 0.09 0.08 0.03 0.01 0.03 0.005 0.05 0.01 0.06<br />
5 0.01 0.05 0.01 0.17 0.04 0.04 0.06 0.05 0.01 0.09 0.08 0.03 0.01 0.05 0.04 0.04 0.01 0.06<br />
9 0.03<br />
10 0.01 0.05 0.01 0.18 0.03 0.04 0.06 0.05 0.09 0.07 0.02 0.01 0.07 0.03 0.01 0.08<br />
11<br />
12<br />
13 0.01<br />
13.8<br />
14<br />
14.1<br />
14.7<br />
15<br />
15.8<br />
Page 1 of 6
D.3-82<br />
Lake Merced<br />
North<br />
Depth<br />
Ft<br />
Surf<br />
5<br />
10<br />
14<br />
15<br />
16<br />
17<br />
17.4<br />
17.5<br />
18<br />
18.8<br />
19<br />
19.3<br />
19.9<br />
20<br />
20.6<br />
Lake Merced<br />
North East<br />
Depth<br />
Ft<br />
0<br />
5<br />
9<br />
10<br />
11<br />
12<br />
13<br />
13.8<br />
14<br />
14.1<br />
14.7<br />
15<br />
15.8<br />
18-Jun-02 23-Aug-02 23-Oct-02 11-Feb-03 14-May-03 15-Jul-03 30-Sep-03 2-Dec-03 27-May-04 29-Aug-04 27-Oct-04 9-Dec-04 9-Feb-05 18-Apr-05 23-Jun-05 17-Aug-05 28-Sep-05 31-Oct-05 29-Nov-05 29-Dec-05 23-Jan-06<br />
Orth P Orth P Orth P Orth P Orth P Orth P Orth P Orth P Orth P Orth P Orth P Orth P Orth P Orth P Orth P Orth P Orth P Orth P Orth P Orth P Orth P<br />
mg/L mg/L mg/L mg/L mg/L mg/L mg/L mg/L mg/L mg/L mg/L mg/L mg/L mg/L mg/L mg/L mg/L mg/L mg/L mg/L mg/L<br />
0.14 0.16 0.23 0.07 0.03 0.18 0.31 0.16 0.29 0.24 0.09 0.01 0.005 0.05 0.11 0.11 0.16 0.20 0.19 0.16 0.06<br />
0.14 0.13 0.26 0.05 0.01 0.20 0.32 0.20 0.29 0.24 0.07 0.01 0.005 0.05 0.10 0.13 0.23 0.20 0.18 0.17 0.07<br />
0.14 0.13 0.23 0.03 0.05 0.20 0.29 0.18 0.28 0.24 0.04 0.005 0.06 0.03 0.10 0.11 0.17 0.21 0.18 0.16 0.07<br />
0.15 0.13 0.21 0.01 0.07 0.22 0.30 0.16 0.29 0.21 0.07 0.01 0.005 0.03 0.09 0.12 0.18 0.23 0.15 0.10 0.10<br />
0.10<br />
0.25 0.005 0.20<br />
0.01 0.04 0.18 0.14 0.09 0.14<br />
18-Jun-02 23-Aug-02 23-Oct-02 11-Feb-03 14-May-03 15-Jul-03 30-Sep-03 2-Dec-03 27-May-04 29-Aug-04 27-Oct-04 9-Dec-04 9-Feb-05 18-Apr-05 23-Jun-05 17-Aug-05 28-Sep-05 31-Oct-05 29-Nov-05 29-Dec-05 23-Jan-06<br />
Orth P Orth P Orth P Orth P Orth P Orth P Orth P Orth P Orth P Orth P Orth P Orth P Orth P Orth P Orth P Orth P Orth P Orth P Orth P Orth P Orth P<br />
mg/L mg/L mg/L mg/L mg/L mg/L mg/L mg/L mg/L mg/L mg/L mg/L mg/L mg/L mg/L mg/L mg/L mg/L mg/L mg/L mg/L<br />
0.14 0.13 0.18 0.05 0.03 0.19 0.33 0.18 0.23 0.12 0.14 0.05 0.03 0.04 0.10 0.16 0.15 0.14 0.10 0.05 0.12<br />
0.13 0.10 0.18 0.04 0.03 0.19 0.32 0.18 0.28 0.20 0.18 0.03 0.02 0.03 0.35 0.16 0.18 0.14 0.09 0.06 0.09<br />
0.15 0.10 0.18 0.02 0.03 0.21 0.35 0.16 0.21 0.16 0.22 0.08 0.05 0.03 0.13 0.15 0.15 0.14 0.10 0.04 0.08<br />
0.10<br />
0.20 0.05 0.02 0.21 0.14 0.13 0.16 0.08 0.04<br />
0.10 0.03<br />
Page 2 of 6
Lake Merced<br />
North<br />
Depth<br />
Ft<br />
Surf<br />
5<br />
10<br />
14<br />
15<br />
16<br />
17<br />
17.4<br />
17.5<br />
18<br />
18.8<br />
19<br />
19.3<br />
19.9<br />
20<br />
20.6<br />
01-Mar-06 26-Apr-06 14-Jun-06 24-Aug-06 25-Oct-06 20-Dec-06 29-Mar-07 26-Jun-07 20-Aug-07 27-Dec-07 28-Mar-08 10-Jun-08 24-Sep-08 4-Dec-08 24-Mar-09 4-Jun-09 22-Sep-09 15-Dec-09<br />
Orth P Orth P Orth P Orth P Orth P Orth P Orth P Orth P Orth P Orth P Orth P Orth P Orth P Orth P Orth P Orth P Orth P Orth P<br />
mg/L mg/L mg/L mg/L mg/L mg/L mg/L mg/L mg/L mg/L mg/L mg/L mg/L mg/L mg/L mg/L mg/L mg/L<br />
0.08 0.11 0.26 0.12 0.28 0.15 0.08 0.13 0.13 0.11 0.06 0.16 0.20 0.39 0.18 0.26 0.30 0.19<br />
0.18 0.12 0.30 0.13 0.28 0.13 0.08 0.13 0.16 0.10 0.06 0.24 0.26 0.40 0.18 0.26 0.30 0.22<br />
0.16 0.12 0.28 0.18 0.31 0.15 0.07 0.14 0.14 0.14 0.18 0.24 0.25 0.36 0.17 0.28 0.30 0.27<br />
0.19 0.14 0.28 0.18 0.34 0.15 0.09 0.16 0.15 0.12 0.09 0.26 0.31 0.16 0.26 0.36 0.21<br />
0.30 0.21<br />
0.15 0.17 0.30 0.21 0.13 0.09 0.23 0.10<br />
0.08<br />
0.29<br />
0.40<br />
0.18 0.22<br />
0.13<br />
0.21<br />
0.33<br />
D.3-83<br />
Lake Merced<br />
North East<br />
Depth<br />
Ft<br />
0<br />
5<br />
9<br />
10<br />
11<br />
12<br />
13<br />
13.8<br />
14<br />
14.1<br />
14.7<br />
15<br />
15.8<br />
01-Mar-06 26-Apr-06 14-Jun-06 24-Aug-06 25-Oct-06 20-Dec-06 29-Mar-07 26-Jun-07 20-Aug-07 27-Dec-07 28-Mar-08 10-Jun-08 24-Sep-08 4-Dec-08 24-Mar-09 4-Jun-09 22-Sep-09 15-Dec-09<br />
Orth P Orth P Orth P Orth P Orth P Orth P Orth P Orth P Orth P Orth P Orth P Orth P Orth P Orth P Orth P Orth P Orth P Orth P<br />
mg/L mg/L mg/L mg/L mg/L mg/L mg/L mg/L mg/L mg/L mg/L mg/L mg/L mg/L mg/L mg/L mg/L mg/L<br />
0.09 0.21 0.23 0.19 0.26 0.16 0.09 0.13 0.11 0.11 0.02 0.13 0.20 0.36 0.04 0.26 0.31 0.24<br />
0.09 0.20 0.24 0.20 0.25 0.14 0.09 0.13 0.13 0.10 0.04 0.17 0.20 0.30 0.06 0.22 0.32 0.23<br />
0.07 0.19 0.24 0.19 0.25 0.15 0.07 0.16 0.14 0.09 0.06 0.20 0.30 0.33 0.05 0.18 0.30 0.23<br />
0.25 0.16 0.32<br />
0.32<br />
0.07 0.24 0.15 0.17<br />
0.26<br />
0.06 0.22<br />
0.19 0.14 0.08 0.18 0.09 0.12<br />
0.01<br />
Page 3 of 6
Lake Merced<br />
South - Pistol<br />
Range<br />
15-May-97 10-Sep-97 3-Dec-97 16-Mar-98 8-Jul-98 23-Sep-98 17-Mar-99 21-Jun-99 15-Sep-99 8-Dec-99 21-Mar-00 21-Jun-00 9-Aug-00 19-Dec-00 7-Mar-01 20-Jun-01 1-Oct-01 18-Dec-01 5-Mar-02 30-Apr-02<br />
Depth Orth P Orth P Orth P Orth P Orth P Orth P Orth P Orth P Orth P Orth P Orth P Orth P Orth P Orth P Orth P Orth P Orth P Orth P Orth P Orth P<br />
Ft mg/L mg/L mg/L mg/L mg/L mg/L mg/L mg/L mg/L mg/L mg/L mg/L mg/L mg/L mg/L mg/L mg/L mg/L mg/L mg/L<br />
Surf 0.01 0.02 0.01 0.01 0.01 0.01 0.01 0.01 0.01 0.01 0.01 0.01 0.01 0.02 0.01 0.01 0.005 0.03 0.01 0.09<br />
5 0.01 0.03 0.01 0.01 0.01 0.01 0.01 0.01 0.01 0.01 0.01 0.01 0.02 0.01 0.01 0.005 0.03 0.01 0.06<br />
6 0.01<br />
10 0.01 0.05 0.01 0.01 0.01 0.01 0.01 0.01 0.01 0.01 0.01 0.01 0.04 0.01 0.01 0.005 0.03 0.01 0.09<br />
12 0.01<br />
15 0.01 0.08 0.01 0.01 0.01 0.01 0.01 0.01 0.01 0.03 0.01 0.03 0.005 0.03 0.01 0.06<br />
16 0.01 0.08<br />
17<br />
18 0.01 0.01 0.01<br />
18.2<br />
18.5<br />
18.9<br />
19<br />
20 0.01<br />
20.1<br />
20.6<br />
20.8<br />
21<br />
21.5<br />
22<br />
D.3-84<br />
Lake Merced<br />
South -<br />
Pump Station<br />
15-May-97 10-Sep-97 3-Dec-97 16-Mar-98 8-Jul-98 23-Sep-98 17-Mar-99 21-Jun-99 15-Sep-99 8-Dec-99 21-Mar-00 21-Jun-00 9-Aug-00 19-Dec-00 7-Mar-01 20-Jun-01 1-Oct-01 18-Dec-01 5-Mar-02 30-Apr-02<br />
Depth Orth P Orth P Orth P Orth P Orth P Orth P Orth P Orth P Orth P Orth P Orth P Orth P Orth P Orth P Orth P Orth P Orth P Orth P Orth P Orth P<br />
Ft mg/L mg/L mg/L mg/L mg/L mg/L mg/L mg/L mg/L mg/L mg/L mg/L mg/L mg/L mg/L mg/L mg/L mg/L mg/L mg/L<br />
Surf 0.01 0.04 0.01 0.01 0.01 0.01 0.01 0.01 0.01 0.01 0.01 0.01 0.01 0.04 0.01 0.01 0.005 0.02 0.01 0.09<br />
5 0.01 0.03 0.01 0.01 0.01 0.01 0.01 0.01 0.01 0.01 0.01 0.01 0.01 0.06 0.01 0.01 0.005 0.03 0.01 0.12<br />
10 0.01 0.05 0.01 0.01 0.01 0.01 0.01 0.01 0.01 0.01 0.01 0.01 0.04 0.01 0.01 0.005 0.03 0.01 0.07<br />
12 0.01<br />
15 0.01 0.08 0.01 0.01 0.01 0.01 0.01 0.01 0.01 0.03 0.01 0.01 0.005 0.03 0.01 0.10<br />
16<br />
17<br />
18 0.01 0.01<br />
19 0.01<br />
19.2<br />
20 0.01<br />
20.4<br />
20.9<br />
21<br />
21.5<br />
22<br />
22.8<br />
23.2<br />
Note: Bold, italicized formats indicate half the reported value for statistical purposes.<br />
Page 4 of 6
Lake Merced<br />
South - Pistol<br />
Range<br />
Depth<br />
Ft<br />
Surf<br />
5<br />
6<br />
10<br />
12<br />
15<br />
16<br />
17<br />
18<br />
18.2<br />
18.5<br />
18.9<br />
19<br />
20<br />
20.1<br />
20.6<br />
20.8<br />
21<br />
21.5<br />
22<br />
18-Jun-02 23-Aug-02 23-Oct-02 11-Feb-03 14-May-03 15-Jul-03 30-Sep-03 2-Dec-03 27-May-04 29-Aug-04 27-Oct-04 9-Dec-04 9-Feb-05 18-Apr-05 23-Jun-05 17-Aug-05 28-Sep-05 31-Oct-05 29-Nov-05 29-Dec-05 23-Jan-06<br />
Orth P Orth P Orth P Orth P Orth P Orth P Orth P Orth P Orth P Orth P Orth P Orth P Orth P Orth P Orth P Orth P Orth P Orth P Orth P Orth P Orth P<br />
mg/L mg/L mg/L mg/L mg/L mg/L mg/L mg/L mg/L mg/L mg/L mg/L mg/L mg/L mg/L mg/L mg/L mg/L mg/L mg/L mg/L<br />
0.08 0.09 0.15 0.11 0.10 0.04 0.15 0.10 0.12 0.06 0.08 0.11 0.03 0.10 0.11 0.07 0.13 0.10 0.09 0.11 0.07<br />
0.11 0.09 0.13 0.06 0.06 0.11 0.15 0.12 0.12 0.05 0.10 0.08 0.03 0.09 0.08 0.09 0.11 0.10 0.07 0.11 0.05<br />
0.10 0.06 0.18 0.01 0.03 0.10 0.12 0.10 0.13 0.07 0.09 0.11 0.02 0.09 0.08 0.12 0.10 0.09 0.04 0.13 0.04<br />
0.12 0.06 0.21 0.01 0.03 0.10 0.16 0.11 0.15 0.07 0.05 0.06 0.02 0.10 0.11 0.10 0.12 0.07 0.05 0.10 0.03<br />
0.08 0.01<br />
0.09 0.10 0.06 0.03<br />
0.11 0.06 0.12 0.06<br />
0.11<br />
D.3-85<br />
Lake Merced<br />
South -<br />
Pump Station<br />
Depth<br />
Ft<br />
Surf<br />
5<br />
10<br />
12<br />
15<br />
16<br />
17<br />
18<br />
19<br />
19.2<br />
20<br />
20.4<br />
20.9<br />
21<br />
21.5<br />
22<br />
22.8<br />
23.2<br />
18-Jun-02 23-Aug-02 23-Oct-02 11-Feb-03 14-May-03 15-Jul-03 30-Sep-03 2-Dec-03 27-May-04 29-Aug-04 27-Oct-04 9-Dec-04 9-Feb-05 18-Apr-05 23-Jun-05 17-Aug-05 28-Sep-05 31-Oct-05 29-Nov-05 29-Dec-05 23-Jan-06<br />
Orth P Orth P Orth P Orth P Orth P Orth P Orth P Orth P Orth P Orth P Orth P Orth P Orth P Orth P Orth P Orth P Orth P Orth P Orth P Orth P Orth P<br />
mg/L mg/L mg/L mg/L mg/L mg/L mg/L mg/L mg/L mg/L mg/L mg/L mg/L mg/L mg/L mg/L mg/L mg/L mg/L mg/L mg/L<br />
0.11 0.10 0.17 0.02 0.07 0.06 0.13 0.09 0.13 0.09 0.13 0.02 0.04 0.07 0.12 0.12 0.08 0.02 0.08 0.10 0.03<br />
0.11 0.08 0.18 0.01 0.02 0.13 0.14 0.10 0.13 0.04 0.10 0.03 0.02 0.11 0.11 0.14 0.09 0.05 0.06 0.09 0.06<br />
0.12 0.10 0.15 0.02 0.01 0.10 0.09 0.09 0.14 0.06 0.09 0.14 0.03 0.10 0.11 0.11 0.09 0.05 0.04 0.11 0.06<br />
0.08 0.09 0.20 0.01 0.01 0.08 0.13 0.14 0.14 0.14 0.11 0.05 0.04 0.12 0.09 0.13 0.14 0.04 0.05 0.10 0.06<br />
0.05<br />
0.13 0.07 0.04<br />
0.10<br />
0.11 0.12 0.07 0.02 0.08 0.07<br />
Page 5 of 6
Lake Merced<br />
South - Pistol<br />
Range<br />
Depth<br />
Ft<br />
Surf<br />
5<br />
6<br />
10<br />
12<br />
15<br />
16<br />
17<br />
18<br />
18.2<br />
18.5<br />
18.9<br />
19<br />
20<br />
20.1<br />
20.6<br />
20.8<br />
21<br />
21.5<br />
22<br />
01-Mar-06 26-Apr-06 14-Jun-06 24-Aug-06 25-Oct-06 20-Dec-06 29-Mar-07 26-Jun-07 20-Aug-07 27-Dec-07 28-Mar-08 10-Jun-08 24-Sep-08 4-Dec-08 24-Mar-09 4-Jun-09 22-Sep-09 15-Dec-09<br />
Orth P Orth P Orth P Orth P Orth P Orth P Orth P Orth P Orth P Orth P Orth P Orth P Orth P Orth P Orth P Orth P Orth P Orth P<br />
mg/L mg/L mg/L mg/L mg/L mg/L mg/L mg/L mg/L mg/L mg/L mg/L mg/L mg/L mg/L mg/L mg/L mg/L<br />
0.07 0.03 0.08 0.07 0.17 0.05 0.03 0.04 0.02 0.01 0.04 0.03 0.10 0.20 0.09 0.18 0.09 0.07<br />
0.08 0.03 0.09 0.08 0.17 0.05 0.03 0.01 0.02 0.01 0.02 0.03 0.09 0.21 0.09 0.16 0.12 0.08<br />
0.11 0.05 0.07 0.06 0.18 0.04 0.03 0.03 0.005 0.03 0.03 0.05 0.24 0.12 0.19 0.09 0.08<br />
0.02 0.07 0.11 0.08 0.20 0.05 0.01 0.04 0.01 0.005 0.04 0.03 0.10 0.16 0.11 0.15 0.03 0.09<br />
0.16<br />
0.08 0.05 0.08 0.02 0.04<br />
0.10 0.02 0.01<br />
0.07<br />
0.05<br />
0.11<br />
0.16<br />
0.12<br />
0.18<br />
0.16<br />
0.13<br />
D.3-86<br />
Lake Merced<br />
South -<br />
Pump Station<br />
Depth<br />
Ft<br />
Surf<br />
5<br />
10<br />
12<br />
15<br />
16<br />
17<br />
18<br />
19<br />
19.2<br />
20<br />
20.4<br />
20.9<br />
21<br />
21.5<br />
22<br />
22.8<br />
23.2<br />
01-Mar-06 26-Apr-06 14-Jun-06 24-Aug-06 25-Oct-06 20-Dec-06 29-Mar-07 26-Jun-07 20-Aug-07 27-Dec-07 28-Mar-08 10-Jun-08 24-Sep-08 4-Dec-08 24-Mar-09 4-Jun-09 22-Sep-09 15-Dec-09<br />
Orth P Orth P Orth P Orth P Orth P Orth P Orth P Orth P Orth P Orth P Orth P Orth P Orth P Orth P Orth P Orth P Orth P Orth P<br />
mg/L mg/L mg/L mg/L mg/L mg/L mg/L mg/L mg/L mg/L mg/L mg/L mg/L mg/L mg/L mg/L mg/L mg/L<br />
0.02 0.03 0.07 0.06 0.20 0.01 0.005 0.06 0.04 0.005 0.005 0.04 0.08 0.19 0.08 0.13 0.10 0.07<br />
0.01 0.04 0.09 0.08 0.18 0.03 0.01 0.04 0.04 0.04 0.005 0.05 0.08 0.08 0.17 0.11 0.05<br />
0.005 0.06 0.09 0.07 0.20 0.05 0.005 0.05 0.04 0.005 0.01 0.04 0.09 0.23 0.07 0.14 0.12 0.06<br />
0.06 0.11 0.10 0.08 0.16 0.01 0.005 0.07 0.04 0.005 0.01 0.07 0.10 0.17 0.07 0.16 0.16 0.06<br />
0.16<br />
0.005 0.08 0.06 0.04 0.005 0.07<br />
0.10 0.02 0.01 0.06<br />
0.02<br />
0.18<br />
0.08<br />
0.20<br />
0.210<br />
0.05<br />
Page 6 of 6
Lake Merced<br />
North<br />
15-May-97 10-Sep-97 3-Dec-97 16-Mar-98 8-Jul-98 23-Sep-98 17-Mar-99 21-Jun-99 15-Sep-99 8-Dec-99 21-Mar-00 21-Jun-00 9-Aug-00 19-Dec-00 7-Mar-01 20-Jun-01 1-Oct-01 18-Dec-01 5-Mar-02 30-Apr-02<br />
Depth Tot P Tot P Tot P Tot P Tot P Tot P Tot P Tot P Tot P Tot P Tot P Tot P Tot P Tot P Tot P Tot P Tot P Tot P Tot P Tot P<br />
Ft mg/L mg/L mg/L mg/L mg/L mg/L mg/L mg/L mg/L mg/L mg/L mg/L mg/L mg/L mg/L mg/L mg/L mg/L mg/L mg/L<br />
Surf 0.09 0.30 0.005 0.09 0.21 0.17 0.28 0.32 0.17 0.29 0.29 0.26 0.20 0.50 0.31 0.18 0.16 0.20<br />
5 0.11 0.31 0.01 0.08 0.22 0.17 0.26 0.31 0.17 0.29 0.30 0.26 0.22 0.40 0.32 0.18 0.18 0.22<br />
10 0.11 0.33 0.005 0.10 0.22 0.16 0.32 0.29 0.14 0.29 0.29 0.26 0.22 0.39 0.34 0.19 0.17 0.20<br />
14 0.31 0.32 0.25 0.35<br />
15 0.10 0.41 0.02 0.12 0.28 0.15 0.30 0.33 0.23 0.52 0.19 0.18 0.25<br />
16<br />
17<br />
17.4<br />
17.5<br />
18 0.13<br />
18.8<br />
19<br />
19.3<br />
19.9<br />
20<br />
20.6<br />
D.3-87<br />
Lake Merced<br />
North East<br />
15-May-97 10-Sep-97 3-Dec-97 16-Mar-98 8-Jul-98 23-Sep-98 17-Mar-99 21-Jun-99 15-Sep-99 8-Dec-99 21-Mar-00 21-Jun-00 9-Aug-00 19-Dec-00 7-Mar-01 20-Jun-01 1-Oct-01 18-Dec-01 5-Mar-02 30-Apr-02<br />
Depth Tot P Tot P Tot P Tot P Tot P Tot P Tot P Tot P Tot P Tot P Tot P Tot P Tot P Tot P Tot P Tot P Tot P Tot P Tot P Tot P<br />
Ft mg/L mg/L mg/L mg/L mg/L mg/L mg/L mg/L mg/L mg/L mg/L mg/L mg/L mg/L mg/L mg/L mg/L mg/L mg/L mg/L<br />
0 0.06 0.005 0.07 0.19 0.19 0.22 0.27 0.22 0.30 0.32 0.25 0.25 0.34 0.36 0.16 0.10 0.19<br />
5 0.07 0.005 0.08 0.19 0.19 0.24 0.27 0.24 0.29 0.30 0.27 0.24 0.41 0.30 0.18 0.16 0.19<br />
9 0.23<br />
10 0.07 0.005 0.08 0.23 0.20 0.23 0.30 0.32 0.44 0.20 0.24 0.45 0.13 0.17 0.19<br />
11<br />
12<br />
13 0.15<br />
13.8<br />
14<br />
14.1<br />
14.7<br />
15<br />
15.8<br />
Page 1 of 6
D.3-88<br />
Lake Merced<br />
North<br />
Depth<br />
Ft<br />
Surf<br />
5<br />
10<br />
14<br />
15<br />
16<br />
17<br />
17.4<br />
17.5<br />
18<br />
18.8<br />
19<br />
19.3<br />
19.9<br />
20<br />
20.6<br />
Lake Merced<br />
North East<br />
Depth<br />
Ft<br />
0<br />
5<br />
9<br />
10<br />
11<br />
12<br />
13<br />
13.8<br />
14<br />
14.1<br />
14.7<br />
15<br />
15.8<br />
18-Jun-02 23-Aug-02 23-Oct-02 11-Feb-03 14-May-03 15-Jul-03 30-Sep-03 2-Dec-03 27-May-04 29-Aug-04 27-Oct-04 9-Dec-04 9-Feb-05 18-Apr-05 23-Jun-05 17-Aug-05 28-Sep-05 31-Oct-05 29-Nov-05 29-Dec-05<br />
Tot P Tot P Tot P Tot P Tot P Tot P Tot P Tot P Tot P Tot P Tot P Tot P Tot P Tot P Tot P Tot P Tot P Tot P Tot P Tot P<br />
mg/L mg/L mg/L mg/L mg/L mg/L mg/L mg/L mg/L mg/L mg/L mg/L mg/L mg/L mg/L mg/L mg/L mg/L mg/L mg/L<br />
0.28 0.23 0.26 0.13 0.10 0.29 0.33 0.19 0.31 0.28 0.21 0.03 0.05 0.05 0.21 0.14 0.20 0.24 0.17<br />
0.28 0.25 0.27 0.12 0.14 0.31 0.32 0.22 0.29 0.31 0.21 0.03 0.04 0.05 0.15 0.13 0.26 0.23 0.25 0.18<br />
0.29 0.25 0.27 0.15 0.14 0.32 0.33 0.21 0.33 0.28 0.20 0.02 0.13 0.03 0.20 0.19 0.22 0.28 0.24<br />
0.27 0.22 0.26 0.15 0.10 0.36 0.41 0.21 0.32 0.28 0.18 0.07 0.12 0.05 0.12 0.18 0.21 0.29 0.30 0.22<br />
0.23<br />
0.29 0.05 0.26<br />
0.07 0.07 0.24 0.30 0.19<br />
18-Jun-02 23-Aug-02 23-Oct-02 11-Feb-03 14-May-03 15-Jul-03 30-Sep-03 2-Dec-03 27-May-04 29-Aug-04 27-Oct-04 9-Dec-04 9-Feb-05 18-Apr-05 23-Jun-05 17-Aug-05 28-Sep-05 31-Oct-05 29-Nov-05 29-Dec-05<br />
Tot P Tot P Tot P Tot P Tot P Tot P Tot P Tot P Tot P Tot P Tot P Tot P Tot P Tot P Tot P Tot P Tot P Tot P Tot P Tot P<br />
mg/L mg/L mg/L mg/L mg/L mg/L mg/L mg/L mg/L mg/L mg/L mg/L mg/L mg/L mg/L mg/L mg/L mg/L mg/L mg/L<br />
0.23 0.19 0.21 0.14 0.10 0.24 0.36 0.21 0.26 0.20 0.24 0.09 0.07 0.09 0.48 0.28 0.20 0.26 0.15 0.24<br />
0.18 0.23 0.20 0.13 0.11 0.35 0.34 0.22 0.28 0.20 0.24 0.09 0.07 0.08 0.41 0.21 0.18 0.23 0.21 0.21<br />
0.22 0.27 0.20 0.13 0.14 0.34 0.38 0.19 0.22 0.20 0.26 0.11 0.08 0.11 0.20 0.24 0.18 0.29 0.15 0.16<br />
0.21 0.09 0.02 0.24 0.24 0.15 0.27 0.16<br />
0.13<br />
0.21 0.18<br />
Page 2 of 6
D.3-89<br />
Lake Merced<br />
North<br />
Depth<br />
Ft<br />
Surf<br />
5<br />
10<br />
14<br />
15<br />
16<br />
17<br />
17.4<br />
17.5<br />
18<br />
18.8<br />
19<br />
19.3<br />
19.9<br />
20<br />
20.6<br />
Lake Merced<br />
North East<br />
Depth<br />
Ft<br />
0<br />
5<br />
9<br />
10<br />
11<br />
12<br />
13<br />
13.8<br />
14<br />
14.1<br />
14.7<br />
15<br />
15.8<br />
23-Jan-06 01-Mar-06 26-Apr-06 14-Jun-06 24-Aug-06 25-Oct-06 20-Dec-06 29-Mar-07 26-Jun-07 20-Aug-07 27-Dec-07 28-Mar-08 10-Jun-08 24-Sep-08 4-Dec-08 24-Mar-09 4-Jun-09 22-Sep-09 15-Dec-09<br />
Tot P Tot P Tot P Tot P Tot P Tot P Tot P Tot P Tot P Tot P Tot P Tot P Tot P Tot P Tot P Tot P Tot P Tot P Tot P<br />
mg/L mg/L mg/L mg/L mg/L mg/L mg/L mg/L mg/L mg/L mg/L mg/L mg/L mg/L mg/L mg/L mg/L mg/L mg/L<br />
0.18 0.15 0.15 0.35 0.36 0.34 0.25 0.19 0.30 0.31 0.18 0.16 0.26 0.37 0.39 0.29 0.37 0.52 0.31<br />
0.18 0.18 0.18 0.33 0.26 0.31 0.27 0.18 0.23 0.32 0.16 0.14 0.29 0.40 0.40 0.18 0.32 0.52 0.33<br />
0.20 0.18 0.16 0.29 0.32 0.31 0.26 0.18 0.32 0.37 0.17 0.23 0.24 0.40 0.39 0.19 0.33 0.52 0.33<br />
0.24 0.19 0.20 0.31 0.29 0.38 0.26 0.20 0.30 0.31 0.17 0.15 0.26 0.44 0.18 0.32 0.52 0.32<br />
0.29 0.32 0.39<br />
0.16 0.26 0.30 0.29 0.25 0.19 0.29 0.15<br />
0.16<br />
0.40<br />
0.40<br />
0.24 0.30<br />
23-Jan-06 01-Mar-06 26-Apr-06 14-Jun-06 24-Aug-06 25-Oct-06 20-Dec-06 29-Mar-07 26-Jun-07 20-Aug-07 27-Dec-07 28-Mar-08 10-Jun-08 24-Sep-08 4-Dec-08 24-Mar-09 4-Jun-09 22-Sep-09 15-Dec-09<br />
Tot P Tot P Tot P Tot P Tot P Tot P Tot P Tot P Tot P Tot P Tot P Tot P Tot P Tot P Tot P Tot P Tot P Tot P Tot P<br />
mg/L mg/L mg/L mg/L mg/L mg/L mg/L mg/L mg/L mg/L mg/L mg/L mg/L mg/L mg/L mg/L mg/L mg/L mg/L<br />
0.19 0.23 0.23 0.27 0.24 0.27 0.25 0.19 0.34 0.31 0.12 0.14 0.22 0.34 0.36 0.14 0.30 0.46 0.29<br />
0.21 0.12 0.22 0.26 0.27 0.27 0.25 0.19 0.26 0.32 0.11 0.12 0.25 0.35 0.33 0.14 0.27 0.46 0.29<br />
0.20 0.12 0.20 0.24 0.30 0.25 0.27 0.17 0.35 0.33 0.12 0.13 0.31 0.37 0.35 0.16 0.21 0.48 0.32<br />
0.14 0.30 0.25 0.39<br />
0.52<br />
0.18 0.24 0.30 0.28<br />
0.34<br />
0.16 0.28<br />
0.23 0.24 0.15 0.30 0.12 0.19<br />
0.11<br />
0.17<br />
0.29<br />
0.50<br />
Page 3 of 6
Lake Merced<br />
South - Pistol<br />
Range<br />
15-May-97 10-Sep-97 3-Dec-97 16-Mar-98 8-Jul-98 23-Sep-98 17-Mar-99 21-Jun-99 15-Sep-99 8-Dec-99 21-Mar-00 21-Jun-00 9-Aug-00 19-Dec-00 7-Mar-01 20-Jun-01 1-Oct-01 18-Dec-01 5-Mar-02 30-Apr-02<br />
Depth Tot P Tot P Tot P Tot P Tot P Tot P Tot P Tot P Tot P Tot P Tot P Tot P Tot P Tot P Tot P Tot P Tot P Tot P Tot P Tot P<br />
Ft mg/L mg/L mg/L mg/L mg/L mg/L mg/L mg/L mg/L mg/L mg/L mg/L mg/L mg/L mg/L mg/L mg/L mg/L mg/L mg/L<br />
0 0.08 0.25 0.03 0.05 0.08 0.07 0.18 0.16 0.25 0.19 0.18 0.20 0.13 0.14 0.22 0.19 0.10 0.11 0.15<br />
5 0.07 0.22 0.03 0.10 0.07 0.18 0.18 0.28 0.16 0.17 0.19 0.15 0.14 0.24 0.15 0.15 0.11 0.09<br />
6 0.06<br />
10 0.08 0.24 0.04 0.10 0.08 0.14 0.18 0.25 0.18 0.18 0.18 0.16 0.13 0.26 0.13 0.11 0.11 0.13<br />
12 0.07<br />
15 0.08 0.28 0.03 0.07 0.08 0.11 0.16 0.21 0.17 0.13 0.28 0.18 0.27 0.11 0.10<br />
16 0.08 0.28<br />
17<br />
18 0.08 0.18 0.18<br />
18.2<br />
18.5<br />
18.9<br />
19<br />
20 0.17<br />
20.1<br />
20.6<br />
20.8<br />
21<br />
21.5<br />
22<br />
D.3-90<br />
Lake Merced<br />
South - Pump<br />
Station<br />
15-May-97 10-Sep-97 3-Dec-97 16-Mar-98 8-Jul-98 23-Sep-98 17-Mar-99 21-Jun-99 15-Sep-99 8-Dec-99 21-Mar-00 21-Jun-00 9-Aug-00 19-Dec-00 7-Mar-01 20-Jun-01 1-Oct-01 18-Dec-01 5-Mar-02 30-Apr-02<br />
Depth Tot P Tot P Tot P Tot P Tot P Tot P Tot P Tot P Tot P Tot P Tot P Tot P Tot P Tot P Tot P Tot P Tot P Tot P Tot P Tot P<br />
Ft mg/L mg/L mg/L mg/L mg/L mg/L mg/L mg/L mg/L mg/L mg/L mg/L mg/L mg/L mg/L mg/L mg/L mg/L mg/L mg/L<br />
Surf 0.08 0.25 0.02 0.05 0.07 0.07 0.17 0.17 0.18 0.20 0.18 0.16 0.16 0.13 0.24 0.19 0.13 0.11 0.11<br />
5 0.07 0.01 0.02 0.05 0.13 0.08 0.18 0.17 0.16 0.19 0.18 0.18 0.19 0.13 0.24 0.19 0.12 0.10 0.12<br />
10 0.06 0.24 0.04 0.09 0.07 0.15 0.14 0.18 0.18 0.18 0.16 0.14 0.25 0.19 0.09 0.12 0.12<br />
12 0.05<br />
15 0.09 0.25 0.01 0.06 0.07 0.22 0.17 0.18 0.14 0.24 0.21 0.11 0.13 0.13<br />
16<br />
17<br />
18 0.06 0.17<br />
19 0.18<br />
19.2<br />
20 0.17<br />
20.4<br />
20.9<br />
21<br />
21.5<br />
22<br />
22.8<br />
23.2<br />
Note: Bold, italicized formats indicate half the reported value for statistical purposes.<br />
Page 4 of 6
D.3-91<br />
Lake Merced<br />
South - Pistol<br />
Range<br />
Depth<br />
Ft<br />
0<br />
5<br />
6<br />
10<br />
12<br />
15<br />
16<br />
17<br />
18<br />
18.2<br />
18.5<br />
18.9<br />
19<br />
20<br />
20.1<br />
20.6<br />
20.8<br />
21<br />
21.5<br />
22<br />
Lake Merced<br />
South - Pump<br />
Station<br />
Depth<br />
Ft<br />
Surf<br />
5<br />
10<br />
12<br />
15<br />
16<br />
17<br />
18<br />
19<br />
19.2<br />
20<br />
20.4<br />
20.9<br />
21<br />
21.5<br />
22<br />
22.8<br />
23.2<br />
18-Jun-02 23-Aug-02 23-Oct-02 11-Feb-03 14-May-03 15-Jul-03 30-Sep-03 2-Dec-03 27-May-04 29-Aug-04 27-Oct-04 9-Dec-04 9-Feb-05 18-Apr-05 23-Jun-05 17-Aug-05 28-Sep-05 31-Oct-05 29-Nov-05 29-Dec-05<br />
Tot P Tot P Tot P Tot P Tot P Tot P Tot P Tot P Tot P Tot P Tot P Tot P Tot P Tot P Tot P Tot P Tot P Tot P Tot P Tot P<br />
mg/L mg/L mg/L mg/L mg/L mg/L mg/L mg/L mg/L mg/L mg/L mg/L mg/L mg/L mg/L mg/L mg/L mg/L mg/L mg/L<br />
0.13 0.15 0.18 0.13 0.10 0.18 0.18 0.10 0.18 0.17 0.21 0.11 0.27 0.10 0.21 0.16 0.16 0.18 0.09 0.18<br />
0.13 0.18 0.18 0.11 0.07 0.13 0.16 0.14 0.20 0.14 0.24 0.14 0.07 0.11 0.20 0.17 0.15 0.23 0.14 0.17<br />
0.13 0.15 0.21 0.11 0.07 0.11 0.13 0.15 0.20 0.18 0.20 0.13 0.18 0.14 0.22 0.18 0.14 0.20 0.08 0.16<br />
0.13 0.15 0.25 0.12 0.07 0.19 0.16 0.16 0.18 0.17 0.16 0.13 0.13 0.13 0.22 0.17 0.23 0.21 0.14 0.15<br />
0.17 0.37<br />
0.16 0.21 0.06<br />
0.19 0.11 0.18 0.17<br />
18-Jun-02 23-Aug-02 23-Oct-02 11-Feb-03 14-May-03 15-Jul-03 30-Sep-03 2-Dec-03 27-May-04 29-Aug-04 27-Oct-04 9-Dec-04 9-Feb-05 18-Apr-05 23-Jun-05 17-Aug-05 28-Sep-05 31-Oct-05 29-Nov-05 29-Dec-05<br />
Tot P Tot P Tot P Tot P Tot P Tot P Tot P Tot P Tot P Tot P Tot P Tot P Tot P Tot P Tot P Tot P Tot P Tot P Tot P Tot P<br />
mg/L mg/L mg/L mg/L mg/L mg/L mg/L mg/L mg/L mg/L mg/L mg/L mg/L mg/L mg/L mg/L mg/L mg/L mg/L mg/L<br />
0.11 0.15 0.20 0.13 0.12 0.08 0.18 0.20 0.18 0.23 0.20 0.12 0.06 0.07 0.15 0.17 0.10 0.18 0.09 0.17<br />
0.12 0.16 0.21 0.11 0.07 0.13 0.16 0.17 0.23 0.13 0.24 0.08 0.15 0.16 0.22 0.15 0.11 0.13 0.19<br />
0.14 0.17 0.19 0.12 0.06 0.17 0.15 0.17 0.24 0.15 0.24 0.15 0.07 0.15 0.20 0.13 0.15 0.11 0.10 0.19<br />
0.12 0.16 0.25 0.12 0.06 0.20 0.19 0.17 0.24 0.26 0.23 0.16 0.10 0.17 0.24 0.13 0.20 0.11 0.08 0.10<br />
0.10<br />
0.19 0.11 0.10<br />
0.18<br />
0.18<br />
0.14 0.18 0.22 0.09 0.12<br />
Page 5 of 6
D.3-92<br />
Lake Merced<br />
South - Pistol<br />
Range<br />
Depth<br />
Ft<br />
0<br />
5<br />
6<br />
10<br />
12<br />
15<br />
16<br />
17<br />
18<br />
18.2<br />
18.5<br />
18.9<br />
19<br />
20<br />
20.1<br />
20.6<br />
20.8<br />
21<br />
21.5<br />
22<br />
Lake Merced<br />
South - Pump<br />
Station<br />
Depth<br />
Ft<br />
Surf<br />
5<br />
10<br />
12<br />
15<br />
16<br />
17<br />
18<br />
19<br />
19.2<br />
20<br />
20.4<br />
20.9<br />
21<br />
21.5<br />
22<br />
22.8<br />
23.2<br />
23-Jan-06 01-Mar-06 26-Apr-06 14-Jun-06 24-Aug-06 25-Oct-06 20-Dec-06 29-Mar-07 26-Jun-07 20-Aug-07 27-Dec-07 28-Mar-08 10-Jun-08 24-Sep-08 4-Dec-08 24-Mar-09 4-Jun-09 22-Sep-09 15-Dec-09<br />
Tot P Tot P Tot P Tot P Tot P Tot P Tot P Tot P Tot P Tot P Tot P Tot P Tot P Tot P Tot P Tot P Tot P Tot P Tot P<br />
mg/L mg/L mg/L mg/L mg/L mg/L mg/L mg/L mg/L mg/L mg/L mg/L mg/L mg/L mg/L mg/L mg/L mg/L mg/L<br />
0.16 0.07 0.17 0.18 0.19 0.20 0.15 0.08 0.09 0.10 0.12 0.10 0.09 0.19 0.27 0.14 0.21 0.21 0.12<br />
0.16 0.10 0.18 0.19 0.19 0.23 0.14 0.09 0.16 0.11 0.10 0.11 0.10 0.15 0.25 0.15 0.19 0.25 0.12<br />
0.13 0.21 0.09 0.10 0.19 0.21 0.12 0.06 0.12 0.09 0.08 0.11 0.19 0.30 0.17 0.19 0.32 0.11<br />
0.13 0.15 0.18 0.14 0.16 0.24 0.13 0.07 0.15 0.10 0.08 0.08 0.08 0.15 0.17 0.17 0.21 0.30 0.11<br />
0.15<br />
0.16<br />
0.08 0.17 0.17 0.16 0.09<br />
0.13 0.09 0.10<br />
0.17<br />
23-Jan-06 01-Mar-06 26-Apr-06 14-Jun-06 24-Aug-06 25-Oct-06 20-Dec-06 29-Mar-07 26-Jun-07 20-Aug-07 27-Dec-07 28-Mar-08 10-Jun-08 24-Sep-08 4-Dec-08 24-Mar-09 4-Jun-09 22-Sep-09 15-Dec-09<br />
Tot P Tot P Tot P Tot P Tot P Tot P Tot P Tot P Tot P Tot P Tot P Tot P Tot P Tot P Tot P Tot P Tot P Tot P Tot P<br />
mg/L mg/L mg/L mg/L mg/L mg/L mg/L mg/L mg/L mg/L mg/L mg/L mg/L mg/L mg/L mg/L mg/L mg/L mg/L<br />
0.13 0.14 0.20 0.21 0.23 0.22 0.17 0.13 0.14 0.13 0.08 0.05 0.09 0.21 0.24 0.09 0.21 0.40 0.15<br />
0.13 0.10 0.12 0.16 0.24 0.18 0.23 0.09 0.16 0.15 0.15 0.06 0.08 0.16 0.08 0.18 0.28 0.16<br />
0.07 0.16 0.23 0.20 0.26 0.20 0.11 0.10 0.13 0.15 0.08 0.06 0.10 0.19 0.23 0.1 0.14 0.29 0.14<br />
0.07 0.14 0.21 0.18 0.19 0.21 0.10 0.07 0.13 0.15 0.12 0.07 0.10 0.25 0.25 0.12 0.16 0.29 0.13<br />
0.08<br />
0.21<br />
0.06 0.19 0.15 0.12 0.07 0.12<br />
0.20 0.19 0.06 0.12<br />
0.07<br />
0.05<br />
0.17<br />
0.28<br />
0.22<br />
0.12<br />
0.11<br />
0.19<br />
0.20<br />
0.19<br />
0.28<br />
0.13<br />
0.12<br />
Page 6 of 6
Lake Merced<br />
North<br />
15-May-97 10-Sep-97 3-Dec-97 16-Mar-98 8-Jul-98 23-Sep-98 17-Mar-99 21-Jun-99 15-Sep-99 8-Dec-99 21-Mar-00 21-Jun-00 9-Aug-00 19-Dec-00 7-Mar-01 20-Jun-01 1-Oct-01 18-Dec-01 5-Mar-02 30-Apr-02<br />
Depth Fl - Fl - Fl - Fl - Fl - Fl - Fl - Fl - Fl - Fl - Fl - Fl - Fl - Fl - Fl - Fl - Fl - Fl - Fl - Fl -<br />
Ft mg/L mg/L mg/L mg/L mg/L mg/L mg/L mg/L mg/L mg/L mg/L mg/L mg/L mg/L mg/L mg/L mg/L mg/L mg/L mg/L<br />
Surf 0.10 0.10 0.05 0.11 0.05 0.09 0.05 0.05 0.10 0.13 0.11 0.12 0.12 0.13 0.13 0.09 0.10 0.05<br />
5 0.10 0.10 0.05 0.11 0.05 0.10 0.05 0.05 0.05 0.12 0.11 0.12 0.12 0.12 0.13 0.10 0.10 0.05<br />
10 0.10 0.10 0.05 0.11 0.05 0.08 0.05 0.05 0.05 0.12 0.11 0.12 0.12 0.13 0.12 0.08 0.10 0.05<br />
14 0.05 0.05 0.12 0.10<br />
15 0.10 0.10 0.05 0.11 0.05 0.10 0.05 0.11 0.12 0.12 0.12 0.10 0.05<br />
16<br />
17<br />
17.4<br />
17.5<br />
18 0.13<br />
18.8<br />
19<br />
20<br />
20.6<br />
D.3-93<br />
Lake Merced<br />
North East<br />
15-May-97 10-Sep-97 3-Dec-97 16-Mar-98 8-Jul-98 23-Sep-98 17-Mar-99 21-Jun-99 15-Sep-99 8-Dec-99 21-Mar-00 21-Jun-00 9-Aug-00 19-Dec-00 7-Mar-01 20-Jun-01 1-Oct-01 18-Dec-01 5-Mar-02 30-Apr-02<br />
Depth Fl - Fl - Fl - Fl - Fl - Fl - Fl - Fl - Fl - Fl - Fl - Fl - Fl - Fl - Fl - Fl - Fl - Fl - Fl - Fl -<br />
Ft mg/L mg/L mg/L mg/L mg/L mg/L mg/L mg/L mg/L mg/L mg/L mg/L mg/L mg/L mg/L mg/L mg/L mg/L mg/L mg/L<br />
Surf 0.10 0.05 0.05 0.05 0.08 0.05 0.05 0.05 0.12 0.10 0.11 0.12 0.05 0.05 0.08 0.10 0.05<br />
5 0.10 0.05 0.05 0.05 0.08 0.05 0.05 0.05 0.12 0.10 0.11 0.12 0.10 0.05 0.08 0.10 0.05<br />
9 0.08<br />
10 0.05 0.05 0.05 0.05 0.08 0.05 0.05 0.05 0.10 0.10 0.12 0.05 0.05 0.10 0.05<br />
11<br />
12<br />
13 0.12<br />
14<br />
14.1<br />
15<br />
15.8<br />
Page 1 of 6
D.3-94<br />
Lake Merced<br />
North<br />
Depth<br />
Ft<br />
Surf<br />
5<br />
10<br />
14<br />
15<br />
16<br />
17<br />
17.4<br />
17.5<br />
18<br />
18.8<br />
19<br />
20<br />
20.6<br />
Lake Merced<br />
North East<br />
Depth<br />
Ft<br />
Surf<br />
5<br />
9<br />
10<br />
11<br />
12<br />
13<br />
14<br />
14.1<br />
15<br />
15.8<br />
18-Jun-02 23-Aug-02 23-Oct-02 11-Feb-03 14-May-03 15-Jul-03 30-Sep-03 2-Dec-03 27-May-04 29-Aug-04 27-Oct-04 9-Dec-04 9-Feb-05 18-Apr-05 23-Jun-05 17-Aug-05 28-Sep-05 31-Oct-05 29-Nov-05 29-Dec-05 23-Jan-06<br />
Fl - Fl - Fl - Fl - Fl - Fl - Fl - Fl - Fl - Fl - Fl - Fl - Fl - Fl - Fl - Fl - Fl - Fl - Fl - Fl - Fl -<br />
mg/L mg/L mg/L mg/L mg/L mg/L mg/L mg/L mg/L mg/L mg/L mg/L mg/L mg/L mg/L mg/L mg/L mg/L mg/L mg/L mg/L<br />
0.25 0.16 0.16 0.02 0.04 0.14 0.30 0.24 0.32 0.27 0.25 0.18 0.38 0.21 0.36 0.42 0.26 0.23 0.30 0.31 0.15<br />
0.25 0.20 0.22 0.18 0.07 0.16 0.30 0.21 0.30 0.27 0.29 0.19 0.38 0.23 0.36 0.37 0.26 0.26 0.30 0.34 0.15<br />
0.12 0.20 0.17 0.17 0.12 0.15 0.35 0.27 0.30 0.27 0.32 0.53 0.38 0.23 0.39 0.42 0.27 0.24 0.31 0.31 0.16<br />
0.18 0.18 0.17 0.17 0.09 0.16 0.32 0.26 0.30 0.25 0.26 0.31 0.39 0.24 0.37 0.42 0.27 0.28 0.30 0.31 0.20<br />
0.37<br />
0.29 0.42 0.29<br />
0.18 0.24 0.26 0.30 0.30 0.19<br />
18-Jun-02 23-Aug-02 23-Oct-02 11-Feb-03 14-May-03 15-Jul-03 30-Sep-03 2-Dec-03 27-May-04 29-Aug-04 27-Oct-04 9-Dec-04 9-Feb-05 18-Apr-05 23-Jun-05 17-Aug-05 28-Sep-05 31-Oct-05 29-Nov-05 29-Dec-05 23-Jan-06<br />
Fl - Fl - Fl - Fl - Fl - Fl - Fl - Fl - Fl - Fl - Fl - Fl - Fl - Fl - Fl - Fl - Fl - Fl - Fl - Fl - Fl -<br />
mg/L mg/L mg/L mg/L mg/L mg/L mg/L mg/L mg/L mg/L mg/L mg/L mg/L mg/L mg/L mg/L mg/L mg/L mg/L mg/L mg/L<br />
0.22 0.17 0.09 0.17 0.09 0.16 0.28 0.19 0.31 0.29 0.27 0.13 0.37 0.23 0.42 0.15 0.27 0.28 0.30 0.30 0.25<br />
0.16 0.18 0.13 0.16 0.10 0.18 0.26 0.23 0.33 0.30 0.27 0.12 0.37 0.23 0.39 0.15 0.29 0.26 0.31 0.32 0.22<br />
0.15 0.18 0.12 0.15 0.12 0.13 0.27 0.22 0.32 0.30 0.28 0.14 0.37 0.22 0.41 0.15 0.27 0.24 0.32 0.30 0.24<br />
0.43<br />
0.26 0.17 0.37 0.46 0.18 0.30 0.27 0.32 0.24<br />
0.25 0.32<br />
Page 2 of 6
Lake Merced<br />
North<br />
Depth<br />
Ft<br />
Surf<br />
5<br />
10<br />
14<br />
15<br />
16<br />
17<br />
17.4<br />
17.5<br />
18<br />
18.8<br />
19<br />
20<br />
20.6<br />
01-Mar-06 26-Apr-06 14-Jun-06 24-Aug-06 25-Oct-06 20-Dec-06 29-Mar-07 26-Jun-07 20-Aug-07 27-Dec-07 28-Mar-08 10-Jun-08 24-Sep-08 4-Dec-08<br />
Fl - Fl - Fl - Fl - Fl - Fl - Fl - Fl - Fl - Fl - Fl - Fl - Fl - Fl -<br />
mg/L mg/L mg/L mg/L mg/L mg/L mg/L mg/L mg/L mg/L mg/L mg/L mg/L mg/L<br />
0.25 0.25 0.27 0.16 0.24 0.23 0.09 0.14 0.15 0.23 0.24 0.20<br />
0.29 0.22 0.30 0.17 0.25 0.23 0.11 0.17 0.14 0.23 0.23 0.19<br />
0.28 0.25 0.36 0.18 0.25 0.25 0.12 0.15 0.18 0.25 0.26 0.28<br />
0.39 0.23 0.33 0.16 0.25 0.25 0.16 0.20 0.18 0.24 0.29 0.38<br />
0.28 0.18<br />
0.28 0.25 0.32 0.17 0.24 0.18 0.20 0.26<br />
0.25<br />
0.31<br />
D.3-95<br />
Lake Merced<br />
North East<br />
Depth<br />
Ft<br />
Surf<br />
5<br />
9<br />
10<br />
11<br />
12<br />
13<br />
14<br />
14.1<br />
15<br />
15.8<br />
01-Mar-06 26-Apr-06 14-Jun-06 24-Aug-06 25-Oct-06 20-Dec-06 29-Mar-07 26-Jun-07 20-Aug-07 27-Dec-07 28-Mar-08 10-Jun-08 24-Sep-08 4-Dec-08<br />
Fl - Fl - Fl - Fl - Fl - Fl - Fl - Fl - Fl - Fl - Fl - Fl - Fl - Fl -<br />
mg/L mg/L mg/L mg/L mg/L mg/L mg/L mg/L mg/L mg/L mg/L mg/L mg/L mg/L<br />
0.30 0.29 0.25 0.28 0.24 0.32 0.36 0.12 0.14 0.24 0.13 0.14<br />
0.33 0.27 0.24 0.28 0.27 0.32 0.32 0.16 0.14 0.27 0.14 0.23<br />
0.33 0.27 0.30 0.27 0.21 0.32 0.28 0.15 0.16 0.25 0.19 0.30<br />
0.19 0.27<br />
0.36 0.30 0.28 0.16<br />
0.28 0.32 0.38 0.18 0.22<br />
0.18<br />
Page 3 of 6
Lake Merced<br />
South - Pistol<br />
Range<br />
15-May-97 10-Sep-97 3-Dec-97 16-Mar-98 8-Jul-98 23-Sep-98 17-Mar-99 21-Jun-99 15-Sep-99 8-Dec-99 21-Mar-00 21-Jun-00 9-Aug-00 19-Dec-00 7-Mar-01 20-Jun-01 1-Oct-01 18-Dec-01 5-Mar-02 30-Apr-02<br />
Depth Fl - Fl - Fl - Fl - Fl - Fl - Fl - Fl - Fl - Fl - Fl - Fl - Fl - Fl - Fl - Fl - Fl - Fl - Fl - Fl -<br />
Ft mg/L mg/L mg/L mg/L mg/L mg/L mg/L mg/L mg/L mg/L mg/L mg/L mg/L mg/L mg/L mg/L mg/L mg/L mg/L mg/L<br />
Surf 0.40 0.40 0.40 0.36 0.3 0.27 0.28 0.33 0.33 0.33 0.30 0.38 0.30 0.31 0.26 0.29 0.27 0.30 0.23 NA<br />
5 0.40 0.40 0.40 0.3 0.27 0.28 0.33 0.34 0.34 0.29 0.37 0.30 0.30 0.27 0.29 0.27 0.30 0.21 NA<br />
6 0.36<br />
10 0.40 0.40 0.40 0.3 0.27 0.28 0.33 0.33 0.33 0.29 0.37 0.30 0.32 0.27 0.28 0.27 0.30 0.22 NA<br />
12 0.36<br />
15 0.40 0.40 0.40 0.3 0.27 0.28 0.33 0.34 0.33 0.31 0.26 0.29 0.27 0.30 0.23 NA<br />
16 0.40 0.40<br />
17<br />
18 0.36 0.37 0.30<br />
19<br />
20 0.28<br />
21<br />
21.5<br />
22<br />
D.3-96<br />
Lake Merced<br />
South - Pump<br />
Station<br />
15-May-97 10-Sep-97 3-Dec-97 16-Mar-98 8-Jul-98 23-Sep-98 17-Mar-99 21-Jun-99 15-Sep-99 8-Dec-99 21-Mar-00 21-Jun-00 9-Aug-00 19-Dec-00 7-Mar-01 20-Jun-01 1-Oct-01 18-Dec-01 5-Mar-02 30-Apr-02<br />
Depth Fl - Fl - Fl - Fl - Fl - Fl - Fl - Fl - Fl - Fl - Fl - Fl - Fl - Fl - Fl - Fl - Fl - Fl - Fl - Fl -<br />
Ft mg/L mg/L mg/L mg/L mg/L mg/L mg/L mg/L mg/L mg/L mg/L mg/L mg/L mg/L mg/L mg/L mg/L mg/L mg/L mg/L<br />
Surf 0.40 0.40 0.40 0.36 0.3 0.26 0.28 0.33 0.33 0.33 0.29 0.39 0.30 0.31 0.28 0.28 0.26 0.30 0.22<br />
5 0.40 0.40 0.40 0.36 0.3 0.27 0.28 0.32 0.34 0.33 0.28 0.38 0.29 0.30 0.26 0.29 0.27 0.30 0.22<br />
10 0.40 0.40 0.40 0.3 0.27 0.28 0.33 0.34 0.33 0.29 0.38 0.29 0.30 0.26 0.30 0.27 0.30 0.22<br />
12 0.36<br />
15 0.40 0.40 0.40 0.3 0.27 0.29 0.32 0.33 0.33 0.31 0.26 0.29 0.27 0.30 0.23<br />
16<br />
17<br />
18 0.36 0.37<br />
19 0.30<br />
20 0.29<br />
21<br />
22<br />
23.2<br />
Note: Bold, italicized formats indicate half the reported value for statistical purposes.<br />
Page 4 of 6
Lake Merced<br />
South - Pistol<br />
Range<br />
Depth<br />
Ft<br />
Surf<br />
5<br />
6<br />
10<br />
12<br />
15<br />
16<br />
17<br />
18<br />
19<br />
20<br />
21<br />
21.5<br />
22<br />
18-Jun-02 23-Aug-02 23-Oct-02 11-Feb-03 14-May-03 15-Jul-03 30-Sep-03 2-Dec-03 27-May-04 29-Aug-04 27-Oct-04 9-Dec-04 9-Feb-05 18-Apr-05 23-Jun-05 17-Aug-05 28-Sep-05 31-Oct-05 29-Nov-05 29-Dec-05 23-Jan-06<br />
Fl - Fl - Fl - Fl - Fl - Fl - Fl - Fl - Fl - Fl - Fl - Fl - Fl - Fl - Fl - Fl - Fl - Fl - Fl - Fl - Fl -<br />
mg/L mg/L mg/L mg/L mg/L mg/L mg/L mg/L mg/L mg/L mg/L mg/L mg/L mg/L mg/L mg/L mg/L mg/L mg/L mg/L mg/L<br />
0.47 0.32 0.27 0.51 0.39 0.23 0.52 0.47 0.54 0.55 0.50 0.66 0.46 0.47 0.57 0.40 0.36 0.47 0.52 0.51 0.42<br />
0.45 0.33 0.31 0.44 0.37 0.25 0.53 0.47 0.55 0.45 0.52 0.66 0.47 0.47 0.54 0.40 0.37 0.47 0.53 0.48 0.40<br />
0.36 0.32 0.28 0.46 0.37 0.27 0.55 0.47 0.53 0.46 0.52 0.59 0.46 0.47 0.57 0.42 0.37 0.48 0.55 0.46 0.42<br />
0.37 0.32 0.35 0.47 0.34 0.29 0.52 0.50 0.53 0.46 0.52 0.57 0.46 0.46 0.56 0.47 0.39 0.47 0.55 0.52 0.41<br />
0.58 0.52<br />
0.48 0.39 0.51 0.45<br />
0.47<br />
0.45 0.55 0.39 0.45<br />
D.3-97<br />
Lake Merced<br />
South - Pump<br />
Station<br />
Depth<br />
Ft<br />
Surf<br />
5<br />
10<br />
12<br />
15<br />
16<br />
17<br />
18<br />
19<br />
20<br />
21<br />
22<br />
23.2<br />
18-Jun-02 23-Aug-02 23-Oct-02 11-Feb-03 14-May-03 15-Jul-03 30-Sep-03 2-Dec-03 27-May-04 29-Aug-04 27-Oct-04 9-Dec-04 9-Feb-05 18-Apr-05 23-Jun-05 17-Aug-05 28-Sep-05 31-Oct-05 29-Nov-05 29-Dec-05 23-Jan-06<br />
Fl - Fl - Fl - Fl - Fl - Fl - Fl - Fl - Fl - Fl - Fl - Fl - Fl - Fl - Fl - Fl - Fl - Fl - Fl - Fl - Fl -<br />
mg/L mg/L mg/L mg/L mg/L mg/L mg/L mg/L mg/L mg/L mg/L mg/L mg/L mg/L mg/L mg/L mg/L mg/L mg/L mg/L mg/L<br />
0.27 0.36 0.33 0.49 0.36 0.25 0.55 0.47 0.53 0.46 0.52 0.35 0.46 0.46 0.68 0.41 0.39 0.51 0.41 0.37 0.48<br />
0.27 0.34 0.32 0.48 0.35 0.28 0.55 0.49 0.54 0.48 0.52 0.35 0.47 0.47 0.60 0.40 0.40 0.48 0.43 0.34 0.50<br />
0.37 0.34 0.35 0.48 0.37 0.25 0.54 0.49 0.53 0.46 0.50 0.37 0.48 0.50 0.60 0.40 0.43 0.49 0.43 0.37 0.50<br />
0.36 0.33 0.35 0.49 0.35 0.30 0.57 0.47 0.51 0.48 0.49 0.35 0.50 0.49 0.62 0.37 0.41 0.48 0.43 0.38 0.51<br />
0.43<br />
0.50 0.36 0.45<br />
0.61 0.38 0.41 0.45 0.38 0.49<br />
0.49<br />
Page 5 of 6
Lake Merced<br />
South - Pistol<br />
Range<br />
Depth<br />
Ft<br />
Surf<br />
5<br />
6<br />
10<br />
12<br />
15<br />
16<br />
17<br />
18<br />
19<br />
20<br />
21<br />
21.5<br />
22<br />
01-Mar-06 26-Apr-06 14-Jun-06 24-Aug-06 25-Oct-06 20-Dec-06 29-Mar-07 26-Jun-07 20-Aug-07 27-Dec-07 28-Mar-08 10-Jun-08 24-Sep-08 4-Dec-08<br />
Fl - Fl - Fl - Fl - Fl - Fl - Fl - Fl - Fl - Fl - Fl - Fl - Fl - Fl -<br />
mg/L mg/L mg/L mg/L mg/L mg/L mg/L mg/L mg/L mg/L mg/L mg/L mg/L mg/L<br />
0.39 0.44 0.31 0.32 0.38 0.34 0.39 0.35 0.45 0.41 0.25 0.34<br />
0.57 0.43 0.33 0.34 0.41 0.37 0.39 0.37 0.44 0.41 0.33 0.33<br />
0.48 0.41 0.33 0.33 0.37 0.36 0.39 0.37 0.44 0.30 0.34<br />
0.48 0.43 0.32 0.35 0.43 0.38 0.40 0.41 0.45 0.43 0.25 0.36<br />
0.42<br />
0.40 0.42 0.32 0.39 0.34<br />
0.35 0.41 0.42<br />
0.26<br />
0.41<br />
D.3-98<br />
Lake Merced<br />
South - Pump<br />
Station<br />
Depth<br />
Ft<br />
Surf<br />
5<br />
10<br />
12<br />
15<br />
16<br />
17<br />
18<br />
19<br />
20<br />
21<br />
22<br />
23.2<br />
01-Mar-06 26-Apr-06 14-Jun-06 24-Aug-06 25-Oct-06 20-Dec-06 29-Mar-07 26-Jun-07 20-Aug-07 27-Dec-07 28-Mar-08 10-Jun-08 24-Sep-08 4-Dec-08<br />
Fl - Fl - Fl - Fl - Fl - Fl - Fl - Fl - Fl - Fl - Fl - Fl - Fl - Fl -<br />
mg/L mg/L mg/L mg/L mg/L mg/L mg/L mg/L mg/L mg/L mg/L mg/L mg/L mg/L<br />
0.36 0.43 0.32 0.32 0.42 0.38 0.46 0.46 0.44 0.44 0.28 0.35<br />
0.43 0.44 0.33 0.34 0.43 0.40 0.46 0.42 0.47 0.45 0.27 0.38<br />
0.40 0.47 0.30 0.33 0.42 0.39 0.45 0.41 0.47 0.48 0.33 0.37<br />
0.39 0.45 0.36 0.35 0.42 0.41 0.45 0.39 0.46 0.46 0.27 0.36<br />
0.48<br />
0.51 0.38 0.32 0.45 0.44 0.36<br />
0.44 0.38 0.44 0.39<br />
0.27<br />
Page 6 of 6
Lake Merced<br />
North<br />
15-May-97 10-Sep-97 3-Dec-97 16-Mar-98 8-Jul-98 23-Sep-98 17-Mar-99 21-Jun-99 15-Sep-99 8-Dec-99 21-Mar-00 21-Jun-00 9-Aug-00 19-Dec-00 7-Mar-01 20-Jun-01 1-Oct-01 18-Dec-01 5-Mar-02 30-Apr-02<br />
Depth TOC TOC TOC TOC TOC TOC TOC TOC TOC TOC TOC TOC TOC TOC TOC TOC TOC TOC TOC TOC<br />
Ft mg/L mg/L mg/L mg/L mg/L mg/L mg/L mg/L mg/L mg/L mg/L mg/L mg/L mg/L mg/L mg/L mg/L mg/L mg/L mg/L<br />
Surf 9.5 9.1 10.2 7.7 9.7 7.7 9.6 8.7 7.3 8.7 8.2 20.8 6.9 7.9 12.1 5.8 7.9 7.5<br />
5 9.8 9.3 15.4 8.2 9.7 8.0 9.9 13.2 7.2 9.9 8.1 17.1 6.9 7.4 12.8 5.9 8.3 6.8<br />
10 9.2 9.2 12.3 8.4 9.4 8.2 9.6 8.8 7.3 9.2 8.3 23.9 7.1 7.8 14.5 5.9 9.1 6.7<br />
14 9.5 7.4 24.4 12.8<br />
15 9.0 9.3 15.1 8.0 9.7 8.2 8.9 8.0 6.9 7.3 5.8 8.5 6.1<br />
16<br />
17<br />
17.4<br />
17.5<br />
18 7.2<br />
18.8<br />
19<br />
20<br />
20.6<br />
D.3-99<br />
Lake Merced<br />
North East<br />
15-May-97 10-Sep-97 3-Dec-97 16-Mar-98 8-Jul-98 23-Sep-98 17-Mar-99 21-Jun-99 15-Sep-99 8-Dec-99 21-Mar-00 21-Jun-00 9-Aug-00 19-Dec-00 7-Mar-01 20-Jun-01 1-Oct-01 18-Dec-01 5-Mar-02 30-Apr-02<br />
Depth TOC TOC TOC TOC TOC TOC TOC TOC TOC TOC TOC TOC TOC TOC TOC TOC TOC TOC TOC TOC<br />
Ft mg/L mg/L mg/L mg/L mg/L mg/L mg/L mg/L mg/L mg/L mg/L mg/L mg/L mg/L mg/L mg/L mg/L mg/L mg/L mg/L<br />
Surf 7.9 7.0 6.6 8.4 7.4 7.9 15.6 6.6 8.2 7.1 19.6 6.1 9.6 5.0 4.4 7.0 5.3<br />
5 7.7 7.9 6.7 8.2 7.3 8.5 4.8 6.7 8.0 9.3 35.6 6.7 8.6 5.0 4.5 7.6 5.5<br />
9 5.0<br />
10 7.3 7.3 6.8 8.3 7.7 8.1 61.1 9.3 7.4 19.9 6.5 7.7 4.5 6.5 5.4<br />
11<br />
12<br />
13 6.4<br />
14<br />
14.1<br />
15<br />
15.8<br />
Page 1 of 6
Lake Merced<br />
North<br />
Depth<br />
Ft<br />
Surf<br />
5<br />
10<br />
14<br />
15<br />
16<br />
17<br />
17.4<br />
17.5<br />
18<br />
18.8<br />
19<br />
20<br />
20.6<br />
18-Jun-02 23-Aug-02 23-Oct-02 11-Feb-03 14-May-03 15-Jul-03 30-Sep-03 2-Dec-03 27-May-04 29-Aug-04 27-Oct-04 9-Dec-04 9-Feb-05 18-Apr-05 23-Jun-05 17-Aug-05 28-Sep-05 31-Oct-05 29-Nov-05 29-Dec-05<br />
TOC TOC TOC TOC TOC TOC TOC TOC TOC TOC TOC TOC TOC TOC TOC TOC TOC TOC TOC TOC<br />
mg/L mg/L mg/L mg/L mg/L mg/L mg/L mg/L mg/L mg/L mg/L mg/L mg/L mg/L mg/L mg/L mg/L mg/L mg/L mg/L<br />
7.6 9.2 8.7 7.6 7.6 6.4 6.9 6.6 7.1 8.7 7.3 7.9 10.8 19.5 12.5 8.1 9.6 9.0 7.1<br />
7.5 8.5 8.4 7.6 7.2 6.4 6.8 6.5 7.3 8.1 7.6 8.2 10.5 20.1 12.4 7.8 8.7 8.6 7.2<br />
7.5 8.6 10.4 7.5 7.6 6.2 7.0 6.8 7.2 8.5 7.7 8.9 10.9 19.8 12.8 7.6 8.5 8.7 7.4<br />
7.3 9.7 7.5 7.7 6.2 6.6 7.0 7.7 8.4 7.8 9.1 11.2 20.2 13.3 8.0 8.3 8.6 7.4<br />
9.2 6.8 7.5<br />
8.5 7.8 7.2<br />
12.3<br />
D.3-100<br />
Lake Merced<br />
North East<br />
Depth<br />
Ft<br />
Surf<br />
5<br />
9<br />
10<br />
11<br />
12<br />
13<br />
14<br />
14.1<br />
15<br />
15.8<br />
18-Jun-02 23-Aug-02 23-Oct-02 11-Feb-03 14-May-03 15-Jul-03 30-Sep-03 2-Dec-03 27-May-04 29-Aug-04 27-Oct-04 9-Dec-04 9-Feb-05 18-Apr-05 23-Jun-05 17-Aug-05 28-Sep-05 31-Oct-05 29-Nov-05 29-Dec-05<br />
TOC TOC TOC TOC TOC TOC TOC TOC TOC TOC TOC TOC TOC TOC TOC TOC TOC TOC TOC TOC<br />
mg/L mg/L mg/L mg/L mg/L mg/L mg/L mg/L mg/L mg/L mg/L mg/L mg/L mg/L mg/L mg/L mg/L mg/L mg/L mg/L<br />
6.6 7.9 7.6 6.6 7.4 5.6 6.2 6.1 7.6 7.8 6.2 7.6 12.1 20.0 17.2 8.7 9.5 9.4 8.4<br />
6.2 7.4 7.1 6.2 6.5 5.7 6.6 6.1 7.3 7.6 6.1 6.9 10.8 19.0 16.2 8.2 8.4 8.5 6.8<br />
6.5 6.9 6.1 6.8 6.4 6.2 9.1 8.6 7.0 6.0 15.0 8.3 7.5 6.8<br />
8.7 7.5 6.5 13.5 7.3 7.4 7.4<br />
Page 2 of 6
Lake Merced<br />
North<br />
Depth<br />
Ft<br />
Surf<br />
5<br />
10<br />
14<br />
15<br />
16<br />
17<br />
17.4<br />
17.5<br />
18<br />
18.8<br />
19<br />
20<br />
20.6<br />
23-Jan-06 01-Mar-06 26-Apr-06 14-Jun-06 24-Aug-06 25-Oct-06 20-Dec-06 29-Mar-07 26-Jun-07 20-Aug-07 27-Dec-07 28-Mar-08 10-Jun-08 24-Sep-08 4-Dec-08<br />
TOC TOC TOC TOC TOC TOC TOC TOC TOC TOC TOC TOC TOC TOC TOC<br />
mg/L mg/L mg/L mg/L mg/L mg/L mg/L mg/L mg/L mg/L mg/L mg/L mg/L mg/L mg/L<br />
7.1 6.3 7.9 8.12 12.8 9.2 8.4 9.2 13.0 10.2 10.0 10.3 12.4<br />
7.4 6.6 7.8 9.40 10.6 8.5 7.5 9.3 10.9 10.9 10.0 10.1 12.4<br />
6.9 6.7 7.3 8.07 13.6 8.6 7.9 9.1 13.7 11.0 10.8 10.3 11.6<br />
6.9 6.8 7.6 7.82 13.1 8.7 8.0 9.1 16.2 10.9 9.2 10.4 13.4<br />
7.4 9.8 13.7<br />
6.7 7.7 8.07 10.3 8.2 8.6 12.3 10.7<br />
9.7<br />
11.2<br />
D.3-101<br />
Lake Merced<br />
North East<br />
Depth<br />
Ft<br />
Surf<br />
5<br />
9<br />
10<br />
11<br />
12<br />
13<br />
14<br />
14.1<br />
15<br />
15.8<br />
23-Jan-06 01-Mar-06 26-Apr-06 14-Jun-06 24-Aug-06 25-Oct-06 20-Dec-06 29-Mar-07 26-Jun-07 20-Aug-07 27-Dec-07 28-Mar-08 10-Jun-08 24-Sep-08 4-Dec-08<br />
TOC TOC TOC TOC TOC TOC TOC TOC TOC TOC TOC TOC TOC TOC TOC<br />
mg/L mg/L mg/L mg/L mg/L mg/L mg/L mg/L mg/L mg/L mg/L mg/L mg/L mg/L mg/L<br />
8.4 6.7 8.0 8.45 11.7 14.6 8.9 10.4 12.0 11.1 9.3 8.6 13.4<br />
7.8 6.2 7.5 9.28 14.0 10.7 7.7 8.2 10.8 12.2 7.3 10.0 11.6<br />
6.7 6.3 7.8 5.80 9.9 9.7 7.6 8.6 9.9 11.7 8.2 9.9 9.9<br />
7.0 8.7 10.9<br />
6.4 8.25 10.0 10.7<br />
7.8 8.2 8.7 9.6 8.2<br />
11.4<br />
Page 3 of 6
Lake Merced<br />
South - Pistol<br />
Range<br />
15-May-97 10-Sep-97 3-Dec-97 16-Mar-98 8-Jul-98 23-Sep-98 17-Mar-99 21-Jun-99 15-Sep-99 8-Dec-99 21-Mar-00 21-Jun-00 9-Aug-00 19-Dec-00 7-Mar-01 20-Jun-01 1-Oct-01 18-Dec-01 5-Mar-02 30-Apr-02<br />
Depth TOC TOC TOC TOC TOC TOC TOC TOC TOC TOC TOC TOC TOC TOC TOC TOC TOC TOC TOC TOC<br />
Ft mg/L mg/L mg/L mg/L mg/L mg/L mg/L mg/L mg/L mg/L mg/L mg/L mg/L mg/L mg/L mg/L mg/L mg/L mg/L mg/L<br />
Surf 6.2 15.4 8.2 5.9 6.7 5.6 7.1 7.5 9.6 5.8 7.5 6.6 16.3 5.1 7.6 10.2 5.0 6.4 5.9<br />
5 6.5 12.7 7.5 6.8 5.9 6.5 7.5 8.9 6.0 7.3 6.6 27.0 5.9 7.0 5.0 5.4 6.9 6.3<br />
6 7.1<br />
10 6.5 13.8 10.3 6.4 5.8 6.6 7.1 9.5 6.0 8.0 6.7 20.6 5.4 6.3 5.0 4.9 7.1 6.0<br />
12 5.6<br />
15 6.4 10.0 8.3 6.5 7.0 6.5 9.2 9.7 15.4 5.9 5.3 5.0 4.7 6.5<br />
16 7.3<br />
17<br />
18 6.6 8.1 7.2<br />
19<br />
20 6.3<br />
21<br />
21.5<br />
22<br />
D.3-102<br />
Lake Merced<br />
South - Pump<br />
Station<br />
15-May-97 10-Sep-97 3-Dec-97 16-Mar-98 8-Jul-98 23-Sep-98 17-Mar-99 21-Jun-99 15-Sep-99 8-Dec-99 21-Mar-00 21-Jun-00 9-Aug-00 19-Dec-00 7-Mar-01 20-Jun-01 1-Oct-01 18-Dec-01 5-Mar-02 30-Apr-02<br />
Depth TOC TOC TOC TOC TOC TOC TOC TOC TOC TOC TOC TOC TOC TOC TOC TOC TOC TOC TOC TOC<br />
Ft mg/L mg/L mg/L mg/L mg/L mg/L mg/L mg/L mg/L mg/L mg/L mg/L mg/L mg/L mg/L mg/L mg/L mg/L mg/L mg/L<br />
Surf 9.0 12.3 9.5 5.4 6.7 6.0 6.6 7.4 11.7 6.2 6.9 6.7 15.2 5.3 6.5 5.0 5.0 7.1 5.5<br />
5 6.3 14.1 7.2 6.5 6.8 6.1 6.6 7.1 12.5 6.3 7.5 7.2 15.5 5.6 5.9 5.0 5.0 6.8 5.7<br />
10 6.1 9.3 7.0 6.4 5.8 6.6 7.6 14.1 6.3 7.3 6.8 11.2 5.6 5.4 10.1 4.8 6.3 5.6<br />
12 5.5<br />
15 6.3 9.8 9.5 6.5 6.4 6.4 7.6 10.8 16.4 5.6 5.8 5.0 4.7 6.1 5.7<br />
16<br />
17<br />
18 6.2 6.6<br />
19 7.3<br />
20 6.2<br />
21<br />
22<br />
23.2<br />
Note: Bold, italicized formats indicate half the reported value for statistical purposes.<br />
Page 4 of 6
D.3-103<br />
Lake Merced<br />
South - Pistol<br />
Range<br />
Depth<br />
Ft<br />
Surf<br />
5<br />
6<br />
10<br />
12<br />
15<br />
16<br />
17<br />
18<br />
19<br />
20<br />
21<br />
21.5<br />
22<br />
Lake Merced<br />
South - Pump<br />
Station<br />
Depth<br />
Ft<br />
Surf<br />
5<br />
10<br />
12<br />
15<br />
16<br />
17<br />
18<br />
19<br />
20<br />
21<br />
22<br />
23.2<br />
18-Jun-02 23-Aug-02 23-Oct-02 11-Feb-03 14-May-03 15-Jul-03 30-Sep-03 2-Dec-03 27-May-04 29-Aug-04 27-Oct-04 9-Dec-04 9-Feb-05 18-Apr-05 23-Jun-05 17-Aug-05 28-Sep-05 31-Oct-05 29-Nov-05 29-Dec-05<br />
TOC TOC TOC TOC TOC TOC TOC TOC TOC TOC TOC TOC TOC TOC TOC TOC TOC TOC TOC TOC<br />
mg/L mg/L mg/L mg/L mg/L mg/L mg/L mg/L mg/L mg/L mg/L mg/L mg/L mg/L mg/L mg/L mg/L mg/L mg/L mg/L<br />
6.1 7.2 6.9 5.5 5.7 5.0 4.6 5.2 4.7 5.7 5.1 5.5 6.8 14.5 8.6 5.3 5.8 5.6 4.4<br />
6.3 7.1 7.2 5.6 5.7 5.1 4.8 4.7 4.7 5.7 4.8 5.2 7.2 18.0 10.4 5.0 5.7 5.3 4.4<br />
6.0 7.3 7.0 5.8 5.0 4.9 4.8 4.6 5.2 5.9 4.8 4.9 6.6 15.1 9.2 5.0 5.3 5.3 4.4<br />
6.8 7.2 5.4 4.8 4.6 7.2 13.4 8.7 5.4 5.4 5.8 4.2<br />
6.2 4.6<br />
6.1 5.4 4.0<br />
5.4 5.4<br />
18-Jun-02 23-Aug-02 23-Oct-02 11-Feb-03 14-May-03 15-Jul-03 30-Sep-03 2-Dec-03 27-May-04 29-Aug-04 27-Oct-04 9-Dec-04 9-Feb-05 18-Apr-05 23-Jun-05 17-Aug-05 28-Sep-05 31-Oct-05 29-Nov-05 29-Dec-05<br />
TOC TOC TOC TOC TOC TOC TOC TOC TOC TOC TOC TOC TOC TOC TOC TOC TOC TOC TOC TOC<br />
mg/L mg/L mg/L mg/L mg/L mg/L mg/L mg/L mg/L mg/L mg/L mg/L mg/L mg/L mg/L mg/L mg/L mg/L mg/L mg/L<br />
5.6 7.3 7.1 5.5 4.6 4.8 4.2 4.6 5.5 5.9 5.0 6.2 10.8 6.0 5.7 4.9 4.3<br />
6.1 7.0 7.2 5.6 5.5 4.8 4.7 4.6 4.7 5.9 5.8 5.0 6.8 14.5 5.1 5.1 6.9 4.3<br />
6.0 7.1 3.5 5.5 4.8 4.3 5.3 4.5 4.5 5.6 5.6 5.6 6.1 13.7 5.8 5.2 5.5 4.4<br />
5.6 7.1 3.4 5.5 4.7 4.4 4.7 4.6 4.5 5.4 5.3 6.3 6.6 12.2 5.5 5.2 5.2 4.3<br />
4.4<br />
5.2<br />
7.0 6.2 5.8<br />
4.3<br />
Page 5 of 6
D.3-104<br />
Lake Merced<br />
South - Pistol<br />
Range<br />
Depth<br />
Ft<br />
Surf<br />
5<br />
6<br />
10<br />
12<br />
15<br />
16<br />
17<br />
18<br />
19<br />
20<br />
21<br />
21.5<br />
22<br />
Lake Merced<br />
South - Pump<br />
Station<br />
Depth<br />
Ft<br />
Surf<br />
5<br />
10<br />
12<br />
15<br />
16<br />
17<br />
18<br />
19<br />
20<br />
21<br />
22<br />
23.2<br />
23-Jan-06 01-Mar-06 26-Apr-06 14-Jun-06 24-Aug-06 25-Oct-06 20-Dec-06 29-Mar-07 26-Jun-07 20-Aug-07 27-Dec-07 28-Mar-08 10-Jun-08 24-Sep-08 4-Dec-08<br />
TOC TOC TOC TOC TOC TOC TOC TOC TOC TOC TOC TOC TOC TOC TOC<br />
mg/L mg/L mg/L mg/L mg/L mg/L mg/L mg/L mg/L mg/L mg/L mg/L mg/L mg/L mg/L<br />
5.1 4.8 4.7 7.93 12.3 7.2 5.9 6.2 9.9 8.1 9.5 8.3 9.25<br />
2.5 4.4 5.0 6.98 8.9 6.9 5.3 6.1 8.1 7.8 10.0 7.0 8.98<br />
2.5 4.2 5.2 8.22 8.8 6.8 7.2 6.1 18.6 7.0 9.0 8.9 9.16<br />
2.5 4.3 4.8 7.21 10.2 6.0 5.4 6.0 13.9 7.1 9.3 8.6 8.89<br />
4.9<br />
5.9<br />
5.1 5.3 7.6 5.6 9.14<br />
6.33 7.9 7.7 9.5<br />
8.7<br />
8.0<br />
23-Jan-06 01-Mar-06 26-Apr-06 14-Jun-06 24-Aug-06 25-Oct-06 20-Dec-06 29-Mar-07 26-Jun-07 20-Aug-07 27-Dec-07 28-Mar-08 10-Jun-08 24-Sep-08 4-Dec-08<br />
TOC TOC TOC TOC TOC TOC TOC TOC TOC TOC TOC TOC TOC TOC TOC<br />
mg/L mg/L mg/L mg/L mg/L mg/L mg/L mg/L mg/L mg/L mg/L mg/L mg/L mg/L mg/L<br />
2.5 4.2 4.7 8.38 8.6 7.3 7.3 7.1 10.0 10.6 8.0 9.3 8.56<br />
2.5 4.4 5.0 5.99 9.7 6.7 6.4 6.4 11.0 7.8 9.3 9.2 7.56<br />
2.5 4.3 5.2 6.59 11.0 6.3 5.4 6.4 7.4 8.4 8.2 7.1 8.56<br />
5.3 4.5 4.8 6.01 9.6 5.9 5.4 6.4 7.6 7.5 8.6 9.1 8.94<br />
4.9<br />
5.9<br />
4.7 6.68 7.6 7.6 7.9 7.37<br />
5.8 5.2 6.2 9.4<br />
7.5<br />
Page 6 of 6
Lake Merced<br />
North<br />
15-May-97 10-Sep-97 3-Dec-97 16-Mar-98 8-Jul-98 23-Sep-98 17-Mar-99 21-Jun-99 15-Sep-99 8-Dec-99 21-Mar-00 21-Jun-00 9-Aug-00 19-Dec-00 7-Mar-01 20-Jun-01 1-Oct-01 18-Dec-01 5-Mar-02 30-Apr-02<br />
Depth Fe Fe Fe Fe Fe Fe Fe Fe Fe Fe Fe Fe Fe Fe Fe Fe Fe Fe Fe Fe<br />
Ft mg/L mg/L mg/L mg/L mg/L mg/L mg/L mg/L mg/L mg/L mg/L mg/L mg/L mg/L mg/L mg/L mg/L mg/L mg/L mg/L<br />
Surf 0.02 0.03 0.03 0.04 0.03 0.06 0.07 0.09 0.005 0.005 0.05 0.005 0.005<br />
5<br />
10 0.04 0.05 0.04 0.03 0.07 0.08 0.07 0.005 0.005 0.06 0.005 0.005<br />
14<br />
15<br />
16<br />
17<br />
17.4<br />
17.5<br />
18 0.08<br />
18.8<br />
19<br />
20<br />
20.6<br />
D.3-105<br />
Lake Merced<br />
North East<br />
15-May-97 10-Sep-97 3-Dec-97 16-Mar-98 8-Jul-98 23-Sep-98 17-Mar-99 21-Jun-99 15-Sep-99 8-Dec-99 21-Mar-00 21-Jun-00 9-Aug-00 19-Dec-00 7-Mar-01 20-Jun-01 1-Oct-01 18-Dec-01 5-Mar-02 30-Apr-02<br />
Depth Fe Fe Fe Fe Fe Fe Fe Fe Fe Fe Fe Fe Fe Fe Fe Fe Fe Fe Fe Fe<br />
Ft mg/L mg/L mg/L mg/L mg/L mg/L mg/L mg/L mg/L mg/L mg/L mg/L mg/L mg/L mg/L mg/L mg/L mg/L mg/L mg/L<br />
Surf 0.04 0.05 0.05 0.06 0.05 0.07 0.10 0.08 0.005 0.005 0.04 0.005 0.005<br />
5<br />
9 0.005<br />
10 0.08 0.07 0.07 0.48 0.09 0.10 0.10 0.005 0.05 0.01 0.005<br />
11<br />
12<br />
13 0.17<br />
14<br />
14.1<br />
15<br />
15.8<br />
Page 1 of 6
D.3-106<br />
Lake Merced<br />
North<br />
Depth<br />
Ft<br />
Surf<br />
5<br />
10<br />
14<br />
15<br />
16<br />
17<br />
17.4<br />
17.5<br />
18<br />
18.8<br />
19<br />
20<br />
20.6<br />
Lake Merced<br />
North East<br />
Depth<br />
Ft<br />
Surf<br />
5<br />
9<br />
10<br />
11<br />
12<br />
13<br />
14<br />
14.1<br />
15<br />
15.8<br />
18-Jun-02 23-Aug-02 23-Oct-02 11-Feb-03 14-May-03 15-Jul-03 30-Sep-03 2-Dec-03 27-May-04 29-Aug-04 27-Oct-04 9-Dec-04 9-Feb-05 18-Apr-05 23-Jun-05 17-Aug-05 28-Sep-05 31-Oct-05 29-Nov-05 29-Dec-05 23-Jan-06<br />
Fe Fe Fe Fe Fe Fe Fe Fe Fe Fe Fe Fe Fe Fe Fe Fe Fe Fe Fe Fe Fe<br />
mg/L mg/L mg/L mg/L mg/L mg/L mg/L mg/L mg/L mg/L mg/L mg/L mg/L mg/L mg/L mg/L mg/L mg/L mg/L mg/L mg/L<br />
0.005 0.005 0.005 0.005 0.005 0.005 0.005 0.005 0.06 0.03 0.17 0.04 0.02 0.16 0.005 0.05 0.05 0.005 0.005 0.04 0.30<br />
0.005 0.005 0.02 0.005 0.005 0.005 0.005 0.06 0.15 0.18 0.02 0.08 0.005<br />
0.005 0.25<br />
0.06<br />
0.13 0.005 0.005 0.10<br />
18-Jun-02 23-Aug-02 23-Oct-02 11-Feb-03 14-May-03 15-Jul-03 30-Sep-03 2-Dec-03 27-May-04 29-Aug-04 27-Oct-04 9-Dec-04 9-Feb-05 18-Apr-05 23-Jun-05 17-Aug-05 28-Sep-05 31-Oct-05 29-Nov-05 29-Dec-05 23-Jan-06<br />
Fe Fe Fe Fe Fe Fe Fe Fe Fe Fe Fe Fe Fe Fe Fe Fe Fe Fe Fe Fe Fe<br />
mg/L mg/L mg/L mg/L mg/L mg/L mg/L mg/L mg/L mg/L mg/L mg/L mg/L mg/L mg/L mg/L mg/L mg/L mg/L mg/L mg/L<br />
0.005 0.005 0.005 0.005 0.005 0.005 0.005 0.005 0.01 0.005 0.19 0.04 0.07 0.03 0.005 0.03 0.07 0.005 0.03 0.04 0.10<br />
0.005 0.01 0.005 0.01 0.005 0.005 0.005 0.005 0.01 0.20 0.04 0.08 0.02 0.14 0.07<br />
0.005<br />
0.02 0.07 0.005 0.02 0.20<br />
0.04<br />
Page 2 of 6
D.3-107<br />
Lake Merced<br />
North<br />
Depth<br />
Ft<br />
Surf<br />
5<br />
10<br />
14<br />
15<br />
16<br />
17<br />
17.4<br />
17.5<br />
18<br />
18.8<br />
19<br />
20<br />
20.6<br />
Lake Merced<br />
North East<br />
Depth<br />
Ft<br />
Surf<br />
5<br />
9<br />
10<br />
11<br />
12<br />
13<br />
14<br />
14.1<br />
15<br />
15.8<br />
01-Mar-06 26-Apr-06 14-Jun-06 24-Aug-06 25-Oct-06 20-Dec-06 29-Mar-07 26-Jun-07 20-Aug-07 27-Dec-07 28-Mar-08 10-Jun-08 24-Sep-08 4-Dec-08<br />
Fe Fe Fe Fe Fe Fe Fe Fe Fe Fe Fe Fe Fe Fe<br />
mg/L mg/L mg/L mg/L mg/L mg/L mg/L mg/L mg/L mg/L mg/L mg/L mg/L mg/L<br />
0.02 0.005 0.10 0.005 0.005 0.005 0.005 0.005 0.02 0.07 0.04 0.02<br />
0.005 0.04<br />
0.02 0.005 0.04 0.005 0.005 0.03 0.005 0.09<br />
01-Mar-06 26-Apr-06 14-Jun-06 24-Aug-06 25-Oct-06 20-Dec-06 29-Mar-07 26-Jun-07 20-Aug-07 27-Dec-07 28-Mar-08 10-Jun-08 24-Sep-08 4-Dec-08<br />
Fe Fe Fe Fe Fe Fe Fe Fe Fe Fe Fe Fe Fe Fe<br />
mg/L mg/L mg/L mg/L mg/L mg/L mg/L mg/L mg/L mg/L mg/L mg/L mg/L mg/L<br />
0.02 0.005 0.03 0.01 0.05 0.07 0.05 0.005 0.03 0.13 0.11 0.05<br />
0.005 0.04<br />
0.04 0.03 0.02 0.03<br />
0.005 0.05 0.04 0.005 0.19<br />
0.07<br />
0.09<br />
0.08<br />
Page 3 of 6
Lake Merced<br />
South - Pistol<br />
Range<br />
15-May-97 10-Sep-97 3-Dec-97 16-Mar-98 8-Jul-98 23-Sep-98 17-Mar-99 21-Jun-99 15-Sep-99 8-Dec-99 21-Mar-00 21-Jun-00 9-Aug-00 19-Dec-00 7-Mar-01 20-Jun-01 1-Oct-01 18-Dec-01 5-Mar-02 30-Apr-02<br />
Depth Fe Fe Fe Fe Fe Fe Fe Fe Fe Fe Fe Fe Fe Fe Fe Fe Fe Fe Fe Fe<br />
Ft mg/L mg/L mg/L mg/L mg/L mg/L mg/L mg/L mg/L mg/L mg/L mg/L mg/L mg/L mg/L mg/L mg/L mg/L mg/L mg/L<br />
Surf 0.02 0.01 0.05 0.05 0.05 0.01 0.05 0.07 0.06 0.005 0.005 0.02 0.005 0.005<br />
5<br />
6<br />
10 0.03 0.02 0.14 0.05 0.02 0.08 0.08 0.08 0.005 0.005 0.04 0.005 0.02<br />
12<br />
15<br />
16<br />
17<br />
18<br />
19<br />
20 0.14<br />
21<br />
21.5<br />
22<br />
D.3-108<br />
Lake Merced<br />
South - Pump<br />
Station<br />
15-May-97 10-Sep-97 3-Dec-97 16-Mar-98 8-Jul-98 23-Sep-98 17-Mar-99 21-Jun-99 15-Sep-99 8-Dec-99 21-Mar-00 21-Jun-00 9-Aug-00 19-Dec-00 7-Mar-01 20-Jun-01 1-Oct-01 18-Dec-01 5-Mar-02 30-Apr-02<br />
Depth Fe Fe Fe Fe Fe Fe Fe Fe Fe Fe Fe Fe Fe Fe Fe Fe Fe Fe Fe Fe<br />
Ft mg/L mg/L mg/L mg/L mg/L mg/L mg/L mg/L mg/L mg/L mg/L mg/L mg/L mg/L mg/L mg/L mg/L mg/L mg/L mg/L<br />
Surf 0.02 0.01 0.02 0.14 0.07 0.02 0.05 0.07 0.07 0.005 0.005 0.01 0.005 0.005<br />
5<br />
10 0.03 0.01 0.04 0.07 0.02 0.05 0.09 0.07 0.11 0.005 0.08 0.005 0.005<br />
12<br />
15<br />
16<br />
17<br />
18<br />
19<br />
20 0.06<br />
21<br />
22<br />
23.2<br />
Note: Bold, italicized formats indicate half the reported value for statistical purposes.<br />
Page 4 of 6
D.3-109<br />
Lake Merced<br />
South - Pistol<br />
Range<br />
Depth<br />
Ft<br />
Surf<br />
5<br />
6<br />
10<br />
12<br />
15<br />
16<br />
17<br />
18<br />
19<br />
20<br />
21<br />
21.5<br />
22<br />
Lake Merced<br />
South - Pump<br />
Station<br />
Depth<br />
Ft<br />
Surf<br />
5<br />
10<br />
12<br />
15<br />
16<br />
17<br />
18<br />
19<br />
20<br />
21<br />
22<br />
23.2<br />
18-Jun-02 23-Aug-02 23-Oct-02 11-Feb-03 14-May-03 15-Jul-03 30-Sep-03 2-Dec-03 27-May-04 29-Aug-04 27-Oct-04 9-Dec-04 9-Feb-05 18-Apr-05 23-Jun-05 17-Aug-05 28-Sep-05 31-Oct-05 29-Nov-05 29-Dec-05 23-Jan-06<br />
Fe Fe Fe Fe Fe Fe Fe Fe Fe Fe Fe Fe Fe Fe Fe Fe Fe Fe Fe Fe Fe<br />
mg/L mg/L mg/L mg/L mg/L mg/L mg/L mg/L mg/L mg/L mg/L mg/L mg/L mg/L mg/L mg/L mg/L mg/L mg/L mg/L mg/L<br />
0.005 0.005 0.005 0.01 0.005 0.005 0.005 0.005 0.005 0.005 0.005 0.005 0.005 0.005 0.005 0.01 0.05 0.005 0.005 0.01 0.03<br />
0.005 0.005 0.005 0.005 0.005 0.005 0.005 0.005 0.005 0.03 0.01 0.07 0.005<br />
0.02 0.005<br />
0.01<br />
0.005 0.005 0.07<br />
0.01<br />
0.005<br />
18-Jun-02 23-Aug-02 23-Oct-02 11-Feb-03 14-May-03 15-Jul-03 30-Sep-03 2-Dec-03 27-May-04 29-Aug-04 27-Oct-04 9-Dec-04 9-Feb-05 18-Apr-05 23-Jun-05 17-Aug-05 28-Sep-05 31-Oct-05 29-Nov-05 29-Dec-05 23-Jan-06<br />
Fe Fe Fe Fe Fe Fe Fe Fe Fe Fe Fe Fe Fe Fe Fe Fe Fe Fe Fe Fe Fe<br />
mg/L mg/L mg/L mg/L mg/L mg/L mg/L mg/L mg/L mg/L mg/L mg/L mg/L mg/L mg/L mg/L mg/L mg/L mg/L mg/L mg/L<br />
0.005 0.005 0.005 0.005 0.005 0.005 0.005 0.005 0.005 0.005 0.005 0.005 0.005 0.005 0.005 0.01 0.05 0.005 0.005 0.005 0.005<br />
0.005 0.005 0.005 0.005 0.005 0.005 0.005 0.005 0.01 0.06 0.005 0.04 0.005<br />
0.005 0.005<br />
0.005 0.01<br />
0.005 0.005 0.005 0.07<br />
Page 5 of 6
Lake Merced<br />
South - Pistol<br />
Range<br />
Depth<br />
Ft<br />
Surf<br />
5<br />
6<br />
10<br />
12<br />
15<br />
16<br />
17<br />
18<br />
19<br />
20<br />
21<br />
21.5<br />
22<br />
01-Mar-06 26-Apr-06 14-Jun-06 24-Aug-06 25-Oct-06 20-Dec-06 29-Mar-07 26-Jun-07 20-Aug-07 27-Dec-07 28-Mar-08 10-Jun-08 24-Sep-08 4-Dec-08<br />
Fe Fe Fe Fe Fe Fe Fe Fe Fe Fe Fe Fe Fe Fe<br />
mg/L mg/L mg/L mg/L mg/L mg/L mg/L mg/L mg/L mg/L mg/L mg/L mg/L mg/L<br />
0.01 0.005 0.03 0.005 0.005 0.04 0.02 0.005 0.01 0.02 0.03 0.005<br />
0.005<br />
0.005 0.005 0.01 0.05 0.01<br />
0.05 0.005 0.01 0.03<br />
0.03<br />
0.005<br />
D.3-110<br />
Lake Merced<br />
South - Pump<br />
Station<br />
Depth<br />
Ft<br />
Surf<br />
5<br />
10<br />
12<br />
15<br />
16<br />
17<br />
18<br />
19<br />
20<br />
21<br />
22<br />
23.2<br />
01-Mar-06 26-Apr-06 14-Jun-06 24-Aug-06 25-Oct-06 20-Dec-06 29-Mar-07 26-Jun-07 20-Aug-07 27-Dec-07 28-Mar-08 10-Jun-08 24-Sep-08 4-Dec-08<br />
Fe Fe Fe Fe Fe Fe Fe Fe Fe Fe Fe Fe Fe Fe<br />
mg/L mg/L mg/L mg/L mg/L mg/L mg/L mg/L mg/L mg/L mg/L mg/L mg/L mg/L<br />
0.005 0.005 0.11 0.01 0.08 0.05 0.01 0.005 0.01 0.04 0.05 0.06<br />
0.005<br />
0.005 0.11 0.02 0.01 0.06 0.03<br />
0.07 0.04 0.005<br />
0.04<br />
Page 6 of 6
Lake Merced<br />
North<br />
15-May-97 10-Sep-97 3-Dec-97 16-Mar-98 8-Jul-98 23-Sep-98 17-Mar-99 21-Jun-99 15-Sep-99 8-Dec-99 21-Mar-00 21-Jun-00 9-Aug-00 19-Dec-00 7-Mar-01 20-Jun-01 1-Oct-01 18-Dec-01 5-Mar-02 30-Apr-02<br />
Depth Mn Mn Mn Mn Mn Mn Mn Mn Mn Mn Mn Mn Mn Mn Mn Mn Mn Mn Mn Mn<br />
Ft mg/L mg/L mg/L mg/L mg/L mg/L mg/L mg/L mg/L mg/L mg/L mg/L mg/L mg/L mg/L mg/L mg/L mg/L mg/L mg/L<br />
Surf 0.07 0.15 0.10 0.25 0.20 0.13 0.10 0.05 0.13 0.14 0.08 0.09 0.10<br />
5<br />
10 0.07 0.17 0.10 0.19 0.13 0.11 0.06 0.13 0.13 0.08 0.12 0.10<br />
14<br />
15<br />
16<br />
17<br />
17.4<br />
17.5<br />
17.8<br />
18 0.33<br />
18.8<br />
19<br />
19.3<br />
19.9<br />
20<br />
20.6<br />
D.3-111<br />
Lake Merced<br />
North East<br />
15-May-97 10-Sep-97 3-Dec-97 16-Mar-98 8-Jul-98 23-Sep-98 17-Mar-99 21-Jun-99 15-Sep-99 8-Dec-99 21-Mar-00 21-Jun-00 9-Aug-00 19-Dec-00 7-Mar-01 20-Jun-01 1-Oct-01 18-Dec-01 5-Mar-02 30-Apr-02<br />
Depth Mn Mn Mn Mn Mn Mn Mn Mn Mn Mn Mn Mn Mn Mn Mn Mn Mn Mn Mn Mn<br />
Ft mg/L mg/L mg/L mg/L mg/L mg/L mg/L mg/L mg/L mg/L mg/L mg/L mg/L mg/L mg/L mg/L mg/L mg/L mg/L mg/L<br />
Surf 0.10 0.13 0.11 0.24 0.26 0.16 0.09 0.05 0.11 0.14 0.07 0.09 0.10<br />
5<br />
9 0.26<br />
10 0.11 0.13 0.12 0.33 0.16 0.10 0.06 0.18 0.07 0.10 0.12<br />
11<br />
12<br />
13 0.19<br />
13.8<br />
14<br />
14.1<br />
14.7<br />
15<br />
15.8<br />
Page 1 of 6
D.3-112<br />
Lake Merced<br />
North<br />
Depth<br />
Ft<br />
Surf<br />
5<br />
10<br />
14<br />
15<br />
16<br />
17<br />
17.4<br />
17.5<br />
17.8<br />
18<br />
18.8<br />
19<br />
19.3<br />
19.9<br />
20<br />
20.6<br />
Lake Merced<br />
North East<br />
Depth<br />
Ft<br />
Surf<br />
5<br />
9<br />
10<br />
11<br />
12<br />
13<br />
13.8<br />
14<br />
14.1<br />
14.7<br />
15<br />
15.8<br />
18-Jun-02 23-Aug-02 23-Oct-02 11-Feb-03 14-May-03 15-Jul-03 30-Sep-03 2-Dec-03 27-May-04 29-Aug-04 27-Oct-04 9-Dec-04 9-Feb-05 18-Apr-05 23-Jun-05 17-Aug-05 28-Sep-05 31-Oct-05 29-Nov-05 29-Dec-05 23-Jan-06<br />
Mn Mn Mn Mn Mn Mn Mn Mn Mn Mn Mn Mn Mn Mn Mn Mn Mn Mn Mn Mn Mn<br />
mg/L mg/L mg/L mg/L mg/L mg/L mg/L mg/L mg/L mg/L mg/L mg/L mg/L mg/L mg/L mg/L mg/L mg/L mg/L mg/L mg/L<br />
0.11 0.005 0.11 0.05 0.08 0.09 0.22 0.08 0.23 0.18 0.17 0.04 0.04 0.03 0.06 0.18 0.07 0.16 0.08 0.07 0.05<br />
0.11 0.005 0.12 0.09 0.12 0.21 0.08 0.24 0.04 0.03 0.17 0.12 0.17<br />
0.05 0.19<br />
0.21<br />
0.08 0.09 0.07 0.05<br />
18-Jun-02 23-Aug-02 23-Oct-02 11-Feb-03 14-May-03 15-Jul-03 30-Sep-03 2-Dec-03 27-May-04 29-Aug-04 27-Oct-04 9-Dec-04 9-Feb-05 18-Apr-05 23-Jun-05 17-Aug-05 28-Sep-05 31-Oct-05 29-Nov-05 29-Dec-05 23-Jan-06<br />
Mn Mn Mn Mn Mn Mn Mn Mn Mn Mn Mn Mn Mn Mn Mn Mn Mn Mn Mn Mn Mn<br />
mg/L mg/L mg/L mg/L mg/L mg/L mg/L mg/L mg/L mg/L mg/L mg/L mg/L mg/L mg/L mg/L mg/L mg/L mg/L mg/L mg/L<br />
0.13 0.18 0.11 0.08 0.15 0.15 0.17 0.12 0.14 0.16 0.12 0.05 0.07 0.12 0.11 0.21 0.11 0.15 0.07 0.13 0.08<br />
0.14 0.20 0.09 0.08 0.17 0.27 0.19 0.11 0.17 0.12 0.06 0.09 0.21 0.17 0.10<br />
0.57<br />
0.20 0.07 0.28 0.08 0.09<br />
0.16<br />
Page 2 of 6
D.3-113<br />
Lake Merced<br />
North<br />
Depth<br />
Ft<br />
Surf<br />
5<br />
10<br />
14<br />
15<br />
16<br />
17<br />
17.4<br />
17.5<br />
17.8<br />
18<br />
18.8<br />
19<br />
19.3<br />
19.9<br />
20<br />
20.6<br />
Lake Merced<br />
North East<br />
Depth<br />
Ft<br />
Surf<br />
5<br />
9<br />
10<br />
11<br />
12<br />
13<br />
13.8<br />
14<br />
14.1<br />
14.7<br />
15<br />
15.8<br />
01-Mar-06 26-Apr-06 14-Jun-06 24-Aug-06 25-Oct-06 20-Dec-06 29-Mar-07 26-Jun-07 20-Aug-07 27-Dec-07 28-Mar-08 10-Jun-08 24-Sep-08 4-Dec-08 24-Mar-09 4-Jun-09 22-Sep-09 15-Dec-09<br />
Mn Mn Mn Mn Mn Mn Mn Mn Mn Mn Mn Mn Mn Mn Mn Mn Mn Mn<br />
mg/L mg/L mg/L mg/L mg/L mg/L mg/L mg/L mg/L mg/L mg/L mg/L mg/L mg/L mg/L mg/L mg/L mg/L<br />
0.04 0.07 0.17 0.20 0.29 0.08 0.22 0.13 0.06 0.07 0.14 0.07 0.09 0.145 0.02 0.13 0.085 0.07<br />
0.36 0.34<br />
0.05 0.25 0.28 0.21 0.08 0.31 0.49 0.07<br />
0.005<br />
0.39<br />
0.171<br />
0.06 0.09<br />
01-Mar-06 26-Apr-06 14-Jun-06 24-Aug-06 25-Oct-06 20-Dec-06 29-Mar-07 26-Jun-07 20-Aug-07 27-Dec-07 28-Mar-08 10-Jun-08 24-Sep-08 4-Dec-08 24-Mar-09 4-Jun-09 22-Sep-09 15-Dec-09<br />
Mn Mn Mn Mn Mn Mn Mn Mn Mn Mn Mn Mn Mn Mn Mn Mn Mn Mn<br />
mg/L mg/L mg/L mg/L mg/L mg/L mg/L mg/L mg/L mg/L mg/L mg/L mg/L mg/L mg/L mg/L mg/L mg/L<br />
0.09 0.23 0.14 0.18 0.23 0.11 0.16 0.15 0.07 0.09 0.005 0.10 0.10 0.130 0.1 0.07 0.09<br />
0.18 0.12<br />
0.11 0.15 0.20 0.12<br />
0.138<br />
0.09 0.07<br />
0.24 0.12 0.19 0.25 0.09 0.1<br />
0.005<br />
0.1<br />
0.18<br />
Page 3 of 6
Lake Merced<br />
South - Pistol<br />
Range<br />
15-May-97 10-Sep-97 3-Dec-97 16-Mar-98 8-Jul-98 23-Sep-98 17-Mar-99 21-Jun-99 15-Sep-99 8-Dec-99 21-Mar-00 21-Jun-00 9-Aug-00 19-Dec-00 7-Mar-01 20-Jun-01 1-Oct-01 18-Dec-01 5-Mar-02 30-Apr-02<br />
Depth Mn Mn Mn Mn Mn Mn Mn Mn Mn Mn Mn Mn Mn Mn Mn Mn Mn Mn Mn Mn<br />
Ft mg/L mg/L mg/L mg/L mg/L mg/L mg/L mg/L mg/L mg/L mg/L mg/L mg/L mg/L mg/L mg/L mg/L mg/L mg/L mg/L<br />
Surf 0.03 0.05 0.11 0.05 0.12 0.10 0.11 0.06 0.02 0.03 0.04 0.04 0.03 0.04<br />
5<br />
6<br />
10 0.04 0.05 0.13 0.07 0.13 0.12 0.06 0.02 0.03 0.04 0.05 0.03 0.04<br />
12<br />
15<br />
16<br />
17<br />
18<br />
18.2<br />
18.5<br />
18.9<br />
19<br />
20 0.11<br />
20.1<br />
20.6<br />
20.8<br />
21<br />
21.5<br />
22<br />
D.3-114<br />
Lake Merced<br />
South - Pump<br />
Station<br />
15-May-97 10-Sep-97 3-Dec-97 16-Mar-98 8-Jul-98 23-Sep-98 17-Mar-99 21-Jun-99 15-Sep-99 8-Dec-99 21-Mar-00 21-Jun-00 9-Aug-00 19-Dec-00 7-Mar-01 20-Jun-01 1-Oct-01 18-Dec-01 5-Mar-02 30-Apr-02<br />
Depth Mn Mn Mn Mn Mn Mn Mn Mn Mn Mn Mn Mn Mn Mn Mn Mn Mn Mn Mn Mn<br />
Ft mg/L mg/L mg/L mg/L mg/L mg/L mg/L mg/L mg/L mg/L mg/L mg/L mg/L mg/L mg/L mg/L mg/L mg/L mg/L mg/L<br />
Surf 0.03 0.05 0.11 0.08 0.13 0.09 0.10 0.06 0.02 0.03 0.04 0.04 0.03 0.04<br />
5<br />
10 0.03 0.05 0.11 0.09 0.10 0.10 0.06 0.02 0.04 0.05 0.05 0.03 0.04<br />
12<br />
15<br />
16<br />
17<br />
18<br />
19<br />
19.2<br />
20 0.13<br />
20.4<br />
20.9<br />
21<br />
21.5<br />
22<br />
22.8<br />
23.2<br />
Note: Bold, italicized formats indicate half the reported value for statistical purposes.<br />
Page 4 of 6
D.3-115<br />
Lake Merced<br />
South - Pistol<br />
Range<br />
Depth<br />
Ft<br />
Surf<br />
5<br />
6<br />
10<br />
12<br />
15<br />
16<br />
17<br />
18<br />
18.2<br />
18.5<br />
18.9<br />
19<br />
20<br />
20.1<br />
20.6<br />
20.8<br />
21<br />
21.5<br />
22<br />
Lake Merced<br />
South - Pump<br />
Station<br />
Depth<br />
Ft<br />
Surf<br />
5<br />
10<br />
12<br />
15<br />
16<br />
17<br />
18<br />
19<br />
19.2<br />
20<br />
20.4<br />
20.9<br />
21<br />
21.5<br />
22<br />
22.8<br />
23.2<br />
18-Jun-02 23-Aug-02 23-Oct-02 11-Feb-03 14-May-03 15-Jul-03 30-Sep-03 2-Dec-03 27-May-04 29-Aug-04 27-Oct-04 9-Dec-04 9-Feb-05 18-Apr-05 23-Jun-05 17-Aug-05 28-Sep-05 31-Oct-05 29-Nov-05 29-Dec-05 23-Jan-06<br />
Mn Mn Mn Mn Mn Mn Mn Mn Mn Mn Mn Mn Mn Mn Mn Mn Mn Mn Mn Mn Mn<br />
mg/L mg/L mg/L mg/L mg/L mg/L mg/L mg/L mg/L mg/L mg/L mg/L mg/L mg/L mg/L mg/L mg/L mg/L mg/L mg/L mg/L<br />
0.05 0.14 0.10 0.05 0.04 0.06 0.12 0.04 0.04 0.03 0.07 0.02 0.03 0.02 0.03 0.08 0.03 0.04 0.04 0.04 0.04<br />
0.05 0.08 0.10 0.03 0.05 0.12 0.04 0.04 0.02 0.01 0.08 0.07 0.04<br />
0.05 0.07<br />
0.03<br />
0.05 0.04 0.04<br />
18-Jun-02 23-Aug-02 23-Oct-02 11-Feb-03 14-May-03 15-Jul-03 30-Sep-03 2-Dec-03 27-May-04 29-Aug-04 27-Oct-04 9-Dec-04 9-Feb-05 18-Apr-05 23-Jun-05 17-Aug-05 28-Sep-05 31-Oct-05 29-Nov-05 29-Dec-05 23-Jan-06<br />
Mn Mn Mn Mn Mn Mn Mn Mn Mn Mn Mn Mn Mn Mn Mn Mn Mn Mn Mn Mn Mn<br />
mg/L mg/L mg/L mg/L mg/L mg/L mg/L mg/L mg/L mg/L mg/L mg/L mg/L mg/L mg/L mg/L mg/L mg/L mg/L mg/L mg/L<br />
0.04 0.07 0.07 0.05 0.03 0.05 0.11 0.04 0.03 0.03 0.07 0.02 0.03 0.02 0.04 0.08 0.03 0.04 0.04 0.03 0.03<br />
0.04 0.08 0.08 0.04 0.06 0.12 0.04 0.03 0.03 0.02 0.08 0.06 0.04<br />
0.05 0.08<br />
0.06 0.03<br />
0.14<br />
0.04<br />
0.18 0.04 0.03 0.03<br />
Page 5 of 6
Lake Merced<br />
South - Pistol<br />
Range<br />
Depth<br />
Ft<br />
Surf<br />
5<br />
6<br />
10<br />
12<br />
15<br />
16<br />
17<br />
18<br />
18.2<br />
18.5<br />
18.9<br />
19<br />
20<br />
20.1<br />
20.6<br />
20.8<br />
21<br />
21.5<br />
22<br />
01-Mar-06 26-Apr-06 14-Jun-06 24-Aug-06 25-Oct-06 20-Dec-06 29-Mar-07 26-Jun-07 20-Aug-07 27-Dec-07 28-Mar-08 10-Jun-08 24-Sep-08 4-Dec-08 24-Mar-09 4-Jun-09 22-Sep-09 15-Dec-09<br />
Mn Mn Mn Mn Mn Mn Mn Mn Mn Mn Mn Mn Mn Mn Mn Mn Mn Mn<br />
mg/L mg/L mg/L mg/L mg/L mg/L mg/L mg/L mg/L mg/L mg/L mg/L mg/L mg/L mg/L mg/L mg/L mg/L<br />
0.04 0.04 0.07 0.17 0.10 0.04 0.05 0.05 0.02 0.02 0.31 0.02 0.07 0.034 0.01 0.11 0.054 0.03<br />
0.11<br />
0.03 0.04 0.19 0.04 0.01<br />
0.10 0.04 0.03 0.02<br />
0.06<br />
0.02<br />
0.15<br />
0.061<br />
0.01<br />
0.04<br />
0.03<br />
D.3-116<br />
Lake Merced<br />
South - Pump<br />
Station<br />
Depth<br />
Ft<br />
Surf<br />
5<br />
10<br />
12<br />
15<br />
16<br />
17<br />
18<br />
19<br />
19.2<br />
20<br />
20.4<br />
20.9<br />
21<br />
21.5<br />
22<br />
22.8<br />
23.2<br />
01-Mar-06 26-Apr-06 14-Jun-06 24-Aug-06 25-Oct-06 20-Dec-06 29-Mar-07 26-Jun-07 20-Aug-07 27-Dec-07 28-Mar-08 10-Jun-08 24-Sep-08 4-Dec-08 24-Mar-09 4-Jun-09 22-Sep-09 15-Dec-09<br />
Mn Mn Mn Mn Mn Mn Mn Mn Mn Mn Mn Mn Mn Mn Mn Mn Mn Mn<br />
mg/L mg/L mg/L mg/L mg/L mg/L mg/L mg/L mg/L mg/L mg/L mg/L mg/L mg/L mg/L mg/L mg/L mg/L<br />
0.03 0.03 0.07 0.18 0.13 0.04 0.03 0.06 0.01 0.02 0.03 0.03 0.08 0.046 0.01 0.03 0.051 0.03<br />
0.30<br />
0.03 0.09 0.20 0.02 0.02 0.04 0.14<br />
0.04 0.05 0.05<br />
0.02<br />
0.040<br />
0.05<br />
0.06<br />
0.03<br />
Page 6 of 6
Lake Merced<br />
North<br />
15-May-97 10-Sep-97 3-Dec-97 16-Mar-98 8-Jul-98 23-Sep-98 17-Mar-99 21-Jun-99 15-Sep-99 8-Dec-99 21-Mar-00 21-Jun-00 9-Aug-00 19-Dec-00 7-Mar-01 20-Jun-01 1-Oct-01 18-Dec-01 5-Mar-02 30-Apr-02<br />
Depth MTBE MTBE MTBE MTBE MTBE MTBE MTBE MTBE MTBE MTBE MTBE MTBE MTBE MTBE MTBE MTBE MTBE MTBE MTBE MTBE<br />
Ft ug/L ug/L ug/L ug/L ug/L ug/L ug/L ug/L ug/L ug/L ug/L ug/L ug/L ug/L ug/L ug/L ug/L ug/L ug/L ug/L<br />
Surf 0.6 0.25 0.25 0.25 0.25 0.25 0.25 0.25 0.25 0.25 0.25 0.50 0.25 2.1 0.025 0.25 0.25<br />
5 0.7 0.25 0.25<br />
10 0.25 0.25 0.25 0.25 0.25 0.25 0.25 0.25 0.25 0.25 0.25 0.50 0.25 1.9 0.025 0.25 0.25<br />
14<br />
15 0.25 0.25 0.25<br />
16<br />
Lake Merced<br />
North East<br />
15-May-97 10-Sep-97 3-Dec-97 16-Mar-98 8-Jul-98 23-Sep-98 17-Mar-99 21-Jun-99 15-Sep-99 8-Dec-99 21-Mar-00 21-Jun-00 9-Aug-00 19-Dec-00 7-Mar-01 20-Jun-01 1-Oct-01 18-Dec-01 5-Mar-02 30-Apr-02<br />
Depth MTBE MTBE MTBE MTBE MTBE MTBE MTBE MTBE MTBE MTBE MTBE MTBE MTBE MTBE MTBE MTBE MTBE MTBE MTBE MTBE<br />
Ft ug/L ug/L ug/L ug/L ug/L ug/L ug/L ug/L ug/L ug/L ug/L ug/L ug/L ug/L ug/L ug/L ug/L ug/L ug/L ug/L<br />
Surf 0.25 0.25 0.25 0.25 0.25 0.25 0.25 0.25 0.25 0.25 0.60 0.25 0.25 0.025 0.25 0.25<br />
5 0.25 0.25<br />
9 0.25<br />
10 0.25 0.25 0.25 0.25 0.25 0.25 0.25 0.25 0.25 0.25 0.50 0.25 0.025 0.25 0.25<br />
15<br />
16<br />
D.3-117<br />
Lake Merced<br />
South - Pistol<br />
Range<br />
15-May-97 10-Sep-97 3-Dec-97 16-Mar-98 8-Jul-98 23-Sep-98 17-Mar-99 21-Jun-99 15-Sep-99 8-Dec-99 21-Mar-00 21-Jun-00 9-Aug-00 19-Dec-00 7-Mar-01 20-Jun-01 1-Oct-01 18-Dec-01 5-Mar-02 30-Apr-02<br />
Depth MTBE MTBE MTBE MTBE MTBE MTBE MTBE MTBE MTBE MTBE MTBE MTBE MTBE MTBE MTBE MTBE MTBE MTBE MTBE MTBE<br />
Ft ug/L ug/L ug/L ug/L ug/L ug/L ug/L ug/L ug/L ug/L ug/L ug/L ug/L ug/L ug/L ug/L ug/L ug/L ug/L ug/L<br />
Surf 0.7 0.25 0.6 1.9 0.25 0.25 0.25 0.25 0.25 0.25 0.25 0.70 0.25 0.25 0.025 0.9 0.25<br />
5 0.8 0.25 0.6<br />
6<br />
10 0.7 0.25 0.6 2.0 0.25 0.25 0.25 0.25 0.25 0.25 0.25 0.70 0.25 0.25 0.025 0.8 0.25<br />
15 0.9 0.25 0.6<br />
16 0.8 0.25<br />
Lake Merced<br />
South -<br />
Pump Station<br />
15-May-97 10-Sep-97 3-Dec-97 16-Mar-98 8-Jul-98 23-Sep-98 17-Mar-99 21-Jun-99 15-Sep-99 8-Dec-99 21-Mar-00 21-Jun-00 9-Aug-00 19-Dec-00 7-Mar-01 20-Jun-01 1-Oct-01 18-Dec-01 5-Mar-02 30-Apr-02<br />
Depth MTBE MTBE MTBE MTBE MTBE MTBE MTBE MTBE MTBE MTBE MTBE MTBE MTBE MTBE MTBE MTBE MTBE MTBE MTBE MTBE<br />
Ft ug/L ug/L ug/L ug/L ug/L ug/L ug/L ug/L ug/L ug/L ug/L ug/L ug/L ug/L ug/L ug/L ug/L ug/L ug/L ug/L<br />
Surf 0.7 0.25 0.5 1.9 0.25 0.25 0.25 0.25 0.25 0.25 0.25 0.68 0.25 0.25 0.025 0.8 0.25<br />
5 0.7 0.25 0.6<br />
10 0.7 0.25 0.6 1.9 0.25 0.25 0.25 0.25 0.25 0.25 0.25 0.68 0.25 0.25 0.025 0.8 0.25<br />
15 0.8 0.25 0.6<br />
Note: Bold, italicized formats indicate half the reported value for statistical purposes.<br />
Page 1 of 3
Lake Merced<br />
North<br />
Depth<br />
Ft<br />
Surf<br />
5<br />
10<br />
14<br />
15<br />
16<br />
Lake Merced<br />
North East<br />
Depth<br />
Ft<br />
Surf<br />
5<br />
9<br />
10<br />
15<br />
16<br />
18-Jun-02 23-Aug-02 23-Oct-02 11-Feb-03 14-May-03 15-Jul-03 30-Sep-03 2-Dec-03 27-May-04 29-Aug-04 27-Oct-04 9-Dec-04 9-Feb-05 18-Apr-05 23-Jun-05 17-Aug-05 28-Sep-05 31-Oct-05 29-Nov-05 29-Dec-05 23-Jan-06<br />
MTBE MTBE MTBE MTBE MTBE MTBE MTBE MTBE MTBE MTBE MTBE MTBE MTBE MTBE MTBE MTBE MTBE MTBE MTBE MTBE MTBE<br />
ug/L ug/L ug/L ug/L ug/L ug/L ug/L ug/L ug/L ug/L ug/L ug/L ug/L ug/L ug/L ug/L ug/L ug/L ug/L ug/L ug/L<br />
0.25 0.25 0.25 0.5 0.25 0.25 0.25 0.25 0.25 0.25 0.25 0.25 0.25 0.25 0.25 0.25 0.25 0.25 0.25 0.25 0.25<br />
0.25 0.25 0.25 0.5 0.25 0.25 0.25 0.25<br />
0.25 0.25 0.25 0.25 0.25 0.25 0.25 0.25 0.25 0.25 0.25 0.25 0.25<br />
18-Jun-02 23-Aug-02 23-Oct-02 11-Feb-03 14-May-03 15-Jul-03 30-Sep-03 2-Dec-03 27-May-04 29-Aug-04 27-Oct-04 9-Dec-04 9-Feb-05 18-Apr-05 23-Jun-05 17-Aug-05 28-Sep-05 31-Oct-05 29-Nov-05 29-Dec-05 23-Jan-06<br />
MTBE MTBE MTBE MTBE MTBE MTBE MTBE MTBE MTBE MTBE MTBE MTBE MTBE MTBE MTBE MTBE MTBE MTBE MTBE MTBE MTBE<br />
ug/L ug/L ug/L ug/L ug/L ug/L ug/L ug/L ug/L ug/L ug/L ug/L ug/L ug/L ug/L ug/L ug/L ug/L ug/L ug/L ug/L<br />
0.25 0.25 0.25 0.5 0.25 0.25 0.25 0.25 0.25 0.25 0.25 0.25 0.25 0.25 0.25 0.25 0.25 0.25 0.25 0.25 0.25<br />
0.25 0.25 0.25 0.5 0.25 0.25 0.25 0.25 0.25 0.25 0.25 0.25 0.25 0.25 0.25 0.25 0.25 0.25 0.25 0.25 0.25<br />
D.3-118<br />
Lake Merced<br />
South - Pistol<br />
Range<br />
Depth<br />
Ft<br />
Surf<br />
5<br />
6<br />
10<br />
15<br />
16<br />
18-Jun-02 23-Aug-02 23-Oct-02 11-Feb-03 14-May-03 15-Jul-03 30-Sep-03 2-Dec-03 27-May-04 29-Aug-04 27-Oct-04 9-Dec-04 9-Feb-05 18-Apr-05 23-Jun-05 17-Aug-05 28-Sep-05 31-Oct-05 29-Nov-05 29-Dec-05 23-Jan-06<br />
MTBE MTBE MTBE MTBE MTBE MTBE MTBE MTBE MTBE MTBE MTBE MTBE MTBE MTBE MTBE MTBE MTBE MTBE MTBE MTBE MTBE<br />
ug/L ug/L ug/L ug/L ug/L ug/L ug/L ug/L ug/L ug/L ug/L ug/L ug/L ug/L ug/L ug/L ug/L ug/L ug/L ug/L ug/L<br />
0.25 0.25 0.25 0.5 0.25 0.25 0.25 0.25 0.25 0.25 0.25 0.25 0.25 0.25 0.25 0.25 0.25 0.25 0.25 0.25 0.25<br />
0.25 0.25 0.25 0.5 0.25 0.25 0.25 0.25 0.25 0.25 0.25 0.25 0.25 0.25 0.25 0.25 0.25 0.25 0.25 0.25 0.25<br />
Lake Merced<br />
South -<br />
Pump Station<br />
Depth<br />
Ft<br />
Surf<br />
5<br />
10<br />
15<br />
18-Jun-02 23-Aug-02 23-Oct-02 11-Feb-03 14-May-03 15-Jul-03 30-Sep-03 2-Dec-03 27-May-04 29-Aug-04 27-Oct-04 9-Dec-04 9-Feb-05 18-Apr-05 23-Jun-05 17-Aug-05 28-Sep-05 31-Oct-05 29-Nov-05 29-Dec-05 23-Jan-06<br />
MTBE MTBE MTBE MTBE MTBE MTBE MTBE MTBE MTBE MTBE MTBE MTBE MTBE MTBE MTBE MTBE MTBE MTBE MTBE MTBE MTBE<br />
ug/L ug/L ug/L ug/L ug/L ug/L ug/L ug/L ug/L ug/L ug/L ug/L ug/L ug/L ug/L ug/L ug/L ug/L ug/L ug/L ug/L<br />
0.25 0.025 0.25 0.5 0.25 0.25 0.25 0.25 0.25 0.25 0.25 0.25 0.25 0.25 0.25 0.25 0.25 0.25 0.25 0.25 0.25<br />
0.25 0.025 0.25 0.5 0.25 0.25 0.25 0.25<br />
0.25 0.25 0.25 0.25 0.25 0.25 0.25 0.25 0.25 0.25 0.25 0.25 0.25<br />
Page 2 of 3
Lake Merced<br />
North<br />
Depth<br />
Ft<br />
Surf<br />
5<br />
10<br />
14<br />
15<br />
16<br />
Lake Merced<br />
North East<br />
Depth<br />
Ft<br />
Surf<br />
5<br />
9<br />
10<br />
15<br />
16<br />
01-Mar-06 26-Apr-06 14-Jun-06 24-Aug-06 25-Oct-06 20-Dec-06 29-Mar-07 26-Jun-07 27-Dec-07 28-Mar-08 10-Jun-08 24-Sep-08 4-Dec-08<br />
MTBE MTBE MTBE MTBE MTBE MTBE MTBE MTBE MTBE MTBE MTBE MTBE MTBE<br />
ug/L ug/L ug/L ug/L ug/L ug/L ug/L ug/L ug/L ug/L ug/L ug/L ug/L<br />
0.25 0.25 0.25 0.25 0.25 0.25 0.25 0.25 0.25 0.25 0.25<br />
0.25 0.25 0.25 0.25 0.25 0.25 0.25 0.25 0.25<br />
01-Mar-06 26-Apr-06 14-Jun-06 24-Aug-06 25-Oct-06 20-Dec-06 29-Mar-07 26-Jun-07 27-Dec-07 28-Mar-08 10-Jun-08<br />
MTBE MTBE MTBE MTBE MTBE MTBE MTBE MTBE MTBE MTBE MTBE MTBE MTBE<br />
ug/L ug/L ug/L ug/L ug/L ug/L ug/L ug/L ug/L ug/L ug/L ug/L ug/L<br />
0.25 0.25 0.25 0.25 0.25 0.25 0.25 0.25 0.25 0.25 0.25<br />
0.25 0.25 0.25 0.25 0.25 0.25 0.25 0.25 0.25 0.25 0.25<br />
0.25<br />
0.25<br />
D.3-119<br />
Lake Merced<br />
South - Pistol<br />
Range<br />
Depth<br />
Ft<br />
Surf<br />
5<br />
6<br />
10<br />
15<br />
16<br />
01-Mar-06 26-Apr-06 14-Jun-06 24-Aug-06 25-Oct-06 20-Dec-06 29-Mar-07 26-Jun-07 27-Dec-07 28-Mar-08 10-Jun-08<br />
MTBE MTBE MTBE MTBE MTBE MTBE MTBE MTBE MTBE MTBE MTBE MTBE MTBE<br />
ug/L ug/L ug/L ug/L ug/L ug/L ug/L ug/L ug/L ug/L ug/L ug/L ug/L<br />
0.25 0.25 0.25 0.25 0.25 0.25 0.25 0.25 0.25 0.25 0.25<br />
0.25 0.25 0.25 0.25 0.25 0.25 0.25 0.25 0.25 0.25 0.25<br />
Lake Merced<br />
South -<br />
Pump Station<br />
Depth<br />
Ft<br />
Surf<br />
5<br />
10<br />
15<br />
01-Mar-06 26-Apr-06 14-Jun-06 24-Aug-06 25-Oct-06 20-Dec-06 29-Mar-07 26-Jun-07 27-Dec-07 28-Mar-08 10-Jun-08<br />
MTBE MTBE MTBE MTBE MTBE MTBE MTBE MTBE MTBE MTBE MTBE MTBE MTBE<br />
ug/L ug/L ug/L ug/L ug/L ug/L ug/L ug/L ug/L ug/L ug/L ug/L ug/L<br />
0.25 0.25 0.25 0.25 0.25 0.25 0.25 0.25 0.25 0.25 0.25<br />
0.25 0.25 0.25 0.25 0.25 0.25 0.25 0.25 0.25<br />
0.25 0.25<br />
Page 3 of 3
Lake Merced<br />
North<br />
Bacteriological<br />
Data (MPN) 15-May-97 10-Sep-97 3-Dec-97 16-Mar-98 8-Jul-98 17-Mar-99 21-Jun-99 15-Sep-99 8-Dec-99 21-Mar-00 21-Jun-00 9-Aug-00 19-Dec-00 7-Mar-01<br />
Total Coliform<br />
E. Coli<br />
Lake Merced<br />
North East<br />
Bacteriological<br />
Data (MPN)<br />
Total Coliform<br />
E. Coli<br />
15-May-97 10-Sep-97 3-Dec-97 16-Mar-98 8-Jul-98 17-Mar-99 21-Jun-99 15-Sep-99 8-Dec-99 21-Mar-00 21-Jun-00 9-Aug-00 19-Dec-00 7-Mar-01<br />
Lake Merced<br />
South - Pistol<br />
Range<br />
Bacteriological<br />
Data (MPN) 15-May-97 10-Sep-97 3-Dec-97 16-Mar-98 8-Jul-98 17-Mar-99 21-Jun-99 15-Sep-99 8-Dec-99 21-Mar-00 21-Jun-00 9-Aug-00 19-Dec-00 7-Mar-01<br />
Total Coliform<br />
E. Coli<br />
Lake Merced<br />
South - Pump<br />
Station<br />
D.3-120<br />
Bacteriological<br />
Data (MPN)<br />
Total Coliform<br />
E. Coli<br />
15-May-97 10-Sep-97 3-Dec-97 16-Mar-98 8-Jul-98 17-Mar-99 21-Jun-99 15-Sep-99 8-Dec-99 21-Mar-00 21-Jun-00 9-Aug-00 19-Dec-00 7-Mar-01<br />
Page 1 of 4
Lake Merced<br />
North<br />
Bacteriological<br />
Data (MPN)<br />
Total Coliform<br />
E. Coli<br />
27-May-04<br />
20-Jun-01 1-Oct-01 18-Dec-01 5-Mar-02 30-Apr-02 18-Jun-02 23-Aug-02 23-Oct-02 11-Feb-03 14-May-03 15-Jul-03 30-Sep-03 2-Dec-03<br />
1109 1986 1300 1120 437 1120 756 2419 1733 >2419<br />
34 14 17 62 63 13 6 9 22 19<br />
Lake Merced<br />
North East<br />
D.3-121<br />
Bacteriological<br />
Data (MPN)<br />
Total Coliform<br />
E. Coli<br />
Lake Merced<br />
South - Pistol<br />
Range<br />
Bacteriological<br />
Data (MPN)<br />
Total Coliform<br />
E. Coli<br />
Lake Merced<br />
South - Pump<br />
Station<br />
Bacteriological<br />
Data (MPN)<br />
Total Coliform<br />
E. Coli<br />
27-May-04<br />
20-Jun-01 1-Oct-01 18-Dec-01 5-Mar-02 30-Apr-02 18-Jun-02 23-Aug-02 23-Oct-02 11-Feb-03 14-May-03 15-Jul-03 30-Sep-03 2-Dec-03<br />
2419 >2419 >2419 1203 2419 2419 2419 2419 2419 >2419<br />
13 36 11 25 11 7 7 10 15 12<br />
27-May-04<br />
20-Jun-01 1-Oct-01 18-Dec-01 5-Mar-02 30-Apr-02 18-Jun-02 23-Aug-02 23-Oct-02 11-Feb-03 14-May-03 15-Jul-03 30-Sep-03 2-Dec-03<br />
1203 1046 1120 649 436 344 770 2419 1986 197<br />
15 14 6 336 22 15 26 48 53 4<br />
27-May-04<br />
20-Jun-01 1-Oct-01 18-Dec-01 5-Mar-02 30-Apr-02 18-Jun-02 23-Aug-02 23-Oct-02 11-Feb-03 14-May-03 15-Jul-03 30-Sep-03 2-Dec-03<br />
1414 1120 1046 488 365 153 1203 2419 727 309<br />
23 37 35 82 32 3 15 39 65 7<br />
Page 2 of 4
Lake Merced<br />
North<br />
Bacteriological<br />
Data (MPN)<br />
Total Coliform<br />
E. Coli<br />
29-Aug-04 27-Oct-04 9-Dec-04 9-Feb-05 18-Apr-05 23-Jun-05 17-Aug-05 28-Sep-05 31-Oct-05 29-Nov-05 29-Dec-05 23-Jan-06 1-Mar-06 26-Apr-06 14-Jun-06 24-Aug-06 25-Oct-06 20-Dec-06<br />
7 11,000 >2419 >2419 124 354 1414 >2419 629 2419 579 691 179 2419 1986 510 >2420 >2420<br />
135 200 35 2 33 25 26 5 4 20 18 8 21 17 46 7 5 20<br />
Lake Merced<br />
North East<br />
Bacteriological<br />
Data (MPN)<br />
Total Coliform<br />
E. Coli<br />
29-Aug-04 27-Oct-04 9-Dec-04 9-Feb-05 18-Apr-05 23-Jun-05 17-Aug-05 28-Sep-05 31-Oct-05 29-Nov-05 29-Dec-05 23-Jan-06 1-Mar-06 26-Apr-06 14-Jun-06 24-Aug-06 25-Oct-06 20-Dec-06<br />
>2419 8,130 2419 1120 2419 1046 1986 >2419 437 1986 >2419 >2419 >2419 914 2419 689 >2420 >2420<br />
52 100 8 20 5 50 2419 687.0 513 816<br />
33 100.0 81 4 10.0 30.0 N/A 20 84 99 28 7.0 17.0 15.0 5.0 33.0 3 13<br />
D.3-122<br />
Lake Merced<br />
South - Pump<br />
Station<br />
Bacteriological<br />
Data (MPN)<br />
Total Coliform<br />
E. Coli<br />
29-Aug-04 27-Oct-04 9-Dec-04 9-Feb-05 18-Apr-05 23-Jun-05 17-Aug-05 28-Sep-05 31-Oct-05 29-Nov-05 29-Dec-05 23-Jan-06 1-Mar-06 26-Apr-06 14-Jun-06 24-Aug-06 25-Oct-06 20-Dec-06<br />
479 2260.0 1986 1986 420.0 299.0 109 110 687 1300 1300 436.0 816.0 1733.0 549.0 378.0 1300 687<br />
23 100.0 99 2 20.0 10.0 16 12 37 78 56 13.0 29.0 13.0 11.0 41.0 18 59<br />
Page 3 of 4
Lake Merced<br />
North<br />
Bacteriological<br />
Data (MPN)<br />
Total Coliform<br />
E. Coli<br />
29-Mar-07 26-Jun-07 20-Aug-07<br />
28-Mar-08 10-Jun-08 24-Sep-08 4-Dec-08 24-Mar-09 4-Jun-09 22-Sep-09 15-Dec-09<br />
1553 96 >2419 437 272 516 >2420 534 961 1046 >2420<br />
16 4 285 28 3 35 20 59 17 4 22<br />
Lake Merced<br />
North East<br />
D.3-123<br />
Bacteriological<br />
Data (MPN)<br />
Total Coliform<br />
E. Coli<br />
Lake Merced<br />
South - Pistol<br />
Range<br />
Bacteriological<br />
Data (MPN)<br />
Total Coliform<br />
E. Coli<br />
Lake Merced<br />
South - Pump<br />
Station<br />
Bacteriological<br />
Data (MPN)<br />
Total Coliform<br />
E. Coli<br />
29-Mar-07 26-Jun-07 20-Aug-07<br />
28-Mar-08 10-Jun-08 24-Sep-08 4-Dec-08 24-Mar-09 4-Jun-09 22-Sep-09 15-Dec-09<br />
>2420 361 >2419 >2420 1986 2420 >2420 2420 >2420 579 1120<br />
6 3 5 9 6 1 108 16 7 5 4<br />
29-Mar-07 26-Jun-07 20-Aug-07<br />
28-Mar-08 10-Jun-08 24-Sep-08 4-Dec-08 24-Mar-09 4-Jun-09 22-Sep-09 15-Dec-09<br />
1300.0 286 756 >2420 830 >2420 1120 727 530 517 961<br />
47.0 5 34 91 11 33.0 37.0 27.0 11 15 10<br />
29-Mar-07 26-Jun-07 20-Aug-07<br />
28-Mar-08 10-Jun-08 24-Sep-08 4-Dec-08 24-Mar-09 4-Jun-09 22-Sep-09 15-Dec-09<br />
1120.0 284 866 2420 1414 914 411 173 260 >2420<br />
93.0 12 10 81 7 75 24 4 7 17<br />
Page 4 of 4
Lake<br />
Merced<br />
North<br />
Depth<br />
15-May-97 10-Sep-97 3-Dec-97 16-Mar-98 8-Jul-98 23-Sep-98 17-Mar-99 21-Jun-99 15-Sep-99 8-Dec-99 21-Mar-00 21-Jun-00 9-Aug-00 19-Dec-00 7-Mar-01 20-Jun-01 1-Oct-01 18-Dec-01 5-Mar-02 30-Apr-02 18-Jun-02<br />
Algal Algal Algal Algal Algal Algal Algal Algal Algal Algal Algal Algal Algal Algal Algal Algal Algal Algal Algal Algal Algal<br />
Biomass Biomass Biomass Biomass Biomass Biomass Biomass Biomass Biomass Biomass Biomass Biomass Biomass Biomass Biomass Biomass Biomass Biomass Biomass Biomass Biomass<br />
Ft µg/L µg/L µg/L µg/L µg/L µg/L µg/L µg/L µg/L µg/L µg/L µg/L µg/L µg/L µg/L µg/L µg/L µg/L µg/L µg/L µg/L<br />
Surf. 1,769 3,258 938 1,749 6,995 2,492 1,414 1,183 3,250 5,293 2,191 1209 4523 6,231<br />
5<br />
10 2,312 3,131 2,003 1,166 5,997 2,332 1,863 1,206 2,647 5,427 1,863 663 3853 5,963<br />
Lake<br />
Merced<br />
North East<br />
Depth<br />
15-May-97 10-Sep-97 3-Dec-97 16-Mar-98 8-Jul-98 23-Sep-98 17-Mar-99 21-Jun-99 15-Sep-99 8-Dec-99 21-Mar-00 21-Jun-00 9-Aug-00 19-Dec-00 7-Mar-01 20-Jun-01 1-Oct-01 18-Dec-01 5-Mar-02 30-Apr-02 18-Jun-02<br />
Algal Algal Algal Algal Algal Algal Algal Algal Algal Algal Algal Algal Algal Algal Algal Algal Algal Algal Algal Algal Algal<br />
Biomass Biomass Biomass Biomass Biomass Biomass Biomass Biomass Biomass Biomass Biomass Biomass Biomass Biomass Biomass Biomass Biomass Biomass Biomass Biomass Biomass<br />
Ft µg/L µg/L µg/L µg/L µg/L µg/L µg/L µg/L µg/L µg/L µg/L µg/L µg/L µg/L µg/L µg/L µg/L µg/L µg/L µg/L µg/L<br />
Surf. 2,834 4,085 1,126 1,983 2,117 1,956 1,956 2,013 3,082 3,953 2,827 1089 2198 3,853<br />
5<br />
10 2,908 3,333 1,172 1,869 2,090 2,660 1,863 1,997 2,580 3,886 1,668 1283 2198 3,035<br />
D.3-124<br />
Lake<br />
Merced<br />
South -<br />
Pistol<br />
Range<br />
Depth<br />
15-May-97 10-Sep-97 3-Dec-97 16-Mar-98 8-Jul-98 23-Sep-98 17-Mar-99 21-Jun-99 15-Sep-99 8-Dec-99 21-Mar-00 21-Jun-00 9-Aug-00 19-Dec-00 7-Mar-01 20-Jun-01 1-Oct-01 18-Dec-01 5-Mar-02 30-Apr-02 18-Jun-02<br />
Algal Algal Algal Algal Algal Algal Algal Algal Algal Algal Algal Algal Algal Algal Algal Algal Algal Algal Algal Algal Algal<br />
Biomass Biomass Biomass Biomass Biomass Biomass Biomass Biomass Biomass Biomass Biomass Biomass Biomass Biomass Biomass Biomass Biomass Biomass Biomass Biomass Biomass<br />
Ft µg/L µg/L µg/L µg/L µg/L µg/L µg/L µg/L µg/L µg/L µg/L µg/L µg/L µg/L µg/L µg/L µg/L µg/L µg/L µg/L µg/L<br />
Surf. 1,360 2,054 3,852 1,045 1,467 2,405 2,144 972 600 1,179 2,278 1,206 472 1266 ~1600*<br />
5<br />
10 1,347 2,032 3,493 1,065 1,320 2,486 2,050 817 553 1,132 2,345 1,407 429 1240 N/A<br />
Lake<br />
Merced<br />
South -<br />
Pump<br />
Station<br />
Depth<br />
15-May-97 10-Sep-97 3-Dec-97 16-Mar-98 8-Jul-98 23-Sep-98 17-Mar-99 21-Jun-99 15-Sep-99 8-Dec-99 21-Mar-00 21-Jun-00 9-Aug-00 19-Dec-00 7-Mar-01 20-Jun-01 1-Oct-01 18-Dec-01 5-Mar-02 30-Apr-02 18-Jun-02<br />
Algal Algal Algal Algal Algal Algal Algal Algal Algal Algal Algal Algal Algal Algal Algal Algal Algal Algal Algal Algal Algal<br />
Biomass Biomass Biomass Biomass Biomass Biomass Biomass Biomass Biomass Biomass Biomass Biomass Biomass Biomass Biomass Biomass Biomass Biomass Biomass Biomass Biomass<br />
Ft µg/L µg/L µg/L µg/L µg/L µg/L µg/L µg/L µg/L µg/L µg/L µg/L µg/L µg/L µg/L µg/L µg/L µg/L µg/L µg/L µg/L<br />
Surf. 1,253 2,016 6,705 1,253 1,769 3,719 2,144 737 700 1,199 2,613 1,655 442 1374 1,554<br />
5<br />
10 1,474 2,118 5,233 1,079 1,621 2,573 1,923 864 683 1,085 2,546 1,206 402 1280 1,467<br />
Page 1 of 3
Lake<br />
Merced<br />
North<br />
Depth<br />
Ft<br />
Surf.<br />
5<br />
10<br />
23-Aug-02 23-Oct-02 11-Feb-03 14-May-03 15-Jul-03 30-Sep-03 2-Dec-03 27-May-04 29-Aug-04 27-Oct-04 9-Dec-04 23-Jan-06 01-Mar-06 26-Apr-06 14-Jun-06 24-Aug-06 25-Oct-06 20-Dec-06 29-Mar-07 26-Jun-07 20-Aug-07<br />
Algal Algal Algal Algal Algal Algal Algal Algal<br />
Algal Algal Algal Algal Algal Algal Algal Algal Algal Algal Algal<br />
Biomass Biomass Biomass Biomass Biomass Biomass Biomass Biomass Algal Biomass Biomass Biomass Biomass Biomass Biomass Biomass Biomass Biomass Biomass Biomass Biomass Algal Biomass<br />
µg/L µg/L µg/L µg/L µg/L µg/L µg/L µg/L µg/L µg/L µg/L µg/L µg/L µg/L µg/L µg/L µg/L µg/L µg/L µg/L µg/L<br />
1,943 3260 1219 6,834 4,389 4,221 2435 650 2117 4288 851 1146 1099 1293 4858 5461 2385 2874 2198 3,317 9,514<br />
2,312 2358 1441 6,499 4,556 3,551 2147 637 1923 4523 1698 1501 1025 1407 5327 3987 2720 2171 3229 3,219 5,561<br />
D.3-125<br />
Lake<br />
Merced<br />
North East<br />
Depth<br />
Ft<br />
Surf.<br />
5<br />
10<br />
Lake<br />
Merced<br />
South -<br />
Pistol<br />
Range<br />
Depth<br />
Ft<br />
Surf.<br />
5<br />
10<br />
Lake<br />
Merced<br />
South -<br />
Pump<br />
Station<br />
Depth<br />
Ft<br />
Surf.<br />
5<br />
10<br />
23-Aug-02 23-Oct-02 11-Feb-03 14-May-03 15-Jul-03 30-Sep-03 2-Dec-03 27-May-04 29-Aug-04 27-Oct-04 9-Dec-04 23-Jan-06 01-Mar-06 26-Apr-06 14-Jun-06 24-Aug-06 25-Oct-06 20-Dec-06 29-Mar-07 26-Jun-07 20-Aug-07<br />
Algal Algal Algal Algal Algal Algal Algal Algal<br />
Algal Algal Algal Algal Algal Algal Algal Algal Algal Algal Algal<br />
Biomass Biomass Biomass Biomass Biomass Biomass Biomass Biomass Algal Biomass Biomass Biomass Biomass Biomass Biomass Biomass Biomass Biomass Biomass Biomass Biomass Algal Biomass<br />
µg/L µg/L µg/L µg/L µg/L µg/L µg/L µg/L µg/L µg/L µg/L µg/L µg/L µg/L µg/L µg/L µg/L µg/L µg/L µg/L µg/L<br />
1,997 2422 1528 3,082 2,399 5,729 2569 1,374 1816 2714 1491 2332 3417 1179 2982 3719 2412 1876 4255 2,389 2,352<br />
1,910 2152 1635 3,618 2,204 3,886 2335 1,585 1695 2613 1521 2372 3243 1347 3819 3276 2955 1970 3920 2,750 4,757<br />
23-Aug-02 23-Oct-02 11-Feb-03 14-May-03 15-Jul-03 30-Sep-03 2-Dec-03 27-May-04 29-Aug-04 27-Oct-04 9-Dec-04 23-Jan-06 01-Mar-06 26-Apr-06 14-Jun-06 24-Aug-06 25-Oct-06 20-Dec-06 29-Mar-07 26-Jun-07 20-Aug-07<br />
Algal Algal Algal Algal Algal Algal Algal Algal<br />
Algal Algal Algal Algal Algal Algal Algal Algal Algal Algal Algal<br />
Biomass Biomass Biomass Biomass Biomass Biomass Biomass Biomass Algal Biomass Biomass Biomass Biomass Biomass Biomass Biomass Biomass Biomass Biomass Biomass Biomass Algal Biomass<br />
µg/L µg/L µg/L µg/L µg/L µg/L µg/L µg/L µg/L µg/L µg/L µg/L µg/L µg/L µg/L µg/L µg/L µg/L µg/L µg/L µg/L<br />
2,472 1,826 750 2,144 2,278 2,915 1,782 1,183 N/A 1534 1695 985 1360.1 1635 2258 4824.0 2559 1467 1186 1,350 7,973<br />
2,184 1,836 858 1,702 1,977 3,109 1,394 1,116 2358 2030 992 911 1206.0 1970 1956 4924.5 2486 1387 1367 1,273 2,178<br />
23-Aug-02 23-Oct-02 11-Feb-03 14-May-03 15-Jul-03 30-Sep-03 2-Dec-03 27-May-04 29-Aug-04 27-Oct-04 9-Dec-04 23-Jan-06 01-Mar-06 26-Apr-06 14-Jun-06 24-Aug-06 25-Oct-06 20-Dec-06 29-Mar-07 26-Jun-07 20-Aug-07<br />
Algal Algal Algal Algal Algal Algal Algal Algal<br />
Algal Algal Algal Algal Algal Algal Algal Algal Algal Algal Algal<br />
Biomass Biomass Biomass Biomass Biomass Biomass Biomass Biomass Algal Biomass Biomass Biomass Biomass Biomass Biomass Biomass Biomass Biomass Biomass Biomass Biomass Algal Biomass<br />
µg/L µg/L µg/L µg/L µg/L µg/L µg/L µg/L µg/L µg/L µg/L µg/L µg/L µg/L µg/L µg/L µg/L µg/L µg/L µg/L µg/L<br />
2,513 2,191 757 2,037 2,064 3,109 1,374 1,226 2841 1923 995 1072 1139.0 1829 1809 4422.0 2640 1387 1079 1,554 2,131<br />
2,298 2,334 750 2,037 2,023 2,325 1,732 1,484 2486 1461 905 992 1058.6 2231 2137 4891.0 2613 1367 1427 1,065 2,037<br />
Page 2 of 3
Lake<br />
Merced<br />
North<br />
Depth<br />
Ft<br />
Surf.<br />
5<br />
10<br />
27-Dec-07 28-Mar-08 10-Jun-08 24-Sep-08 4-Dec-08 24-Mar-09 4-Jun-09 22-Sep-09 15-Dec-09<br />
Algal<br />
Algal Algal Algal Algal Algal Algal Algal Algal<br />
Biomass Biomass Biomass Biomass Biomass Biomass Biomass Biomass Biomass<br />
µg/L µg/L µg/L µg/L µg/L µg/L µg/L µg/L µg/L<br />
4167 2117 4248 3162 1080 3377 4074 2137<br />
3109 1072 3292 3404 2131<br />
4308 2171 4020<br />
Lake<br />
Merced<br />
North East<br />
Depth<br />
Ft<br />
Surf.<br />
5<br />
10<br />
27-Dec-07 28-Mar-08 10-Jun-08 24-Sep-08 4-Dec-08 24-Mar-09 4-Jun-09 22-Sep-09 15-Dec-09<br />
Algal<br />
Algal Algal Algal Algal Algal Algal Algal Algal<br />
Biomass Biomass Biomass Biomass Biomass Biomass Biomass Biomass Biomass<br />
µg/L µg/L µg/L µg/L µg/L µg/L µg/L µg/L µg/L<br />
2466 2265 3886 2061 1166 2442 3176 3618<br />
1560 1110 2602 2908 3430<br />
2312 2760 3417<br />
D.3-126<br />
Lake<br />
Merced<br />
South -<br />
Pistol<br />
Range<br />
Depth<br />
Ft<br />
Surf.<br />
5<br />
10<br />
Lake<br />
Merced<br />
South -<br />
Pump<br />
Station<br />
Depth<br />
Ft<br />
Surf.<br />
5<br />
10<br />
27-Dec-07 28-Mar-08 10-Jun-08 24-Sep-08 4-Dec-08 24-Mar-09 4-Jun-09 22-Sep-09 15-Dec-09<br />
Algal<br />
Algal Algal Algal Algal Algal Algal Algal Algal<br />
Biomass Biomass Biomass Biomass Biomass Biomass Biomass Biomass Biomass<br />
µg/L µg/L µg/L µg/L µg/L µg/L µg/L µg/L µg/L<br />
2586.2 929 1376.9 1420 2117 777 1276 2533 1414<br />
2262 683 1265 2452 1160<br />
3430.4 1063 1450.6 1313<br />
27-Dec-07 28-Mar-08 10-Jun-08 24-Sep-08 4-Dec-08 24-Mar-09 4-Jun-09 22-Sep-09 15-Dec-09<br />
Algal<br />
Algal Algal Algal Algal Algal Algal Algal Algal<br />
Biomass Biomass Biomass Biomass Biomass Biomass Biomass Biomass Biomass<br />
µg/L µg/L µg/L µg/L µg/L µg/L µg/L µg/L µg/L<br />
3001.6 990 1363.5 1487 2841 683 1260 2131 1809<br />
3832 563 1284 1997 1487<br />
3229.4 1142 1373.5 1394<br />
Page 3 of 3
Lake Merced<br />
North<br />
15-May-97 10-Sep-97 3-Dec-97 16-Mar-98 8-Jul-98 23-Sep-98 17-Mar-99 21-Jun-99 15-Sep-99 8-Dec-99 21-Mar-00 21-Jun-00 9-Aug-00 19-Dec-00 7-Mar-01<br />
Depth Chlorophyll a Chlorophyll a Chlorophyll a Chlorophyll a Chlorophyll a Chlorophyll a Chlorophyll a Chlorophyll a<br />
Ft Fg/L mg/L mg/L mg/L mg/L mg/L mg/L mg/L<br />
Surf. 26.4 48.6 14.0 26.1 104.4 37.2 21.1 17.7<br />
5<br />
10 34.5 46.7 29.9 17.4 89.5 34.8 27.8 18.0<br />
Lake Merced<br />
North East<br />
15-May-97 10-Sep-97 3-Dec-97 16-Mar-98 8-Jul-98 23-Sep-98 17-Mar-99 21-Jun-99 15-Sep-99 8-Dec-99 21-Mar-00 21-Jun-00 9-Aug-00 19-Dec-00 7-Mar-01<br />
Depth Chlorophyll a Chlorophyll a Chlorophyll a Chlorophyll a Chlorophyll a Chlorophyll a Chlorophyll a Chlorophyll a<br />
Ft Fg/L mg/L mg/L mg/L mg/L mg/L mg/L mg/L<br />
Surf. 42.3 61.0 16.8 29.6 31.6 29.2 29.2 30.1<br />
5<br />
10 43.4 49.8 17.5 27.9 31.2 39.7 27.8 29.8<br />
Lake Merced<br />
South - Pistol<br />
Range<br />
15-May-97 10-Sep-97 3-Dec-97 16-Mar-98 8-Jul-98 23-Sep-98 17-Mar-99 21-Jun-99 15-Sep-99 8-Dec-99 21-Mar-00 21-Jun-00 9-Aug-00 19-Dec-00 7-Mar-01<br />
Depth Chlorophyll a Chlorophyll a Chlorophyll a Chlorophyll a Chlorophyll a Chlorophyll a Chlorophyll a Chlorophyll a Chlorophyll a<br />
Ft Fg/L mg/L mg/L mg/L mg/L mg/L mg/L mg/L mg/L<br />
Surf. 20.3 30.7 57.5 15.6 21.9 35.9 32.0 14.5 9.0<br />
5<br />
10 20.1 30.3 52.1 15.9 19.7 37.1 30.6 12.2 8.3<br />
D.3-127<br />
Lake Merced<br />
South - Pump<br />
Station<br />
15-May-97 10-Sep-97 3-Dec-97 16-Mar-98 8-Jul-98 23-Sep-98 17-Mar-99 21-Jun-99 15-Sep-99 8-Dec-99 21-Mar-00 21-Jun-00 9-Aug-00 19-Dec-00 7-Mar-01<br />
Depth Chlorophyll a Chlorophyll a Chlorophyll a Chlorophyll a Chlorophyll a Chlorophyll a Chlorophyll a Chlorophyll a Chlorophyll a<br />
Ft Fg/L mg/L mg/L mg/L mg/L mg/L mg/L mg/L mg/L<br />
Surf. 18.7 30.1 100.1 18.7 26.4 55.5 32.0 11.0 10.5<br />
5<br />
10 22.0 31.6 78.1 16.1 24.2 38.4 28.7 12.9 10.2<br />
Page 1 of 4
D.3-128<br />
Lake Merced<br />
North<br />
Depth<br />
Ft<br />
Surf.<br />
5<br />
10<br />
Lake Merced<br />
North East<br />
Depth<br />
Ft<br />
Surf.<br />
5<br />
10<br />
Lake Merced<br />
South - Pistol<br />
Range<br />
Depth<br />
Ft<br />
Surf.<br />
5<br />
10<br />
Lake Merced<br />
South - Pump<br />
Station<br />
Depth<br />
Ft<br />
Surf.<br />
5<br />
10<br />
20-Jun-01 1-Oct-01 18-Dec-01 5-Mar-02 30-Apr-02 18-Jun-02 23-Aug-02 23-Oct-02 11-Feb-03 14-May-03 15-Jul-03 30-Sep-03 2-Dec-03 27-May-04 29-Aug-04<br />
Chlorophyll a Chlorophyll a Chlorophyll a Chlorophyll a Chlorophyll a Chlorophyll a Chlorophyll a Chlorophyll a Chlorophyll a Chlorophyll a Chlorophyll a Chlorophyll a Chlorophyll a Chlorophyll a Chlorophyll a<br />
mg/L mg/L mg/L ppb ppb mg/L ppb mg/L µg/L ppb µg/L ppb µg/L µg/L µg/L<br />
48.5 79.0 32.7 18.1 67.5 93.0 29.0 48.7 18.2 102.0 65.5 63.0 36.4 9.7 31.6<br />
39.5 81.0 27.8 9.9 57.5 89.0 34.5 35.2 21.5 97.0 68.0 53.0 32.1 9.5 28.7<br />
20-Jun-01 1-Oct-01 18-Dec-01 5-Mar-02 30-Apr-02 18-Jun-02 23-Aug-02 23-Oct-02 11-Feb-03 14-May-03 15-Jul-03 30-Sep-03 2-Dec-03 27-May-04 29-Aug-04<br />
Chlorophyll a Chlorophyll a Chlorophyll a Chlorophyll a Chlorophyll a Chlorophyll a Chlorophyll a Chlorophyll a Chlorophyll a Chlorophyll a Chlorophyll a Chlorophyll a Chlorophyll a Chlorophyll a Chlorophyll a<br />
mg/L mg/L mg/L ppb ppb mg/L ppb mg/L µg/L ppb µg/L ppb µg/L µg/L µg/L<br />
46.0 59.0 42.2 16.3 32.8 57.5 29.8 36.2 22.8 46.0 35.8 85.5 38.4 20.5 27.1<br />
38.5 58.0 24.9 19.2 32.8 45.3 28.5 32.1 24.4 54.0 32.9 58.0 34.9 23.7 25.3<br />
20-Jun-01 1-Oct-01 18-Dec-01 5-Mar-02 30-Apr-02 18-Jun-02 23-Aug-02 23-Oct-02 11-Feb-03 14-May-03 15-Jul-03 30-Sep-03 2-Dec-03 27-May-04 29-Aug-04<br />
Chlorophyll a Chlorophyll a Chlorophyll a Chlorophyll a Chlorophyll a Chlorophyll a Chlorophyll a Chlorophyll a Chlorophyll a Chlorophyll a Chlorophyll a Chlorophyll a Chlorophyll a Chlorophyll a Chlorophyll a<br />
mg/L mg/L mg/L ppb ppb mg/L ppb mg/L µg/L ppb µg/L ppb µg/L µg/L µg/L<br />
17.6 34.0 18.0 7.1 18.9 ~24* 36.9 27.3 11.2 32.0 34.0 43.5 26.6 17.7 N/A<br />
16.9 35.0 21.0 6.4 18.5 N/A 32.6 27.4 12.8 25.4 29.5 46.4 20.8 16.7 35.2<br />
20-Jun-01 1-Oct-01 18-Dec-01 5-Mar-02 30-Apr-02 18-Jun-02 23-Aug-02 23-Oct-02 11-Feb-03 14-May-03 15-Jul-03 30-Sep-03 2-Dec-03 27-May-04 29-Aug-04<br />
Chlorophyll a Chlorophyll a Chlorophyll a Chlorophyll a Chlorophyll a Chlorophyll a Chlorophyll a Chlorophyll a Chlorophyll a Chlorophyll a Chlorophyll a Chlorophyll a Chlorophyll a Chlorophyll a Chlorophyll a<br />
mg/L mg/L mg/L ppb ppb mg/L ppb mg/L µg/L ppb µg/L ppb µg/L µg/L µg/L<br />
17.9 39.0 24.7 6.6 20.5 23.2 37.5 32.7 11.3 30.4 30.8 46.4 20.5 18.3 42.4<br />
16.2 38.0 18.0 6.0 19.1 21.9 34.3 34.8 11.2 30.4 30.2 34.7 25.9 22.2 37.1<br />
Page 2 of 4
D.3-129<br />
Lake Merced<br />
North<br />
Depth<br />
Ft<br />
Surf.<br />
5<br />
10<br />
Lake Merced<br />
North East<br />
Depth<br />
Ft<br />
Surf.<br />
5<br />
10<br />
Lake Merced<br />
South - Pistol<br />
Range<br />
Depth<br />
Ft<br />
Surf.<br />
5<br />
10<br />
Lake Merced<br />
South - Pump<br />
Station<br />
Depth<br />
Ft<br />
Surf.<br />
5<br />
10<br />
27-Oct-04 9-Dec-04 9-Feb-05 18-Apr-05 23-Jun-05 17-Aug-05 28-Sep-05 31-Oct-05 29-Nov-05 29-Dec-05 23-Jan-06 01-Mar-06 26-Apr-06 14-Jun-06 24-Aug-06<br />
Chlorophyll a Chlorophyll a Chlorophyll a Chlorophyll a Chlorophyll a Chlorophyll a Chlorophyll a Chlorophyll a Chlorophyll a Chlorophyll a Chlorophyll a Chlorophyll a Chlorophyll a Chlorophyll a Chlorophyll a<br />
µg/L µg/L µg/L µg/L µg/L µg/L µg/L µg/L µg/L µg/L µg/L µg/L µg/L µg/L µg/L<br />
64.0 12.7 9.9 3.3 17.7 41.1 36.6 7.7 24.2 45.4 17.1 16.4 19.3 72.5 81.5<br />
67.5 25.4 10.6 3.6 14.6 39.7 28.2 7.2 26.6 42.0 22.4 15.3 21.0 79.5 59.5<br />
27-Oct-04 9-Dec-04 9-Feb-05 18-Apr-05 23-Jun-05 17-Aug-05 28-Sep-05 31-Oct-05 29-Nov-05 29-Dec-05 23-Jan-06 01-Mar-06 26-Apr-06 14-Jun-06 24-Aug-06<br />
Chlorophyll a Chlorophyll a Chlorophyll a Chlorophyll a Chlorophyll a Chlorophyll a Chlorophyll a Chlorophyll a Chlorophyll a Chlorophyll a Chlorophyll a Chlorophyll a Chlorophyll a Chlorophyll a Chlorophyll a<br />
µg/L µg/L µg/L µg/L µg/L µg/L µg/L µg/L µg/L µg/L µg/L µg/L µg/L µg/L µg/L<br />
40.5 22.3 16.0 27.8 26.7 51.0 27.7 6.4 31.2 77.5 34.8 51.0 17.6 44.5 55.5<br />
39.0 22.7 15.8 22.1 24.1 46.4 34.1 7.4 31.1 42.8 35.4 48.4 20.1 57.0 48.9<br />
27-Oct-04 9-Dec-04 9-Feb-05 18-Apr-05 23-Jun-05 17-Aug-05 28-Sep-05 31-Oct-05 29-Nov-05 29-Dec-05 23-Jan-06 01-Mar-06 26-Apr-06 14-Jun-06 24-Aug-06<br />
Chlorophyll a Chlorophyll a Chlorophyll a Chlorophyll a Chlorophyll a Chlorophyll a Chlorophyll a Chlorophyll a Chlorophyll a Chlorophyll a Chlorophyll a Chlorophyll a Chlorophyll a Chlorophyll a Chlorophyll a<br />
µg/L µg/L µg/L µg/L µg/L µg/L µg/L µg/L µg/L µg/L µg/L µg/L µg/L µg/L µg/L<br />
22.9 25.3 7.6 12.8 30.3 21.8 23.7 5.4 19.7 29.4 14.7 20.3 24.4 33.7 72.0<br />
30.3 14.8 7.0 13.0 32.1 21.6 23.3 4.8 21.4 32.2 13.6 18.0 29.4 29.2 73.5<br />
27-Oct-04 9-Dec-04 9-Feb-05 18-Apr-05 23-Jun-05 17-Aug-05 28-Sep-05 31-Oct-05 29-Nov-05 29-Dec-05 23-Jan-06 01-Mar-06 26-Apr-06 14-Jun-06 24-Aug-06<br />
Chlorophyll a Chlorophyll a Chlorophyll a Chlorophyll a Chlorophyll a Chlorophyll a Chlorophyll a Chlorophyll a Chlorophyll a Chlorophyll a Chlorophyll a Chlorophyll a Chlorophyll a Chlorophyll a Chlorophyll a<br />
µg/L µg/L µg/L µg/L µg/L µg/L µg/L µg/L µg/L µg/L µg/L µg/L µg/L µg/L µg/L<br />
28.7 14.9 7.0 13.7 27.1 19.5 27.0 4.7 26.7 30.2 16.0 17.0 27.3 27.0 66.0<br />
21.8 13.5 7.0 14.5 27.7 23.5 26.0 4.8 19.9 34.5 14.8 15.8 33.3 31.9 73.0<br />
Page 3 of 4
D.3-130<br />
Lake Merced<br />
North<br />
Depth<br />
Ft<br />
Surf.<br />
5<br />
10<br />
Lake Merced<br />
North East<br />
Depth<br />
Ft<br />
Surf.<br />
5<br />
10<br />
Lake Merced<br />
South - Pistol<br />
Range<br />
Depth<br />
Ft<br />
Surf.<br />
5<br />
10<br />
Lake Merced<br />
South - Pump<br />
Station<br />
Depth<br />
Ft<br />
Surf.<br />
5<br />
10<br />
25-Oct-06 20-Dec-06 29-Mar-07 26-Jun-07 20-Aug-07 27-Dec-07 28-Mar-08 10-Jun-08 24-Sep-08 4-Dec-08 24-Mar-09 4-Jun-09 22-Sep-09 15-Dec-09<br />
Chlorophyll a Chlorophyll a Chlorophyll a Chlorophyll a Chlorophyll a Chlorophyll a Chlorophyll a Chlorophyll a Chlorophyll a Chlorophyll a Chlorophyll a Chlorophyll a Chlorophyll a<br />
µg/L µg/L µg/L µg/L µg/L µg/L µg/L µg/L µg/L µg/L µg/L µg/L µg/L<br />
35.6 42.9 32.8 49.5 142.0 62.2 31.6 63.4 47.2 16.1 50.4 60.8 31.9<br />
46.4 16.00 49.1 50.8 31.8<br />
40.6 32.4 48.2 48.1 83.0 64.3 32.4 60.0<br />
25-Oct-06 20-Dec-06 29-Mar-07 26-Jun-07 20-Aug-07 27-Dec-07 28-Mar-08 10-Jun-08 24-Sep-08 4-Dec-08 24-Mar-09 4-Jun-09 22-Sep-09 15-Dec-09<br />
Chlorophyll a Chlorophyll a Chlorophyll a Chlorophyll a Chlorophyll a Chlorophyll a Chlorophyll a Chlorophyll a Chlorophyll a Chlorophyll a Chlorophyll a Chlorophyll a Chlorophyll a<br />
µg/L µg/L µg/L µg/L µg/L µg/L µg/L µg/L µg/L µg/L µg/L µg/L µg/L<br />
36.0 28.0 63.5 35.7 35.1 36.8 33.8 58.0 30.8 17.4 36.4 47.4 54.0<br />
23.3 16.6 38.8 43.4 51.2<br />
44.1 29.4 58.5 41.1 71.0 34.5 41.2 51.0<br />
25-Oct-06 20-Dec-06 29-Mar-07 26-Jun-07 20-Aug-07 27-Dec-07 28-Mar-08 10-Jun-08 24-Sep-08 4-Dec-08 24-Mar-09 4-Jun-09 22-Sep-09 15-Dec-09<br />
Chlorophyll a Chlorophyll a Chlorophyll a Chlorophyll a Chlorophyll a Chlorophyll a Chlorophyll a Chlorophyll a Chlorophyll a Chlorophyll a Chlorophyll a Chlorophyll a Chlorophyll a Chlorophyll a<br />
µg/L µg/L µg/L µg/L µg/L µg/L µg/L µg/L µg/L µg/L µg/L µg/L µg/L µg/L<br />
38.2 21.9 17.7 20.2 119.0 38.6 13.9 20.6 21.2 31.6 11.6 19.0 37.8 21.1<br />
33.8 10.2 18.9 36.6 17.3<br />
37.1 20.7 20.4 19.0 32.5 51.2 15.9 21.7 19.6<br />
25-Oct-06 20-Dec-06 29-Mar-07 26-Jun-07 20-Aug-07 27-Dec-07 28-Mar-08 10-Jun-08 24-Sep-08 4-Dec-08 24-Mar-09 4-Jun-09 22-Sep-09 15-Dec-09<br />
Chlorophyll a Chlorophyll a Chlorophyll a Chlorophyll a Chlorophyll a Chlorophyll a Chlorophyll a Chlorophyll a Chlorophyll a Chlorophyll a Chlorophyll a Chlorophyll a Chlorophyll a Chlorophyll a<br />
µg/L µg/L µg/L µg/L µg/L µg/L µg/L µg/L µg/L µg/L µg/L µg/L µg/L µg/L<br />
39.4 20.7 16.1 23.2 31.8 44.8 14.8 20.4 22.2 42.4 10.2 18.8 31.8 27.0<br />
57.2 8.4 19.2 29.8 22.2<br />
39.0 20.4 21.3 15.9 30.4 48.2 17.0 20.5 20.8<br />
Page 4 of 4
Plankton Count - Dominant Species (>98% of total population)<br />
Lake Merced North<br />
15-May-97 10-Sep-97 3-Dec-97 16-Mar-98<br />
Organism No./cuM No./mL Organism No./cuM No./mL Organism No./cuM No./mL Organism No./cuM No./mL Organism No./cuM No./mL Organism No./m 3 No./mL<br />
Oscillatoria 160,000,000 160 Oscillatoria 320,000,000 320 Oscillatoria 1,200,000,000 1,200 Oscillatoria 410,000,000 410 Oscillatoria (1:100 dilution) 1,500,000,000 1,500 Oscillatoria 1,100,000,000 1,100<br />
Anabaena 15,000,000 15 Anabaena 280,000 0.280 Copepod 19,000 0.019 Mougeotia 4,100,000 4.100 Anabaena 10,000,000 10 Anabaena 1,000,000 1<br />
Melosira 8,000,000 8 Melosira 41,000 0.041 Rotifer 19,000 0.019 Nauplius 86,000 0.086 Copepod 89,000 0.089 Spirulina 440,000 0.440<br />
Spondylosium 4,000,000 4 Copepod 41,000 0.041 Cladoceran 19,000 0.019 Copepod 35,000 0.035 Rotifer 13,000 0.013 Rotifer 230,000 0.230<br />
Nauplius Larva 95,000 0.095 Nauplius Larva 25,000 0.025 Total 1,200,057,000 1,200 Total 414,221,000 414 Nauplius 13,000 0.013 Closterium 140,000 0.140<br />
Rotifer 68,000 0.068 Total 320,387,000 320 Total 1,510,115,000 1,510 Copepoda 92,000 0.092<br />
Copepod 55,000 0.055 Mougeotia 23,000 0.023<br />
Fragilaria 55,000 0.055 Epithemia 23,000 0.023<br />
Total 187,273,000 187 Total 1,101,948,000 1,102<br />
8-Jul-98<br />
17-Mar-99<br />
D.3-131<br />
Lake Merced North East<br />
15-May-97 10-Sep-97 3-Dec-97 16-Mar-98 8-Jul-98 17-Mar-99<br />
Organism No./cuM No./mL Organism No./cuM No./mL Organism No./cuM No./mL Organism No./cuM No./mL Organism No./m 3 No./mL<br />
Oscillatoria 430,000,000 430 Oscillatoria 370,000,000 370 Osciilatoria 240,000,000 240 Oscillatoria (1:100 dilution) 1,700,000,000 1,700 Oscillatoria 2,200,000,000 2,200<br />
Melosira 22,000,000 22 Mougeotia 3,400,000 3 Rotifer 130,000 0 Anabaena 1,300,000 1 Rotifer 180,000 0<br />
Anabaena 15,000,000 15 Ankistrodesmus 870,000 1 Anabaena 78,000 0 Copepod 140,000 0 Closterium 78,000 0<br />
Spondylosium 7,400,000 7 Copepod 310,000 0 Copepod 65,000 0 Nauplius 60,000 0 Nauplius 52,000 0<br />
Rotifer 100,000 0 Rotifer 85,000 0 Total 240,273,000 240 Total 1,701,500,000 1,702 Cladoceran 52,000 0<br />
Copepod 100,000 0 Cladoceran 56,000 0 Mougeotia 52,000 0<br />
Total 474,600,000 475 Total 374,721,000 375 Synedra 26,000 0<br />
Anabaena 26,000 0.026<br />
Total 2,200,466,000 2,200<br />
Page 1 of 18
Lake Merced North<br />
21-Jun-99 15-Sep-99 8-Dec-99 21-Mar-00 21-Jun-00<br />
Organism No./m 3 No./mL Organism No./m 3 No./mL Organism No./m 3 No./mL Organism No./m 3 No./mL<br />
Oscillatoria 1,900,000,000 1,900 Oscillatoria 1,100,000,000 1,100 Oscillatoria 1,800,000,000 1,800 Oscillatoria 550,000,000 550<br />
Anabaena 1,800,000 2 Mougeotia 410,000 0.410 Mougeotia 3,039,244 3 Anabaena 35,000,000 35<br />
Gomphosphaeria 770,000 1 Closterium 170,000 0.170 Melosira 1,823,546 2 Melosira 8,200,000 8<br />
Mougeotia 640,000 1 Rotifer 69,000 0.069 Anabaena 1,823,546 2 Synedra 490,000 0.490<br />
Anacystis 470,000 0.470 Naviculoid Diatom 69,000 0.069 Closterium 1,215,698 1.216 Mougeotia 230,000 0.230<br />
Closterium 430,000 0.430 Cymbella 69,000 0.069 Fragilaria 607,849 0.608 Chlorella 210,000 0.210<br />
Spirulina 210,000 0.210 Copepoda 34,000 0.034 Copepoda 607,849 0.608 Ankistrodesmus 110,000 0.110<br />
Mallomonas 170,000 0.170 Mallomonas 34,000 0.034 Rhizolenia 607,849 0.608 Coelosphaerium 61,000 0.061<br />
Naviculoid Diatom 130,000 0.130 Scenedesmus 34,000 0.034 Synedra 607,849 0.608 Scenedesmus 61,000 0.061<br />
Scenedesmus 85,000 0.085 Coelastrum 34,000 0.034 Closteridium 607,849 0.608 Rotifera 46,000 0.046<br />
Tetraedron 85,000 0.085 Anabaena 34,000 0.034 Total 1,810,941,278 1,811 Copepoda 31,000 0.031<br />
Fragilaria 85,000 0.085 Total 1,100,957,000 1,101 Nauplius 31,000 0.031<br />
Paramecium 43,000 0.043 Navicula 31,000 0.031<br />
Pediastrum 43,000 0.043 Cymbella 15,000 0.015<br />
Cladoceran 43,000 0.043 Stephanodiscus 15,000 0.015<br />
Selenastrum 43,000 0.043 Closteriopsis 15,000 0.015<br />
Total 1,905,047,000 1,905 Total 626,000 595<br />
D.3-132<br />
Lake Merced North East<br />
21-Jun-99 15-Sep-99 8-Dec-99 21-Mar-00 21-Jun-00<br />
Organism No./m 3 No./mL Organism No./m 3 No./mL Organism No./m 3 No./mL Organism No./m 3 No./mL<br />
Oscillatoria 1,300,000,000 1,300 Oscillatoria 1,600,000,000 1,600 Oscillatoria 3,100,000,000 3,100 Oscillatoria 1,300,000,000 1,300<br />
Mougeotia 2,600,000 3 Closterium 690,000 1 Melosira 8,200,000 8 Anabaena 16,000,000 16<br />
Anabaena 560,000 1 Mougeotia 430,000 0 Mougeotia 5,700,000 6 Melosira 6,900,000 7<br />
Anacystis 530,000 1 Nauplius 170,000 0 Synedra 3,300,000 3 Ankistrodesmus 860,000 1<br />
Closterium 450,000 0 Synedra 130,000 0 Anabaena 2,400,000 2 Synedra 740,000 1<br />
Naviculoid Diatom 260,000 0 Anabaena 130,000 0 Gleocystis 820,000 1 Mougeotia 520,000 1<br />
Ankistrodesmis 230,000 0 Spirulina 87,000 0 Total 3,120,420,000 3,120 Chlorella 360,000 0<br />
Copepoda 190,000 0 Closteridium 87,000 0 Cymbella 140,000 0<br />
Nauplius 150,000 0 Scenedesmus 43,000 0 Scenedesmus 120,000 0<br />
Cymbella 150,000 0 Cymbella 43,000 0 Fragilaria 72,000 0<br />
Fragilaria 110,000 0 Copepoda 43,000 0 Polypleblepharides 48,000 0<br />
Actinastrum 75,000 0 Actinastrum 43,000 0 Coelosphaerium 48,000 0<br />
Pediastrum 38,000 0 Rotifer 43,000 0 Stephanodiscus 48,000 0<br />
Scenedesmus 38,000 0 Coelosphaerium 43,000 0 Gomphoneis 24,000 0<br />
Ostrocoda 38,000 0 Total 432,000 0 Closterium 24,000 0<br />
Mallomonas 38,000 0 Closteriopsis 24,000 0<br />
Rotifer 38,000 0 Total 1,325,928,000 1,326<br />
Total 525,000 1<br />
Page 2 of 18
Lake Merced North<br />
9-Aug-00<br />
19-Dec-00 7-Mar-01 20-Jun-01 1-Oct-01<br />
Organism No./m 3 No./mL Organism No./m 3 No./mL Organism No./m 3 No./mL Organism No./m 3 No./mL Organism No./m 3 No./mL<br />
Oscillatoria 1,900,000,000 1,900 Oscillatoria (20/1 dilution) 1,600,000,000 1,600 Oscillatoria 1,800,000,000 1,800 Oscillatoria 1,200,000,000 1,200 Oscillatoria 2,700,000,000 2,700<br />
Melosira 6,600,000 7 Melosira 1,400,000 1.400 Melosira 1,600,000 2 Anabaena 14,000,000 14 Melosira 970,000 1<br />
Anabaena 2,800,000 3 Mougeotia 1,100,000 1.100 Rotifera 300,000 0.300 Melosira 1,600,000 2 Anabaena 600,000 1<br />
Ankistrodesmus 280,000 0.280 Closterium 370,000 0.370 Scenedesmus 250,000 0.250 Synedra 1,200,000 1 Closterium 340,000 0.340<br />
Coelosphaerium 170,000 0.170 Anabaena 250,000 0.250 Ankistrodesmus 220,000 0.220 Ankistrodesmus 160,000 0.160 Ankistrodesmus 300,000 0.300<br />
Nauplius 130,000 0.130 Ankistrodesmus 250,000 0.250 Closterium 190,000 0.190 Closterium 110,000 0.110 Coelosphaerium 150,000 0.150<br />
Mougeotia 87,000 0.087 Scenedesmus 120,000 0.120 Copepoda 82,000 0.082 Fragilaria 90,000 0.090 Copepoda 150,000 0.150<br />
Rotifera 43,000 0.043 Naviculoid Diatom 120,000 0.120 Anabaena 55,000 0.055 Copepoda 45,000 0.045 Scenedesmus 75,000 0.075<br />
Closteriopsis 22,000 0.022 Copepoda 120,000 0.120 Synedra 55,000 0.055 Staurastrum 22,000 0.022 Nauplius 38,000 0.038<br />
Stephanodiscus 22,000 0.022 Total 1,603,730,000 1,604 Nauplius 55,000 0.055 Cyclotella 22,000 0.022 Rotifera 38,000 0.038<br />
Staurastrum 22,000 0.022 Cymbella 27,000 0.027 Nauplius 22,000 0.022 Total 2,702,661,000 2,703<br />
Copepoda 22,000 0.022 Ceratium 27,000 0.027 Coelosphaerium 22,000 0.022<br />
Pediastrum 22,000 0.022 Total 1,802,861,000 1,803 Total 1,217,293,000 1,217<br />
Scenedesmus 22,000 0.022<br />
Total 842,000 1,910<br />
D.3-133<br />
Lake Merced North East<br />
9-Aug-00<br />
19-Dec-00 7-Mar-01 20-Jun-01 1-Oct-01<br />
Organism No./m 3 No./mL Organism No./m 3 No./mL Organism No./m 3 No./mL Organism No./m 3 No./mL Organism No./m 3 No./mL<br />
Oscillatoria 1,800,000,000 1,800 Oscillatoria (20/1 dilution) 1,400,000,000 1,400 Oscillatoria 4,800,000,000 4,800 Oscillatoria 2,000,000,000 2,000 Oscillatoria 2,600,000,000 2,600<br />
Melosira 10,000,000 10 Mougeotia 4,100,000 4 Ankistrodesmus 730,000 0.730 Anabaena 12,000,000 12 Melosira 4,100,000 4<br />
Anabaena 3,300,000 3 Melosira 1,600,000 2 Rotifera 380,000 0.380 Melosira 4,800,000 5 Ankistrodesmus 1,900,000 2<br />
Ankistrodesmus 1,600,000 2 Ankistrodesmus 570,000 1 Melosira 270,000 0.270 Synedra 2,700,000 3 Rotifera 160,000 0.160<br />
Mougeotia 280,000 0 Closterium 460,000 0 Synedra 190,000 0.190 Ankistrodesmus 1,100,000 1.100 Nauplius 120,000 0.120<br />
Closterium 250,000 0 Cyclotella 230,000 0 Staurastrum 120,000 0.120 Closterium 400,000 0.400 Cymbella 120,000 0.120<br />
Nauplius 140,000 0 Anacystis 110,000 0 Scenedesmus 77,000 0.077 Cyclotella 400,000 0.400 Closterium 120,000 0.120<br />
Scenedesmus 110,000 0 Rotifera 110,000 0 Nauplius 38,000 0.038 Ophiocytium 130,000 0.130 Copepoda 120,000 0.120<br />
Synedra 84,000 0 Nauplius 110,000 0 Closterium 38,000 0.038 Copepoda 130,000 0.130 Anabaena 41,000 0.041<br />
Rotifera 84,000 0 Naviculoid Diatom 110,000 0 Stephanodiscus 38,000 0.038 Nauplius 100,000 0.100 Aphanizomenon 41,000 0.041<br />
Cymbella 56,000 0 Zygnema 110,000 0 Copepoda 38,000 0.038 Fragilaria 67,000 0.067 Total 2,606,722,000 2,607<br />
Ophiocytium 56,000 0 Gloeocystis 110,000 0 Total 4,801,919,000 4,802 Rotifera 67,000 0.067<br />
Coelosphaerium 56,000 0 Stephanodiscus 110,000 0 Sphaerocystis 33,000 0.033<br />
Closteriopsis 56,000 0 Total 1,407,730,000 1,408 Staurastrum 33,000 0.033<br />
Navicula 56,000 0 Scenedesmus 33,000 0.033<br />
Copepoda 28,000 0 Total 2,021,993,000 2,022<br />
Nematoda 28,000 0<br />
Total 1,816,184,000 1,816<br />
Page 3 of 18
Lake Merced North<br />
18-Dec-01<br />
5-Mar-02<br />
30-Apr-02 18-Jun-02 23-Aug-02<br />
Organism No./m 3 No./mL Organism No./m 3 No./mL Organism No./m 3 No./mL Organism No./m 3 No./mL Organism No./m 3 No./mL<br />
Oscillatoria 1,100,000,000 1,100 Oscillatoria (50:1 dil) 960,000,000 960 Oscillatoria 1,300,000,000 1,300 Oscillatoria 580,000,000 580 Oscillatoria(50:1dil) 1,000,000,000 1,000<br />
Melosira 2,000,000 2 Anabaena 380,000 0.380 Anabaena 82,000,000 82 Anabaena 19,000,000 19 Anabaena 1,100,000 1<br />
Ankistrodesmus 230,000 0.230 Nauplius 230,000 0.230 Melosira 17,000,000 17 Melosira 3,500,000 4 Mougeotia 1,000,000 1<br />
Closterium 210,000 0.210 Rotifera 140,000 0.140 Ankistrodesmus 1,100,000 1 Synedra 400,000 0.400 Melosira 310,000 0.310<br />
Anabaena 100,000 0.100 Ankistrodesmus 110,000 0.110 Closterium 980,000 1 Closterium 290,000 0.290 Rotifera 280,000 0.280<br />
Fragilaria 63,000 0.063 Synedra 67,000 0.067 Cyclotella 46,000 0.046 Ankistrodesmus 230,000 0.230 Coelosphaerium 280,000 0.280<br />
Copepoda 21,000 0.021 Copepoda 67,000 0.067 Copepoda 46,000 0.046 Copepoda 90,000 0.090 Nauplius 130,000 0.130<br />
Epithemia 21,000 0.021 Stephanodiscus 45,000 0.045 Nauplius 23,000 0.023 Cyclotella 90,000 0.090 Copepoda 100,000 0.100<br />
Nauplius 21,000 0.021 Closterium 45,000 0.045 Fragilaria 23,000 0.023 Nauplius 72,000 0.072 Closterium 77,000 0.077<br />
Total 1,102,666,000 1,103 Mallomonas 23,000 0.023 Staurastrum 23,000 0.023 Rotifera 18,000 0.018 Cladocera 26,000 0.026<br />
Staurastrum 23,000 0.023 Ceratium 23,000 0.023 Total 603,690,000 604 Anacystis 26,000 0.026<br />
Cladocera 23,000 0.023 Rotifera 23,000 0.023 Gloeocystis 26,000 0.026<br />
Scenedesmus 23,000 0.023 Epithemia 23,000 0.023 Navicula 26,000 0.026<br />
Fragilaria 23,000 0.023 Total 1,401,310,000 1,401 Scenedesmus 26,000 0.026<br />
Anacystis 23,000 0.023 Total 1,006,814,000 1,007<br />
Total 961,222,000 961<br />
D.3-134<br />
Lake Merced North East<br />
18-Dec-01<br />
5-Mar-02<br />
30-Apr-02 18-Jun-02 23-Aug-02<br />
Organism No./m 3 No./mL Organism No./m 3 No./mL Organism No./m 3 No./mL Organism No./m 3 No./mL Organism No./m 3 No./mL<br />
Oscillatoria 1,800,000,000 1,800 Oscillatoria (50:1 dil) 1,800,000,000 1,800 Oscillatoria 1,900,000,000 1,900 Oscillatoria 3,500,000,000 3,500 Oscillatoria (20:1 dil) 1,300,000,000 1,300<br />
Melosira 6,300,000 6 Melosira 1,900,000 2 Melosira 73,000,000 73 Anabaena 18,000,000 18 Melosira 2,100,000 2<br />
Ankistrodesmus 1,500,000 2 Rotifera 660,000 0.660 Anabaena 7,500,000 8 Melosira 16,000,000 16 Mougeotia 1,500,000 2<br />
Closterium 300,000 0.300 Closterium 540,000 0.540 Closterium 1,600,000 2 Synedra 820,000 0.820 Anabaena 690,000 0.690<br />
Rotifera 130,000 0.130 Ankistrodesmus 370,000 0.370 Ankistrodesmus 1,200,000 1.200 Ankistrodesmus 620,000 0.620 Ankistrodesmus 240,000 0.240<br />
Fragilaria 67,000 0.067 Nauplius 250,000 0.250 Rotifera 340,000 0.340 Closterium 270,000 0.270 Closterium 180,000 0.180<br />
Staurastrum 67,000 0.067 Stephanodiscus 210,000 0.210 Copepoda 300,000 0.300 Rotifera 140,000 0.140 Cladocera 120,000 0.120<br />
Nauplius 34,000 0.034 Copepoda 170,000 0.170 Coelosphaerium 110,000 0.110 Staurastrum 100,000 0.100 Rotifera 120,000 0.120<br />
Total 1,808,398,000 1,808 Anacystis 83,000 0.083 Nauplius 75,000 0.075 Nauplius 100,000 0.100 Mallomonas 90,000 0.090<br />
Anabaena 42,000 0.042 Scenedesmus 75,000 0.075 Copepoda 34,000 0.034 Synedra 90,000 0.090<br />
Synedra 42,000 0.042 Cymbella 37,000 0.037 Total 3,536,084,000 3,536 Copepoda 90,000 0.090<br />
Scenedesmus 42,000 0.042 Epithemia 37,000 0.037 Coelosphaerium 90,000 0.090<br />
Gloeocystis 42,000 0.042 Synedra 37,000 0.037 Ceratium 30,000 0.030<br />
Total 1,804,351,000 1,804 Total 1,984,311,000 1,984 Nauplius 30,000 0.030<br />
Cymbella 30,000 0.030<br />
Scenedesmus 30,000 0.030<br />
Pinnularia 30,000 0.030<br />
Total 1,305,460,000 1,305<br />
Page 4 of 18
Lake Merced North<br />
23-Oct-02 11-Feb-03 14-May-03<br />
Organism No./m 3 No./mL Organism No./m 3 No./mL Organism No./m 3 No./mL Organism No./m 3 No./mL Organism No./m 3 No./mL<br />
Oscillatoria 1,500,000,000 1,500 Oscillatoria 1,700,000,000 1,700 Oscillatoria 1,600,000,000 1,600 Oscillatoria 1,400,000,000 1,400 Oscillatoria 980,000,000 980<br />
Melosira 3,100,000 3 Melosira 3,200,000 3 Melosira 3,600,000 4 Anabaena 7,400,000 7 Anabaena 1,400,000 1.400<br />
Anabaena 2,700,000 3 Ankistrodesmus 130,000 0.130 Anabaena 1,500,000 2 Melosira 900,000 0.900 Melosira 290,000 0.290<br />
Closterium 500,000 0.500 Closterium 130,000 0.130 Synedra 710,000 0.710 Ankistrodesmus 230,000 0.230 Closterium 150,000 0.150<br />
Ankistrodesmus 150,000 0.150 Copepoda 25,000 0.025 Ankistrodesmus 630,000 0.630 Closterium 120,000 0.120 Copepoda 77,000 0.077<br />
Nauplius 88,000 0.088 Nauplius 25,000 0.025 Closterium 490,000 0.490 Copepoda 100,000 0.100 Nauplius 46,000 0.046<br />
Copepoda 59,000 0.059 Cymbella 25,000 0.025 Cyclotella 220,000 0.220 Nauplius 84,000 0.084 Rotifera 31,000 0.031<br />
Scenedesmus 29,000 0.029 Rotifera 25,000 0.025 Scenedesmus 110,000 0.110 Rotifera 63,000 0.063 Epithemia 31,000 0.031<br />
Total 1,506,626,000 1,507 Scenedesmus 25,000 0.025 Rotifera 82,000 0.082 Stephanodiscus 63,000 0.063 Synedra 31,000 0.031<br />
Total 1,703,585,000 1,704 Cymbella 27,000 0.027 Scenedesmus 42,000 0.042 Cymbella 15,000 0.015<br />
Staurastrum 27,000 0.027 Synedra 42,000 0.042 Scenedesmus 15,000 0.015<br />
Fragilaria 27,000 0.027 Spirolina 21,000 0.021 Total 982,086,000 982<br />
Total 1,607,423,000 1,607 Total 1,409,065,000 1,409<br />
15-Jul-03<br />
30-Sep-03<br />
D.3-135<br />
Lake Merced North East<br />
23-Oct-02 11-Feb-03 14-May-03<br />
Organism No./m 3 No./mL Organism No./m 3 No./mL Organism No./m 3 No./mL Organism No./m 3 No./mL<br />
Oscillatoria 2,300,000,000 2,300 Oscillatoria 1,700,000,000 1,700 Oscillatoria 1,700,000,000 1,700 Oscillatoria 1,900,000,000 1,900<br />
Melosira 3,400,000 3 Melosira 1,800,000 2 Melosira 6,700,000 7 Melosira 5,500,000 6<br />
Anabaena 1,300,000 1.300 Ankistrodesmus 220,000 0.220 Anabaena 5,800,000 6 Anabaena 300,000 0.300<br />
Closterium 760,000 0.760 Rotifera 220,000 0.220 Closterium 790,000 0.790 Closterium 240,000 0.240<br />
Ankistrodesmus 610,000 0.610 Nauplius 190,000 0.190 Ankistrodesmus 400,000 0.400 Rotifera 180,000 0.180<br />
Copepoda 230,000 0.230 Closterium 160,000 0.160 Synedra 220,000 0.220 Ankistrodesmus 150,000 0.150<br />
Nauplius 150,000 0.150 Synedra 120,000 0.120 Fragilaria 110,000 0.110 Synedra 150,000 0.150<br />
Rotifera 110,000 0.110 Cymbella 31,000 0.031 Nauplius 85,000 0.085 Copepoda 89,000 0.089<br />
Synedra 38,000 0.038 Total 1,702,741,000 1,703 Scenedesmus 85,000 0.085 Staurastrum 30,000 0.030<br />
Cymbella 38,000 0.038 Staurastrum 56,000 0.056 Nauplius 30,000 0.030<br />
Ophiocytium 38,000 0.038 Cynbella 56,000 0.056 Navicula 30,000 0.030<br />
Total 2,306,674,000 2,307 Copepoda 28,000 0.028 Ophiocytium 30,000 0.030<br />
Ceratium 28,000 0.028 Stephanodiscus 30,000 0.030<br />
Rotifera 28,000 0.028 Sphaerocystis 30,000 0.030<br />
Total 1,714,386,000 1,714 Total 1,906,789,000 1,907<br />
15-Jul-03<br />
30-Sep-03<br />
Page 5 of 18
Lake Merced North<br />
2-Dec-03 27-May-04 29-Aug-04 27-Oct-04<br />
9-Dec-04 9-Feb-05 18-Apr-05<br />
Organism No./m 3 No./mL Organism No./mL Organism No./mL Organism No./mL Organism No./mL Organism No./mL Organism No./mL<br />
Oscillatoria 890,000,000 890 Melosira 18 Coelosphaerium 60 Oscillatoria 100 Oscillatoria 24 Asterionella 140 Oscillatoria 9.1<br />
Anabaena 440,000 0.440 Oscillatoria 5 Fragilaria 14 Anabaena 88 Anabaena 9.6 Oscillatoria 140 Ceratium 0.83<br />
Mougeotia 128,719 0.129 Ceratium 3.7 Anabaena 4.4 Fragilaria 11 Coelosphaerium 0.77 Anabaena 8.2 Anabaena 0.54<br />
Nauplius 100,000 0.100 Sphaerocystis 1.1 Melosira 1.9 Stephanodiscus 3.5 Melosira 0.44 Stephanodiscus 3.4 Sphaerocystis 0.38<br />
Ankistrodesmus 100,000 0.100 Anabaena 0.55 Aphanizomenon 1.5 Melosira 1.1 Stephanodiscus 0.2 Closterium 1.3 Synedra 0.064<br />
Rotifera 77,000 0.077 Copepoda 0.2 Asterionella 0.77 Coelosphaerium 0.7 Staurastrum 0.11 Melosira 0.61 Asterionella 0.064<br />
Stephanodiscus 51,000 0.051 Synedra 0.18 Cyclotella 0.13 Rotifera 0.47 Closterium 0.11 Coelosphaerium 0.49 Coelosphaerium 0.048<br />
Closterium 51,000 0.051 Fragilaria 0.13 Ceratium 0.077 Staurastrum 0.28 Asterionella 0.086 Ceratium 0.2 Cyclotella 0.024<br />
Copepoda 26,000 0.026 Nauplius 0.18 Staurastrum 0.077 Nauplius 0.1 Cladocera 0.086 Synedra 0.14 Tabellaria 0.024<br />
Mallomonas 26,000 0.026 Zygnema 0.05 Oscillatoria 0.051 Copepoda 0.073 Copepoda 0.071 Fragilaria 0.098 Copepoda 0.016<br />
Staurastrum 26,000 0.026 Mallomonas 0.034 Gloeocystis 0.051 Cladocera 0.058 Fragilaria 0.057 Rotifera 0.039 Fragilaria 0.016<br />
Cladocera 26,000 0.026 Staurastrum 0.034 Synedra 0.026 Sphaerocystis 0.029 Ceratium 0.057 Pediastrum 0.039 Stephanodiscus 0.016<br />
Scenedesmus 26,000 0.026 Anacystis 0.017 Cladocera 0.026 Ceratium 0.014 Cyclotella 0.057 Staurastrum 0.039 Pediastrum 0.008<br />
Fragilaria 26,000 0.026 Coelosphaerium 0.017 Closterium 0.026 Asterionella 0.014 Nauplius 0.028 Epithemia 0.02 Staurastrum 0.008<br />
Anacystis 26,000 0.026 Total 29.192 Copepoda 0.026 Synedra 0.014 Synedra 0.028 Total 294.575 Melosira 0.008<br />
Total 891,129,719 891 Total 83.06 Cymbella 0.014 Pediastrum 0.014 Desmidium 0.008<br />
Closterium 0.014 Rotifera 0.014 Total 11.154<br />
Total 205.38 Total 35.728<br />
D.3-136<br />
Lake Merced North East<br />
2-Dec-03 27-May-04 29-Aug-04 27-Oct-04<br />
9-Dec-04 9-Feb-05 18-Apr-05<br />
Organism No./m 3 No./mL Organism No./mL Organism No./mL Organism No./mL Organism No./mL Organism No./mL Organism No./mL<br />
Oscillatoria 1,100,000,000 1,100 Oscillatoria 520 Oscillatoria 350 Oscillatoria 310 Oscillatoria 350 Oscillatoria 350 Oscillatoria 640<br />
Anabaena 340,000 0.340 Melosira 2.3 Coelosphaerium 7.4 Anabaena 5.5 Anabaena 15 Asterionella 33 Anabaena 8.6<br />
Nauplius 170,000 0.170 Anabaena 1.1 Anabaena 2.3 Stephanodiscus 4.4 Stephanodiscus 2.7 Stephanodiscus 4.3 Aphanizomenon 5.5<br />
Melosira 140,000 0.140 Ceratium 0.4 Ceratium 2.1 Closterium 4.1 Synedra 0.61 Synedra 3.7 Stephanodiscus 1.5<br />
Mougeotia 140,000 0.140 Rotifera 0.25 Melosira 1.4 Fragilaria 1 Closterium 0.52 Anabaena 0.59 Ceratium 0.77<br />
Closterium 100,000 0.100 Synedra 0.15 Fragilaria 0.87 Synedra 0.78 Coelosphaerium 0.3 Closterium 0.51 Closterium 0.55<br />
Rotifera 69,000 0.069 Closterium 0.13 Synedra 0.82 Melosira 0.64 Asterionella 0.26 Melosira 0.18 Asterionella 0.29<br />
Stephanodiscus 69,000 0.069 Nauplius 0.1 Asterionella 0.46 Rotifera 0.36 Melosira 0.16 Rotifera 0.12 Melosira 0.27<br />
Copepoda 69,000 0.069 Pennate Diatom 0.1 Ophiocytium 0.1 Asterionella 0.32 Nauplius 0.07 Coelosphaerium 0.1 Cyclotella 0.22<br />
Coelosphaerium 69,000 0.069 Fragilaria 0.076 Copepoda 0.051 Coelosphaerium 0.11 Cladocera 0.07 Staurastrum 0.081 Staurastrum 0.18<br />
Ankistrodesmus 34,000 0.034 Cladocera 0.076001 Closterium 0.051 Staurastrum 0.085 Staurastrum 0.047 Cladocera 0.061 Rotifera 0.18<br />
Synedra 34,000 0.034 Anacystis 0.076002 Nauplius 0.051 Ceratium 0.085 Copepoda 0.047 Cymbella 0.041 Coelosphaerium 0.13<br />
Scenedesmus 34,000 0.034 Sphaerocystis 0.076003 Cladocera 0.026 Cymbella 0.021 Rotifera 0.023 Ceratium 0.02 Fragilaria 0.11<br />
Cyclotella 34,000 0.034 Coelosphaerium 0.05 Total 365.629 Total 327.401 Fragilaria 0.023 Total 392.703 Nauplius 0.11<br />
Total 1,101,302,000 1,101.302 Copepoda 0.025 Ceratium 0.023 Synedra 0.088<br />
Zygnema 0.025 Total 369.853 Copepoda 0.066<br />
Total 524.934006 Sphaerocystis 0.044<br />
Total 658.608<br />
Page 6 of 18
Lake Merced North<br />
23-Jun-05 17-Aug-05 28-Sep-05<br />
31-Oct-05 29-Nov-05 29-Dec-05 23-Jan-06 1-Mar-06<br />
Organism No./mL Organism No./m3 Organism No./mL Organism No./m 3 No./mL Organism No./mL Organism No./mL Organism No./mL<br />
Oscillatoria (20:1dil) 290 Oscillatoria 270 Oscillatoria 480 Oscillatoria 280,000,000 280 Oscillatoria 460 Oscillatoria 360 Oscillatoria 190 Oscillatoria 260<br />
Anabaena 4 Closterium 17 Anabaena 24.000 Anabaena 2,100,000 2 Closterium 4.3 Melosira 16<br />
Aphanizomenon 1 Melosira 3.1 Ceratium 5.100 Ceratium 860,000 1 Synedra 0.45 Anabaena 14<br />
Stephanodiscus 0.47 Anabaena 2.8 Nauplius 4.800 Cladoceran 170,000 0.17 Stephanodiscus 0.36 Closterium 12<br />
Melosira 0.36 Ceratium 0.37 Rotifera 0.250 Nauplius 130,000 0.13 Ceratium 0.34 Asterionella 4.3<br />
Nauplius 0.17 Stephanodiscus 0.21 Copepoda 0.170 Rotifer 77,000 0.08 Melosira 0.34 Total 306<br />
Fragilaria 0.13 Copepoda 0.093 Cladocera 0.084 Copepod 58,000 0.06 Copepoda 0.23<br />
Copepoda 0.13 Nauplius 0.093 Mallomonas 0.084 Total 283,395,000 283 Rotifera 0.18<br />
Closterium 0.13 Ankistrodesmus 0.093 Total 514.000 Nauplius 0.16<br />
Rotifera 0.086 Synedra 0.093 Anabaena 0.14<br />
Ceratium 0.021 Rotifera 0.046 Coelosphaerium 0.11<br />
Nitzschia 0.021 Epithemia 0.023 Cladocera 0.09<br />
Scenedesmus 0.021 Staurastrum 0.023 Pediastrum 0.023<br />
Total 296.539 Cladocera 0.023 Asterionella 0.023<br />
Pediastrum 0.023 Ophiocytium 0.023<br />
Total 293.99 Total 466.769<br />
D.3-137<br />
Lake Merced North East<br />
23-Jun-05 17-Aug-05 28-Sep-05<br />
31-Oct-05 29-Nov-05 29-Dec-05 23-Jan-06<br />
Organism No./mL Organism No./m3 Organism No./mL Organism No./m3 No./mL Organism No./mL Organism No./mL Organism No./mL Organism No./mL<br />
Oscillatoria (20:1 dil) 40 Oscillatoria 650 Oscillatoria 590 Oscillatoria 290,000,000 290 Oscillatoria 450 Oscillatoria 430 Asterionella 160 Oscillatoria 500<br />
Anabaena 14 Melosira 6.3 Anabaena 3.1 Ceratium 1,700,000 2 Closterium 7.0 Ceratium 19 Synedra 5.9<br />
Aphanizomenon 2.1 Closterium 5.0 Melosira 1.7 Anabaena 1,300,000 1 Ceratium 1.2 Oscillatoria 5.1 Total 506<br />
Melosira 0.47 Anabaena 0.76 Rotifer 0.34 Melosira 700,000 1 Stephanodiscus 0.220 Cyclotella 1.3<br />
Rotifera 0.26 Stephanodiscus 0.55 Ceratium 0.26 Ankistrodesmus 690,000 1 Rotifera 0.190 Copepoda 1.3<br />
Closterium 0.26 Synedra 0.45 Nauplius 0.26 Nauplius 200,000 0.20 Nauplius 0.160 Cladocera 1.3<br />
Fragilaria 0.21 Ceratium 0.24 Copepoda 0.087 Rotifera 86,000 0.09 Cladocera 0.160 Total 188<br />
Stephanodiscus 0.21 Nauplius 0.21 Total 596 Stephanodiscus 86,000 0.09 Asterionella 0.064<br />
Nauplius 0.13 Rotifera 0.17 Cladocera 29,000 0.03 Copepoda 0.064<br />
Copepoda 0.064 Sphaerocystis 0.17 Total 294,791,000 295 Pediastrum 0.032<br />
Sphaerocystis 0.064 Copepoda 0.10 Total 918.020<br />
Ceratium 0.043 Fragilaria 0.034<br />
Asterionella 0.043 Pinnularia 0.034<br />
Coelosphaerium 0.043 Asterionella 0.034<br />
Dinobryon 0.021 Total 664<br />
Total 57.918<br />
1-Mar-06<br />
Page 7 of 18
Lake Merced North<br />
26-Apr-06<br />
14-Jun-06 24-Aug-06 25-Oct-06 20-Dec-06 29-Mar-07 26-Jun-07<br />
20-Aug-07 27-Dec-07 28-Mar-08<br />
Organism No./mL Organism No./mL Organism No./mL Organism No./mL Organism No./mL Organism No./mL Organism No./mL Organism No./mL Organism No./mL Organism No./mL<br />
Oscillatoria 320 Oscillatoria 490 Oscillatoria 230 Oscillatoria 680 Oscillatoria 1100 Oscillatoria 1300 Oscillatoria 1570 Oscillatoria 300 Oscillatoria 44<br />
Anabaena 64 Dictyosphaerium 7.4 Melosira 4.6<br />
Synedra 4.7 Total 307.4 49<br />
Closterium 0.79<br />
Total 389<br />
Lake Merced North East<br />
26-Apr-06 14-Jun-06 24-Aug-06 25-Oct-06<br />
20-Dec-06<br />
29-Mar-07 26-Jun-07<br />
20-Aug-07 27-Dec-07 28-Mar-08<br />
Organism No./mL Organism No./mL Organism No./mL Organism No./mL Organism No./mL Organism No./mL Organism No./mL Organism No./mL Organism No./mL Organism No./mL<br />
Oscillatoria 540 Oscillatoria 460 Oscillatoria 870 Oscillatoria 1100 Oscillatoria 1400 Oscillatoria 1680 Oscillatoria 270 Oscillatoria 4.7<br />
Melosira 1.8<br />
Total 6.5<br />
D.3-138<br />
Page 8 of 18
Lake Merced North<br />
10-Jun-08 24-Sep-08 4-Dec-08 24-Mar-09<br />
4-Jun-09<br />
22-Sep-09<br />
15-Dec-09<br />
Organism No./mL Organism No./mL Organism No./mL Organism No./mL Organism No./mL Organism No./mL Organism No./mL<br />
Oscillatoria 128 Oscillatoria 22.8 Oscillatoria 160 Oscillatoria 410 Oscillatoria 990 Oscillatoria 1000 Oscillatoria 410<br />
Lake Merced North East<br />
10-Jun-08 24-Sep-08 4-Dec-08<br />
24-Mar-09<br />
4-Jun-09<br />
22-Sep-09<br />
15-Dec-09<br />
Organism No./mL Organism No./mL Organism No./mL Organism No./mL Organism No./mL Organism No./mL Organism No./mL<br />
Oscillatoria 74.6 Oscillatoria 29.4 Oscillatoria 120 Oscillatoria 610 Oscillatoria 1200 Oscillatoria 12000 Oscillatoria 550<br />
D.3-139<br />
Page 9 of 18
Lake Merced South - Pistol Range<br />
15-May-97 10-Sep-97 3-Dec-97 16-Mar-98 8-Jul-98 17-Mar-99<br />
Organism No./cuM No./mL Organism No./cuM No./mL Organism No./cuM No./mL Organism No./cuM No./mL Organism No./cuM No./mL Organism No./m 3 No./mL<br />
Oscillatoria 1,300,000,000 1,300 Oscillatoria 390,000,000 390 Oscillatoria 1,000,000,000 1,000 Oscillatoria 540,000,000 540 Oscillatoria (1:50 dilution) 240,000,000 240 Oscillatoria 51,000,000 51<br />
Anabaena 7,500,000 7.5 Anabaena 7,100,000 7 Anabaena 1,200,000 1 Rotifer 130,000 0 Ulothrix 13,000,000 13 Mougeotia 110,000 0<br />
Ceratium 300,000 0.30 Total 397,100,000 397 Copepod 86,000 0 Anabaena 78,000 0 Anabaena 1,200,000 1 Asterionella 840,000 1<br />
Copepoda 138,000 0.14 Rotifer 64,000 0 Copepod 65,000 0 Melosira 1,100,000 1 Closterium 30,000 0<br />
Staurastrum 138,000 0.14 Ceratium 43,000 0 Total 540,273,000 540 Nauplius 170,000 0 Nauplius 30,000 0<br />
Rotifera 79,000 0.079 Total 1,001,393,000 1,001 Copepod 150,000 0 Spirulina 23,000 0<br />
Total 1,308,155,000 1,308 Total 255,620,000 256 Copepoda 23,000 0<br />
Actinastrum 15,000 0<br />
Anabaena 15,000 0<br />
Navicula 7,600 0<br />
Fragilaria 7,600 0<br />
Synedra 7,600 0<br />
Anacystis 7,600 0<br />
Staurastrum 7,600 0<br />
Total 52,124,000 52<br />
D.3-140<br />
Lake Merced South - Pump Station<br />
15-May-97 10-Sep-97 3-Dec-97 16-Mar-98 8-Jul-98 17-Mar-99<br />
Organism No./cuM No./mL Organism No./cuM No./mL Organism No./cuM No./mL Organism No./cuM No./mL Organism No./cuM No./mL Organism No./m 3 No./mL<br />
Oscillatoria 1,000,000,000 1,000 Oscillatoria 290,000,000 290 Oscillatoria 1,000,000,000 1,000 Oscillatoria 87,000,000 87 Oscillatoria (1:50 dilution) 360,000,000 360 Oscillatoria 60,000,000 60<br />
Anabaena 8,100,000 8 Anabaena 220,000 0 Anabaena 620,000 1 Anabaena 28,000 0 Ulothrix 7,900,000 8 Mougeotia 130,000 0<br />
Ceratium 180,000 0 Dinobryon 56,000 0 Copepod 94,000 0 Mougeotia 28,000 0 Anabaena 2,000,000 2 Asterionella 100,000 0<br />
Copepod 39,000 0 Copepod 21,000 0 Rotifer 19,000 0 Rotifer 14,000 0 Melosira 890,000 1 Copepoda 46,000 0<br />
Total 1,008,319,000 1,008 Total 290,297,000 290 Total 1,000,733,000 1,001 Total 87,070,000 87 Copepod 90,000 0 Actinastrum 46,000 0<br />
Nauplius 90,000 0 Spirulina 28,000 0<br />
Total 370,970,000 371 Nauplius 18,000 0<br />
Rotifer 18,000 0<br />
Closterium 18,000 0<br />
Ankistrodesmus 18,000 0<br />
Staurastrum 18,000 0<br />
Ceratium 9,200 0<br />
Anabaena 9,200 0<br />
Synedra 9,200 0<br />
Total 60,467,600 60<br />
Page 10 of 18
Lake Merced South - Pistol Range<br />
21-Jun-99<br />
15-Sep-99<br />
8-Dec-99 21-Mar-00 21-Jun-00<br />
Organism No./m 3 No./mL Organism No./m 3 No./mL Organism No./m 3 No./mL Organism No./m 3 No./mL Organism No./m 3 No./mL<br />
Oscillatoria 500,000,000 500 Oscillatoria 450,000,000 450 Oscillatoria 868,706,613 869 Oscillatoria 1,600,000,000 1,600 Oscillatoria 370,000,000 370<br />
Mougeotia 2,500,000 3 Anabaena 8,900,000 9 Mougeotia 251,495 0 Melosira 2,900,000 3 Anabaena 11,000,000 11<br />
Anabaena 2,000,000 2 Mougeotia 600,000 1 Spirulina 188,621 0 Anabaena 2,500,000 3 Melosira 1,700,000 2<br />
Spirulina 320,000 0 Spirulina 380,000 0 Anabaena 167,664 0 Closterium 2,500,000 3 Mougeotia 320,000 0<br />
Closteridium 230,000 0 Mallomonas 220,000 0 Scenedesmus 104,790 0 Mougeotia 1,800,000 2 Chlorella 160,000 0<br />
Closterium 200,000 0 Fragilaria 160,000 0 Closterium 62,874 0 Synedra 730,000 1 Ankistrodesmus 150,000 0<br />
Scenedesmus 120,000 0 Anacystis 140,000 0 Microcystis 62,874 0 Scenedesmus 730,000 1 Closterium 84,000 0<br />
Gomphosphaeria 73,000 0 Copepoda 99,000 0 Nauplius 41,916 0 Microcystis 360,000 0 Closteriopsis 84,000 0<br />
Rotifer 29,000 0 Staurastrum 99,000 0 Naviculoid Diatom 41,916 0 Nauplius 360,000 0 Nauplius 66,000 0<br />
Copepoda 29,000 0 Naviculoid Diatom 79,000 0 Actinastrum 20,958 0 Staurastrum 360,000 0 Copepoda 56,000 0<br />
Navicula 14,000 0 Gomphosphaeria 79,000 0 Rotifer 20,958 0 Total 1,612,240,000 1,612 Navicula 56,000 0<br />
Staurastrum 14,000 0 Cyclotella 40,000 0 Pinnularia 20,958 0 Coelosphaerium 47,000 0<br />
Synedra 14,000 0 Closterium 40,000 0 Cymbella 20,958 0 Scenedesmus 38,000 0<br />
Nauplius 14,000 0 Nauplius 40,000 0 Copepoda 20,958 0 Coelastrum 19,000 0<br />
Cymbella 14,000 0 Actinastrum 20,000 0 Total 869,733,552 870 Amphora 19,000 0<br />
Total 505,571,000 506 Scenedesmus 20,000 0 Dinobryon 9,400 0<br />
Pinnularia 20,000 0 Staurastrum 9,400 0<br />
Tetraedron 20,000 0 Cladocera 9,400 0<br />
Total 460,956,000 461 Pinnularia 9,400 0<br />
Synedra 9,400 0<br />
Total 383,846,000 384<br />
D.3-141<br />
Lake Merced South - Pump Station<br />
21-Jun-99 15-Sep-99 8-Dec-99 21-Mar-00 21-Jun-00<br />
Organism No./m 3 No./mL Organism No./m 3 No./mL Organism No./m 3 No./mL Organism No./m 3 No./mL Organism No./m 3 No./mL<br />
Oscillatoria 660,000,000 660 Oscillatoria 590,000,000 590 Oscillatoria 1,060,499,160 1,060 Oscillatoria 1,600,000,000 1,600 Oscillatoria 330,000,000 330<br />
Anabaena 3,200,000 3 Anabaena 23,000,000 23 Spirulina 362,449 0 Melosira 3,100,000 3 Anabaena 12,000,000 12<br />
Mougeotia 1,900,000 2 Spirulina 1,300,000 1 Mougeotia 93,968 0 Synedra 1,600,000 2 Melosira 2,000,000 2<br />
Spirulina 550,000 1 Mougeotia 500,000 1 Microcystis 80,544 0 Anabaena 1,500,000 2 Coelosphaerium 110,000 0<br />
Closteridium 280,000 0 Gomphosphaeria 120,000 0 Anabaena 67,120 0 Scenedesmus 1,000,000 1 Copepoda 99,000 0<br />
Closterium 260,000 0 Ceratium 99,000 0 Naviculoid Diatom 53,696 0 Mougeotia 1,000,000 1 Chlorella 99,000 0<br />
Scenedesmus 94,000 0 Anacystis 99,000 0 Pinnularia 40,272 0 Total 1,608,200,000 1,608 Closterium 99,000 0<br />
Copepoda 47,000 0 Ankistrodesmis 99,000 0 Gleocystis 13,424 0 Ankistrodesmus 55,000 0<br />
Navicula 47,000 0 Closterium 79,000 0 Fragilaria 13,424 0 Fragilaria 44,000 0<br />
Synedra 31,000 0 Staurastrum 60,000 0 Total 1,061,224,058 1,061 Ceratium 44,000 0<br />
Anacystis 16,000 0 Cymbella 40,000 0 Synedra 33,000 0<br />
Gomphosphaeria 16,000 0 Nauplius 40,000 0 Nauplius 33,000 0<br />
Epithemia 16,000 0 Mallomonas 40,000 0 Rotifera 33,000 0<br />
Pinnularia 16,000 0 Tetraedron 20,000 0 Navicula 33,000 0<br />
Total 666,473,000 666 Copepoda 20,000 0 Dinobryon 33,000 0<br />
Fragilaria 20,000 0 Polyblepharides 22,000 0<br />
Pinnularia 20,000 0 Staurastrum 22,000 0<br />
Actinastrum 20,000 0 Caloneis 11,000 0<br />
Total 615,576,000 616 Total 344,770,000 345<br />
Page 11 of 18
Lake Merced South - Pistol Range<br />
9-Aug-00 19-Dec-00 7-Mar-01 20-Jun-01 1-Oct-01<br />
Organism No./m 3 No./mL Organism No./m 3 No./mL Organism No./m 3 No./mL Organism No./m 3 No./mL Organism No./m 3 No./mL<br />
Oscillatoria 1,300,000,000 1,300 Oscillatoria* (dil 10x) 400,000,000 400 Oscillatoria 520,000,000 520 Oscillatoria 840,000,000 840 Oscillatoria 1,300,000,000 1,300<br />
Anabaena 5,500,000 6 Mougeotia 600,000 1 Melosira 3,800,000 4 Anabaena 6,800,000 7 Anabaena 8,600,000 9<br />
Melosira 1,400,000 1 Melosira 490,000 0 Closterium 180,000 0 Melosira 2,200,000 2 Melosira 2,400,000 2<br />
Ankistrodesmus 200,000 0 Closterium 330,000 0 Anacystis 140,000 0 Stephanodiscus 1,700,000 2 Coelosphaerium 240,000 0<br />
Coelosphaerium 180,000 0 Anacystis 270,000 0 Synedra 120,000 0 Cyclotella 1,100,000 1 Ankistrodesmus 96,000 0<br />
Mougeotia 160,000 0 Coelosphaerium 190,000 0 Anabaena 53,000 0 Aphanizomenon 1,100,000 1 Closterium 96,000 0<br />
Closteriopsis 130,000 0 Anabaena 120,000 0 Copepoda 35,000 0 Dinobryon 470,000 0 Rotifera 72,000 0<br />
Actinastrum 110,000 0 Pinnularia 62,000 0 Nauplius 35,000 0 Fragilaria 420,000 0 Ceratium 72,000 0<br />
Synedra 72,000 0 Epithemia 62,000 0 Rotifera 35,000 0 Anacystis 210,000 0 Copepoda 24,000 0<br />
Copepoda 54,000 0 Copepoda 41,000 0 Ankistrodesmus 18,000 0 Coelosphaerium 150,000 0 Scenedesmus 24,000 0<br />
Scenedesmus 18,000 0 Rotifera 41,000 0 Navicula 18,000 0 Rotifera 130,000 0 Total 1,311,624,000 1,312<br />
Amphora 18,000 0 Synedra 41,000 0 Cymbella 18,000 0 Copepoda 95,000 0<br />
Closterium 18,000 0 Nauplius 21,000 0 Cocconeis 18,000 0 Closterium 95,000 0<br />
Total 1,307,860,000 1,308 Ankistrodesmus 21,000 0 Total 524,470,000 524 Staurastrum 76,000 0<br />
Navicula 21,000 0 Gloeocystis 76,000 0<br />
Total 402,310,000 402 Nauplius 57,000 0<br />
Kirchneriella 38,000 0<br />
Synedra 38,000 0<br />
Synedra 38,000 0<br />
Ceratium 19,000 0<br />
Epithemia 19,000 0<br />
Tetraedron 19,000 0<br />
Total 854,850,000 855<br />
D.3-142<br />
Lake Merced South - Pump Station<br />
9-Aug-00<br />
19-Dec-00 7-Mar-01 20-Jun-01 1-Oct-01<br />
Organism No./m 3 No./mL Organism No./m 3 No./mL Organism No./m 3 No./mL Organism No./m 3 No./mL Organism No./m 3 No./mL<br />
Oscillatoria 1,300,000,000 1,300 Oscillatoria (dil 10x) 450,000,000 450 Oscillatoria 570,000,000 570 Oscillatoria (dil 50:1) 870,000,000 870 Oscillatoria 990,000,000 990<br />
Anabaena 7,300,000 7 Melosira 550,000 1 Melosira 4,000,000 4 Anabaena 3,000,000 3 Melosira 1,800,000 2<br />
Melosira 1,300,000 1 Mougeotia 450,000 0 Closterium 190,000 0 Melosira 2,100,000 2 Anabaena 590,000 1<br />
Coelosphaerium 270,000 0 Copepoda 130,000 0 Synedra 140,000 0 Aphanizomenon 650,000 1 Dictyosphaerium 540,000 1<br />
Ankistrodesmus 200,000 0 Anacystis 130,000 0 Scenedesmus 85,000 0 Fragilaria 550,000 1 Ankistrodesmus 280,000 0<br />
Mougeotia 98,000 0 Coelosphaerium 85,000 0 Anacystis 51,000 0 Anacystis 450,000 0 Closterium 240,000 0<br />
Synedra 39,000 0 Closterium 85,000 0 Ankistrodesmus 51,000 0 Dinobryon 380,000 0 Rotifera 160,000 0<br />
Copepoda 20,000 0 Anabaena 64,000 0 Anabaena 51,000 0 Cyclotella 280,000 0 Cyclotella 71,000 0<br />
Closteriopsis 20,000 0 Rotifera 43,000 0 Nauplius 51,000 0 Coelosphaerium 120,000 0 Copepoda 47,000 0<br />
Epithemia 20,000 0 Pinnularia 43,000 0 Fragilaria 34,000 0 Kirchneriella 120,000 0 Nauplius 47,000 0<br />
Scenedesmus 20,000 0 Cymbella 43,000 0 Ophiocytium 17,000 0 Copepoda 83,000 0 Ophiocytium 24,000 0<br />
Nauplius 20,000 0 Navicula 43,000 0 Epithemia 17,000 0 Navicula 50,000 0 Pinnularia 24,000 0<br />
Ceratium 20,000 0 Epithemia 43,000 0 Coelosphaerium 17,000 0 Cymbella 50,000 0 Total 993,823,000 994<br />
Rotifera 20,000 0 Synedra 21,000 0 Staurastrum 17,000 0 Closterium 50,000 0<br />
Chlorella 20,000 0 Ankistrodesmus 21,000 0 Copepoda 17,000 0 Ceratium 33,000 0<br />
Stephanodiscus 20,000 0 Total 451,751,000 452 Total 574,738,000 575 Staurastrum 33,000 0<br />
Staurastrum 20,000 0 Synedra 17,000 0<br />
Cymbella 20,000 0 Nauplius 17,000 0<br />
Total 1,309,427,000 1,309 Rotifera 17,000 0<br />
Pinnularia 17,000 0<br />
Gloeocystis 17,000 0<br />
Amphora 17,000 0<br />
Scenedesmus 17,000 0<br />
Page 12 of 18
Lake Merced South - Pistol Range<br />
18-Dec-01<br />
5-Mar-02<br />
30-Apr-02 18-Jun-02 23-Aug-02<br />
Organism No./m 3 No./mL Organism No./m 3 No./mL Organism No./m 3 No./mL Organism No./m 3 No./mL Organism No./m 3 No./mL<br />
Oscillatoria 820,000,000 820 Oscillatoria (50:1 dil) 600,000,000 600 Oscillatoria 760,000,000 760 Oscillatoria 1,700,000,000 1,700 Oscillatoria (50:1 dil) 1,000,000,000 1,000<br />
Melosira 4,000,000 4 Anabaena 1,000,000 1 Melosira 4,100,000 4 Melosira 7,300,000 7 Anabaena 12,000,000 12<br />
Closterium 220,000 0 Dinobryon 400,000 0 Anabaena 2,600,000 3 Anabaena 1,600,000 2 Melosira 1,100,000 1<br />
Anabaena 160,000 0 Mougeotia 360,000 0 Closterium 210,000 0 Ankistrodesmus 230,000 0 Ankistrodesmus 280,000 0<br />
Ankistrodesmus 160,000 0 Stephanodiscus 130,000 0 Ankistrodesmus 170,000 0 Closterium 210,000 0 Nauplius 190,000 0<br />
Copepoda 69,000 0 Anacystis 110,000 0 Rotifera 150,000 0 Cyclotella 150,000 0 Closterium 160,000 0<br />
Pinnularia 69,000 0 Rotifera 95,000 0 Copepoda 58,000 0 Rotifera 130,000 0 Stephanodiscus 140,000 0<br />
Fragilaria 52,000 0 Synedra 76,000 0 Nauplius 39,000 0 Scenedesmus 85,000 0 Copepoda 120,000 0<br />
Staurastrum 34,000 0 Nauplius 76,000 0 Dictyosphaerium 39,000 0 Copepoda 85,000 0 Diatoma 92,000 0<br />
Synedra 17,000 0 Spirulina 76,000 0 Total 767,366,000 767 Cymbella 64,000 0 Coelosphaerium 92,000 0<br />
Rotifera 17,000 0 Melosira 38,000 0 Nauplius 64,000 0 Navicula 92,000 0<br />
Pediastrum 17,000 0 Fragilaria 19,000 0 Synedra 42,000 0 Rotifera 69,000 0<br />
Scenedesmus 17,000 0 Navicula 19,000 0 Pinnularia 21,000 0 Scenedesmus 69,000 0<br />
Total 824,832,000 825 Closterium 19,000 0 Staurastrum 21,000 0 Gloeocystis 69,000 0<br />
Ankistrodesmus 19,000 0 Cladocera 21,000 0 Staurastrum 46,000 0<br />
Total 602,437,000 602 Total 1,710,023,000 1,710 Synedra 46,000 0<br />
Pinnularia 46,000 0<br />
Fragilaria 23,000 0<br />
Mallomonas 23,000 0<br />
Cladocera 23,000 0<br />
Dictyosphaerium 23,000 0<br />
Oedogonium 23,000 0<br />
Pediastrum 23,000 0<br />
Total 1,014,749,000 1,015<br />
D.3-143<br />
Lake Merced South - Pump Station<br />
18-Dec-01<br />
5-Mar-02<br />
30-Apr-02 18-Jun-02 23-Aug-02<br />
Organism No./m 3 No./mL Organism No./m 3 No./mL Organism No./m 3 No./mL Organism No./m 3 No./mL Organism No./m 3 No./mL<br />
Oscillatoria 960,000,000 960 Oscillatoria 600,000,000 600 Oscillatoria 900,000,000 900 Oscillatoria 2,500,000,000 2,500 Oscillatoria (50:1 dil) 930,000,000 930<br />
Melosira 2,800,000 3 Anabaena 380,000 0 Melosira 6,900,000 7 Melosira 8,900,000 9 Anabaena 7,600,000 8<br />
Anabaena 780,000 1 Mougeotia 380,000 0 Anabaena 3,700,000 4 Ankistrodesmus 510,000 1 Melosira 330,000 0<br />
Closterium 98,000 0 Dinobryon 330,000 0 Closteridium 530,000 1 Cyclotella 400,000 0 Mougeotia 130,000 0<br />
Copepoda 49,000 0 Melosira 180,000 0 Rotifera 100,000 0 Anabaena 280,000 0 Coelosphaerium 100,000 0<br />
Epithemia 49,000 0 Rotifera 160,000 0 Ankistrodesmus 100,000 0 Staurastrum 260,000 0 Stephanodiscus 83,000 0<br />
Ankistrodesmus 33,000 0 Coelosphaerium 130,000 0 Nauplius 79,000 0 Closterium 230,000 0 Synedra 67,000 0<br />
Staurastrum 33,000 0 Stephanodiscus 120,000 0 Synedra 26,000 0 Copepoda 170,000 0 Nauplius 67,000 0<br />
Fragilaria 16,000 0 Nauplius 82,000 0 Copepoda 26,000 0 Rotifera 140,000 0 Scenedesmus 50,000 0<br />
Nauplius 16,000 0 Closterium 82,000 0 Staurastrum 26,000 0 Scenedesmus 110,000 0 Ankistrodesmus 50,000 0<br />
Rotifera 16,000 0 Anacystis 66,000 0 Total 911,487,000 911 Cymbella 57,000 0 Diatoma 50,000 0<br />
Total 963,890,000 964 Spirulina 66,000 0 Cladocera 57,000 0 Copepoda 33,000 0<br />
Ankistrodesmus 49,000 0 Pinnularia 28,000 0 Rotifera 33,000 0<br />
Kirchneriella 33,000 0 Total 2,511,142,000 2,511 Closterium 33,000 0<br />
Fragilaria 16,000 0 Sphaerocystis 33,000 0<br />
Mallomonas 16,000 0 Euglena 33,000 0<br />
Copepoda 16,000 0 Ceratium 17,000 0<br />
Total 602,106,000 602 Anacystis 17,000 0<br />
Navicula 17,000 0<br />
Tetraedron 17,000 0<br />
Ophiocytium 17,000 0<br />
Total 938,777,000 939<br />
Page 13 of 18
Lake Merced South - Pistol Range<br />
23-Oct-02 11-Feb-03 14-May-03<br />
Organism No./m 3 No./mL Organism No./m 3 No./mL Organism No./m 3 No./mL Organism No./m 3 No./mL Organism No./m 3 No./mL<br />
Oscillatoria 930,000,000 930 Oscillatoria 1,100,000,000 1,100 Oscillatoria 1,200,000,000 1,200 Oscillatoria 1,300,000,000 1,300 Oscillatoria 1,100,000,000 1,100<br />
Anabaena 2,600,000 3 Melosira 3,100,000 3 Melosira 8,400,000 8 Anabaena 3,800,000 4 Anabaena 4,100,000 4<br />
Melosira 780,000 1 Closterium 250,000 0 Closterium 490,000 0 Melosira 1,900,000 2 Melosira 190,000 0<br />
Nauplius 280,000 0 Rotifera 130,000 0 Synedra 380,000 0 Copepoda 110,000 0 Ceratium 160,000 0<br />
Rotifera 87,000 0 Copepoda 100,000 0 Ankistrodesmus 380,000 0 Closterium 61,000 0 Closterium 160,000 0<br />
Closterium 65,000 0 Cyclotella 100,000 0 Rotifera 220,000 0 Nauplius 46,000 0 Copepoda 160,000 0<br />
Epithemia 43,000 0 Cymbella 51,000 0 Scenedesmus 160,000 0 Cymbella 46,000 0 Rotifera 130,000 0<br />
Synedra 22,000 0 Nauplius 25,000 0 Nauplius 82,000 0 Rotifera 30,000 0 Nauplius 53,000 0<br />
Copepoda 22,000 0 Synedra 25,000 0 Staurastrum 55,000 0 Staurastrum 15,000 0 Epithemia 27,000 0<br />
Ankistrodesmus 22,000 0 Scenedesmus 25,000 0 Anabaena 55,000 0 Cyclotella 15,000 0 Total 1,104,980,000 1,105<br />
Scenedesmus 22,000 0 Ankistrodesmus 25,000 0 Asterionella 27,000 0 Total 1,306,023,000 1,306<br />
Pinnularia 22,000 0 Total 1,103,831,000 1,104 Epithemia 27,000 0<br />
Total 933,965,000 934 Ceratium 27,000 0<br />
Copepoda 27,000 0<br />
Total 1,210,330,000 1,210<br />
15-Jul-03<br />
30-Sep-03<br />
D.3-144<br />
Lake Merced South - Pump Station<br />
23-Oct-02 11-Feb-03 14-May-03<br />
Organism No./m 3 No./mL Organism No./m 3 No./mL Organism No./m 3 No./mL Organism No./m 3 No./mL Organism No./m 3 No./mL<br />
Oscillatoria 1,100,000,000 1,100 Oscillatoria 1,100,000,000 1,100 Oscillatoria 980,000,000 980 Oscillatoria 700,000,000 700 Oscillatoria 550,000,000 550<br />
Anabaena 4,800,000 5 Melosira 3,300,000 3 Melosira 5,200,000 5 Anabaena 7,400,000 7 Anabaena 3,800,000 4<br />
Melosira 370,000 0 Closterium 160,000 0 Anabaena 320,000 0 Melosira 1,800,000 2 Melosira 430,000 0<br />
Rotifera 110,000 0 Rotifera 110,000 0 Ankistrodesmus 230,000 0 Ankistrodesmus 75,000 0 Ceratium 220,000 0<br />
Ankistrodesmus 65,000 0 Cyclotella 90,000 0 Synedra 110,000 0 Closterium 56,000 0 Rotifera 220,000 0<br />
Cyclotella 43,000 0 Nauplius 45,000 0 Rotifera 85,000 0 Copepoda 56,000 0 Nauplius 140,000 0<br />
Nauplius 43,000 0 Ankistrodesmus 45,000 0 Copepoda 64,000 0 Staurastrum 37,000 0 Closterium 68,000 0<br />
Closterium 43,000 0 Cymbella 45,000 0 Nauplius 21,000 0 Synedra 37,000 0 0 45,000 0<br />
Staurastrum 22,000 0 Scenedesmus 45,000 0 Staurastrum 21,000 0 Cymbella 19,000 0 Synedra 22,000 0<br />
Copepoda 22,000 0 Synedra 45,000 0 Scenedesmus 21,000 0 Cladocera 19,000 0 Total 554,945,000 555<br />
Epithemia 22,000 0 Anabaena 23,000 0 Total 986,072,000 986 Nauplius 19,000 0<br />
Ceratium 22,000 0 Staurastrum 23,000 0 Cyclotella 19,000 0<br />
Total 1,105,562,000 1,106 Copepoda 23,000 0 Total 709,537,000 710<br />
Ophiocytium 23,000 0<br />
Total 1,103,977,000 1,104<br />
15-Jul-03<br />
30-Sep-03<br />
Page 14 of 18
Lake Merced South - Pistol Range<br />
2-Dec-03 27-May-04 29-Aug-04 27-Oct-04<br />
9-Dec-04 9-Feb-05 18-Apr-05<br />
Organism No./m 3 No./mL Organism No./mL Organism No./mL Organism No./mL Organism No./mL Organism No./mL Organism No./mL<br />
Oscillatoria 660,000,000 660 Oscillatoria 505 Oscillatoria 1600 Oscillatoria 2100 Oscillatoria 1400 Oscillatoria 910 Oscillatoria 630<br />
Anabaena 540,000 1 Melosira 1.3 Anabaena 11 Anabaena 4.7 Melosira 0.33 Melosira 0.92 Melosira 5.4<br />
Fragilaria 670,000 1 Anabaena 1.1 Melosira 1.1 Melosira 1.2 Anabaena 0.14 Anabaena 0.19 Anabaena 5.3<br />
Mougeotia 200,000 0 Stephanodiscus 0.35 Copepoda 0.078 Ceratium 0.12 Closterium 0.094 Closterium 0.12 Asterionella 1<br />
Ankistrodesmus 98,000 0 Closterium 0.24 Closterium 0.078 Rotifera 0.094 Copepoda 0.07 Coelosphaerium 0.073 Closterium 0.55<br />
Nauplius 74,000 0 Ankistrodesmus 0.11 Rotifera 0.026 Fragilaria 0.031 Rotifera 0.047 Asterionella 0.073 Synedra 0.26<br />
Coelosphaerium 74,000 0 Pennate Diatom 0.11 Ankistrodesmus 0.026 Coelosphaerium 0.031 Coelosphaerium 0.024 Nauplius 0.024 Rotifera 0.16<br />
Closterium 74,000 0 Synedra 0.089 Nauplius 0.026 Scenedesmus 0.031 Nauplius 0.024 Rotifera 0.024 Ankistrodesmus 0.065<br />
Rotifera 49,000 0 Scenedesmus 0.089 Total 1612.334 Closterium 0.031 Total 1400.729 Synedra 0.024 Nauplius 0.032<br />
Melosira 49,000 0 Coelosphaerium 0.067 Synedra 0.031 Total 911.448 Epithemia 0.032<br />
Cyclotella 49,000 0 Tetraedron 0.067 Nauplius 0.031 Copepoda 0.032<br />
Ceratium 25,000 0 Staurastrum 0.044 Total 2106.3 Total 642.831<br />
Synedra 25,000 0 Copepoda 0.044<br />
Cladocera 25,000 0 Nauplius 0.044<br />
Pennate Diatom 25,000 0 Rotifera 0.044<br />
Total 661,977,000 662 Anacystis 0.044<br />
Dinobryon 0.022<br />
Asterionella 0.022<br />
Total 508.786<br />
D.3-145<br />
Lake Merced South - Pump Station<br />
2-Dec-03 27-May-04 29-Aug-04 27-Oct-04<br />
9-Dec-04 9-Feb-05 18-Apr-05<br />
Organism No./m 3 No./mL Organism No./mL Organism No./mL Organism No./mL Organism No./mL Organism No./mL Organism No./mL<br />
Oscillatoria 700,000,000 700 Oscillatoria (10:1) 440 Oscillatoria 1400 Oscillatoria 1900 Oscillatoria 850 Oscillatoria 1200 Oscillatoria 500<br />
Anabaena 250,000 0 Melosira 0.92 Anabaena 1.6 Anabaena 3 Melosira 0.27 Melosira 1.2 Melosira 4.5<br />
Mougeotia 250,000 0 Anabaena 0.9 Melosira 1.3 Melosira 0.81 Closterium 0.11 Anabaena 0.17 Anabaena 2.8<br />
Melosira 250,000 0 Stephanodiscus 0.26 Ankistrodesmus 0.12 Ceratium 0.21 Anabaena 0.08 Synedra 0.11 Asterionella 0.42<br />
Ankistrodesmus 230,000 0 Closterium 0.13 Rotifera 0.093 Rotifera 0.12 Coelosphaerium 0.027 Coelosphaerium 0.083 Closterium 0.29<br />
Fragilaria 140,000 0 Copepoda 0.064 Ceratium 0.093 Closterium 0.09 Copepoda 0.027 Nauplius 0.083 Synedra 0.13<br />
Nauplius 91,000 0 Rotifera 0.064 Closterium 0.07 Ankistrodesmus 0.06 Cymbella 0.027 Rotifera 0.055 Rotifera 0.032<br />
Closterium 91,000 0 Anacystis 0.064 Synedra 0.023 Staurastrum 0.03 Total 850.541 Copepoda 0.055 Copepoda 0.016<br />
Ankistrodesmus 68,000 0 Dinobryon 0.043 Total 1403.299 Copepoda 0.03 Closterium 0.055 Epithemia 0.016<br />
Cladocera 23,000 0 Synedra 0.043 Stephanodiscus 0.03 Ankistrodesmus 0.028 Coelosphaerium 0.016<br />
Copepoda 23,000 0 Nauplius 0.043 Total 1904.38 Scenedesmus 0.028 Total 508.22<br />
Rotifera 23,000 0 Coelosphaerium 0.043 Total 1201.867<br />
Xanthidium 23,000 0 Pennate Diatom 0.043<br />
Pennate Diatom 23,000 0 Tetraedron 0.043<br />
Cyclotella 23,000 0 Scenedesmus 0.043<br />
Total 701,508,000 702 Staurastrum 0.021<br />
Ankistrodesmus 0.021<br />
Spirogyra 0.021<br />
Total 442.766<br />
Page 15 of 18
Lake Merced South - Pistol Range<br />
23-Jun-05 17-Aug-05 28-Sep-05<br />
31-Oct-05 29-Nov-05 29-Dec-05 23-Jan-06 1-Mar-06<br />
Organism No./mL Organism No./m3 Organism No./mL Organism No./m3 No./mL Organism No./mL Organism No./mL Organism No./mL Organism No./mL<br />
Oscillatoria (20:1 dil) 580 Oscillatoria 410 Oscillatoria 620 Oscillatoria 870,000,000 870 Oscillatoria 840 Oscillatoria 1100 Oscillatoria 940 Oscillatoria 830<br />
Anabaena 25 Melosira 16 Anabaena 12 Anabaena 5,700,000 6 Melosira 11<br />
Aphanizomenon 13 Anabaena 3.5 Copepod 0.59 Rotifera 170,000 0.17 Anabaena 3<br />
Melosira 0.41 Closterium 0.32 Nauplius 0.39 Nauplius 83,000 0.08 Copepoda 0.082<br />
Stephanodiscus 0.22 Ceratium 0.065 Melosira 0.28 Ceratium 63,000 0.06 Closterium 0.055<br />
Coelosphaerium 0.12 Ankistrodesmus 0.043 Ceratium 0.19 Copepod 21,000 0.02 Ankistrodesmus 0.028<br />
Ceratium 0.059 Nauplius 0.043 Pediastrum 0.095 Total 876,078,988 876 Asterionella 0.028<br />
Closterium 0.059 Copepoda 0.022 Total 634 Total 854<br />
Mallomonas 0.039 Total 429.993<br />
Nauplius 0.039<br />
Scenedesmus 0.039<br />
Fragilaria 0.039<br />
Asterionella 0.039<br />
Cladocera 0.02<br />
Copepoda 0.02<br />
Rotifera 0.02<br />
Staurastrum 0.02<br />
Synedra 0.02<br />
Total 619.2<br />
D.3-146<br />
Lake Merced South - Pump Station<br />
23-Jun-05 17-Aug-05 28-Sep-05<br />
31-Oct-05 29-Nov-05 29-Dec-05 23-Jan-06 1-Mar-06<br />
Organism No./mL Organism No./m3 Organism No./mL Organism No./m3 Organism No./mL Organism No./mL Organism No./mL Organism No./mL<br />
Oscillatoria (20:1 dil) 651.8251425 Oscillatoria 700 Oscillatoria 590 Oscillatoria 810 Oscillatoria 980 Oscillatoria 1200 Oscillatoria 1000 Oscillatoria 850<br />
Anabaena 25.5122959 Melosira 18 Anabaena 6.5 Anacystis 140 Melosira 10<br />
Aphanizomenon 16.42412456 Anabaena 4 Nauplius 0.16 Melosira 11 Anabaena 3.4<br />
Melosira 0.350443625 Ceratium 0.28 Ceratium 0.16 Anabaena 8.1 Closterium 0.1<br />
Stephanodiscus 0.186903267 Closterium 0.17 Copepoda 0.082 Closterium 0.4 Nauplius 0.05<br />
Cyclotella 0.163540358 Copepoda 0.087 Melosira 0.082 Stephanodiscus 0.06 Asterionella 0.025<br />
Ceratium 0.14017745 Rotifera 0.065 Total 597 Rotifera 0.04 Epithemia 0.025<br />
Nauplius 0.070088725 Ankistrodesmus 0.065 Epithemia 0.04 Coelosphaerium 0.025<br />
Rotifera 0.070088725 Stephanodiscus 0.043 Copepoda 0.04 Ankistrodesmus 0.025<br />
Coelosphaerium 0.070088725 Coelosphaerium 0.022 Ophiocytium 0.02 Total 994<br />
Fragilaria 0.046725817 Asterionella 0.022 Nauplius 0.02<br />
Copepoda 0.046725817 Nauplius 0.022 Total 969.72<br />
Navicula 0.046725817 Epithemia 0.022<br />
Dinobryon 0.023362908 Total 722.798<br />
Cladocera 0.023362908<br />
Closterium 0.023362908<br />
Pinnularia 0.023362908<br />
Scenedesmus 0.023362908<br />
Total 695.0698858<br />
Page 16 of 18
Lake Merced South - Pistol Range<br />
26-Apr-06<br />
14-Jun-06 24-Aug-06 25-Oct-06 20-Dec-06 29-Mar-07 26-Jun-07<br />
20-Aug-07 27-Dec-07 28-Mar-08<br />
Organism No./mL Organism No./mL Organism No./mL Organism No./mL Organism No./mL Organism No./mL Organism No./mL Organism No./mL Organism No./mL Organism No./mL<br />
Oscillatoria 1200 Oscillatoria 1300 Oscillatoria 1,000 Oscillatoria 1,700 Oscillatoria 840 Oscillatoria 430 Oscillatoria 510 Oscillatoria 790 Oscillatoria 630 Oscillatoria 35<br />
Melosira 36 Anabeana 3.8<br />
Synedra 9.0 Melosira 2.5<br />
Asterionella 6.4 Total 1306.3<br />
Anabaena 6.4<br />
Closterium 3.9<br />
Fragilaria 1.3<br />
Total 1263<br />
D.3-147<br />
Lake Merced South - Pump Station<br />
26-Apr-06<br />
14-Jun-06 24-Aug-06 25-Oct-06 20-Dec-06 29-Mar-07 26-Jun-07<br />
20-Aug-07 27-Dec-07 28-Mar-08<br />
Organism No./mL Organism No./mL Organism No./mL Organism No./mL Organism No./mL Organism No./mL Organism No./mL Organism No./mL Organism No./mL Organism No./mL<br />
Oscillatoria 970 Oscillatoria 730 Oscillatoria 1200 Oscillatoria 1,700 Oscillatoria 1000 Oscillatoria 400 Oscillatoria 550 NA Oscillatoria 740 Oscillatoria 63<br />
Melosira 44 Anabaena 3.4<br />
Anabaena 14 Melosira 2.3<br />
Synedra 6.4 Total 736<br />
Asterionella 4.8<br />
Closterium 3.2<br />
Total 1042<br />
Page 17 of 18
Lake Merced South - Pistol Range<br />
10-Jun-08 24-Sep-08 4-Dec-08 24-Mar-09<br />
4-Jun-09<br />
22-Sep-09<br />
15-Dec-09<br />
Organism No./mL Organism No./mL Organism No./mL Organism No./mL Organism No./mL Organism No./mL Organism No./mL<br />
Oscillatoria 35 Oscillatoria 52 Oscillatoria 76 Oscillatoria 320 Oscillatoria 630 Oscillatoria 1800 Oscillatoria 910<br />
Lake Merced South - Pump Station<br />
10-Jun-08<br />
24-Sep-08<br />
4-Dec-08<br />
24-Mar-09<br />
4-Jun-09<br />
22-Sep-09<br />
15-Dec-09<br />
Organism No./mL Organism No./mL Organism No./mL Organism No./mL Organism No./mL Organism No./mL Organism No./mL<br />
Oscillatoria 17 Oscillatoria 54 Oscillatoria 340 Oscillatoria 430 Oscillatoria 750 Oscillatoria 1500 Oscillatoria 850<br />
D.3-148<br />
Page 18 of 18
Lake Merced<br />
North<br />
Secchi Disc 15-May-97 10-Sep-97 3-Dec-97 16-Mar-98 8-Jul-98 23-Sep-98 17-Mar-99 21-Jun-99 15-Sep-99 8-Dec-99 21-Mar-00 21-Jun-00 9-Aug-00 19-Dec-00 7-Mar-01 20-Jun-01 1-Oct-01 18-Dec-01 5-Mar-02<br />
Depth (feet) 2.0 1.2 1.5 2.0 1.0 1.0 2.0 1.0 1.0 1.5 1.0 1.0 1.0 1.5 1.0 1.0 1.0 2.0<br />
Lake Merced North<br />
East<br />
Secchi Disc 15-May-97 10-Sep-97 3-Dec-97 16-Mar-98 8-Jul-98 23-Sep-98 17-Mar-99 21-Jun-99 15-Sep-99 8-Dec-99 21-Mar-00 21-Jun-00 9-Aug-00 19-Dec-00 7-Mar-01 20-Jun-01 1-Oct-01 18-Dec-01 5-Mar-02<br />
Depth (feet) 2.5 3.3 2.0 1.5 1.5 1.0 1.0 1.0 1.2 1.5 1.5 1.0 1.0 1.0 1.0 1.0 2.0<br />
Lake Merced<br />
South - Pistol<br />
Range<br />
Secchi Disc 15-May-97 10-Sep-97 3-Dec-97 16-Mar-98 8-Jul-98 23-Sep-98 17-Mar-99 21-Jun-99 15-Sep-99 8-Dec-99 21-Mar-00 21-Jun-00 9-Aug-00 19-Dec-00 7-Mar-01 20-Jun-01 1-Oct-01 18-Dec-01 5-Mar-02<br />
Depth (feet) 1.7 1.0 1.5 2.0 2.5 1.5 2.5 1.5 1.0 1.0 1.4 1.5 1.5 2.5 2.5 1.0 1.0 1.5 2.5<br />
Lake Merced<br />
South - Pump<br />
Station<br />
Secchi Disc 15-May-97 10-Sep-97 3-Dec-97 16-Mar-98 8-Jul-98 23-Sep-98 17-Mar-99 21-Jun-99 15-Sep-99 8-Dec-99 21-Mar-00 21-Jun-00 9-Aug-00 19-Dec-00 7-Mar-01 20-Jun-01 1-Oct-01 18-Dec-01 5-Mar-02<br />
Depth (feet) 1.7 1.0 1.5 2.0 2.5 1.5 2.5 1.5 1.0 1.0 1.8 1.5 1.5 2.0 2.5 1.0 1.0 1.5 2.0<br />
D.3-149<br />
Page 1 of 3
Lake Merced<br />
North<br />
Secchi Disc<br />
Depth (feet)<br />
Lake Merced North<br />
East<br />
Secchi Disc<br />
Depth (feet)<br />
Lake Merced<br />
South - Pistol<br />
Range<br />
Secchi Disc<br />
Depth (feet)<br />
Lake Merced<br />
South - Pump<br />
Station<br />
Secchi Disc<br />
Depth (feet)<br />
30-Apr-02 18-Jun-02 23-Aug-02 23-Oct-02 11-Feb-03 14-May-03 15-Jul-03 30-Sep-03 2-Dec-03 27-May-04 29-Aug-04 27-Oct-04 9-Dec-04 9-Feb-05 18-Apr-05 23-Jun-05 17-Aug-05 28-Sep-05 31-Oct-05 29-Nov-05<br />
1.0 1.0 1.0 1.5 1.0 1.0 1.0 1.0 7.0 2.5 2.0 5.0 4.5 10.0 2.0 1.5 2.0 2.0<br />
30-Apr-02 18-Jun-02 23-Aug-02 23-Oct-02 11-Feb-03 14-May-03 15-Jul-03 30-Sep-03 2-Dec-03 27-May-04 29-Aug-04 27-Oct-04 9-Dec-04 9-Feb-05 18-Apr-05 23-Jun-05 17-Aug-05 28-Sep-05 31-Oct-05 29-Nov-05<br />
1.0 1.0 1.0 1.5 1.0 1.5 1.5 1.5 1.0 2.5 1.5 2.5 2.0 2.5 2.0 1.5 1.5 2.0 2.0<br />
30-Apr-02 18-Jun-02 23-Aug-02 23-Oct-02 11-Feb-03 14-May-03 15-Jul-03 30-Sep-03 2-Dec-03 27-May-04 29-Aug-04 27-Oct-04 9-Dec-04 9-Feb-05 18-Apr-05 23-Jun-05 17-Aug-05 28-Sep-05 31-Oct-05 29-Nov-05<br />
2.0 1.5 2.0 2.0 1.5 1.5 1.5 2.0 1.5 2.5 1.5 1.5 2.0 2.5 3.0 1.5 2.0 2.0 2.0 2.0<br />
30-Apr-02 18-Jun-02 23-Aug-02 23-Oct-02 11-Feb-03 14-May-03 15-Jul-03 30-Sep-03 2-Dec-03 27-May-04 29-Aug-04 27-Oct-04 9-Dec-04 9-Feb-05 18-Apr-05 23-Jun-05 17-Aug-05 28-Sep-05 31-Oct-05 29-Nov-05<br />
2.0 1.5 2.0 1.5 1.5 2.0 1.5 1.5 2.0 2.5 1.3 1.5 2.0 2.5 3.0 1.5 2.5 2.0 1.5 2.0<br />
D.3-150<br />
Page 2 of 3
Lake Merced<br />
North<br />
Secchi Disc<br />
Depth (feet)<br />
Lake Merced North<br />
East<br />
Secchi Disc<br />
Depth (feet)<br />
Lake Merced<br />
South - Pistol<br />
Range<br />
Secchi Disc<br />
Depth (feet)<br />
Lake Merced<br />
South - Pump<br />
Station<br />
Secchi Disc<br />
Depth (feet)<br />
29-Dec-05 23-Jan-06 1-Mar-06 26-Apr-06 14-Jun-06 24-Aug-06 25-Oct-06 20-Dec-06 29-Mar-07 26-Jun-07 20-Aug-07 27-Dec-07 28-Mar-08 10-Jun-08 24-Sep-08 4-Dec-08 24-Mar-09 4-Jun-09 22-Sep-09 15-Dec-09<br />
2.5 2.5 3.0 1.5 1.0 1.5 1.0 1.5 1.0 0.5 1.5 2.5 1.0 0.8 2.0 2.0 1.3 1.0 1.5<br />
29-Dec-05 23-Jan-06 1-Mar-06 26-Apr-06 14-Jun-06 24-Aug-06 25-Oct-06 20-Dec-06 29-Mar-07 26-Jun-07 20-Aug-07 27-Dec-07 28-Mar-08 10-Jun-08 24-Sep-08 4-Dec-08 24-Mar-09 4-Jun-09 22-Sep-09 15-Dec-09<br />
1.5 1.5 1.5 6.5 1.5 1.0 1.5 1.5 1.5 1.0 0.5 2.5 3.0 1.0 0.5 2.0 2.0 1.5 1.0 1.5<br />
29-Dec-05 23-Jan-06 1-Mar-06 26-Apr-06 14-Jun-06 24-Aug-06 25-Oct-06 20-Dec-06 29-Mar-07 26-Jun-07 20-Aug-07 27-Dec-07 28-Mar-08 10-Jun-08 24-Sep-08 4-Dec-08 24-Mar-09 4-Jun-09 22-Sep-09 15-Dec-09<br />
2.0 2.0 2.0 2.0 1.5 1.5 1.5 2.5 2.5 1.5 1.5 2.0 3.0 2.0 1.2 1.8 2.5 2.0 1.3 2.0<br />
29-Dec-05 23-Jan-06 1-Mar-06 26-Apr-06 14-Jun-06 24-Aug-06 25-Oct-06 20-Dec-06 29-Mar-07 26-Jun-07 20-Aug-07 27-Dec-07 28-Mar-08 10-Jun-08 24-Sep-08 4-Dec-08 24-Mar-09 4-Jun-09 22-Sep-09 15-Dec-09<br />
2.0 2.0 2.0 2.0 1.5 1.5 1.5 2.5 2.5 1.5 1.5 2.0 3.0 2.0 1.0 1.5 2.5 2.0 1.3 2.0<br />
D.3-151<br />
Page 3 of 3
Lake Merced North<br />
15-May-97 10-Sep-97 03-Dec-97<br />
16-Mar-98<br />
Depth Br Br Br Br<br />
Ft mg/L mg/L mg/L mg/L<br />
Surf 0.43 0.54 0.52 0.42<br />
5 0.43 0.54 0.54 0.42<br />
10 0.44 0.54 0.51 0.42<br />
15 0.42 0.53 0.53 0.42<br />
Lake Merced North East<br />
15-May-97 10-Sep-97 03-Dec-97<br />
16-Mar-98<br />
Depth Br Br Br Br<br />
Ft mg/L mg/L mg/L mg/L<br />
0 0.39 0.49 0.35<br />
5 0.39 0.48 0.35<br />
10 0.38 0.48 0.35<br />
Lake Merced South - Pistol Range<br />
15-May-97 10-Sep-97 03-Dec-97<br />
16-Mar-98<br />
Depth Br Br Br Br<br />
Ft mg/L mg/L mg/L mg/L<br />
Surf 0.23 0.26 0.34 0.26<br />
5 0.23 0.28 0.34<br />
6 0.26<br />
10 0.23 0.29 0.33<br />
12 0.26<br />
15 0.23 0.29 0.33<br />
16 0.22 0.32<br />
18 0.26<br />
Lake Merced South - Pump Station<br />
15-May-97 10-Sep-97 03-Dec-97<br />
16-Mar-98<br />
Depth Br Br Br Br<br />
Ft mg/L mg/L mg/L mg/L<br />
Surf 0.23 0.28 0.34 0.26<br />
5 0.23 0.29 0.34 0.26<br />
10 0.22 0.28 0.33<br />
12 0.26<br />
15 0.23 0.26 0.33<br />
18 0.26<br />
Page D.3-152 1 of 1
Lake Merced North<br />
15-May-97 10-Sep-97 03-Dec-97<br />
16-Mar-98<br />
Depth SO4 SO4 SO4 SO4<br />
Ft mg/L mg/L mg/L mg/L<br />
Surf 22 16 13 16<br />
5 22 16 13 16<br />
10 22 16 13 16<br />
15 22 15 13 16<br />
Lake Merced North East<br />
15-May-97 10-Sep-97 03-Dec-97<br />
16-Mar-98<br />
Depth SO4 SO4 SO4 SO4<br />
Ft mg/L mg/L mg/L mg/L<br />
0 30 23 26<br />
5 30 23 26<br />
10 30 22 26<br />
Lake Merced South - Pistol Range<br />
15-May-97 10-Sep-97 03-Dec-97<br />
16-Mar-98<br />
Depth SO4 SO4 SO4 SO4<br />
Ft mg/L mg/L mg/L mg/L<br />
Surf 11 7.1 7.4 16<br />
5 11 7.1 7.5<br />
6 16<br />
10 11 6.8 7.5<br />
12 16<br />
15 11 6.4 7.4<br />
16 11 6.4<br />
18 16<br />
Lake Merced South - Pump Station<br />
15-May-97 10-Sep-97 03-Dec-97<br />
16-Mar-98<br />
Depth SO4 SO4 SO4 SO4<br />
Ft mg/L mg/L mg/L mg/L<br />
Surf 11 7.0 7.6 16<br />
5 11 6.9 7.5 16<br />
10 11 6.8 7.6<br />
12 16<br />
15 11 6.5 7.6<br />
18 16<br />
Page D.3-153 1 of 1
Lake Merced North<br />
26-Jun-07 20-Aug-07 26-Dec-07 28-Mar-08 10-Jun-08 24-Sep-08 4-Dec-08 24-Mar-09 4-Jun-09 22-Sep-09<br />
Depth Pb Pb Pb Pb Pb Pb Pb Pb Pb Pb<br />
ug/L ug/L ug/L ug/L ug/L ug/L ug/L ug/L ug/L ug/L<br />
Surf 0.5 0.5 0.5 0.5 0.5 0.5 0.5 0.5 0.5 0.5<br />
Btm 0.5 0.5 0.5 0.5 0.5 0.5 0.5 0.5 0.5 0.5<br />
Lake Merced North East<br />
26-Jun-07 20-Aug-07 26-Dec-07 28-Mar-08 10-Jun-08 24-Sep-08 4-Dec-08 24-Mar-09 4-Jun-09 22-Sep-09<br />
Depth Pb Pb Pb Pb Pb Pb Pb Pb Pb Pb<br />
ug/L ug/L ug/L ug/L ug/L ug/L ug/L ug/L ug/L ug/L<br />
Surf 0.5 0.5 0.5 0.5 0.5 0.5 0.5 0.5 0.5 0.5<br />
Btm 0.5 0.5 0.5 0.5 0.5 0.5 0.5 0.5 0.5<br />
D.3-154<br />
Lake Merced South - Pistol Range<br />
26-Jun-07 20-Aug-07 26-Dec-07 28-Mar-08 10-Jun-08 24-Sep-08 4-Dec-08 24-Mar-09 4-Jun-09 22-Sep-09<br />
Depth Pb Pb Pb Pb Pb Pb Pb Pb Pb Pb<br />
ug/L ug/L ug/L ug/L ug/L ug/L ug/L ug/L ug/L ug/L<br />
Surf 0.5 0.5 0.5 0.5 0.5 0.5 0.5 0.5 0.5 0.5<br />
Btm 0.5 0.5 0.5 0.5 0.5 1.42 0.5 0.5 0.5<br />
Lake Merced South - Pump Station<br />
26-Jun-07 20-Aug-07 26-Dec-07 28-Mar-08 10-Jun-08 24-Sep-08 4-Dec-08 24-Mar-09 4-Jun-09 22-Sep-09<br />
Depth Pb Pb Pb Pb Pb Pb Pb Pb Pb Pb<br />
ug/L ug/L ug/L ug/L ug/L ug/L ug/L ug/L ug/L ug/L<br />
Surf 0.5 0.5 0.5 0.5 0.5 0.5 0.5 0.5 0.5 0.5<br />
Btm 0.5 0.5 0.5 0.5 0.5 0.5 0.5 0.5 0.5 0.5<br />
Note: Bold, italicized formats indicate half the reported value for statistical purposes.<br />
Page 1 of 1
Appendix D<br />
Hydrology and Water Quality Supporting Material<br />
APPENDIX D‐4<br />
Lake Merced Water Quality Graphs<br />
SFPUC <strong>San</strong> <strong>Francisco</strong> Groundwater Supply Project Draft EIR D.4‐1 March 2013<br />
Case No. 2008.1122E
Appendix D<br />
Hydrology and Water Quality Supporting Material<br />
This page intentionally left blank<br />
SFPUC <strong>San</strong> <strong>Francisco</strong> Groundwater Supply Project Draft EIR D.4‐2 March 2013<br />
Case No. 2008.1122E
7.5<br />
7.0<br />
6.5<br />
Lake Merced South ‐ Pump Station ‐ Depths vs. DO<br />
DO ‐ surface<br />
DO ‐ 10 ft<br />
DO ‐ bottom<br />
6.0<br />
5.5<br />
D.4-3<br />
Surf face WSE (ft Cit ty Datum)<br />
5.0<br />
4.5<br />
4.0<br />
3.5<br />
30 3.0<br />
2.5<br />
2.0<br />
1.5<br />
1.0<br />
0.5<br />
0.0<br />
0.0 1.0 2.0 3.0 4.0 5.0 6.0 7.0 8.0 9.0 10.0 11.0 12.0 13.0 14.0 15.0 16.0 17.0 18.0 19.0 20.0<br />
DO (mg/L)
7.5<br />
Lake Merced South ‐ Pump Station ‐ Depths vs. NH3‐N<br />
7.0<br />
6.5<br />
NH3‐N ‐ surface<br />
NH3‐N ‐ 10 ft<br />
NH3‐N ‐ bottom<br />
6.0<br />
5.5<br />
D.4-4<br />
Surf face WSE (ft Cit ty Datum)<br />
5.0<br />
4.5<br />
4.0<br />
3.5<br />
30 3.0<br />
2.5<br />
2.0<br />
1.5<br />
1.0<br />
0.5<br />
0.0<br />
0 0.05 0.1 0.15 0.2 0.25 0.3 0.35 0.4 0.45 0.5 0.55 0.6 0.65 0.7<br />
NH3‐N (mg/L)
7.5<br />
7.0<br />
6.5<br />
Lake Merced South ‐ Pump Station ‐ Depths vs. Ortho P<br />
Ortho P ‐ surface<br />
Ortho P ‐ 10 ft<br />
Ortho P ‐ bottom<br />
6.0<br />
5.5<br />
D.4-5<br />
Surf face WSE (ft Cit ty Datum)<br />
5.0<br />
4.5<br />
4.0<br />
3.5<br />
30 3.0<br />
2.5<br />
2.0<br />
1.5<br />
1.0<br />
0.5<br />
0.0<br />
0 0.02 0.04 0.06 0.08 0.1 0.12 0.14 0.16 0.18 0.2 0.22 0.24 0.26 0.28 0.3 0.32 0.34 0.36 0.38 0.4<br />
Ortho P (mg/L)
7.5<br />
Lake Merced Depths vs. NO3‐N<br />
7.0<br />
NO3‐N<br />
6.5<br />
6.0<br />
5.5<br />
D.4-6<br />
Surface WSE (ft City Datum)<br />
5.0<br />
4.5<br />
4.0<br />
3.5<br />
30 3.0<br />
2.5<br />
2.0<br />
1.5<br />
1.0<br />
0.5<br />
0.0<br />
0 0.05 0.1 0.15 0.2 0.25 0.3 0.35 0.4 0.45 0.5 0.55 0.6 0.65<br />
NO3‐N (mg/L)
7.5<br />
Lake Merced Depths vs. TKN<br />
7.0<br />
TKN<br />
6.5<br />
6.0<br />
5.5<br />
D.4-7<br />
Surface WSE (ft City Datum)<br />
5.0<br />
4.5<br />
4.0<br />
3.5<br />
30 3.0<br />
2.5<br />
2.0<br />
1.5<br />
1.0<br />
0.5<br />
0.0<br />
0 2 4 6 8 10 12 14 16 18 20 22 24 26 28 30<br />
TKN (mg/L)
7.5<br />
Lake Merced Depths vs. Total P<br />
7.0<br />
Total P<br />
6.5<br />
6.0<br />
5.5<br />
D.4-8<br />
Surface WSE (ft City Datum)<br />
5.0<br />
4.5<br />
4.0<br />
3.5<br />
30 3.0<br />
2.5<br />
2.0<br />
1.5<br />
1.0<br />
0.5<br />
0.0<br />
0 0.02 0.04 0.06 0.08 0.1 0.12 0.14 0.16 0.18 0.2 0.22 0.24 0.26 0.28 0.3<br />
Total P (mg/L)
7.5<br />
Lake Merced Depths vs. pH<br />
7.0<br />
pH<br />
6.5<br />
6.0<br />
5.5<br />
D.4-9<br />
Surface WSE (ft City Datum)<br />
5.0<br />
4.5<br />
4.0<br />
3.5<br />
30 3.0<br />
2.5<br />
2.0<br />
1.5<br />
1.0<br />
0.5<br />
0.0<br />
7.40 7.50 7.60 7.70 7.80 7.90 8.00 8.10 8.20 8.30 8.40 8.50 8.60 8.70 8.80 8.90<br />
pH
7.5<br />
Lake Merced Depths vs. Algal Biomass<br />
7.0<br />
Algal Biomass<br />
6.5<br />
6.0<br />
5.5<br />
D.4-10<br />
Surface WSE (ft City Datum)<br />
5.0<br />
4.5<br />
4.0<br />
3.5<br />
30 3.0<br />
2.5<br />
2.0<br />
1.5<br />
1.0<br />
0.5<br />
0.0<br />
400 600 800 1000 1200 1400 1600 1800 2000 2200 2400 2600 2800 3000 3200<br />
Algal Biomass (µg/L)
7.5<br />
Lake Merced Depths vs. Chlorophyll<br />
7.0<br />
Chlorophyll<br />
6.5<br />
6.0<br />
5.5<br />
D.4-11<br />
Surface WSE (ft City Datum)<br />
5.0<br />
4.5<br />
4.0<br />
3.5<br />
30 3.0<br />
2.5<br />
2.0<br />
1.5<br />
1.0<br />
0.5<br />
0.0<br />
0 5 10 15 20 25 30 35 40 45 50 55 60 65 70<br />
Chlorophyll (µg/L)
7.5<br />
Lake Merced Depths vs. Secchi Depth<br />
7.0<br />
Secchi Depth<br />
6.5<br />
6.0<br />
5.5<br />
D.4-12<br />
Surface WSE (ft City Datum)<br />
5.0<br />
4.5<br />
4.0<br />
3.5<br />
30 3.0<br />
2.5<br />
2.0<br />
1.5<br />
1.0<br />
0.5<br />
0.0<br />
0.9 1 1.1 1.2 1.3 1.4 1.5 1.6 1.7 1.8 1.9 2 2.1<br />
Secchi Depth (feet)
10.5<br />
10.0<br />
9.5<br />
9.0<br />
8.5<br />
Lake Merced South ‐ Pump Station ‐ DO vs. NH3‐N and Ortho P (Bottom)<br />
NH3‐N ‐ bottom<br />
Ortho P ‐ bottom<br />
Log. (NH3‐N ‐ bottom)<br />
Log. (Ortho P ‐ bottom)<br />
8.0<br />
7.5<br />
DO (mg/L)<br />
7.0<br />
6.5<br />
60 6.0<br />
D.4-13<br />
5.5<br />
5.0<br />
4.5<br />
4.0<br />
3.5<br />
3.0<br />
25 2.5<br />
R² = 0.0497<br />
2.0<br />
1.5<br />
R² = 0.3595<br />
1.0<br />
0.5<br />
0.0<br />
0 0.02 0.04 0.06 0.08 0.1 0.12 0.14 0.16 0.18 0.2 0.22 0.24 0.26 0.28 0.3 0.32 0.34 0.36 0.38 0.4 0.42 0.44 0.46 0.48 0.5<br />
NH‐3 and Ortho P (mg/L)
70<br />
65<br />
60<br />
55<br />
Lake Merced South ‐ Pump Station ‐ Surface Chlorophyll vs.<br />
Ortho P at depth, 1997 ‐ 2005<br />
15 ft depth ortho P<br />
bottom Ortho P<br />
Log. (15 ft depth ortho P)<br />
Log. (bottom Ortho P)<br />
hyll a (ug/L)<br />
50<br />
45<br />
D.4-14<br />
Chlorop<br />
40<br />
35<br />
R² = 0.9356<br />
30<br />
R² = 0.0008<br />
25<br />
20<br />
15<br />
10<br />
5<br />
0<br />
0 0.01 0.02 0.03 0.04 0.05 0.06 0.07 0.08 0.09 0.1 0.11 0.12 0.13 0.14 0.15 0.16 0.17 0.18 0.19 0.2 0.21 0.22 0.23 0.24 0.25<br />
Ortho P (mg/L)
7.5<br />
7.0<br />
6.5<br />
Lake Merced South ‐ Pistol Range ‐ Depths vs. DO<br />
DO ‐ surface<br />
DO ‐ 10 ft<br />
DO ‐ bottom<br />
6.0<br />
5.5<br />
D.4-15<br />
Surf face WSE (ft Cit ty Datum)<br />
5.0<br />
4.5<br />
4.0<br />
3.5<br />
30 3.0<br />
2.5<br />
2.0<br />
1.5<br />
1.0<br />
0.5<br />
0.0<br />
0.0 1.0 2.0 3.0 4.0 5.0 6.0 7.0 8.0 9.0 10.0 11.0 12.0 13.0 14.0 15.0 16.0 17.0 18.0 19.0 20.0<br />
DO (mg/L)
7.5<br />
7.0<br />
6.5<br />
Lake Merced South ‐ Pistol Range ‐ Depths vs. NH3<br />
NH3‐N ‐ surface<br />
NH3‐N N ‐ 10 ft<br />
NH3‐N ‐ bottom<br />
6.0<br />
5.5<br />
D.4-16<br />
Surf face WSE (ft Cit ty Datum)<br />
5.0<br />
4.5<br />
4.0<br />
3.5<br />
30 3.0<br />
2.5<br />
2.0<br />
1.5<br />
1.0<br />
0.5<br />
0.0<br />
0 0.05 0.1 0.15 0.2 0.25 0.3 0.35 0.4 0.45 0.5 0.55 0.6 0.65 0.7<br />
NH3‐N (mg/L)
7.5<br />
7.0<br />
6.5<br />
Lake Merced South ‐ Pistol Range ‐ Depths vs. Ortho P<br />
Ortho P ‐ surface<br />
Ortho P ‐ 10 ft<br />
Ortho P ‐ bottom<br />
6.0<br />
5.5<br />
D.4-17<br />
Surf face WSE (ft Cit ty Datum)<br />
5.0<br />
4.5<br />
4.0<br />
3.5<br />
30 3.0<br />
2.5<br />
2.0<br />
1.5<br />
1.0<br />
0.5<br />
0.0<br />
0 0.02 0.04 0.06 0.08 0.1 0.12 0.14 0.16 0.18 0.2 0.22 0.24 0.26 0.28 0.3 0.32 0.34 0.36 0.38 0.4<br />
Ortho P (mg/L)
7.5<br />
7.0<br />
6.5<br />
Lake Merced North‐ Depths vs. DO<br />
DO ‐ surface<br />
DO ‐ 10 ft<br />
DO ‐ bottom<br />
6.0<br />
5.5<br />
D.4-18<br />
Surf face WSE (ft Cit ty Datum)<br />
5.0<br />
4.5<br />
4.0<br />
3.5<br />
30 3.0<br />
2.5<br />
2.0<br />
1.5<br />
1.0<br />
0.5<br />
0.0<br />
0.0 1.0 2.0 3.0 4.0 5.0 6.0 7.0 8.0 9.0 10.0 11.0 12.0 13.0 14.0 15.0 16.0 17.0 18.0 19.0 20.0<br />
DO (mg/L)
7.5<br />
7.0<br />
6.5<br />
Lake Merced North ‐ Depths vs. NH3<br />
NH3‐N ‐ surface<br />
NH3‐N ‐ 10 ft<br />
NH3‐N ‐ bottom<br />
6.0<br />
5.5<br />
D.4-19<br />
Surf face WSE (ft Cit ty Datum)<br />
5.0<br />
4.5<br />
4.0<br />
3.5<br />
30 3.0<br />
2.5<br />
2.0<br />
1.5<br />
1.0<br />
0.5<br />
0.0<br />
0 0.05 0.1 0.15 0.2 0.25 0.3 0.35 0.4 0.45 0.5 0.55 0.6 0.65 0.7<br />
NH3‐N (mg/L)
7.5<br />
7.0<br />
6.5<br />
Lake Merced North ‐ Depths vs. Ortho P<br />
Ortho P ‐ surface<br />
Ortho P ‐ 10 ft<br />
Ortho P ‐ bottom<br />
6.0<br />
5.5<br />
D.4-20<br />
Surf face WSE (ft Cit ty Datum)<br />
5.0<br />
4.5<br />
4.0<br />
3.5<br />
30 3.0<br />
2.5<br />
2.0<br />
1.5<br />
1.0<br />
0.5<br />
0.0<br />
0 0.02 0.04 0.06 0.08 0.1 0.12 0.14 0.16 0.18 0.2 0.22 0.24 0.26 0.28 0.3 0.32 0.34 0.36 0.38 0.4<br />
Ortho P (mg/L)
7.5<br />
7.0<br />
6.5<br />
Lake Merced Northeast ‐ Depths vs. DO<br />
DO ‐ surface<br />
DO ‐ 10 ft<br />
DO ‐ bottom<br />
6.0<br />
5.5<br />
D.4-21<br />
Surf face WSE (ft Cit ty Datum)<br />
5.0<br />
4.5<br />
4.0<br />
3.5<br />
30 3.0<br />
2.5<br />
2.0<br />
1.5<br />
1.0<br />
0.5<br />
0.0<br />
0.0 1.0 2.0 3.0 4.0 5.0 6.0 7.0 8.0 9.0 10.0 11.0 12.0 13.0 14.0 15.0 16.0 17.0 18.0 19.0 20.0<br />
DO (mg/L)
7.5<br />
7.0<br />
6.5<br />
Lake Merced Northeast ‐ Depths vs. NH3<br />
NH3‐N ‐ surface<br />
NH3‐N ‐ 10 ft<br />
NH3‐N ‐ bottom<br />
6.0<br />
5.5<br />
D.4-22<br />
Surf face WSE (ft Cit ty Datum)<br />
5.0<br />
4.5<br />
4.0<br />
3.5<br />
30 3.0<br />
2.5<br />
2.0<br />
1.5<br />
1.0<br />
0.5<br />
0.0<br />
0 0.05 0.1 0.15 0.2 0.25 0.3 0.35 0.4 0.45 0.5 0.55 0.6 0.65 0.7<br />
NH3‐N (mg/L)
7.5<br />
7.0<br />
6.5<br />
Lake Merced Northeast ‐ Depths vs. Ortho P<br />
Ortho P ‐ surface<br />
Ortho P ‐ 10 ft<br />
Ortho P ‐ bottom<br />
6.0<br />
5.5<br />
D.4-23<br />
Surf face WSE (ft Cit ty Datum)<br />
5.0<br />
4.5<br />
4.0<br />
3.5<br />
30 3.0<br />
2.5<br />
2.0<br />
1.5<br />
1.0<br />
0.5<br />
0.0<br />
0 0.02 0.04 0.06 0.08 0.1 0.12 0.14 0.16 0.18 0.2 0.22 0.24 0.26 0.28 0.3 0.32 0.34 0.36 0.38 0.4<br />
Ortho P (mg/L)
Appendix D<br />
Hydrology and Water Quality Supporting Material<br />
APPENDIX D‐5<br />
Task 10.1 Technical Memorandum,<br />
Groundwater Modeling Analysis for the<br />
Regional Groundwater Storage and Recovery<br />
Project and <strong>San</strong> <strong>Francisco</strong> Groundwater Supply<br />
Project<br />
The hydrographs referenced in Section 5.16, Hydrology and Water Quality, are the hydrographs<br />
showing simulated groundwater levels by model layer, included in Attachment 10.1-B.<br />
SFPUC <strong>San</strong> <strong>Francisco</strong> Groundwater Supply Project Draft EIR D.5‐1 March 2013<br />
Case No. 2008.1122E
Appendix D<br />
Hydrology and Water Quality Supporting Material<br />
This page intentionally left blank<br />
SFPUC <strong>San</strong> <strong>Francisco</strong> Groundwater Supply Project Draft EIR D.5‐2 March 2013<br />
Case No. 2008.1122E
303 Second Street, Suite 300 South<br />
<strong>San</strong> <strong>Francisco</strong>, California 94107<br />
415-243-2150<br />
FAX: 415-896-0999<br />
Technical Memorandum 10.1<br />
Groundwater Modeling<br />
Analysis<br />
for the Regional Groundwater<br />
Storage and Recovery Project<br />
and <strong>San</strong> <strong>Francisco</strong> Groundwater<br />
Supply Project<br />
18 April 2012<br />
Prepared for<br />
<strong>San</strong> <strong>Francisco</strong> Public Utilities<br />
Commission<br />
525 Golden Gate Avenue, 10 th Floor<br />
<strong>San</strong> <strong>Francisco</strong>, CA 94102<br />
K/J Project No. 0864001<br />
D.5-3
Kennedy/Jenks Consultants<br />
Supplemental Explanation for Hydrographs - TM10.1<br />
This supplemental explanation is prepared to address discrepancies on several graphs presented<br />
in TM 10.1.<br />
First, the x-axis on several graphs showing model results was shifted. The x-axis is named<br />
Scenario Year which should correspond to a water year 1 . However, the graph template was<br />
plotted using a calendar year, so the intervals on the x-axis represent the period from January to<br />
December. The result is that the graph is shifted 3-months later relative to Scenario Year.<br />
Second, the shaded area representing the Design Drought was added manually and because of<br />
this process, it was not presented consistently on the graphs. By definition per the PEIR, the 8.5-<br />
year Design Drought includes one Hold year before the 7.5-year Take period. In addition, the<br />
Design Drought needs to be shifted 3-months later for the x-axis issue to be consistent with the<br />
model output. The Design Drought should be shown as Scenario Years 35.5 to 44.0 on the<br />
shifted x-axis.<br />
The following is a list of figures in TM 10.1 where the Design Drought shaded area is shown<br />
slightly different and does not match the correct display of the Design Drought. The figures should<br />
be viewed based on the correct representation of the Design Drought as explained above.<br />
o<br />
o<br />
Figures 10.1-6 through 10.1-13 (a total of eight figures) have the shifted x-axis. The<br />
Design Drought should be shown as Scenario Years 35.5 to 44.0 on the shifted x-axis.<br />
Attachment 10.1-B hydrographs with model simulated groundwater levels have the<br />
shifted x-axis. The Design Drought should be shown as Scenario Years 35.5 to 44.0<br />
on the shifted x-axis.<br />
o Attachment 10.1-G graphs showing model simulated lake levels have the shifted x-<br />
axis. The Design Drought should be shown as Scenario Years 35.5 to 44.0 on the<br />
shifted x-axis.<br />
1 A water year is October 1 of the previous year to September 30 of the current (named) year.<br />
Supplemental Explanation<br />
<strong>San</strong> <strong>Francisco</strong> Public Utilities Commission<br />
D.5-4<br />
© Kennedy/Jenks Consultants, Inc.
Kennedy/Jenks Consultants<br />
18 April 2012<br />
Task 10.1 Technical Memorandum<br />
<strong>San</strong> <strong>Francisco</strong> Public Utilities Commission<br />
Groundwater Modeling Analysis for the Regional Groundwater<br />
Storage and Recovery Project and <strong>San</strong> <strong>Francisco</strong> Groundwater<br />
Supply Project<br />
Prepared for: Greg Bartow and Jeff Gilman, SFPUC<br />
Prepared by: Sevim Onsoy and Michael Maley, Kennedy/Jenks Consultants<br />
1. Introduction<br />
This Technical Memorandum (TM) was prepared to document work performed by<br />
Kennedy/Jenks Consultants (Kennedy/Jenks) for the <strong>San</strong> <strong>Francisco</strong> Public Utilities Commission<br />
(SFPUC) pursuant to the amended Task Order (TO) authorizations CUW30103-TO-1.12 of the<br />
Regional Groundwater Storage and Recovery (GSR) Project and CUW30102-TO-2.7 of the <strong>San</strong><br />
<strong>Francisco</strong> Groundwater Supply (SFGW) Project. These projects are funded by the SFPUC’s<br />
Water System Improvement Program (WSIP).<br />
1.1. Purpose<br />
The main purpose of this TM is to document the setup and application of the groundwater<br />
modeling analysis being prepared to evaluate groundwater issues for the GSR and SFGW<br />
Projects. For evaluating conditions at Lake Merced, the Lake Merced Lake-Level Model (refer to<br />
as the Lake-Level Model) was also used as the primary tool. The existing Westside Basin<br />
Groundwater-Flow Model (referred to as the Westside Basin Groundwater Model) (HydroFocus<br />
2007, 2009, and 2011) was used as a quantitative tool to support analyses necessary for the<br />
groundwater issues that may occur during the implementation of the proposed GSR and SFGW<br />
Projects. The specific objectives of this TM are as follows:<br />
• To provide a brief overview of the existing Westside Basin Groundwater Model and the<br />
Lake-Level Model<br />
• To present the model scenario assumptions and modifications made to the model to<br />
develop the model scenarios<br />
• To present and evaluate the results from the simulated model scenarios<br />
This TM documents how the model was applied and provides an assessment for the application<br />
of the model results to specific groundwater issues that may result from the implementation of<br />
the proposed GSR and SFGW Projects. The evaluation of the model results with respect to<br />
these potential groundwater issues are presented in separate TMs listed below.<br />
D.5-5<br />
g:\isg-group\admin\job\08\0864001_sfpuc_eir support\09-reports\tech memos\tms\tm_10.1\tm 10-1_final.doc<br />
© Kennedy/Jenks Consultants, Inc.
Kennedy/Jenks Consultants<br />
Task 10.1 Technical Memorandum<br />
Greg Bartow and Jeff Gilman, SFPUC<br />
18 April 2012<br />
Page 2<br />
• Task 10.2 Assessment of Groundwater-Surface Water Interactions for the Regional<br />
Groundwater Storage and Recovery Project and <strong>San</strong> <strong>Francisco</strong> Groundwater Supply<br />
Project<br />
• Task 10.3 Assessment of Seawater Intrusion for the Regional Groundwater Storage and<br />
Recovery Project and <strong>San</strong> <strong>Francisco</strong> Groundwater Supply Project<br />
• Task 10.4 Changes in Groundwater Levels and Storage for the Regional Groundwater<br />
Storage and Recovery Project and <strong>San</strong> <strong>Francisco</strong> Groundwater Supply Project<br />
• Task 10.5 Assessment of Pumping Induced Land Subsidence for the Regional<br />
Groundwater Storage and Recovery Project and <strong>San</strong> <strong>Francisco</strong> Groundwater Supply<br />
Project<br />
• Task 10.6 Assessment of Changes in Groundwater Quality for the Regional<br />
Groundwater Storage and Recovery Project<br />
• Task 10.7 Well Interference Analysis for the Regional Groundwater Storage and<br />
Recovery Project and Cumulative Analysis<br />
• Task 10.8A Updated Analysis of Well Pumping Influences for the <strong>San</strong> <strong>Francisco</strong><br />
Groundwater Supply Project and Cumulative Analysis<br />
1.2. General Approach<br />
The overall scope of Task 10.1 was to model scenarios by applying the previously-developed<br />
Westside Basin Groundwater Model, by HydroFocus (2007, 2009, and 2011), as a supporting<br />
tool to assess potential physical effects that may result from the GSR and SFGW Project<br />
operations. The Westside Basin Groundwater Model is a regional, basin-wide groundwater<br />
model of the Westside Groundwater Basin (Westside Basin) in western <strong>San</strong> <strong>Francisco</strong> and <strong>San</strong><br />
Mateo County. The Westside Basin Groundwater Model developed by HydroFocus (2007, 2009,<br />
and 2011) for the City of Daly City (Daly City) was reviewed with assistance from the California<br />
Water Services Company (Cal Water), the City of <strong>San</strong> Bruno (<strong>San</strong> Bruno) and SFPUC, and the<br />
model was accepted for use in selected applications by all parties. Therefore, the Westside<br />
Basin Groundwater Model is a publicly available tool that is capable of supporting water<br />
resources planning and management on an ongoing basis (HydroFocus 2007, 2009, and 2011).<br />
The Lake-Level Model is a spreadsheet based water balance model that has been used for<br />
evaluating conditions at Lake Merced. The model has been used for various studies of Lake<br />
Merced by EDAW, Inc., and Talavera & Richardson (2004), LSCE (2008), Kennedy/Jenks<br />
(2009a, and 2009b), and Jacobs Associates (2011a and 2011b).<br />
The hydrogeological conceptual model that forms the basis for the Westside Basin Groundwater<br />
Model is based on the Task 8B Technical Memorandum No.1 Hydrologic Setting of the<br />
Westside Basin (TM#1) (LSCE, 2010). A summary of the hydrogeological conceptual model is<br />
presented in this TM to provide the context necessary for evaluating the model assumptions and<br />
setup.<br />
D.5-6<br />
g:\isg-group\admin\job\08\0864001_sfpuc_eir support\09-reports\tech memos\tms\tm_10.1\tm 10-1_final.doc<br />
© Kennedy/Jenks Consultants, Inc.
Kennedy/Jenks Consultants<br />
Task 10.1 Technical Memorandum<br />
Greg Bartow and Jeff Gilman, SFPUC<br />
18 April 2012<br />
Page 3<br />
Five model scenarios were constructed and simulated to evaluate potential groundwater and<br />
related hydrological effects from the GSR and SFGW Projects and from the cumulative<br />
scenario, which involves the GSR and SFGW Projects and other reasonably foreseeable future<br />
projects (e.g., the Vista Grande Drainage Basin Improvements Project as assessed by Jacobs<br />
Associates (2011a, 2011b) and the City of Daly City (2012)). The proposed GSR and SFGW<br />
Project pumping assumptions were incorporated into the groundwater model scenarios to<br />
evaluate the response of the model to projected pumping conditions under the proposed<br />
projects and the cumulative scenario and to analyze long-term regional basin-wide changes in<br />
groundwater levels and storage. The Lake-Level Model was applied to the five scenarios to<br />
evaluate potential groundwater-surface water interactions resulting from the proposed projects<br />
and the cumulative scenario.<br />
The activities undertaken in Task 10.1 are summarized below:<br />
• Documentation of Model Scenario Assumptions – The proposed five model<br />
scenarios simulated include Scenario 1 (also referred to as Existing Conditions without<br />
SFPUC Projects), Scenario 2 (GSR Project), Scenario 3a and Scenario 3b (SFGW<br />
Project), and Scenario 4 (Cumulative Scenario). Model assumptions for the five<br />
scenarios were developed. Potential model modifications to the recently updated<br />
Westside Groundwater Model were evaluated, particularly with respect to assumptions<br />
regarding pumping and recharge resulting from the hydrological data used in the model<br />
scenarios.<br />
• Model Scenario Simulations – This included setting up, running, and post-processing<br />
the five proposed model scenarios using the Westside Basin Groundwater Model. The<br />
model setup and model assumptions used in the five model scenarios are described in<br />
Sections 5 and 6.<br />
During the development of the proposed future model scenarios, modeling assumptions<br />
and modifications were reviewed and approved by SFPUC prior to running the model<br />
scenarios. In addition, the major model assumptions that were used in the scenarios<br />
were presented to the Partner Agencies (PAs) for the GSR Project (Daly City, Cal Water,<br />
and <strong>San</strong> Bruno), and the <strong>San</strong> <strong>Francisco</strong> <strong>Planning</strong> <strong>Department</strong>, Environmental <strong>Planning</strong><br />
Division (EP) for their review and approval prior to running the model for each scenario.<br />
• Lake Merced Lake-Level Model Scenario Simulations – The Lake-Level Model has<br />
been developed by SFPUC and others for the purpose of evaluating the feasibility of<br />
potential future projects on maintaining lake level in Lake Merced. Because of this<br />
history of use, the Lake-Level Model was used as the primary tool to evaluate the effects<br />
of the GSR and SFGW Projects and other reasonably foreseeable future projects on<br />
Lake Merced. The Lake-Level Model is a spreadsheet-based water balance model and<br />
offers a more realistic conceptualization of the water balance of the lake than the<br />
MODFLOW model. The model has been calibrated to historical measured lake levels<br />
and applied in this analysis to simulate the five scenarios that involve the GSR and<br />
SFGW Project scenarios and other reasonably foreseeable future projects. The model<br />
development, assumptions, and modifications are described in Section 8.<br />
D.5-7<br />
g:\isg-group\admin\job\08\0864001_sfpuc_eir support\09-reports\tech memos\tms\tm_10.1\tm 10-1_final.doc<br />
© Kennedy/Jenks Consultants, Inc.
Kennedy/Jenks Consultants<br />
Task 10.1 Technical Memorandum<br />
Greg Bartow and Jeff Gilman, SFPUC<br />
18 April 2012<br />
Page 4<br />
A brief overview of the proposed GSR and SFGW Projects and the hydrogeologic setting in<br />
the Westside Basin are presented in Sections 2 and 3, respectively. The Westside Basin<br />
Groundwater Model is the primary tool used for evaluating the effects of the SFGW, GSR<br />
and other reasonably foreseeable future projects with respect to key groundwater issues.<br />
The discussion in Sections 4, 5, 6 and 7 focuses on the Westside Basin Groundwater<br />
Model. The Lake-Level Model is only used to evaluate the effects of the GSR and SFGW<br />
Projects and other reasonably foreseeable future projects on Lake Merced lake levels.<br />
Section 8 presents the development and application of the Lake-Level Model for easier<br />
reference.<br />
D.5-8<br />
g:\isg-group\admin\job\08\0864001_sfpuc_eir support\09-reports\tech memos\tms\tm_10.1\tm 10-1_final.doc<br />
© Kennedy/Jenks Consultants, Inc.
Kennedy/Jenks Consultants<br />
Task 10.1 Technical Memorandum<br />
Greg Bartow and Jeff Gilman, SFPUC<br />
18 April 2012<br />
Page 5<br />
2. GSR and SFGW Project Description<br />
This section provides brief background information on the proposed projects that are considered<br />
as part of the model scenarios presented in this TM. The proposed projects include the GSR<br />
and SFGW Projects, and other reasonably foreseeable future projects that are considered as<br />
part of the Cumulative Scenario.<br />
2.1. GSR Project<br />
The GSR Project is a conjunctive use project that would increase groundwater supplies in the<br />
southern portion of the Westside Basin during periods of drought when SFPUC surface water<br />
supplies become limited (MWH, 2008). The GSR Project is based on the concept of providing<br />
available supplemental surface water from the SFPUC Regional Water System to the PAs. This<br />
water would be used by the PAs instead (or “in-lieu”) of pumping groundwater from the<br />
Westside Basin, thereby increasing the amount of groundwater that would be stored in the<br />
aquifer. During periods of drought, both the PAs and SFPUC would pump groundwater from the<br />
Westside Basin. The SFPUC plans to install 16 new production wells for the GSR Project to<br />
recover the stored groundwater.<br />
The GSR Project is sponsored by SFPUC in coordination with the PAs. The PAs historically<br />
have pumped groundwater from the southern portion of the Westside Basin (referred to as the<br />
South Westside Basin) for municipal purposes. Daly City and <strong>San</strong> Bruno serve municipal water<br />
demand in their respective cities. Cal Water serves South <strong>San</strong> <strong>Francisco</strong>, Colma, and a very<br />
small part of Daly City.<br />
For SFPUC, the GSR Project will ultimately develop enough groundwater pumping capacity to<br />
produce 8,100 acre-feet per year (afy), or 7.2 million gallons per day (mgd), in addition to<br />
groundwater extraction from existing PA wells (MWH, 2008). The project will be designed to<br />
provide up to 60,500 acre-feet (af) of stored water from the GSR Project wells to meet SFPUC<br />
system demands during the last 7.5 years of SFPUC’s Design Drought. The total duration of the<br />
Design Drought is 8.5 years. SFPUC anticipates that it will exercise its dry-year supplies after<br />
the first year of drought. Therefore, the storage is assumed to be used over the last 7.5 years of<br />
the Design Drought. The combined pumping rate (7.2 mgd) and duration (7.5 years) are<br />
consistent with the SFPUC’s dry-year demands as described in the Urban Water Management<br />
Plan (SFPUC, 2010).<br />
The SFPUC and PAs have developed the Draft GSR Project Operating Agreement (Draft GSR<br />
Operating Agreement) that is summarized in Attachment 10.1-A. The Draft GSR Operating<br />
Agreement can only be approved if the <strong>San</strong> <strong>Francisco</strong> <strong>Planning</strong> Commission certifies the<br />
Project Environmental Impact Report (EIR) and the SFPUC as the project sponsor approves the<br />
project. Following these actions, the SFPUC, Daly City, Cal Water, and <strong>San</strong> Bruno can then<br />
consider approval of the GSR Operating Agreement.<br />
Under the Draft GSR Operating Agreement, the SFPUC would "store" water in the South<br />
Westside Basin through the mechanism of in-lieu recharge by providing supplemental surface<br />
water to the PAs as a substitute for the PAs groundwater pumping. The supplemental water<br />
D.5-9<br />
g:\isg-group\admin\job\08\0864001_sfpuc_eir support\09-reports\tech memos\tms\tm_10.1\tm 10-1_final.doc<br />
© Kennedy/Jenks Consultants, Inc.
Kennedy/Jenks Consultants<br />
Task 10.1 Technical Memorandum<br />
Greg Bartow and Jeff Gilman, SFPUC<br />
18 April 2012<br />
Page 6<br />
deliveries would result in up to 60,500 af of "put" credits that would accrue to the SFPUC<br />
Storage Account. During shortages of SFPUC system water due to drought, emergencies or<br />
scheduled maintenance, or if the SFPUC Storage Account is at its full capacity of 60,500 af, the<br />
PAs would return to pumping from their existing wells. If a positive balance exists in the SFPUC<br />
Storage Account and there is a drought, then the SFPUC could also pump during this take<br />
period using the GSR Project wells installed by the SFPUC.<br />
2.1.1. Put/Take/Hold Sequence<br />
The GSR Project uses a “put/take/hold” sequence representing in-lieu groundwater recharge<br />
during wet years and groundwater extraction during dry years. The Hetch Hetchy and Local<br />
Simulation model (HH/LSM), which was used extensively for long term planning purposes in the<br />
SFPUC’s WSIP Program Environmental Impact Report (PEIR), outputs a put/take/hold<br />
sequence on a monthly basis together with a track of the volume of water stored in the SFPUC<br />
Storage Account (SFPUC, 2007; SFPUC, 2009a). As described below, the SFPUC Storage<br />
Account defines the amount of supplemental SFPUC system water that is stored in the<br />
groundwater basin, based on the amount of supplemental surface water deliveries to the PAs.<br />
The PEIR underpins the WSIP as a whole, and any individual WSIP project (including the GSR<br />
and SFGW Projects) must be as consistent with the PEIR as is practicable.<br />
For reference, put/take/hold periods within the HH/LSM monthly sequence and this TM are<br />
defined as follows:<br />
• A put period is a period where there are no water shortages and there is sufficient<br />
capacity in the SFPUC Storage Account for that account to be recharged. During put<br />
periods, the PAs would receive supplemental surface water from the SFPUC and reduce<br />
their groundwater pumping. As a result, the SFPUC surface water would be used “inlieu”<br />
of groundwater pumping, and the reduced pumping would effectively increase the<br />
volume of groundwater in storage that would be available during dry years or an<br />
extended drought.<br />
• A take period is a dry period when water shortages are triggered and water is taken from<br />
the SFPUC Storage Account. During these take periods, both the proposed GSR Project<br />
wells and the PA wells would extract groundwater. The SFPUC would recover<br />
groundwater that has already been “stored” or “banked” during put periods by pumping<br />
the proposed 16 GSR Project production wells in the South Westside Basin. In addition,<br />
the PAs would return to their typical groundwater pumping.<br />
• A hold period is a period where there are no water shortages, but the SFPUC Storage<br />
Account is “full” and supplemental water deliveries do not occur. During hold periods, the<br />
PAs would return to their typical groundwater pumping, and the GSR Project wells would<br />
pump only small amounts to exercise the wells.<br />
• In the PEIR, the put/take/hold conditions are defined as annual periods that run from<br />
July 1 to June 30 of the following calendar year. Therefore, the model scenarios start in<br />
July to simulate full annual put, take, or hold sequence.<br />
D.5-10<br />
g:\isg-group\admin\job\08\0864001_sfpuc_eir support\09-reports\tech memos\tms\tm_10.1\tm 10-1_final.doc<br />
© Kennedy/Jenks Consultants, Inc.
Kennedy/Jenks Consultants<br />
Task 10.1 Technical Memorandum<br />
Greg Bartow and Jeff Gilman, SFPUC<br />
18 April 2012<br />
Page 7<br />
2.1.2. SFPUC Storage Account<br />
The SFPUC Storage Account represents the volume of water that is stored during put periods<br />
as defined by the amount of supplemental surface water deliveries made to the PAs. The in-lieu<br />
recharge is assumed to match the amount of supplemental water deliveries to the PAs with no<br />
losses in the SFPUC Storage Account except during take periods of groundwater pumping.<br />
Accruals in the SFPUC Storage Account would be recorded based on metered, in-lieu surface<br />
water deliveries and corresponding metered decreases in groundwater pumping below<br />
"designated quantities" agreed to by the PAs (Attachment 10.1-A).<br />
A “Full SFPUC Storage Account” represents approximately 60,500 af of supplemental surface<br />
water deliveries to the PAs that are stored (or banked) in the basin in-lieu of groundwater<br />
pumping. This amount is based upon the designed operation of the GSR Project supplying an<br />
average of 7.2 mgd over the Design Drought (MWH, 2008). When 60,500 af of groundwater is<br />
stored in the basin, the SFPUC Storage Account would be considered full, and no additional<br />
supplemental water deliveries would occur.<br />
The SFPUC has developed an 8.5-year Design Drought for planning purposes. Over this<br />
8.5-year period, the SFPUC anticipates it will exercise its dry year supplies after the first year of<br />
the drought. Therefore, the 60,500 af of storage is assumed to be used over the 7.5 years of the<br />
Design Drought, with the GSR Project wells operating at a maximum capacity of 7.2 mgd.<br />
The GSR Project and the Cumulative Scenario involve the Full SFPUC Storage Account of<br />
60,500 af to maintain consistency of analysis with the PEIR studies and the assumptions made<br />
in the HH/LSM runs (SFPUC, 2007; SFPUC, 2009a). To achieve the Full SFPUC Storage<br />
Account, the model scenarios involving the GSR Project simulate the PA wells pumping at their<br />
reduced put period rates until the in-lieu recharge banked in the basin reaches the Full SFPUC<br />
Storage Account of 60,500 af. This amount includes the existing SFPUC Storage Account of<br />
approximately 20,000 af 1 at the beginning of the simulation (i.e., June 2009 initial conditions),<br />
and then adds approximately 40,500 af to the SFPUC Storage Account during the model<br />
simulation (assuming a put rate of 5.52 mgd by the PA wells that is equivalent to 80 percent of<br />
the total PA pumping of 6.9 mgd). Using the put rate of 5.52 mgd, it would take approximately<br />
6.5 years (or 79 months) to reach the Full SFPUC Storage Account condition of 60,500 af 2 .<br />
1 The accrued volume in the SFPUC Storage Account at the start of the model scenarios is approximately<br />
20,000 acre‐feet (af) based on records of in‐lieu exchange with the Partner Agencies (PAs) prior to July<br />
2009.<br />
2 Assuming the initial SFPUC Storage Account of 20,000 af in June 2009 and the put rate of 5.52 mgd (or<br />
6,182 afy), it would take 79 months, or approximately 6.5 years, to reach the Full SFPUC Storage<br />
Account of 60,500 af. This is equivalent to the difference in the Full SFPUC Storage Account and the<br />
initial SFPUC Storage Account (40,500 af = 60,500 af – 20,000 af) divided by the put rate (5.52 mgd =<br />
6,182 afy).<br />
D.5-11<br />
g:\isg-group\admin\job\08\0864001_sfpuc_eir support\09-reports\tech memos\tms\tm_10.1\tm 10-1_final.doc<br />
© Kennedy/Jenks Consultants, Inc.
Kennedy/Jenks Consultants<br />
Task 10.1 Technical Memorandum<br />
Greg Bartow and Jeff Gilman, SFPUC<br />
18 April 2012<br />
Page 8<br />
2.2. SFGW Project<br />
The SFGW Project would provide a reliable, local source of high-quality groundwater in the<br />
northern portion of the Westside Basin (North Westside Basin) to supplement the <strong>San</strong> <strong>Francisco</strong><br />
municipal water system.<br />
The SFGW Project would construct up to six wells and associated facilities in the western part<br />
of <strong>San</strong> <strong>Francisco</strong> and extract an annual average of up to 4.0 mgd of water from the North<br />
Westside Basin (SFPUC, 2009b). The extracted groundwater, which would be used both for<br />
regular and emergency water supply purposes, would be blended in small quantities with<br />
imported surface water before entering the municipal drinking water system for distribution. The<br />
SFGW Project includes two phases. Phase one would build four new groundwater wells at the<br />
Lake Merced Pump Station, West Sunset Playground, South Sunset Playground, and the<br />
Golden Gate Park Central Pump Station. Phase two would modify two existing irrigation wells<br />
(South Windmill Replacement and North Lake) in Golden Gate Park. With the future<br />
implementation of the Westside Recycled Water Project, North Lake and South Windmill<br />
Replacement wells in Golden Gate Park would be used to produce municipal supply as part of<br />
the SFGW Project, and irrigation pumping would be replaced with recycled water. If the<br />
Westside Recycled Water Project is not implemented, then phase two of SFGW Project would<br />
not occur.<br />
2.3. Vista Grande Drainage Basin Improvement Project<br />
The City of Daly City prepared the Vista Grande Drainage Basin Alternatives Analysis in 2011<br />
based on the recommendations of the Vista Grande Watershed Plan (City of Daly City, 2012).<br />
The purpose of the alternatives analysis is to develop and evaluate alternatives that will reduce<br />
or eliminate flooding, reduce erosion along Lake Merced, and provide other potential benefits<br />
such as habitat enhancement and lake level augmentation. The recommended program outlined<br />
in the plan includes construction of a new stormwater tunnel, construction of a detention basin in<br />
Westlake Park, and potential for treatment wetlands in <strong>San</strong> <strong>Francisco</strong> to treat stormwater for<br />
diversion from the Vista Grande Canal to Lake Merced (Jacobs Associates, 2011a, 2011b; City<br />
of Daly City, 2012).<br />
For the analysis of the GSR and SFGW Projects, the use of Lake Merced as part of the<br />
stormwater project for Daly City is considered to be one of the reasonably foreseeable future<br />
projects that are included as part of the Cumulative Scenario. Other cumulative projects are<br />
discussed in Section 5.4.<br />
D.5-12<br />
g:\isg-group\admin\job\08\0864001_sfpuc_eir support\09-reports\tech memos\tms\tm_10.1\tm 10-1_final.doc<br />
© Kennedy/Jenks Consultants, Inc.
Kennedy/Jenks Consultants<br />
Task 10.1 Technical Memorandum<br />
Greg Bartow and Jeff Gilman, SFPUC<br />
18 April 2012<br />
Page 9<br />
3. Physical Setting<br />
Understanding the hydrogeological conceptual model is important in assessing the results of the<br />
numerical Westside Basin Groundwater Model and the Lake-Level Model. This section provides<br />
a brief overview of the physical conditions within the project areas of the proposed GSR and<br />
SFGW Projects to provide necessary context in evaluating the setup and application of the<br />
model scenarios. The hydrogeologic conditions described include the regional geologic setting,<br />
aquifer formations, and surface water features. In addition, a brief discussion of the historical<br />
and recent pumping conditions in the basin is provided. A more detailed description of the<br />
regional geologic setting can be found in Technical Memorandum No. 1: Hydrologic Setting of<br />
the Westside Basin (LSCE, 2010).<br />
3.1. Westside Groundwater Basin<br />
The groundwater basin beneath the western part of <strong>San</strong> <strong>Francisco</strong> from the vicinity of Golden<br />
Gate Park and extending southeasterly into <strong>San</strong> Mateo County is identified in the California<br />
<strong>Department</strong> of Water Resources (DWR) Bulletin 118 as both the Merced Valley Basin and the<br />
Westside Basin (DWR, 2003). Since it is more commonly known as the Westside Basin, this<br />
designation is used in this TM. In addition, more recent DWR initiatives use the Westside Basin<br />
name (e.g., California Statewide Groundwater Elevation Monitoring Program). Figure 10.1-1<br />
shows the boundary of the Westside Basin.<br />
For discussion purposes in this TM, the Westside Basin, which covers about 40 square miles in<br />
area, has been divided into northern and southern portions at the <strong>San</strong> <strong>Francisco</strong> County-<strong>San</strong><br />
Mateo County line. This subdivision is a political division, which is not representative of a<br />
physical boundary, and is not meant to imply that there is any restriction of groundwater flow<br />
between the two areas. The portion of the basin that lies within <strong>San</strong> <strong>Francisco</strong> County is<br />
referred to as the North Westside Basin, which has an area of approximately 15 square miles<br />
(Figure 10.1-1). The portion of the basin that lies within <strong>San</strong> Mateo County is referred to as the<br />
South Westside Basin with an area of approximately 25 square miles underlying Daly City,<br />
Colma, South <strong>San</strong> <strong>Francisco</strong>, <strong>San</strong> Bruno, Millbrae, and Burlingame (Figure 10.1-1) (SFPUC,<br />
2010).<br />
The Westside Basin is bounded by bedrock highs in Golden Gate Park to the north and at<br />
Coyote Point to the south (DWR, 2003; Rogge, 2003; <strong>San</strong> Bruno, 2007). <strong>San</strong> Bruno Mountain<br />
and <strong>San</strong> <strong>Francisco</strong> Bay form the eastern boundary of the Basin (Cal Water, 2006). The <strong>San</strong><br />
Andreas Fault and Pacific Ocean form the western boundary, and its southern limit is defined by<br />
a bedrock high that separates it from the <strong>San</strong> Mateo Plain Groundwater Basin (DWR, 2003;<br />
Rogge, 2003; <strong>San</strong> Bruno, 2007). The Westside Basin opens to the Pacific Ocean on the<br />
northwest and <strong>San</strong> <strong>Francisco</strong> Bay on the southeast. The major structural features include the<br />
<strong>San</strong> Andreas Fault system and the Serra Fault.<br />
D.5-13<br />
g:\isg-group\admin\job\08\0864001_sfpuc_eir support\09-reports\tech memos\tms\tm_10.1\tm 10-1_final.doc<br />
© Kennedy/Jenks Consultants, Inc.
Kennedy/Jenks Consultants<br />
Task 10.1 Technical Memorandum<br />
Greg Bartow and Jeff Gilman, SFPUC<br />
18 April 2012<br />
Page 10<br />
3.2. Aquifers<br />
The Westside Basin includes five major geologic formations: Franciscan Complex, Merced<br />
Formation, Colma Formation, Dune <strong>San</strong>ds, and Bay Deposits (LSCE, 2010). Groundwater<br />
development in the Westside Basin primarily occurs in various aquifer units in the Colma and<br />
Merced Formations from the Golden Gate Park area, through Daly City and South <strong>San</strong><br />
<strong>Francisco</strong>, to <strong>San</strong> Bruno. The Merced Formation is the primary water-producing aquifer in the<br />
Basin (LSCE, 2006). Within the two major water bearing zones in the Westside Basin, there are<br />
multiple smaller aquifer zones that are delineated vertically by different sand and clay layers<br />
within the Merced and Colma formations. The thickness and extent of these interbedded sand<br />
and clay layers vary spatially throughout the Westside Basin. The aquifer units in the Westside<br />
Basin are further described in TM#1 (LSCE, 2010).<br />
All of the municipal groundwater extraction wells in Daly City, South <strong>San</strong> <strong>Francisco</strong>, and <strong>San</strong><br />
Bruno are screened in the deeper, semi-confined to confined aquifers in the Merced Formation,<br />
where the water quality is better than in shallower aquifers (<strong>San</strong> Bruno, 2007). The Colma<br />
Formation is of interest because Lake Merced is incised within this formation (LSCE, 2006).<br />
For discussion purposes, the aquifer units are informally designated as the Shallow Aquifer, the<br />
Primary Production Aquifer, and the Deep Aquifer. The Shallow Aquifer is limited to the vicinity<br />
of Lake Merced and the area north towards Golden Gate Park, and the Primary Production<br />
Aquifer is generally present throughout much of the Westside Basin (LSCE, 2010). In the North<br />
Westside Basin, aquifer units are separated by two distinctive fine-grained units, known as the<br />
-100-foot clay and the W-clay (LSCE, 2004). In the Daly City area, the -100-foot clay is absent,<br />
and the aquifer system is primarily composed of the Primary Production Aquifer overlying the<br />
W-Clay and the Deep Aquifer underlying the W-Clay. Further to the south in the South <strong>San</strong><br />
<strong>Francisco</strong> area, the W-Clay is absent and the Primary Production Aquifer is split into shallow<br />
and deep units that are separated by a thick fine-grained unit at an elevation of approximately<br />
300 feet below mean sea level (msl). The Primary Production Aquifer in the <strong>San</strong> Bruno area is<br />
located at an elevation less than -200 feet, and it underlies a thick, surficial predominantly<br />
fine-grained unit comprised of clay, sandy clay, and sand beds (LSCE, 2010).<br />
3.3. Groundwater Flow<br />
Groundwater levels and the general direction of groundwater flow vary in the Westside Basin. At<br />
the northern end of the Westside Basin, groundwater in the Shallow Aquifer tends to flow in a<br />
westerly direction towards the Pacific Ocean. From South <strong>San</strong> <strong>Francisco</strong> southward to<br />
Burlingame in the vicinity of <strong>San</strong> <strong>Francisco</strong> Bay, groundwater within shallow units overlying the<br />
Primary Production Aquifer generally flows east towards <strong>San</strong> <strong>Francisco</strong> Bay (Rogge, 2003; <strong>San</strong><br />
Bruno, 2007). Groundwater from the vicinity of Lake Merced north to Stern Grove and Golden<br />
Gate Park is encountered at relatively shallow depths (ranging from approximately 5 to 60 feet),<br />
while south of Lake Merced the depth to groundwater can exceed 300 feet (LSCE, 2006).<br />
Based on groundwater level data measured during spring and fall 2009 monitoring events,<br />
groundwater elevation contours were prepared for the Shallow Aquifer and the Primary<br />
D.5-14<br />
g:\isg-group\admin\job\08\0864001_sfpuc_eir support\09-reports\tech memos\tms\tm_10.1\tm 10-1_final.doc<br />
© Kennedy/Jenks Consultants, Inc.
Kennedy/Jenks Consultants<br />
Task 10.1 Technical Memorandum<br />
Greg Bartow and Jeff Gilman, SFPUC<br />
18 April 2012<br />
Page 11<br />
Production Aquifer and presented in the 2009 Westside Basin Groundwater Monitoring Report<br />
(SFPUC, 2010). The 2009 groundwater elevation contour maps also include data from three<br />
monitoring wells that were installed by SFPUC in 2009 in the South Westside Basin in Daly City,<br />
<strong>San</strong> Bruno, and Millbrae. The contours of groundwater elevation for the Shallow Aquifer exhibit<br />
westerly groundwater flow directions both in spring and fall 2009, with higher groundwater<br />
elevations in the eastern portion of the aquifer than the western portion near the Pacific Coast.<br />
No significant differences in flow directions were identified through the spring and fall 2009.<br />
Based on the spring and fall 2009 monitoring events, the contours of groundwater elevation for<br />
the Primary Production Aquifer exhibit westerly groundwater flow directions in the North<br />
Westside Basin, similar to the Shallow Aquifer, and a southerly flow direction from the Lake<br />
Merced area towards Daly City and South <strong>San</strong> <strong>Francisco</strong>. The southerly groundwater flow<br />
gradient between Daly City and South <strong>San</strong> <strong>Francisco</strong> appears to be relatively flat as compared<br />
to the steep gradient between Lake Merced and Daly City (SFPUC, 2010; LSCE, 2010).<br />
3.4. Lakes<br />
The most notable surface water feature of the Westside Basin is Lake Merced, located in<br />
southwestern <strong>San</strong> <strong>Francisco</strong> (Figure 10.1-1). Lake Merced is a freshwater lake, bounded by<br />
Skyline Boulevard, Lake Merced Boulevard, and John Muir Boulevard, approximately 0.25 mile<br />
east of the Pacific Ocean. Lake Merced is a major natural habitat for many species of birds and<br />
waterfowl and a regional recreational venue offering fishing, boating, bicycling, and wildlife<br />
viewing. The lake, composed of four water bodies named North Lake, East Lake, South Lake,<br />
and Impound Lake, is incised within the upper portion of the Shallow Aquifer, representing a<br />
surface expression of groundwater table. In the early 1990s several investigations were<br />
conducted and have continued on a regular basis to investigate and monitor the lake levels and<br />
lake-aquifer interactions (LSCE, 2002, 2004, and 2010).<br />
Pine Lake is a small, shallow lake approximately three acres in size, located north-northeast of<br />
Lake Merced in the westernmost portion of Stern Grove and Pine Lake Park. Groundwater<br />
produced by the Stern Grove well is used for maintaining water levels in Pine Lake (personal<br />
comm., Jeff Gilman, 2010).<br />
Golden Gate Park, located in the North Westside Basin, contains several artificial lakes that are<br />
used for recreation and are lined with clay to minimize leakage; however, several of the lakes<br />
reportedly leak a considerable amount of water to the water table (Yates et al., 1990).<br />
Groundwater pumped from the three Golden Gate Park wells (Elk Glen, North Lake, and South<br />
Windmill Replacement wells) is used for irrigation and for maintaining the artificial lakes<br />
(personal comm., Jeff Gilman, 2011).<br />
3.5. Groundwater Pumping<br />
Groundwater pumping in the Westside Basin occurs for municipal, irrigation and other<br />
non-potable uses (golf courses, zoo, parks, and cemeteries). Groundwater pumping is the most<br />
significant groundwater outflow component for the Westside Basin. Almost all historical<br />
D.5-15<br />
g:\isg-group\admin\job\08\0864001_sfpuc_eir support\09-reports\tech memos\tms\tm_10.1\tm 10-1_final.doc<br />
© Kennedy/Jenks Consultants, Inc.
Kennedy/Jenks Consultants<br />
Task 10.1 Technical Memorandum<br />
Greg Bartow and Jeff Gilman, SFPUC<br />
18 April 2012<br />
Page 12<br />
groundwater development in the Westside Basin has been in the South Westside Basin for<br />
municipal supply in Daly City, South <strong>San</strong> <strong>Francisco</strong>, and <strong>San</strong> Bruno and golf course and<br />
cemetery irrigation. Total municipal pumping in the Westside Basin was about 7,500 afy from<br />
the mid-1970s to the mid-1980s, and then ranged from 6,000 afy to 8,000 afy until 2001. From<br />
2002 to 2007, total municipal pumping fluctuated greatly as a result of the In-Lieu Recharge<br />
Demonstration Study conducted by SFPUC, Daly City, Cal Water (in South <strong>San</strong> <strong>Francisco</strong>), and<br />
<strong>San</strong> Bruno (LSCE, 2005; LSCE, 2010). Historical trends and recent pumping conditions for<br />
municipal, irrigation, and other non-potable pumping are summarized below. Groundwater<br />
pumping in the Basin is described in detail in TM#1 (LSCE, 2010).<br />
Daly City – Groundwater pumping by Daly City increased from about 1,000 afy to nearly<br />
5,000 afy between 1950 and 1970. Since then, groundwater pumping has ranged between<br />
approximately 3,000 afy and 5,000 afy, where it remained until October 2002, when an increase<br />
in deliveries from SFPUC’s Regional Water System were made available to replace the majority<br />
of Daly City’s groundwater supply as part of the In-Lieu Recharge Demonstration Study (LSCE,<br />
2005). Daly City pumping totaled about 3,600 af for 2008 (LSCE, 2010). Supplemental water<br />
deliveries by SFPUC to Daly City resumed in 2009. Daly City pumping was approximately<br />
1,667 af in 2009 (SFPUC, 2010) and 1,743 af in 2010 (SFPUC, 2011). Based on the long-term<br />
pumping records from 1959 to 2009, the median pumping by Daly City is estimated to be<br />
3.78 mgd (or approximately 4,235 af).<br />
Cal Water – Groundwater pumping by Cal Water in South <strong>San</strong> <strong>Francisco</strong> has progressively<br />
declined from about 2,200 afy in 1947, to about 1,600 afy in 1969, to about 1,200 afy in 2002.<br />
The decreases in groundwater pumping have been offset by increases in SFPUC’s Regional<br />
Water System deliveries. In early 2003, groundwater pumping in South <strong>San</strong> <strong>Francisco</strong> was<br />
discontinued as part of the In-Lieu Recharge Demonstration Study (LSCE, 2005) that ended in<br />
early 2005 in South <strong>San</strong> <strong>Francisco</strong>. Groundwater pumping for municipal supply in South <strong>San</strong><br />
<strong>Francisco</strong> resumed on a limited basis in March 2008 and totaled 206 af during 2008 (LSCE,<br />
2010). Groundwater pumping by Cal Water was 380 af in 2009 (SFPUC, 2010) and 453 af in<br />
2010 (SFPUC, 2011). Based on the long-term pumping records from 1959 to 2009, the median<br />
pumping by Cal Water is estimated to be 1.18 mgd (or approximately 1,320 af).<br />
<strong>San</strong> Bruno – Pumping in <strong>San</strong> Bruno ranged from approximately 1,000 afy to 2,300 afy from<br />
1950 to the late 1990s and from 1,700 afy to 3,100 afy from the late 1990s through 2001. In<br />
2002, <strong>San</strong> Bruno decreased groundwater pumping to approximately 1,240 af and further<br />
decreased groundwater production to about 550 af in 2003 and 2004 as part of the In-Lieu<br />
Recharge Demonstration Study (LSCE, 2005). <strong>San</strong> Bruno pumping resumed to about 1,800 afy<br />
to 2,300 afy after cessation of the In-Lieu Recharge Demonstration Study in early 2005 (LSCE,<br />
2010). Groundwater pumping by <strong>San</strong> Bruno was 2,379 af in 2009 (SFPUC, 2010) and 2,364 af<br />
in 2010 (SFPUC, 2011). Based on the long-term pumping records from 1959 to 2009, the<br />
median pumping by <strong>San</strong> Bruno is estimated to be 1.88 mgd (or approximately 2,110 af).<br />
Irrigation and Other Non-Potable Groundwater Pumping – Groundwater has historically<br />
been developed for irrigation supply and other non-potable uses in the Westside Basin, most<br />
notably on golf courses around Lake Merced, cemeteries in Colma, at the <strong>San</strong> <strong>Francisco</strong> Zoo,<br />
D.5-16<br />
g:\isg-group\admin\job\08\0864001_sfpuc_eir support\09-reports\tech memos\tms\tm_10.1\tm 10-1_final.doc<br />
© Kennedy/Jenks Consultants, Inc.
Kennedy/Jenks Consultants<br />
Task 10.1 Technical Memorandum<br />
Greg Bartow and Jeff Gilman, SFPUC<br />
18 April 2012<br />
Page 13<br />
and in Golden Gate Park. In 2005, the delivery of recycled water for irrigation largely reduced<br />
groundwater use at the golf courses around Lake Merced, leaving the cemeteries, California<br />
Golf Club, <strong>San</strong> <strong>Francisco</strong> Zoo, and Golden Gate Park as the notable pumpers for irrigation and<br />
other non-potable uses at an estimated 3,000 afy (SFPUC, 2009c; Carollo, 2008).<br />
Given the estimated historical irrigation pumping of about 6,000 afy, total combined pumping of<br />
groundwater for municipal and irrigation uses is estimated to have ranged from 12,000 afy to<br />
14,000 afy from the mid-1980s through 2001. During the In-Lieu Recharge Demonstration Study<br />
conducted by SFPUC in coordination with the PAs from October 2002 to March 2005, municipal<br />
pumping by Daly City, Cal Water, and <strong>San</strong> Bruno was reduced as a result of SFPUC’s<br />
supplemental surface water deliveries to the PAs in-lieu of municipal pumping by the PAs. Total<br />
pumping (municipal and irrigation) in 2005 was estimated to range from 5,500 af to 6,500 af.<br />
Total pumping between 2006 and 2010 remained below 9,000 af, ranging from 5,400 af in 2006<br />
to 8,500 af in 2008. Total pumping in the Westside Basin in 2009 was estimated to be 6,800 af<br />
(SFPUC, 2010).<br />
D.5-17<br />
g:\isg-group\admin\job\08\0864001_sfpuc_eir support\09-reports\tech memos\tms\tm_10.1\tm 10-1_final.doc<br />
© Kennedy/Jenks Consultants, Inc.
Kennedy/Jenks Consultants<br />
Task 10.1 Technical Memorandum<br />
Greg Bartow and Jeff Gilman, SFPUC<br />
18 April 2012<br />
Page 14<br />
4. Westside Basin Groundwater Model<br />
The Westside Basin Groundwater Model is a regional, basin-wide groundwater model of the<br />
Westside Groundwater Basin in western <strong>San</strong> <strong>Francisco</strong> and <strong>San</strong> Mateo County (Figure 10.1-2).<br />
4.1. History of Model Development<br />
The Westside Basin Groundwater Model was first developed through Daly City’s 2002-2003<br />
AB303-funded investigation of the Westside Groundwater Basin (City of Daly City, 2003).<br />
During the period 2003-2007, additional work funded by Daly City, <strong>San</strong> Bruno, Cal Water, and<br />
SFPUC further developed and calibrated the model (HydroFocus, 2007). In 2009, a revised<br />
groundwater model (version 2.1) was released that included several corrections and<br />
improvements to the model’s historical pumping data set with no adjustments to the modeled<br />
aquifer parameter values (HydroFocus, 2009). The most recent modeling work (version 3.1)<br />
includes an updated historical calibration and a no-project scenario that is documented in detail<br />
by HydroFocus (2011). A brief summary of the 2011 updates includes the following:<br />
• Historical Simulation – The updated Historical Simulation (version 3.1) simulates monthly<br />
hydrologic conditions during the period October 1958 through September 2009. The<br />
simulation period is discretized into monthly stress periods. The Historical Simulation<br />
was extended from 47 years to 51 years, with the extended model period covering<br />
December 2005 to September 2009.<br />
• Updated Model Parameters – During model calibration, several corrections,<br />
modifications and improvements were made to the model structure, aquifer parameters<br />
and boundary conditions based on new data and from review of model performance.<br />
Modifications are noted in the following with more detailed discussion of the model in<br />
Section 4.2.<br />
• 2008 No-Project Scenario – This scenario is based on a 47-year simulation period that<br />
uses the hydrologic conditions from October 1958 to December 2005 using the<br />
calibrated Historical Simulation version 3.1<br />
The Historical Simulation calibration period of 51 years covers various types of hydrological<br />
events ranging from wet periods to droughts of different magnitude and duration, allowing<br />
adequate time for analyzing basin response under various hydrological conditions.<br />
The 2008 No-Project Scenario assumes no new projects but includes new supply wells, planned<br />
operational changes in the magnitude and spatial distribution of pumping, and existing recycled<br />
water projects as of May 2008. The 2008 No-Project Scenario was used as the starting point for<br />
developing Scenario 1 (or the Existing Conditions) for this modeling analysis.<br />
4.2. Model Overview<br />
This section summarizes the model representation of the Westside Basin, including the model<br />
extent, model layer structure, aquifer properties used in the model, and model boundary<br />
D.5-18<br />
g:\isg-group\admin\job\08\0864001_sfpuc_eir support\09-reports\tech memos\tms\tm_10.1\tm 10-1_final.doc<br />
© Kennedy/Jenks Consultants, Inc.
Kennedy/Jenks Consultants<br />
Task 10.1 Technical Memorandum<br />
Greg Bartow and Jeff Gilman, SFPUC<br />
18 April 2012<br />
Page 15<br />
conditions. This is intended as an overview of the detailed discussion of the model<br />
representation reported previously by HydroFocus (2007, 2009, and 2011). These aspects of<br />
the model remain the same and were not modified for the purposes of the modeling analysis<br />
documented in this TM.<br />
4.2.1. Model Structure<br />
The Westside Basin Groundwater Model was constructed using MODFLOW 2000, a<br />
finite-difference numerical modeling software developed by the United States Geological Survey<br />
(USGS) (Harbaugh et al., 2000). Model coordinates are based on the California State Plane<br />
Zone 3 coordinate system of the North American Datum of 1983 (NAD 83), in units of feet. The<br />
vertical datum is the National Geodetic Vertical Datum of 1929 (NGVD 29). All model inputs are<br />
based on English units for length (feet) and time (days) (HydroFocus, 2007).<br />
The model domain is the geographical area covered by the numerical model. The model domain<br />
is mostly consistent with the extent of the Westside Basin and extends into the Pacific Ocean<br />
along the western boundary and <strong>San</strong> <strong>Francisco</strong> Bay along the eastern boundary, as shown in<br />
Figure 10.1-2.<br />
The model grid provides the mathematical structure for developing and operating the numerical<br />
model. The Westside Basin Groundwater Model domain is divided into a set of grid cells (grid<br />
discretization), containing 189 rows and 126 columns. The cells in horizontal directions have<br />
variable dimensions ranging from 250 feet near Lake Merced to 1,000 feet near the model<br />
edges.<br />
Model layers provide vertical resolution for the model to simulate variations in groundwater<br />
elevations and aquifer stresses with depth. In the vertical direction, the Westside Basin<br />
Groundwater Model is composed of five layers to characterize the conceptual basin geology.<br />
Figure 10.1-3 shows the representation of the model layering superimposed on the regional<br />
north-to-south subsurface cross-section. The upper surface of the model represents the land<br />
surface topography, and the bottom of Model Layer 5 represents the bedrock surface elevation.<br />
Land surface elevations were determined using digital elevation models (DEM) that specify land<br />
surface elevation at horizontal locations uniformly spaced about 90 feet apart (HydroFocus,<br />
2007, 2009, and 2011).<br />
For the Westside Basin Groundwater Model version 3.1, adjustments to the model layering were<br />
completed to incorporate new data. Top and bottom model layer elevations were updated using<br />
information from recently installed monitoring wells, new depth-to-bedrock information, and<br />
updated hydrogeologic sections (HydroFocus, 2011).<br />
4.2.2. Aquifer Properties<br />
Aquifer properties (e.g., horizontal and vertical hydraulic conductivity, specific storage, and<br />
specific yield) describe the physical characteristics of the aquifer and the hydraulic properties<br />
that control groundwater flow. The numerical model requires that these properties are defined<br />
for every active cell in the model. In the Westside Basin Groundwater Model version 3.1,<br />
D.5-19<br />
g:\isg-group\admin\job\08\0864001_sfpuc_eir support\09-reports\tech memos\tms\tm_10.1\tm 10-1_final.doc<br />
© Kennedy/Jenks Consultants, Inc.
Kennedy/Jenks Consultants<br />
Task 10.1 Technical Memorandum<br />
Greg Bartow and Jeff Gilman, SFPUC<br />
18 April 2012<br />
Page 16<br />
adjustments were made to calibrate horizontal and vertical conductivity values in the parameter<br />
zones; no changes were made to specific yield or specific storage. These are discussed in<br />
greater detail in the HydroFocus report (2011).<br />
In the Westside Basin Groundwater Model, Model Layer 1 was specified as convertible and<br />
Model Layers 2 through 5 were specified as confined. Under the convertible conditions,<br />
MODFLOW calculates the transmissivity of each model cell as the assigned hydraulic<br />
conductivity multiplied by the saturated thickness as defined by the simulated groundwater<br />
elevation and the bottom of the model layer, and the storage coefficient is the specific yield<br />
(Harbaugh et al., 2000). For the confined Model Layers 2 through 5, the transmissivity is the<br />
product of the layer thickness and hydraulic conductivity, and the storage coefficient is the<br />
product of layer thickness and specific storage.<br />
Each model layer in the Westside Basin Groundwater Model was divided into subareas (also<br />
referred to as parameter zones) within which aquifer parameters are assumed to be uniform.<br />
The delineation of the parameter zones and calibrated aquifer parameters associated with the<br />
parameter zones as used in the updated Historical Simulation and the 2008 No-Project<br />
Scenario were described by HydroFocus (2007, 2009, and 2011). The parameter zones were<br />
modified in version 3.1 to account for updated geologic information and the spatial distribution of<br />
new monitoring well locations (HydroFocus, 2011).<br />
4.2.3. Boundary Conditions<br />
Model boundary conditions represent areas where groundwater enters and exits the model<br />
domain. Boundary condition data must be entered for each stress period at each boundary<br />
condition cell, other than no-flow cells. The model boundaries in the existing Historical<br />
Simulation and the 2008 No-Project Scenario are represented as follows:<br />
• Groundwater pumpage in the model was represented using the well package. In the<br />
MODFLOW well package, the monthly groundwater pumping extraction rates are<br />
specified in the model cell and layer corresponding to each well location and for each<br />
stress period. A detailed description of the MODFLOW well package can be found<br />
elsewhere (Harbaugh et al., 2000).<br />
• The MODFLOW drain package was included to represent shallow groundwater<br />
discharge from Model Layer 1 in the Bay Plain subarea. Evidence for shallow<br />
groundwater and seepage includes groundwater encountered in shallow monitoring<br />
wells (for example, at leaky underground storage tank sites), sustained baseflow in the<br />
Colma Creek gauging record (1 to 2 cubic feet per second (cfs)), and the visible<br />
presence of creek channels and ditches inland throughout the Bay Plain as far west as<br />
Highway 101 (HydroFocus, 2011).<br />
• Lake Merced was simulated with the lake package (MODFLOW 2000 LAK3 package) to<br />
simulate the hydraulic interaction between Lake Merced and the adjoining groundwater<br />
system, and to estimate the amount of inflow and outflow across the lakebed. The lake<br />
package consists of several data sets (e.g., initial lake level, inflows to and outflows from<br />
D.5-20<br />
g:\isg-group\admin\job\08\0864001_sfpuc_eir support\09-reports\tech memos\tms\tm_10.1\tm 10-1_final.doc<br />
© Kennedy/Jenks Consultants, Inc.
Kennedy/Jenks Consultants<br />
Task 10.1 Technical Memorandum<br />
Greg Bartow and Jeff Gilman, SFPUC<br />
18 April 2012<br />
Page 17<br />
the lake such as rainfall, evaporation, runoff, lake additions, and withdrawals) to couple<br />
the groundwater flow system with the lake water budget and to calculate lake levels and<br />
inflow and outflow across the lakebed. Documentation of the MODFLOW LAK3 package<br />
can be found in Merritt and Konikow (2000).<br />
• Rainfall, temperature, and municipal water use input data sets for the Soil Moisture<br />
Budget (SMB) model were extended to include the period January 2006 through<br />
September 2009. The SMB is used to estimate recharge from precipitation and return<br />
flows and is entered into the model using the MODFLOW recharge package. In version<br />
3.1, changes were made to simulate rainfall and the spatial temperature distribution,<br />
which resulted in an about 7-percent decrease in average rainfall in the Westside Basin<br />
relative to version 2.1 over the historical model period from 1959 and 2009 (HydroFocus,<br />
2011).<br />
• The Serra Fault was represented as a no-flow boundary in the southwest and as a<br />
horizontal flow barrier in the northwest. The <strong>San</strong> Andreas Fault was represented as a<br />
no-flow boundary.<br />
• Groundwater seepage from the lakes and ponds in Golden Gate Park was represented<br />
using the MODFLOW well package as a specified flux boundary that adds water to the<br />
aquifer at a constant rate equal to the measured leakage rate (HydroFocus, 2007). A<br />
seepage investigation found that total lake leakage was 627 acre-feet per year<br />
(SFRPD, 1994).<br />
• <strong>San</strong> <strong>Francisco</strong> Bay and the Pacific Ocean were represented as constant head<br />
boundaries with head values of zero feet NGVD 29.<br />
• No-flow boundaries were specified along the northern edge of the onshore part of the<br />
basin boundary near Golden Gate Park, near the eastern end of Golden Gate Park, the<br />
southern boundary, and the onshore part of the eastern boundary.<br />
4.3. Summary of Model Strengths and Limitations<br />
A calibrated numerical model, such as the Westside Basin Groundwater Model, is considered<br />
capable of reasonable simulation quality. However, when evaluating model results, it is<br />
important to consider the strengths and limitations of the model. This section summarizes the<br />
strengths and limitations of the Westside Basin Groundwater Model based on previous<br />
modeling analyses, reports, and documentation (HydroFocus, 2007, 2009, and 2011).<br />
4.3.1. Version 3.1 Model Calibration<br />
Simulated groundwater levels in version 3.1 were calibrated to the available measured<br />
groundwater elevations collected during the simulation period at various locations throughout<br />
the Basin (HydroFocus, 2011). After the model was recalibrated, the basin-wide root-meansquare-error<br />
(RMSE) was reduced from 25.8 to 18.9 feet. The RMSE is a statistical measure<br />
that evaluates the average difference (or residual) between modeled and observed groundwater<br />
D.5-21<br />
g:\isg-group\admin\job\08\0864001_sfpuc_eir support\09-reports\tech memos\tms\tm_10.1\tm 10-1_final.doc<br />
© Kennedy/Jenks Consultants, Inc.
Kennedy/Jenks Consultants<br />
Task 10.1 Technical Memorandum<br />
Greg Bartow and Jeff Gilman, SFPUC<br />
18 April 2012<br />
Page 18<br />
levels and provides a measure of the overall error in the model. Therefore, the calibration<br />
results indicate that, on average, modeled groundwater levels are within about 19 feet of<br />
observed water levels. The RMSE represents about 4 percent of the total range in observed<br />
water levels across the model. This ratio shows how the model error relates to the overall<br />
hydraulic gradient across the model. Typically, a calibration is considered good when this ratio<br />
is below 15 percent (ESI, 2001).<br />
Another calibration measure is the residual mean, which includes positive and negative<br />
residuals depending on whether the modeled results are higher or lower than the measured<br />
groundwater levels. The residual mean provides a measure of the average deviation between<br />
modeled and observed water levels. In version 3.1, the residual mean is fairly small and positive<br />
(1.6 feet) indicating simulated water levels are on average slightly higher than the observed<br />
water levels. These calibration results indicate that the updated model is a reasonable tool for<br />
basin-scale analyses and comparisons of water resources management alternatives. Some<br />
degree of difference or residual between the observed and model simulated groundwater<br />
elevations is expected because residuals may be due in part to localized effects or data quality<br />
issues.<br />
4.3.2. Model Strengths<br />
The Westside Basin Groundwater Model was developed to assist basin-wide data interpretation<br />
and system understanding and is considered a reliable data analysis tool for various purposes.<br />
The model provides a means to synthesize data and integrate processes that potentially<br />
influence groundwater conditions. It was developed over a period of several years under the<br />
oversight of several technical groups. The model input represents agreed-upon conceptual<br />
hydrogeologic and water use conditions as presently understood in the Westside Groundwater<br />
Basin. The model was calibrated using more than 2,000 observed monthly water levels in<br />
125 wells representing a broad range of locations, depths and hydrologic conditions. The<br />
numerical model provides information and insights that cannot be obtained from available field<br />
measurements and/or analytical tools without the capability to synthesize and integrate all<br />
processes that potentially influence groundwater conditions (HydroFocus, 2011).<br />
As suggested by HydroFocus (2007), the strongest predictive ability of the existing model is in<br />
relative changes over time, rather than absolute predictions of water levels. Therefore, this<br />
regional model is most capable of analyzing differences in water level rather than the actual<br />
groundwater elevation output by the model. In addition, HydroFocus (2007) states that the<br />
model is best suited for assessing groundwater levels and storage changes over large<br />
parameter zones, which vary in size from 476 acres to nearly 10,000 acres, as the Historical<br />
Simulation calibration was performed with the average conditions in these zones in mind. In<br />
other words, the model may not be able to re-create the groundwater elevations at local areas<br />
or at a single well correctly, but the composite statistics of that well and many others nearby are<br />
much more accurate and representative. As described by HydroFocus (2007), the model was<br />
initially developed as a tool to assist with the following types of evaluations and groundwater<br />
management scenarios:<br />
D.5-22<br />
g:\isg-group\admin\job\08\0864001_sfpuc_eir support\09-reports\tech memos\tms\tm_10.1\tm 10-1_final.doc<br />
© Kennedy/Jenks Consultants, Inc.
Kennedy/Jenks Consultants<br />
Task 10.1 Technical Memorandum<br />
Greg Bartow and Jeff Gilman, SFPUC<br />
18 April 2012<br />
Page 19<br />
• Regional (basin-wide) data interpretation and system understanding:<br />
o<br />
o<br />
Basin management decisions.<br />
Monitoring networks and existing data gaps.<br />
• Regional water supply project operations (for example, conjunctive use and local<br />
groundwater water projects) by assessing the following types of changes due to changes<br />
in pumping rates and patterns:<br />
o<br />
o<br />
o<br />
o<br />
Changes in water table and deeper groundwater elevations (magnitude and<br />
trends).<br />
Changes in Lake Merced water levels (magnitude and trends).<br />
Changes in the quantity of water stored in the basin.<br />
Changes in the water budget and potential for saltwater (or seawater) intrusion.<br />
For evaluating effects of a proposed future project, the Westside Basin Groundwater Model is<br />
considered useful in simulating the relative effect of possible conjunctive use or groundwater<br />
supply projects in the Westside Basin. As mentioned by HydroFocus (2007), planning analyses<br />
based on projected future conditions, such as the future modeling scenarios, are typically based<br />
on the relative differences between two projected conditions. The advantage of analyzing<br />
relative differences is that it minimizes the effects of model uncertainty. It is therefore preferable<br />
to employ the Westside Basin Groundwater Model to analyze relative changes (for example,<br />
compare the differences between simulated “no project” and “with project” scenarios) rather<br />
than using the model to predict absolute groundwater elevations, localized aquifer storage<br />
changes, or Lake Merced water levels.<br />
4.3.3. Model Limitations<br />
Overall, version 3.1 of the model is considered an appropriate quantitative tool for evaluating<br />
groundwater conditions in the Westside Basin. However, there are some specific areas of the<br />
weakness and/or limitations in the model and model calibration that are summarized below<br />
based on previous studies and modeling analysis by HydroFocus (2007, 2009, and 2011), and<br />
subsequently identified during this analysis.<br />
Despite improvements in the historical calibration in version 3.1 (HydroFocus, 2011), the model<br />
subareas with the highest RMSE are the Colma and <strong>San</strong> Bruno subareas. This is attributed to<br />
historical water level measurement limitations, model scaling, and uncertainty in vertical<br />
hydraulic conductivity and vertical hydraulic gradients. Therefore, the model results should be<br />
evaluated with care to account for the higher potential uncertainty of model results in the <strong>San</strong><br />
Bruno and Colma areas.<br />
During the Historical Simulation calibration, the simulation of lake levels in Lake Merced<br />
improved slightly from version 2.1 to 3.1. The model generally reproduces the lake levels and<br />
trends during the period from 1972 to 1995. During the first 14 years (1958 to 1972) and the last<br />
13 years of the simulation (1996 to 2009), simulated lake levels were consistently 2 to 3 feet<br />
D.5-23<br />
g:\isg-group\admin\job\08\0864001_sfpuc_eir support\09-reports\tech memos\tms\tm_10.1\tm 10-1_final.doc<br />
© Kennedy/Jenks Consultants, Inc.
Kennedy/Jenks Consultants<br />
Task 10.1 Technical Memorandum<br />
Greg Bartow and Jeff Gilman, SFPUC<br />
18 April 2012<br />
Page 20<br />
higher than measured data, but with some differences as high as 7 feet. The model is<br />
considered useful in simulating the relative effect of possible regional groundwater supply<br />
projects on Lake Merced levels; however, the simulation of lake level management scenarios<br />
with the objective of projecting absolute lake levels is not recommended.<br />
The MODFLOW lake package does not include a mechanism to simulate the control of a lake<br />
level via a spillway. Although not a large issue for the historical simulations, some of the future<br />
case scenarios have the potential for lake levels to increase to the level of the spillway. Without<br />
a spillway mechanism, MODFLOW will allow the lake levels to rise to levels that are not<br />
physically possible. This also could have an impact on shallow groundwater levels due to<br />
groundwater-surface water interactions with the lake. Scenarios where the lake level rises<br />
above the level of the spillway require an iterative process whereby the lake package inputs are<br />
adjusted until the lake levels remain below the level of the spillway. Because of these<br />
limitations, the Lake-Level Model discussed in Section 8 was used for evaluating the effects of<br />
the GSR and SFGW Projects, and other reasonably foreseeable future projects.<br />
In reviewing the model structure in the Golden Gate Park area, it was found that the aquifer<br />
thickness in the model was substantially thinner than was found in the Golden Gate Park<br />
Central Pump Station test well. Based on this test well, it appears that the model does not<br />
account for data from deep exploratory borings drilled in January 2010 and presented in a<br />
geologic cross-section J-J’ in Task 8B Technical Memorandum No. 1: Hydrologic Setting of the<br />
Westside Basin (LSCE, 2010). The model uses only Model Layer 1 in the central and eastern<br />
parts of Golden Gate Park, whereas pumping tests of production wells show confined aquifer<br />
behavior. In addition, compilation of pumping test results shows that the horizontal hydraulic<br />
conductivity (K h ) values used by the Westside Basin Groundwater Model in the North Westside<br />
Basin are lower than those obtained from measured data. It is recommended that future<br />
revisions to the model should include updating the model layer inputs in the Golden Gate Park<br />
area to be consistent with the existing hydrogeologic data. This is an important area for<br />
evaluating the SFGW Project; therefore, model results for Golden Gate Park will need to be<br />
evaluated with care because the model may overestimate the simulated drawdowns from the<br />
future proposed wells in this area.<br />
In version 3.1, the MODFLOW drain package was used to reduce the degree to which simulated<br />
groundwater levels were above the topographic surface representing potential flooding<br />
situations. Flooded cells periodically occurred where the aquifer is thin or in areas characterized<br />
by a shallow water table, and these can often be ignored because the model resolution is not<br />
fine enough to capture the topographic pattern of the surface.<br />
Other weaknesses that have been subsequently identified during this investigation relate to the<br />
boundary conditions where the model interacts with the Pacific Ocean and <strong>San</strong> <strong>Francisco</strong> Bay.<br />
These boundary conditions were set to a constant head of zero elevation in the existing<br />
Westside Basin Groundwater Model. This characterization does not handle the density<br />
difference between seawater and freshwater, or the wedged shape of possible seawater<br />
intrusion (see Task 10.3 TM). In addition, the constant head boundary condition is located on<br />
the landward side of the coast, rather than the seaward side; this prescription is overly rigid,<br />
D.5-24<br />
g:\isg-group\admin\job\08\0864001_sfpuc_eir support\09-reports\tech memos\tms\tm_10.1\tm 10-1_final.doc<br />
© Kennedy/Jenks Consultants, Inc.
Kennedy/Jenks Consultants<br />
Task 10.1 Technical Memorandum<br />
Greg Bartow and Jeff Gilman, SFPUC<br />
18 April 2012<br />
Page 21<br />
preventing the near-ocean water levels from behaving dynamically. HydroFocus (2007) states<br />
that “model results should be interpreted with caution near constant head boundaries like the<br />
Pacific Ocean or <strong>San</strong> <strong>Francisco</strong> Bay.”<br />
As mentioned above, for evaluating effects of a future project compared to the conditions<br />
without the project, the model could help assess the relative differences between two projected<br />
conditions. However, it should be noted that because model scenario runs are a projection of<br />
assumed future hydrologic conditions relative to assumed no project conditions, it is always<br />
understood that the simulated relative changes in groundwater levels and aquifer storage may<br />
not equal the actual changes determined from future observed hydrologic conditions<br />
(HydroFocus, 2007).<br />
D.5-25<br />
g:\isg-group\admin\job\08\0864001_sfpuc_eir support\09-reports\tech memos\tms\tm_10.1\tm 10-1_final.doc<br />
© Kennedy/Jenks Consultants, Inc.
Kennedy/Jenks Consultants<br />
Task 10.1 Technical Memorandum<br />
Greg Bartow and Jeff Gilman, SFPUC<br />
18 April 2012<br />
Page 22<br />
5. Model Scenario Descriptions<br />
A calibrated numerical model, such as the Westside Basin Groundwater Model, is considered<br />
capable of reasonable quality simulations. The numerical model can serve as a useful<br />
quantitative tool for future planning, management, and evaluation of technical issues related to<br />
groundwater resources.<br />
Five model scenarios were set up and simulated under Task 10.1. Table 10.1-1 provides a<br />
summary of the model scenario descriptions. The main model assumptions in each scenario are<br />
described in the following subsections, and further details on the model setup and assumptions<br />
are provided in Section 6 below. The amount of groundwater pumping is the major model input<br />
that varies among the simulated MODFLOW model scenarios. Table 10.1-2 presents a<br />
summary of pumping assumptions used in each of the five model scenarios. The Lake-Level<br />
Model is the primary tool used to evaluate the effects of each of the five scenarios listed in<br />
Table 10.1-1. Section 8 provides a detailed description of Lake-Level Model development and<br />
assumptions and model results in evaluating the effects of the GSR and SFGW Projects and<br />
other reasonably foreseeable projects.<br />
5.1. Scenario 1 – Existing Conditions<br />
Scenario 1 was set up and simulated to represent the Existing Conditions and does not include<br />
the SFPUC Projects (both GSR and SFGW Projects). Scenario 1 is based on a new hydrologic<br />
sequence proposed by SFPUC over a 47.25-year simulation period and initial conditions<br />
representative of June 2009. Total pumping assumptions made under Scenario 1 are<br />
summarized in Table 10.1-2.<br />
A detailed description of the model assumptions and modifications for Scenario 1 is provided in<br />
Section 6. The 2008 No-Project Scenario developed by HydroFocus (2011) was used as the<br />
starting point for the development of Scenario 1. However, there are some important differences<br />
between Scenario 1 and the HydroFocus 2008 No-Project Scenario. These differences are<br />
listed below:<br />
• In order to allow all five model scenarios to be directly comparable, Scenario 1 uses a<br />
new hydrologic sequence. The HydroFocus 2008 No-Project Scenario used an exact<br />
repeat of the historical hydrology from October 1958 to December 2005. As described<br />
further in Section 6.3, the new hydrologic sequence has a period of 47.25 years. It was<br />
established by rearranging the historical monthly sequence of hydrologic conditions<br />
available from the HydroFocus modeling analysis (2011) and includes the 8.5-year<br />
Design Drought period for the GSR Project, consistent with the PEIR (SFPUC, 2007;<br />
SFPUC, 2009a).<br />
• Initial conditions for groundwater levels and Lake Merced represent June 2009<br />
conditions for Scenario 1, compared to September 2002 used in the 2008 No-Project<br />
Scenario. As described further in Section 6.4, the initial conditions are based on the<br />
June 2009 water levels from the updated calibrated Historical Simulation by HydroFocus<br />
D.5-26<br />
g:\isg-group\admin\job\08\0864001_sfpuc_eir support\09-reports\tech memos\tms\tm_10.1\tm 10-1_final.doc<br />
© Kennedy/Jenks Consultants, Inc.
Kennedy/Jenks Consultants<br />
Task 10.1 Technical Memorandum<br />
Greg Bartow and Jeff Gilman, SFPUC<br />
18 April 2012<br />
Page 23<br />
(2011). June 2009 groundwater levels as initial conditions represent the accrued SFPUC<br />
Storage Account of approximately 20,000 af at the start of the model scenarios.<br />
• Pumping assumptions for the PA production wells were modified to incorporate the<br />
pumping assumptions representative of the Existing Conditions. Pumping by the PAs for<br />
the Existing Conditions is 6.84 mgd, compared to 6.9 mgd assumed in the 2008<br />
No-Project Scenario. PA pumping under the Existing Conditions was derived from the<br />
median values of individual agency pumping over the historical period from 1959 to<br />
2009. Under the Existing Conditions, the pumping distribution among each of the PA<br />
wells and the vertical distribution of pumping by model layers are essentially the same<br />
as in the HydroFocus 2008 No-Project Scenario (2011).<br />
• In order to be consistent with the new hydrologic sequence, the SMB pre-processing<br />
model for estimating groundwater recharge and irrigation was revised. The SMB model<br />
uses precipitation, temperature, evapotranspiration and municipal water supply as<br />
inputs. As explained further in Section 6.5, the simulated monthly recharge resulting<br />
from municipal water use in municipal areas was revised based on the results of the<br />
revised SMB. Scenario 1 uses the same future municipal water use as projected in the<br />
2008 No-Project Scenario, but that municipal water use was rearranged in order to<br />
reflect the new hydrologic sequence.<br />
• Monthly irrigation pumping estimates were modified for the Existing Conditions as a<br />
result of the revised SMB to be consistent with the new hydrologic sequence. Monthly<br />
irrigation pumping in Scenario 1 is based on the results of the revised SMB. Further<br />
modification to the irrigation pumping simulated by the revised SMB was then made to<br />
account for actual pumping data for the following irrigation wells: Golden Gate Park<br />
irrigation wells (Elk Glen, North Lake, and South Windmill Replacement wells), California<br />
Golf Club No.2, Zoo No.5, Edgewood Development Center well, and Stern Grove well<br />
(Section 6.6).<br />
• As a result of the revised SMB for the Existing Conditions, the Lake Merced lake<br />
package was modified consistent with the new hydrologic sequence, as explained<br />
further in Section 6.9. The modified lake package for Scenario 1 assumes no lake<br />
additions but accounts for water withdrawals from the lake when the lake levels are in<br />
excess of the lake spillway. In comparison, the HydroFocus 2008 No-Project Scenario<br />
assumes no Vista Grande stormwater diversions into Lake Merced and no other water<br />
additions to the lake.<br />
5.2. Scenario 2 – GSR Project<br />
Scenario 2 simulates the future operation of the GSR Project. The model was set up and<br />
simulated based on the new hydrologic sequence (Section 6.3) and identical assumptions for<br />
irrigation pumping as in Scenario 1, as presented in Table 10.1-2. The total PA pumping was<br />
assumed to be 6.9 mgd. This PA pumping rate is assumed to result in no appreciable storage<br />
change in the South Westside Basin (HydroFocus, 2011). For consistency with the PEIR,<br />
D.5-27<br />
g:\isg-group\admin\job\08\0864001_sfpuc_eir support\09-reports\tech memos\tms\tm_10.1\tm 10-1_final.doc<br />
© Kennedy/Jenks Consultants, Inc.
Kennedy/Jenks Consultants<br />
Task 10.1 Technical Memorandum<br />
Greg Bartow and Jeff Gilman, SFPUC<br />
18 April 2012<br />
Page 24<br />
Scenario 2 was simulated based on the hydrologic sequence that also includes the GSR<br />
Project’s Design Drought hydrology, as described below (SFPUC, 2007; SFPUC, 2009a).<br />
Descriptions of the hydrologic sequence and Design Drought hydrology are pertinent to all<br />
scenarios and are presented below in Section 6.3. Table 10.1-2 summarizes pumping<br />
assumptions made for the proposed GSR Project wells and the PA wells under Scenario 2.<br />
Irrigation pumping assumptions under Scenario 2 remain the same as in Scenario 1 (Existing<br />
Conditions), as further discussed in Section 6. The proposed GSR Project municipal well<br />
locations are shown in Figure 10.1-4. Table 10.1-3 provides a summary of pumping capacities<br />
for the proposed GSR Project municipal wells. GSR Project wells would pump at 7.23 mgd<br />
during take periods and at 0.04 mgd during put and hold years to exercise the wells.<br />
5.2.1. Partner Agency Wells<br />
Locations of the PA municipal wells are shown in Figure 10.1-4. Table 10.1-4 lists the PA<br />
municipal wells that are assumed to be pumping under the modeling scenarios and analysis.<br />
As presented in the pumping summary in Table 10.1-2, total pumping by the PAs under<br />
Scenario 2 was assumed to be 6.9 mgd during take and hold years, based on the designated<br />
pumping amounts provided by the PAs to SFPUC as part of the GSR Project. The PA wells are<br />
planned to pump up to 20 percent of the take period volume during put periods to allow for well<br />
exercising and to avoid encrustation (MWH, 2008). As a result, the PA pumping during put<br />
periods would be reduced to 1.38 mgd, resulting in approximately 5.52 mgd of in-lieu stored<br />
water in the basin during a put year. Pumping by the PAs is consistent with the 2008 No-Project<br />
Scenario by HydroFocus (2011).<br />
5.2.2. In-Lieu Recharge Demonstration Study<br />
A brief overview of the In-Lieu Recharge Demonstration Study conducted by the SFPUC in<br />
coordination with the PAs from October 2002 to March 2005 is provided herein as this study is<br />
pertinent to the GSR Project, the accrued SFPUC Storage Account, and the initial conditions of<br />
June 2009 used for the model scenarios. The In-Lieu Recharge Demonstration Study involved<br />
delivery of supplemental surface water from SFPUC to reduce the PAs groundwater pumping.<br />
The reduced pumping effectively increased the volume of groundwater in storage (LSCE, 2005).<br />
The purpose of the study was to evaluate the response of the Basin to the resultant in-lieu<br />
natural recharge resulting from reduced pumping. After the completion of the In-Lieu Recharge<br />
Demonstration Study, the SFPUC continued to deliver supplemental surface water to Cal Water<br />
through January 2007 and to Daly City through April 2007. The accrued volume in the SFPUC<br />
Storage Account at the start of the model scenarios in June 2009 is approximately 20,000 af<br />
based on records of in-lieu exchange with the PAs prior to July 2009. Table 10.1-5 presents the<br />
amount and timing of supplemental surface water deliveries to the PAs from October 2002 to<br />
April 2007, as provided by the SFPUC (personal comm., Greg Bartow, 2010). No supplemental<br />
deliveries were conducted from May 2007 to May 2009.<br />
D.5-28<br />
g:\isg-group\admin\job\08\0864001_sfpuc_eir support\09-reports\tech memos\tms\tm_10.1\tm 10-1_final.doc<br />
© Kennedy/Jenks Consultants, Inc.
Kennedy/Jenks Consultants<br />
Task 10.1 Technical Memorandum<br />
Greg Bartow and Jeff Gilman, SFPUC<br />
18 April 2012<br />
Page 25<br />
5.3. Scenarios 3a and 3b – SFGW Project<br />
Scenarios 3a and 3b represent the SFGW Project scenarios and consist of the assumptions<br />
used for Scenario 1, with the added assumption of future operation of the SFGW Project. Two<br />
model scenarios were set up and simulated based on differing pumping assumptions for the<br />
proposed SFGW Project wells, as a result of the availability of recycled water to replace<br />
groundwater that is currently used for irrigation in Golden Gate Park.<br />
Approximate locations of the proposed SFGW Project wells are shown in Figure 10.1-4.<br />
Table 10.1-6 lists the well identifications and proposed well pumping capacities for the SFGW<br />
Project municipal wells. As summarized in Table 10.1-2, Scenario 3a would pump four of the six<br />
proposed wells at 3.0 mgd, while the other two SFGW Project wells would remain as irrigation<br />
wells and their irrigation pumping rates would be the same as in Scenario 1 (Existing<br />
Conditions). Under Scenario 3b, the six proposed project wells would pump at the 4.0 mgd<br />
pumping target. Irrigation pumping assumptions at the other irrigation wells under Scenarios 3a<br />
and 3b remain the same as in the Existing Conditions, as further discussed in Section 6.6.<br />
For the purpose of the SFGW Project modeling scenarios, the location of the Golden Gate Park<br />
Central Pump Station well for Scenarios 3a and 3b was slightly modified by relocating the well in<br />
the model to the adjacent model grid cell to the west, where the model layer becomes thicker<br />
and accommodates the assigned pumping by the well. As discussed earlier (Section 4.3.3), the<br />
aquifer thickness assigned by the model in the vicinity of this well was thinner than the data<br />
obtained from a test well and other nearby exploratory borings.<br />
5.4. Scenario 4 – Cumulative Scenario<br />
Scenario 4 is the Cumulative Scenario that includes the assumed operation of the GSR and<br />
SFGW Projects, projected pumping for the PAs and third party pumpers, and other reasonably<br />
foreseeable future projects. Reasonably foreseeable projects that are considered include (1) the<br />
Vista Grande Drainage Basin Improvements Project, and (2) the Holy Cross cemetery future<br />
build-out with its anticipated increase in irrigation pumping. The Cumulative Scenario assumes<br />
the same hydrologic sequence and initial conditions for groundwater levels and Lake Merced as<br />
Scenario 1. Total pumping assumptions for Scenario 4 are summarized in Table 10.1-2. As<br />
mentioned above, Scenario 4 assumes the operations of the GSR Project and SFGW Project;<br />
thus, it includes the combined pumping from both proposed projects. As presented in Table<br />
10.1-2, the total PA pumping rates for each PA under Scenario 4 are the same as those under<br />
Scenario 2. Pumping assumptions by the PAs and locations of pumping wells account for<br />
reasonably foreseeable plans for future proposed wells by Daly City, Cal Water and <strong>San</strong> Bruno.<br />
For the SFGW Project, the pumping assumptions under Scenario 4 are the same as pumping<br />
assumptions under Scenario 3b (Table 10.1-2). A detailed description of pumping assumptions<br />
is provided in Section 6.7 for the GSR Project wells and the PA municipal wells and in Section<br />
6.8 for the SFGW Project wells.<br />
D.5-29<br />
g:\isg-group\admin\job\08\0864001_sfpuc_eir support\09-reports\tech memos\tms\tm_10.1\tm 10-1_final.doc<br />
© Kennedy/Jenks Consultants, Inc.
Kennedy/Jenks Consultants<br />
Task 10.1 Technical Memorandum<br />
Greg Bartow and Jeff Gilman, SFPUC<br />
18 April 2012<br />
Page 26<br />
6. Westside Basin Groundwater Model Setup<br />
Because of the complexity of a natural system, assumptions are necessary to define the model<br />
domain, aquifer properties and boundary conditions required for the numerical model.<br />
Therefore, a model is a simplification of the natural system. The quality of a model is highly<br />
dependent upon the accuracy of the conceptual understanding of the hydrogeology and the<br />
quality and quantity of the data.<br />
This section presents a summary of the modeling assumptions that are common to all five<br />
model scenarios developed, modifications made to the model scenarios compared to the 2008<br />
No-Project Scenario that was previously developed by HydroFocus (2011), and detailed<br />
pumping assumptions used for the PA municipal wells, the proposed GSR and SFGW Project<br />
municipal wells.<br />
6.1. Common Modeling Assumptions<br />
Modeling assumptions used in the five model scenarios that remain the same as in the 2008<br />
No-Project Scenario are as follows:<br />
• The model domain and grid discretization, model layer structure, and stress period setup<br />
are the same as in the 2008 No-Project Scenario (HydroFocus, 2011).<br />
• All of the five model scenarios use the same boundary conditions (e.g., no-flow and<br />
constant-head boundary conditions) as in the 2008 No-Project Scenario (HydroFocus,<br />
2011).<br />
• The five modeling scenarios simulate the new hydrologic sequence that covers<br />
47.25 years of monthly hydrologic conditions (a total of 567 monthly stress periods) by<br />
rearranging the historical hydrologic conditions available in the HydroFocus 2008<br />
No-Project Scenario and Historical Simulation (2011).<br />
• Land use conditions assumed in all of the future model scenarios are the same as in the<br />
2008 No-Project Scenario, which simulates land use conditions as of May 2008.<br />
Therefore, land use zones and recharge zones used in all of the model scenario setups<br />
are the same as in the 2008 No-Project Scenario (HydroFocus, 2011).<br />
• All five model scenarios simulate the hydraulic connection between Lake Merced and<br />
the surrounding groundwater system based on the lake and aquifer properties that were<br />
used in the 2008 No-Project Scenario (HydroFocus, 2011). The lake geometry and key<br />
variables used in the lake package remain the same as previously reported by<br />
HydroFocus (2007) (see Table 3 in the HydroFocus 2007 Report).<br />
• All model scenarios assume ongoing pumping for the existing irrigation wells similar to<br />
the pumping assumptions in the 2008 No-Project Scenario. Modifications made to<br />
irrigation pumping assumptions are introduced in Section 6.2 and described further in<br />
Section 6.6.<br />
D.5-30<br />
g:\isg-group\admin\job\08\0864001_sfpuc_eir support\09-reports\tech memos\tms\tm_10.1\tm 10-1_final.doc<br />
© Kennedy/Jenks Consultants, Inc.
Kennedy/Jenks Consultants<br />
Task 10.1 Technical Memorandum<br />
Greg Bartow and Jeff Gilman, SFPUC<br />
18 April 2012<br />
Page 27<br />
6.2. Modifications to 2008 No-Project Scenario<br />
Modifications to the 2008 No-Project Scenario were made to construct the model scenarios. The<br />
major modifications are listed below and described in the following sections:<br />
• Hydrologic data based on the new hydrologic sequence (Section 6.3);<br />
• Initial conditions used for groundwater levels (Section 6.4);<br />
• Revised SMB analysis consistent with the hydrologic sequence and resulting<br />
modifications made to the recharge package (Section 6.5), the lake package<br />
(Section 6.9), and the irrigation pumping assumptions (Section 6.6);<br />
• Pumping assumptions to incorporate the GSR Project (Section 6.7) and SFGW Project<br />
(Section 6.8). The 2008 No-Project Scenario (HydroFocus, 2011) assumes water use<br />
conditions as of May 2008 while the modeling scenarios presented here simulate water<br />
use conditions as of June 2009 as a representation of the publication of the Notice of<br />
Preparation (NOP) for the GSR Project in June 2009 and the NOP for the SFGW Project<br />
in December 2009; and<br />
• Initial conditions for Lake Merced and modifications made for the lake spillways<br />
(Section 6.9).<br />
The modifications made for the hydrologic sequence, initial conditions, and the revised SMB<br />
analysis are common to all five scenarios. Monthly irrigation pumping demand for the model<br />
scenarios was revised based on the results of the revised SMB analysis, to be consistent with<br />
the hydrologic sequence. The methodology developed by HydroFocus in the 2008 No-Project<br />
Scenario (2011) was used to revise the SMB and estimate the monthly irrigation demand for<br />
each irrigation well. Minor modifications were made to selected irrigation wells to update the<br />
irrigation demand estimated by the revised SMB to account for the actual data for those wells,<br />
as described in Section 6.6 as part of the irrigation pumping assumptions.<br />
6.3. Hydrology<br />
The five model scenarios use the same 47.25-year hydrologic sequence so that model scenario<br />
results are all directly comparable. This sequence is based on historical hydrological conditions<br />
and includes the 8.5-year Design Drought period used in the PEIR (SFPUC, 2007; SFPUC,<br />
2009a). The 8.5-year Design Drought repeats the December 1975 to March 1978 drought<br />
period following the dry hydrologic conditions of July 1987 to November 1992. To incorporate<br />
the Design Drought, the historical hydrologic sequence was rearranged. The rearranged<br />
hydrologic sequence used for the five model scenarios presented in this analysis consists of the<br />
following:<br />
• July 1996 to September 2003<br />
• October 1958 to November 1992<br />
• December 1975 to June 1978<br />
• July 2003 to September 2006<br />
D.5-31<br />
g:\isg-group\admin\job\08\0864001_sfpuc_eir support\09-reports\tech memos\tms\tm_10.1\tm 10-1_final.doc<br />
© Kennedy/Jenks Consultants, Inc.
Kennedy/Jenks Consultants<br />
Task 10.1 Technical Memorandum<br />
Greg Bartow and Jeff Gilman, SFPUC<br />
18 April 2012<br />
Page 28<br />
The following is the rationale for developing the new hydrologic sequence and maintaining a<br />
consistency with the PEIR and the associated HH/LSM design drought run (SFPUC, 2007;<br />
SFPUC, 2009a).<br />
As part of the initial conditions, the SFPUC Storage Account has approximately 20,000 af in<br />
storage in 2009 based on the past pilot program and agreed upon water exchanges. In order to<br />
identify a starting point for the rearranged hydrologic sequence that is consistent with the prior<br />
PEIR analyses for the GSR Project, the HH/LSM results were analyzed to identify a time when<br />
the simulated SFPUC Storage Account value was approximately 20,000 af. This was done in<br />
order to identify a starting condition that is equivalent to the actual SFPUC Storage Account<br />
value in July 2009. The analysis identified that this SFPUC Storage Account value occurs in the<br />
HH/LSM simulation at the beginning of July 1996 following the prolonged dry years (or take<br />
periods) during the 1987 to 1992 drought.<br />
For the model scenarios involving the GSR Project (Scenarios 2 and 4), the Design Drought<br />
begins with the Full SFPUC Storage Account of 60,500 af in storage. This means that the<br />
SFPUC Storage Account must be “filled” from its 20,000 af initial condition to the “full”<br />
60,500 af condition during the early part of the model simulation. The simplest way to<br />
accomplish this objective is to start the GSR Project and the Cumulative Scenario in put periods<br />
in order to simulate the filling of the SFPUC Storage Account. Filling of the SFPUC Storage<br />
Account therefore occurs during the first “block” of the rearranged hydrologic sequence<br />
(i.e., July 1996 to September 2003). Following the filling of the SFPUC Storage Account, the<br />
rearranged hydrologic sequence continues with October 1958 to November 1992. For this<br />
period, the put/take/hold conditions for the GSR Project are also based upon the HH/LSM<br />
output, and the SFPUC Storage Account is full at the beginning of the Design Drought.<br />
The Design Drought is developed by repeating the period from December 1975 to March 1978<br />
and incorporating it into the rearranged hydrologic sequence following November 1992. The<br />
PEIR design drought analysis ended in March 1978; however, the rearranged hydrologic<br />
sequence continues the Design Drought through June 1978 to maintain a complete rainfall year.<br />
To accommodate the Design Drought, the period from December 1992 to July 1995 is not<br />
included in the sequence, which is consistent with the PEIR analysis. Since the SFPUC Storage<br />
Account is depleted in 7.5 years, it does not cover the complete hydrologic year in the eighth<br />
year of the drought. Therefore, the final six months of the eighth year of the Design Drought<br />
(January to June 1978) are defined as hold months.<br />
In the PEIR analysis, the Design Drought simulation ended at the end of the Design Drought.<br />
For these simulations, the Design Drought is followed by a period of put years. This period (from<br />
July 2003 to September 2006) is long enough to bring the SFPUC Storage Account back to<br />
20,000 af at the end of the model scenarios. The July 2003 to September 2006 period is used<br />
because it is considered appropriate to keep a multi-year block of rainfall years together.<br />
Analysis of observed reservoir storage data was required in order to confirm that the period from<br />
July 2003 to September 2006 could be considered a put period. This analysis was necessary<br />
because the available HH/LSM simulations do not include this time period.<br />
D.5-32<br />
g:\isg-group\admin\job\08\0864001_sfpuc_eir support\09-reports\tech memos\tms\tm_10.1\tm 10-1_final.doc<br />
© Kennedy/Jenks Consultants, Inc.
Kennedy/Jenks Consultants<br />
Task 10.1 Technical Memorandum<br />
Greg Bartow and Jeff Gilman, SFPUC<br />
18 April 2012<br />
Page 29<br />
Rearranging the historical hydrologic sequence in the manner described above is justifiable<br />
because weather patterns are generally random. There is no reason that a historical hydrology<br />
sequence would repeat exactly in the future. For the rearrangement of the historical hydrologic<br />
sequence, the modified sequence was kept as simple as possible by maintaining long<br />
continuous blocks of the historical hydrologic sequences. Except for the Design Drought,<br />
individual rainfall years were kept together. The rearranged sequences start in either July or<br />
October in order to be consistent with the California climate.<br />
The rearranged hydrologic sequence was evaluated with respect to the total rainfall at the Lake<br />
Merced precipitation station. This analysis examined the cumulative departure of total<br />
precipitation relative to the long-term average (Figure 10.1-5). The historic period of the original<br />
hydrologic sequence from October 1958 to December 2005 was near normal. The cumulative<br />
departure relative to the long-term average was less than 0.2 inch or 0.04 inch per year over the<br />
47.25-year interval. For the rearranged hydrologic sequence, the cumulative departure is a<br />
deficit of 19.4 inches or 0.4 inch per year over the 47.25-year interval. The deficit is due to<br />
repeating the December 1975 to June 1978 drought period as part of the Design Drought. This<br />
repeat period replaces the December 1992 to June 1995 period, which has higher rainfall. Since<br />
most groundwater recharge is related to precipitation, this provides for a conservative evaluation<br />
of groundwater conditions during this period.<br />
6.4. Initial Conditions<br />
Initial conditions are the groundwater elevations assigned for each active model cell in each<br />
model layer at the beginning of model simulations. For all five model scenarios, modelsimulated<br />
June 2009 groundwater levels from the HydroFocus Historical Simulation (2011) were<br />
used as the initial conditions. The MODFLOW model uses monthly time steps and the model is<br />
set to start in July 2009; therefore, June 2009 represents the month prior to model initiation. The<br />
calibrated model simulation of June 2009 represents the best characterization of groundwater<br />
elevations for the entire basin as is required for the model.<br />
All five scenarios use the same June 2009 initial conditions in order to allow a direct comparison<br />
of the model scenario results. The initial condition of June 2009 represents the SFPUC Storage<br />
Account of 20,000 af that was stored between 2002 and 2009 (personal comm., Greg Bartow,<br />
2010) during the In-Lieu Recharge Demonstration Study.<br />
6.5. Recharge<br />
For all five model scenarios, the recharge pre-processor SMB model was used to revise<br />
recharge consistent with the hydrologic sequence and revised results were entered into the<br />
model using the MODFLOW recharge package. This approach was based on the same preand<br />
post-processing approach developed by HydroFocus (2011). All five scenarios use the<br />
same revised recharge package.<br />
In the Westside Basin Groundwater Model, pre-processing programs (e.g., SMB) were used to<br />
simulate the spatial and temporal distribution of groundwater recharge. Hydrologic processes<br />
D.5-33<br />
g:\isg-group\admin\job\08\0864001_sfpuc_eir support\09-reports\tech memos\tms\tm_10.1\tm 10-1_final.doc<br />
© Kennedy/Jenks Consultants, Inc.
Kennedy/Jenks Consultants<br />
Task 10.1 Technical Memorandum<br />
Greg Bartow and Jeff Gilman, SFPUC<br />
18 April 2012<br />
Page 30<br />
simulated by the SMB model include municipal water deliveries, rainfall, runoff, infiltration, soil<br />
moisture storage, potential evapotranspiration, irrigation, pipe leaks, and deep percolation. The<br />
SMB model uses climate and water delivery data to calculate the temporal and spatial<br />
distribution of deep percolation. The final product generated by the SMB is a single model input<br />
data set representing monthly groundwater recharge time-series (recharge package) for input to<br />
the uppermost active model layer (Model Layer 1). In the Westside Basin Groundwater Model,<br />
recharge was distributed to recharge zones as delineated by HydroFocus. A detailed description<br />
of the pre-processing programs and the delineated recharge zones is previously reported by<br />
HydroFocus (2007, 2009, and 2011).<br />
In the 2008 No-Project Scenario by HydroFocus, simulated monthly groundwater recharge in<br />
irrigated areas was also generated using the SMB model. As described earlier, the land use<br />
conditions and recharge zones assumed in Scenario 1 and the project model scenarios are the<br />
same as in the 2008 No-Project Scenario. However, altered hydrology in the new hydrologic<br />
sequence (including the Design Drought) leads to changes in the rate of groundwater recharge<br />
in irrigated areas. To account for the change in the monthly groundwater recharge model inputs,<br />
the MODFLOW recharge package in the 2008 No-Project Scenario was modified. It should be<br />
noted that in the 2008 No-Project Scenario, simulated monthly recharge in municipal areas is<br />
determined from both municipal water use and the historical temperature and rainfall data, as<br />
described by HydroFocus (2011). Municipal water use consists of both surface water and<br />
groundwater pumping for municipal use. For all five model scenarios, total municipal water use<br />
was assumed to remain the same as in the 2008 No-Project Scenario. Therefore, in all five<br />
model scenarios, monthly groundwater recharge that would result from municipal water use is<br />
essentially the same as in the 2008 No-Project Scenario, but altered according to the new<br />
hydrologic sequence.<br />
6.6. Irrigation and Non-Potable Groundwater Pumping<br />
This section describes modeling assumptions for irrigation and other non-potable pumping used<br />
in the model scenarios. The PA pumping assumptions and the project specific assumptions are<br />
presented separately in subsequent sections.<br />
Irrigation and non-potable pumping assumptions were modified from the 2008 No-Project<br />
Scenario as a result of running the SMB model to be consistent with the new hydrologic<br />
sequence. A summary of the irrigation and non-potable pumping assumptions used in the model<br />
scenarios is presented in Table 10.1-2.<br />
In the HydroFocus 2008 No-Project Scenario (2011), irrigation pumping for wells without<br />
metered data records was based on the monthly demand estimated by the SMB model. As<br />
mentioned earlier, rainfall, temperature, and municipal water use are input data sets for the<br />
SMB. As a result of changes in the hydrologic data used in the model scenarios, the SMBestimated<br />
irrigation demand was updated to generate irrigation demand estimates that are<br />
consistent with the new hydrologic sequence. In the model scenarios, the SMB model was run<br />
with the input data sets that were rearranged according to the hydrologic sequence, following<br />
the same approach developed by HydroFocus (2011).<br />
D.5-34<br />
g:\isg-group\admin\job\08\0864001_sfpuc_eir support\09-reports\tech memos\tms\tm_10.1\tm 10-1_final.doc<br />
© Kennedy/Jenks Consultants, Inc.
Kennedy/Jenks Consultants<br />
Task 10.1 Technical Memorandum<br />
Greg Bartow and Jeff Gilman, SFPUC<br />
18 April 2012<br />
Page 31<br />
Minor modifications were made to the revised estimates of irrigation pumping resulting from the<br />
SMB model run to account for pumping data that are representative of actual pumping<br />
conditions, based on information provided by SFPUC. These modifications include the Golden<br />
Gate Park irrigation wells (Elk Glen, North Lake, and South Windmill Replacement), California<br />
Golf No.02, the Edgewood Development Center well, Zoo No.05, and the Stern Grove well, as<br />
described below:<br />
<br />
Golden Gate Park Irrigation Wells – The 2008 No-Project Scenario (HydroFocus,<br />
2011) estimates Golden Gate Park irrigation at approximately 1.12 mgd (or 1,252 afy),<br />
based on metered data provided by SFPUC. For the Existing Conditions, irrigation<br />
pumping in Golden Gate Park was adjusted upward to approximately 1,280 afy to match<br />
2008 meter data, which is the most recent and complete metered record that is<br />
representative of actual pumping. Pumping in each of the three individual wells was<br />
increased with the following pumping distribution among the wells to maintain the same<br />
proportion of total pumping as in the pumping distribution used in the 2008 No-Project<br />
Scenario.<br />
o<br />
o<br />
o<br />
Elk Glen – increased pumping from 0.011 to 0.081 mgd (from 12 to 91 afy).<br />
North Lake – increased pumping from 0.302 to 0.563 mgd (338 to 631 afy).<br />
South Windmill Replacement – decreased pumping from 0.805 to 0.498 mgd<br />
(902 to 558 afy).<br />
• California Golf Club No.02 – decreased pumping from 0.212 mgd to 0.192 mgd (from<br />
237 to 215 afy), based on rates provided verbally by the California Golf Club (personal<br />
comm., Rick Kavakoff, 2009).<br />
• Zoo No.5 – decreased pumping from 0.404 to 0.321 mgd (from 452 to 360 afy), as<br />
provided by the SFPUC based on the average of 2005, 2006, 2007, and 2008 data<br />
(SFPUC, 2009c).<br />
• Edgewood Development Center – increased pumping from 0.007 to 0.009 mgd (from 8<br />
to 10 afy) (personal comm., Jeff Gilman, 2009).<br />
• Stern Grove Well – reduced pumping from 0.042 to 0.0043 mgd (from 47 to 4.8 afy) to<br />
account for the new information available about the use of the well as a supplemental<br />
water source for Pine Lake (written comm., Jeff Gilman, 2010). The well is assumed to<br />
be pumped approximately four days per year, as needed, to maintain the water level in<br />
Pine Lake at 31.5 feet (City Datum).<br />
6.6.1. SFGW Project Scenarios<br />
Irrigation and non-potable pumping assumptions for Scenario 1 and Scenarios 3a and 3b are<br />
essentially the same, except changes described below.<br />
<br />
For Scenario 3a, the Stern Grove well irrigation pumping is increased from 0.0043 mgd<br />
to 0.012 mgd (from 4.8 to 13.6 afy) for Scenario 3a, which represents 0.008 mgd (8.8 af)<br />
D.5-35<br />
g:\isg-group\admin\job\08\0864001_sfpuc_eir support\09-reports\tech memos\tms\tm_10.1\tm 10-1_final.doc<br />
© Kennedy/Jenks Consultants, Inc.
Kennedy/Jenks Consultants<br />
Task 10.1 Technical Memorandum<br />
Greg Bartow and Jeff Gilman, SFPUC<br />
18 April 2012<br />
Page 32<br />
<br />
more pumping than Scenario 1. Based on the monthly pumping assumptions provided<br />
by SFPUC, the Stern Grove well would pump seven months (January, May, June, July,<br />
August, September, and October) with pumping rates ranging from 1.1 af per month to<br />
2.3 af per month.<br />
For Scenario 3b, the Stern Grove well irrigation pumping is increased from 0.0043 mgd<br />
to 0.013 mgd (from 4.8 to 14.8 afy) for Scenario 3b, which represents 0.009 mgd (10 af)<br />
more pumping than Scenario 1. Based on the monthly pumping assumptions provided<br />
by SFPUC, the Stern Grove well would pump seven months (January, May, June, July,<br />
August, September, and October) with pumping rates ranging from 1.2 af per month to<br />
2.5 af per month.<br />
The Stern Grove well pumping volumes under Scenarios 3a and 3b are based on the<br />
supplemental water needed to maintain the water level in Pine Lake at 31.5 feet (City Datum),<br />
based on information provided by SFPUC. Pumping of the Stern Grove well is proportional to<br />
the total pumping of the SFGW Project, in which the total pumping in Scenario 3a is less than<br />
the total pumping in Scenario 3b.<br />
6.6.2. Cumulative Scenario<br />
Irrigation and non-potable pumping assumptions for Scenario 3b and Scenario 4 are essentially<br />
the same, except changes described below.<br />
<br />
Based on the results of the revised SMB, the long-term average irrigation demand by<br />
Holy Cross cemetery was estimated at 0.19 mgd (212 afy) for Scenario 1 and the GSR<br />
and SFGW Project scenarios (Scenarios 2, 3a, and 3b). The Cumulative Scenario<br />
required further adjustments to take into account the planned future build-out in the Holy<br />
Cross cemetery. Based on the potential future build-out at the Holy Cross cemetery,<br />
additional pumping of 0.04 mgd (or 45 afy) was estimated for the Cumulative Scenario.<br />
The Holy Cross cemetery build-out was projected to be at a rate of about 1.5 acre per<br />
year from 2010 to 2030 (total of 30 acres over 20 years) (personal comm., Roger<br />
Appleby, 2010). With a conservative irrigation rate of 1.5 af per acre, the additional<br />
estimated future irrigation pumping rate was estimated to be 45 afy (or 0.04 mgd).<br />
6.7. GSR Project<br />
The GSR Project is sponsored by the SFPUC in collaboration with the three PAs (Cal Water,<br />
Daly City, and <strong>San</strong> Bruno), who operate their own municipal supply wells and purchase<br />
wholesale water from SFPUC’s Regional (surface) Water System. The overall objective of the<br />
GSR Project is to develop a new dry-year groundwater supply that can be utilized at a rate of<br />
7.2 mgd (or 8,100 afy) above the existing municipal groundwater pumping over a 7.5-year<br />
drought period. Water would be stored in the aquifer through in-lieu recharge equal to the<br />
D.5-36<br />
g:\isg-group\admin\job\08\0864001_sfpuc_eir support\09-reports\tech memos\tms\tm_10.1\tm 10-1_final.doc<br />
© Kennedy/Jenks Consultants, Inc.
Kennedy/Jenks Consultants<br />
Task 10.1 Technical Memorandum<br />
Greg Bartow and Jeff Gilman, SFPUC<br />
18 April 2012<br />
Page 33<br />
reduction in pumping by the PAs made possible by supplemental SFPUC surface water<br />
supplies delivered in wet and normal years.<br />
6.7.1. GSR Project Pumping<br />
Figure 10.1-4 shows the locations of the proposed GSR Project municipal wells that were<br />
incorporated into the model scenarios involving the GSR Project. Table 10.1-7 shows the total<br />
pumping volumes assumed for the proposed GSR Project municipal wells during the<br />
put/take/hold sequence. The general assumption is that pumping in each GSR Project well<br />
would be reduced in duration to 4 hours per month for well exercising during put and hold<br />
periods. For the purpose of these modeling scenarios, month-to-month pumping was assumed<br />
to be constant, with no seasonal pumping variations.<br />
Table 10.1-8 shows the assumed pumping distribution by model layers for each of the GSR<br />
Project wells. The general assumptions made to allocate the pumping vertically take into<br />
account the proposed well screen intervals in conjunction with the hydraulic conductivity<br />
differences in Model Layers 4 and 5. Where the W-clay is present, it was assumed that the<br />
screen footage in Model Layers 1 through 4 was given the double weighting above the W-clay<br />
that it is below the W-clay in Model Layer 5, except at TW-CUP-10A, where the proposed<br />
screen is only planned for the zone above the W-clay. For areas without the W-clay, e-logs were<br />
reviewed to determine how to allocate pumping (either equal weighting for all screens or double<br />
the weighting from the upper screen). The pumping allocation was based on the fact that the<br />
calibrated horizontal hydraulic conductivity (K h ) values are generally 8 feet/day in Model Layers<br />
3 and 4 compared to 4 feet/day in Model Layer 5 (HydroFocus, 2011). Moreover, based on the<br />
conceptual understanding of the subsurface geology, review of the available well logs, analysis<br />
of footage of screen in various layers times weighting factors, it appears that the majority of<br />
pumping in practice is derived from depths corresponding to Model Layer 4.<br />
6.7.2. Partner Agency Pumping<br />
Figure 10.1-4 shows the locations of the PA municipal puping wells that were incorporated into<br />
the five model scenarios. The locations of the proposed wells were based on the information<br />
provided by Cal Water and Daly City to SFPUC.<br />
The total pumping by the PAs for Scenario 2 is 6.9 mgd, compared to 6.84 mgd under<br />
Scenario 1 (Table 10.1-2). As shown in Table 10.1-1 and 10.1-2, the total PA pumping<br />
assumptions used for the GSR Project under Scenarios 2 and 4 are essentially the same, but<br />
the locations of the PA municipal pumping wells used for each scenario vary slightly, as shown<br />
in Table 10.1-7 and discussed below.<br />
• <strong>San</strong> Bruno - Under Scenarios 2 and 4, <strong>San</strong> Bruno would continue to pump its existing<br />
five wells (SB-No.15, SB-No.16, SB-No.17, SB-No.18, and SB-No.20). As of early 2012,<br />
<strong>San</strong> Bruno was evaluating the potential to replace SB-No.15 and had identified several<br />
potential replacement sites. Since the GSR Project EIR modeling can only assume one<br />
location for the replacement of SB-No.15, it was agreed that the current location of<br />
SB-No.15 was reasonable to use because the current SB-No.15 location is the closest<br />
D.5-37<br />
g:\isg-group\admin\job\08\0864001_sfpuc_eir support\09-reports\tech memos\tms\tm_10.1\tm 10-1_final.doc<br />
© Kennedy/Jenks Consultants, Inc.
Kennedy/Jenks Consultants<br />
Task 10.1 Technical Memorandum<br />
Greg Bartow and Jeff Gilman, SFPUC<br />
18 April 2012<br />
Page 34<br />
location to the proposed GSR Project wells and thus provides a conservative analysis by<br />
concentrating pumping in that area (i.e., the GSR Project proposed well at Golden Gate<br />
National Cemetery is about a quarter mile north of SB-No.15).<br />
Another alternate location was about one mile northwest of the proposed GSR Project<br />
well at the SFPUC Millbrae Facility (CUP-M-1). However, CUP-M-1 is expected to have<br />
the lowest pumping rate (about 160 gpm as shown in Table 10.1-3) of all of the GSR<br />
Project wells because the saturated thickness at this location is less than areas where<br />
the proposed GSR Project wells to the north are located. Thus, it would not be<br />
conservative to use this as the replacement location for SB-No.15 for this analysis.<br />
• Daly City – Under Scenario 2, Daly City plans to pump the five existing wells (Jefferson,<br />
Vale, Daly City No.4, Westlake, and Junipero Serra), but Scenario 4 accounts for Daly<br />
City’s future plans to use two proposed wells (Daly City A Street Replacement well and<br />
Daly City No.4 Replacement well). Under Scenario 4, Daly City total pumping would be<br />
the same as Scenario 2, but using four existing wells (Jefferson, Vale, Westlake, and<br />
Junipero Serra) and the two proposed wells.<br />
• Cal Water – Under Scenario 2, Cal Water proposes to pump five wells, including three<br />
of the existing wells (SSF1-19, SSF1-20, and SSF1-21) and two proposed wells<br />
(SSF1-22 and SSF1-23), based on the information provided by Cal Water to SFPUC.<br />
Under Scenario 2, three existing wells (SSF1-14, SSF1-17, and SSF1-18) were<br />
assumed to be out of production. Based on the documents provided by Cal Water,<br />
SSF1-14 and SSF1-17 were reported inactive, and SSF1-18 was reported to be<br />
replaced with the proposed well SSF1-23. The existing well SSF1-15 was assigned<br />
“zero” pumping based on the information from Cal Water that indicates the well will be<br />
destroyed due to age and contaminants. Under Scenario 4, Cal Water was assumed to<br />
be pumping the two existing wells (SSF1-20 and SSF1-21) and two proposed wells<br />
(SSF1-22 and SSF1-23). Based on the information provided by Cal Water, proposed<br />
wells SSF1-24 and SSF1-25 are considered redundant and no pumping was assigned to<br />
these wells for the purpose of the Cumulative Scenario.<br />
Table 10.1-7 shows the total pumping at each PA municipal well during the put/take/hold<br />
sequence. Pumping during put periods was assumed to be 20 percent of the take period<br />
pumping in each well. For <strong>San</strong> Bruno wells, the pumping distribution among the individual wells<br />
and the monthly pumping distribution for each well are the same for Scenarios 1, 2 and 4, and<br />
they are assumed to be proportional to those in the 2008 No-Project Scenario (HydroFocus,<br />
2011). Under Scenario 2, Daly City pumping distribution among the wells is the same as<br />
Scenario 1 and follows the same distribution as in the 2008 No-Project Scenario (HydroFocus,<br />
2011). Under Scenario 4, total pumping by Daly City was distributed among the six wells evenly.<br />
Under Scenario 2, pumping among the individual Cal Water wells was determined based on the<br />
pumping rates provided by Cal Water and inputs from SFPUC. For Scenario 4, pumping among<br />
the individual Cal Water municipal wells was determined based on pumping rates provided by<br />
Cal Water for each well.<br />
D.5-38<br />
g:\isg-group\admin\job\08\0864001_sfpuc_eir support\09-reports\tech memos\tms\tm_10.1\tm 10-1_final.doc<br />
© Kennedy/Jenks Consultants, Inc.
Kennedy/Jenks Consultants<br />
Task 10.1 Technical Memorandum<br />
Greg Bartow and Jeff Gilman, SFPUC<br />
18 April 2012<br />
Page 35<br />
Table 10.1-8 presents the pumping distribution by model layers for each PA municipal well. For<br />
the existing PA municipal wells, vertical pumping distribution by model layers is the same as in<br />
the 2008 No-Project Scenario. The four Cal Water proposed wells (SSF1-22, SSF1-23,<br />
SSF1-24, and SSF1-25) would be similar in nature to the existing wells SSF1-20 and SSF1-21<br />
and would be located in the vicinity of the existing wells, based on the information provided by<br />
Cal Water to SFPUC. In light of the estimated screen zones of 380 to 570 feet below ground<br />
surface (bgs) for the proposed wells, which are similar to existing wells SSF1-20 and SSF1-21,<br />
under Scenarios 2 and 4, the depth distribution of the Cal Water pumping by model layers for<br />
the proposed wells was assumed to be similar to that for the existing wells SSF1-20 and<br />
SSF1-21.<br />
6.7.3. Put/Take/Hold Sequence<br />
In the modeling scenarios involving the GSR Project (Scenarios 2 and 4), the hydrologic<br />
sequence follows the put/take/hold sequence to simulate in-lieu groundwater recharge during<br />
wet years and groundwater extraction during dry years. As described earlier, the HH/LSM,<br />
which was used extensively for long-term planning purposes in the SFPUC’s PEIR, outputs a<br />
put/take/hold sequence on a monthly basis and tracks the volume of water stored in the SFPUC<br />
Storage Account (SFPUC, 2007; SFPUC, 2009a). The following is the description of the<br />
put/take/hold sequence used in the hydrologic sequence for the model scenarios, compared to<br />
the original put/take/hold in the HH/LSM run:<br />
• The original HH/LSM put/take/hold sequence is based on the in-lieu recharge rate (or<br />
put rate) of 7.23 mgd. This put rate is equal to the rate of groundwater pumping during a<br />
take period in the HH/LSM simulation run. For the current modeling scenarios, on the<br />
other hand, the in-lieu recharge rate during a put year is 5.52 mgd and the rate of<br />
groundwater extracted during a take year is 7.23 mgd. The pumping rate of 5.52 mgd<br />
represents the 80 percent of total PA pumping of 6.9 mgd during a put period. As a<br />
result of the differences in the put rate, the hydro sequence has slightly longer put<br />
periods for the model scenarios compared to the original HH/LSM model outputs. The<br />
longer put periods are used in order to ensure the volume of put in the current modeling<br />
scenarios is not less than the volume of put in the HH/LSM outputs.<br />
• In the PEIR, the put/take/hold conditions are defined as annual periods that run from<br />
July to June. The put/take/hold sequence used for the GSR Project under Scenario 2<br />
and the Cumulative Scenario is consistent with this approach.<br />
• The put/take/hold sequence used in the current modeling scenarios includes the Design<br />
Drought period as used in the SFPUC’s PEIR.<br />
• The put/take/hold sequence in the current modeling scenarios includes a recovery<br />
period (put period) following the Design Drought that brings the SFPUC Storage Account<br />
back to the same value as the initial condition (20,000 af). This allows a direct<br />
comparison of groundwater conditions with respect to the SFPUC Storage Account at<br />
the beginning and the end of the GSR Project under Scenario 2 and the Cumulative<br />
Scenario.<br />
D.5-39<br />
g:\isg-group\admin\job\08\0864001_sfpuc_eir support\09-reports\tech memos\tms\tm_10.1\tm 10-1_final.doc<br />
© Kennedy/Jenks Consultants, Inc.
Kennedy/Jenks Consultants<br />
Task 10.1 Technical Memorandum<br />
Greg Bartow and Jeff Gilman, SFPUC<br />
18 April 2012<br />
Page 36<br />
• The put/take/hold sequence used in the current modeling scenarios starts with a put<br />
condition for the GSR Project and the Cumulative Scenario. This is done in order to<br />
simulate the filling of the SFPUC Storage Account to the “full” condition (60,500 af) prior<br />
to the Design Drought.<br />
The put/take/hold sequence used in the current modeling scenarios is presented in Table<br />
10.1-9. The Design Drought is represented by the 7.5-year period of take months from<br />
Simulation Year 36 through 44.<br />
6.8. SFGW Project<br />
The SFGW Project consists of the development of up to 4.0 mgd of local <strong>San</strong> <strong>Francisco</strong><br />
groundwater in the North Westside Basin as a regular and emergency drinking water supply.<br />
The WSIP primary level-of-service goal for the SFGW Project is to increase the long-term water<br />
supply available to the SFPUC.<br />
As shown in Table 10.1-2, the PA pumping assumptions used for the SFGW Project scenarios<br />
(Scenarios 3a and 3b) are the same as Scenario 1. These assumptions are covered in<br />
Section 5.1 and are not discussed further in this section.<br />
6.8.1. SFGW Project Pumping<br />
Figure 10.1-4 shows the locations of the six proposed SFGW Project municipal wells that were<br />
incorporated into the model scenarios involving the SFGW Project. Table 10.1-6 shows the<br />
normal design and average pumping capacity for the SFGW Project municipal wells. Table<br />
10.1-10 shows the percent pumping distribution for each well under Scenarios 3a and 3b.<br />
Pumping by each SFGW Project municipal well was estimated by distributing the total monthly<br />
pumping (combined pumping for the four wells for Scenario 3a and for the six wells for Scenario<br />
3b) among the wells proportional to each well’s normal design pumping capacity.<br />
The model layer-by-layer pumping distribution for the SFGW Project wells is presented in Table<br />
10.1-8. Pumping among the model layers was distributed proportional to the layer thicknesses<br />
and the screened intervals of the wells (i.e., construction details) as provided by the SFPUC. In<br />
locations where the screened interval spans the entire model layer, pumping was distributed<br />
proportional to the layer thickness. When the well screen falls within only a portion of the model<br />
layer, pumping was distributed proportional to the length of well screen within that layer. Table<br />
10.1-11 shows calculated monthly pumping by each SFGW Project well for Scenarios 3a and<br />
3b. Monthly pumping varies, but total pumping remains the same annually (i.e., 3.0 mgd for<br />
Scenario 3a and 4.0 mgd for Scenario 3b).<br />
Pumping assumptions for the three existing Golden Gate Park wells (Elk Glen, North Lake, and<br />
South Windmill Replacement wells) under Scenarios 3a and 3b are summarized in Tables<br />
10.1-2, 10.1-6, and 10.1-10. If recycled water were available for irrigation, the Elk Glen well<br />
would not pump (Table 10.1-2), while the North Lake and South Windmill Replacement wells<br />
would pump at 0.50 mgd and 0.65 mgd, respectively, for municipal supply (Table 10.1-10).<br />
Without recycled water for irrigation, all three existing wells would pump at a total combined rate<br />
D.5-40<br />
g:\isg-group\admin\job\08\0864001_sfpuc_eir support\09-reports\tech memos\tms\tm_10.1\tm 10-1_final.doc<br />
© Kennedy/Jenks Consultants, Inc.
Kennedy/Jenks Consultants<br />
Task 10.1 Technical Memorandum<br />
Greg Bartow and Jeff Gilman, SFPUC<br />
18 April 2012<br />
Page 37<br />
of approximately 1.14 mgd based on the monthly irrigation pumping assumptions used in the<br />
Existing Conditions (Table 10.1-2).<br />
6.9. Lake Merced<br />
Lake Merced is an important hydrological feature in the Westside Basin. It is simulated in the<br />
Westside Basin Groundwater Model using the MODFLOW Lake Package, generally following<br />
the conditions used for the 2008 No-Project Scenario. Details regarding the MODFLOW<br />
simulation of Lake Merced are discussed in Sections 6.9.1 through 6.9.3.<br />
Lake Merced water levels are also simulated using the Lake-Level Model, as discussed in<br />
Section 6.9.5. Lake Merced level management operations are considered as a reasonably<br />
foreseeable future project under Scenario 4 (Cumulative Scenario) and discussed in<br />
Section 6.9.4. The current understanding of the Lake Merced management operations is that it<br />
will raise and maintain Lake Merced water levels up to an elevation of 9.5 feet (City Datum)<br />
(18.12 feet NGVD 29) with supplemental water derived from stormwater diverted from Daly<br />
City’s Vista Grande Canal.<br />
6.9.1. Model Modifications to Lake Package<br />
For the model scenarios, monthly runoff entering Lake Merced from Harding Park Golf Course<br />
and nearby residential areas was estimated based on the results from the revised SMB model<br />
and revised results were imported into the model using the MODFLOW Lake Package (LAK3).<br />
In the 2008 No-Project Scenario, monthly runoff entering the lake is extracted from the SMB<br />
model. Following the same approach developed by HydroFocus (2011), the SMB model was<br />
revised to update the lake package consistent with the new hydrologic sequence. Similar to the<br />
2008 No-Project Scenario, all five model scenarios, except the Cumulative Scenario, assume no<br />
Vista Grande stormwater diversions into Lake Merced and no other water additions to the lake.<br />
The MODFLOW Lake Package was further modified for initial lake levels and lake spillway,<br />
compared with the 2008 No-Project Scenario, as described separately in the following<br />
subsections 6.9.2 and 6.9.3.<br />
6.9.2. Initial Lake Condition<br />
For all model scenarios, the initial Lake Merced water level was set to match the simulated June<br />
2009 lake level from the version 3.1 Historical Simulation (HydroFocus, 2011). Simulated rather<br />
than measured (observed) Lake Merced lake levels are used because this change improves the<br />
model performance by ensuring that the lake levels are in equilibrium with groundwater<br />
conditions in the model. If this approach were not used, then there may be undesirable effects in<br />
the water balance and nearby groundwater levels as the model works to achieve a new<br />
equilibrium with the different initial lake condition. The initial lake level at South Lake was set to<br />
17.95 feet (NGVD 29). The <strong>San</strong> <strong>Francisco</strong> City Datum (City Datum) is another reference datum<br />
commonly used for Lake Merced lake level measurements. Relative to the City Datum, the initial<br />
lake level at South Lake was set to 9.33 feet (City Datum).<br />
D.5-41<br />
g:\isg-group\admin\job\08\0864001_sfpuc_eir support\09-reports\tech memos\tms\tm_10.1\tm 10-1_final.doc<br />
© Kennedy/Jenks Consultants, Inc.
Kennedy/Jenks Consultants<br />
Task 10.1 Technical Memorandum<br />
Greg Bartow and Jeff Gilman, SFPUC<br />
18 April 2012<br />
Page 38<br />
6.9.3. Model Modifications for the Lake Spillway<br />
The MODFLOW Lake Package does not include a mechanism to simulate the control of a lake<br />
level with a spillway. Without a spillway mechanism, MODFLOW would allow the lake levels to<br />
rise to levels that are not physically possible, which could affect the simulated shallow<br />
groundwater levels (due to groundwater-surface water interactions with the lake) and the overall<br />
Westside Basin water balance. For all five model scenarios, there were instances where the<br />
MODFLOW-simulated Lake Merced lake level was above the level of the spillway. Therefore,<br />
scenarios were run iteratively by adjusting the Lake Package input file to remove excess water<br />
from the lake (as lake spills) until the lake levels remained below the level of the spillway. This<br />
approach is different than the 2008 No-Project Scenario, which assumed no spills from the lake.<br />
For Scenarios 1, 2, 3a and 3b, the existing Lake Merced water spillway elevation of 21.62 feet<br />
(NGVD 29, or 13.0 feet City Datum) was used. For Scenario 4, the projected modified spillway<br />
elevation of 18.12 feet (NGVD 29, or 9.5 feet City Datum) was used based on documentation for<br />
the Vista Grande Drainage Basin Alternatives Analysis project for Daly City (Brown and<br />
Caldwell, 2010, Jacobs Associates, 2011a, 2011b; City of Daly City, 2012).<br />
The MODFLOW Lake Package uses a water balance method to calculate inflows and outflows<br />
from the lake outside of the groundwater contribution (e.g., precipitation, stormwater runoff,<br />
evaporation, and direct water additions and withdrawals). These values are defined in the Lake<br />
Package by the user prior to the model input files. The inflows and outflows from the<br />
groundwater contribution are calculated by MODFLOW.<br />
To adjust for the spillway, the outflows that represent the lake spills (i.e., direct water<br />
withdrawals) in the Lake Package were increased iteratively until the MODFLOW-simulated lake<br />
levels stayed below the level of the spillway for consecutive months. A single month where the<br />
lake level was less than 0.1 foot above the spillway was allowed.<br />
6.9.4. Cumulative Scenario<br />
For the Cumulative Scenario (Scenario 4), the use of Lake Merced as part of the Vista Grande<br />
Drainage Basin Alternatives Analysis project for Daly City is considered to be a reasonably<br />
foreseeable future project. Daly City’s Vista Grande Drainage Basin Alternatives Analysis<br />
recommended the alternative, in which stormwater flow from the Vista Grande Canal would be<br />
diverted to Lake Merced (Jacobs Associates, 2011a, 2011b; City of Daly City, 2012).<br />
Daly City evaluated 24 potential scenarios for the Lake Merced Alternative for various flow<br />
configurations related to the presence or absence of a wetland and the level of the spillway<br />
(Brown and Caldwell, 2010). Given that the Lake Merced Alternative scenarios are still in the<br />
initial design stage, a scenario that provides an average flow to the lake is considered<br />
acceptable given that averages have been used for assumptions in other instances (e.g., the PA<br />
pumping assumptions). The 75 cfs Daly City scenario was selected for use in this modeling<br />
analysis. 75 cfs represents a cutoff volume, so that all flow down the Vista Grande Canal<br />
exceeding this cutoff volume would be diverted to Lake Merced (Brown and Caldwell, 2010).<br />
Stormwater discharges into Lake Merced occur when water flows in the Vista Grande Canal<br />
D.5-42<br />
g:\isg-group\admin\job\08\0864001_sfpuc_eir support\09-reports\tech memos\tms\tm_10.1\tm 10-1_final.doc<br />
© Kennedy/Jenks Consultants, Inc.
Kennedy/Jenks Consultants<br />
Task 10.1 Technical Memorandum<br />
Greg Bartow and Jeff Gilman, SFPUC<br />
18 April 2012<br />
Page 39<br />
exceed the cutoff volume and are diverted into the Lake Merced. These flows occur periodically<br />
in response to large storms, and were calculated as part of the Vista Grande Drainage Basin<br />
Alternatives Analysis (Brown and Caldwell, 2010) based on historical precipitation data.<br />
Stormwater flows were calculated to occur as diversions to Lake Merced in every year, and<br />
range from 19 to 681 afy with an average of 207 afy (Brown and Caldwell, 2010). These flows<br />
were added to the MODFLOW Lake Package as an input into Lake Merced as stormwater<br />
discharges.<br />
The Lake Merced Alternative scenarios also include provisions for an engineered wetland and<br />
modification of the Lake Merced spillway (Brown and Caldwell, 2010). In the 75 cfs scenario, the<br />
average baseflow in the Vista Grande Canal is assumed to be diverted into an engineered<br />
wetland for treatment and then discharged to Lake Merced on an ongoing basis. Baseflows<br />
have been estimated to range from 18 to 26 af per month (Kennedy/Jenks, 2009). These were<br />
also added to the MODFLOW Lake Package as an input into Lake Merced.<br />
Finally, the 75 cfs scenario contains a provision to lower the spillway out of Lake Merced by<br />
3.5 feet from an elevation of 21.62 to 18.12 feet (NGVD 29), or from 13.0 feet to 9.5 feet (City<br />
Datum). Spillway discharges at the lower spillway elevation were calculated using the<br />
methodology described in Section 6.9.3.<br />
6.9.5. Use of Lake Merced Results<br />
As mentioned in Section 4, the Westside Basin Groundwater Model has the ability to reproduce<br />
long-term trends in the Lake Merced lake levels as shown in the Historical Simulation by<br />
HydroFocus (2011), but there is uncertainty in estimating absolute lake levels. Comparisons<br />
between simulated and observed lake levels show differences that range from -2.0 to 7.0 feet.<br />
The model generally reproduces the trends and relative changes seen in the historical data for<br />
Lake Merced during the period from 1972 to 1995. During the first 14 years (1958 to 1972) and<br />
the last 13 years of the simulation (1996 to 2009), simulated lake levels were consistently 2 to<br />
3 feet higher than measured data and show periods of divergence between historical and<br />
measured trends. The MODFLOW model is considered useful in simulating the relative effect of<br />
possible regional groundwater supply projects on Lake Merced levels; however, the simulation<br />
of lake level management scenarios with the objective of projecting absolute lake levels is not<br />
recommended.<br />
Because of these issues with the MODFLOW representation of Lake Merced, the Lake-Level<br />
Model, discussed in Section 8, is also used to simulate the Lake Merced water levels for the five<br />
model scenarios.<br />
D.5-43<br />
g:\isg-group\admin\job\08\0864001_sfpuc_eir support\09-reports\tech memos\tms\tm_10.1\tm 10-1_final.doc<br />
© Kennedy/Jenks Consultants, Inc.
Kennedy/Jenks Consultants<br />
Task 10.1 Technical Memorandum<br />
Greg Bartow and Jeff Gilman, SFPUC<br />
18 April 2012<br />
Page 40<br />
7. MODFLOW Model Scenario Results<br />
The results of MODFLOW model simulations for all five scenarios are presented in this section.<br />
The evaluation of these results with respect to specific groundwater issues is discussed in the<br />
following TMs:<br />
• Task 10.2 for assessment of groundwater-surface water interactions<br />
• Task 10.3 for assessment of seawater intrusion<br />
• Task 10.4 for changes in groundwater levels and storage<br />
• Task 10.5 for assessment of pumping induced land subsidence<br />
• Task 10.6 for assessment of changes in groundwater quality<br />
7.1. Documentation of Model Results<br />
The model results are typically presented based on the water year (from October of the previous<br />
calendar year through September). The simulation period is 47 years and three months. The<br />
first three months of the simulation period from July 2009 to September 2009 are considered as<br />
Year Zero (0), and are excluded in the summary tables. This exclusion is made because the<br />
partial data would bias model result statistics (e.g., annual average, annual minimum, and<br />
annual maximum). The model results are presented for scenario years 1 through 47.<br />
7.1.1. Hydrographs<br />
The Westside Basin Groundwater Model can be used to report groundwater levels specific to<br />
each of the five model layers. To facilitate this analysis, model-simulated groundwater levels<br />
corresponding to Model Layers 1 and 4 are presented, because they are representative of the<br />
response of the unconfined and Primary Production aquifers, respectively.<br />
Model-simulated hydrographs from selected key representative monitoring well locations were<br />
prepared across the entire groundwater basin. Twelve representative monitoring locations<br />
(shown in Figure 10.1-4) were used to show model-simulated groundwater elevations. This is a<br />
subset of the 125 observation wells present in the model.<br />
Attachment 10.1-B presents hydrographs for the 12 selected well locations to demonstrate<br />
results from the individual model scenarios, and also to compare the results of the project model<br />
scenarios (Scenarios 2, 3a, 3b, and 4) relative to the Existing Conditions (Scenario 1).<br />
Attachment 10.1-B includes hydrographs of model-simulated absolute water levels at the 12<br />
selected locations for Model Layers 1 through 5, and of the water levels from the five scenarios<br />
for Model Layers 1 and 4 relative to the Existing Conditions. These hydrographs are included to<br />
show how the pumping assumptions in the various scenarios result in changes in the hydrologic<br />
conditions of the Westside Basin. Model Layer 1 results provide information about expected<br />
changes to the Shallow Aquifer (where present) and to unconfined groundwater conditions;<br />
whereas, Model Layer 4 results give an indication of simulated groundwater level changes<br />
anticipated in the confined Primary Production Aquifer portion of the model. Model Layer 5 also<br />
D.5-44<br />
g:\isg-group\admin\job\08\0864001_sfpuc_eir support\09-reports\tech memos\tms\tm_10.1\tm 10-1_final.doc<br />
© Kennedy/Jenks Consultants, Inc.
Kennedy/Jenks Consultants<br />
Task 10.1 Technical Memorandum<br />
Greg Bartow and Jeff Gilman, SFPUC<br />
18 April 2012<br />
Page 41<br />
encompasses portions of the Deep Aquifer, but it is not laterally continuous and thus not as<br />
well-suited for evaluation as is Model Layer 4 output.<br />
7.1.2. Volumetric Water Budgets<br />
Volumetric water budget graphs and tables were prepared for each of the five scenarios for the<br />
entire simulation period. The water budget (also referred to as water balance or hydrologic<br />
budget) presented in this TM shows the major components of inflows to and outflows from the<br />
Westside Basin. Water budget analysis was conducted at three different regional scales listed<br />
below and results are presented in the following subsections:<br />
• Westside Basin<br />
• North and South Westside Basins<br />
• Five water budget zones that are collectively referred to as the “Developed Subbasin” by<br />
HydroFocus (2011)<br />
7.1.2.1. Westside Basin Water Budget<br />
Attachment 10.1-C presents annual water budget graphs and summary tables as well as annual<br />
and net changes in groundwater storage for each of the five scenarios for the entire Westside<br />
Basin. Average, maximum, and minimum annual inflows and outflows are summarized for each<br />
of the five scenarios in Table 10.1-12. The average values in the summary tables represent the<br />
average annual inflows and outflows for the simulation period based on the water year. As<br />
mentioned earlier, model results for the first partial year (July to September) are excluded in the<br />
summary tables. The minimum and maximum values represent the minimum and maximum<br />
annual inflows and outflows, respectively, for the simulation period. Results in Attachment<br />
10.1-C are summarized on an annual basis to show the annual water balance itemized into<br />
individual major inflows and outflows. The annual change in groundwater storage is also<br />
tabulated and plotted. The negative values for the annual change in groundwater storage<br />
represent a decline in the groundwater storage, while the positive values represent an increase<br />
in groundwater storage. It should be noted that the net change in groundwater storage graphs<br />
represent values relative to the beginning of the simulation. Groundwater storage at the<br />
beginning of the simulation is set to zero (“0”); thus, changes in the basin storage are reported<br />
relative to the beginning storage. Since the model scenarios use the same initial conditions, the<br />
zero basin storage at the beginning of the simulation corresponds to the same basin storage<br />
values for the five model scenarios, each starting with the same June 2009 initial condition that<br />
is representative of the SFPUC Storage Account of 20,000 af.<br />
7.1.2.2. North and South Westside Basin Water Budgets<br />
A zone budget analysis was performed to summarize model results for the North Westside<br />
Basin and South Westside Basin separately. The U.S. Geological Survey post-processor<br />
ZONEBUDGET (Harbaugh, 1990) was used to extract the simulated volumetric water budget<br />
(summed over the five model layers). Two water budget zones are separated south of the <strong>San</strong><br />
D.5-45<br />
g:\isg-group\admin\job\08\0864001_sfpuc_eir support\09-reports\tech memos\tms\tm_10.1\tm 10-1_final.doc<br />
© Kennedy/Jenks Consultants, Inc.
Kennedy/Jenks Consultants<br />
Task 10.1 Technical Memorandum<br />
Greg Bartow and Jeff Gilman, SFPUC<br />
18 April 2012<br />
Page 42<br />
<strong>Francisco</strong>-<strong>San</strong> Mateo County line to represent the North and South Westside Basins. As<br />
mentioned earlier, this division is not intended to represent a physical boundary, but is used<br />
merely for the convenience of representing the model results spatially. The model cells<br />
representing Lake Merced are all located in the North Westside Basin. Therefore, the flow<br />
between the lake and the surrounding aquifer system is accounted for as part of the North<br />
Westside Basin water budget only. Attachment 10.1-D presents volumetric water budget graphs<br />
and tables for the North and South Westside Basins separately, and are presented in the same<br />
way as for the entire Westside Basin. In addition to the water budget components (inflows and<br />
outflows), two components are presented to keep track of flow exchanges between the North<br />
and South Westside Basins, as shown in the summary tables and annual water balance graphs.<br />
7.1.2.3. Developed Subbasin Water Budgets<br />
Similar to the approach taken by HydroFocus (2011), a water budget zone analysis was<br />
conducted to summarize volumetric budgets for the five water budget zones that are collectively<br />
referred to as the “Developed Subbasin” by HydroFocus. The U.S. Geological Survey postprocessor<br />
ZONEBUDGET (Harbaugh, 1990) was used to extract the simulated volumetric water<br />
budget (summed over the five model layers) for the <strong>San</strong> <strong>Francisco</strong>, Daly City, Colma, South <strong>San</strong><br />
<strong>Francisco</strong>, and <strong>San</strong> Bruno water budget zones. These water budget zones encompass the<br />
inland area where all municipal water supply wells are located. The boundaries of the<br />
Developed Subbasin represent the institutional boundaries that coincide with the most intensely<br />
developed water use areas within the basin. This water budget zone analysis presents results<br />
for ten different sub-areas, including the aforementioned five zones in the Developed Subbasin<br />
and five adjacent sub-areas (beneath the Pacific Ocean, <strong>San</strong> <strong>Francisco</strong> Bay Plain, south of <strong>San</strong><br />
Bruno in Millbrae and Burlingame areas, and across the Serra Fault). Attachment 10.1-E<br />
presents results of the water budget zone analyses for the ten sub-areas for each of the five<br />
scenarios. Each summary table presents the annual average inflows, outflows, and the net<br />
change (in units of afy) over the entire simulation period. The major inflows include recharge,<br />
seepage from Lake Merced and inflow from <strong>San</strong> <strong>Francisco</strong> Bay and the Pacific Ocean<br />
(represented by constant head). The major outflows include pumping, outflow to <strong>San</strong> <strong>Francisco</strong><br />
Bay and Pacific Ocean, and seepage to Lake Merced. The summary tables also show the net<br />
flow to or from the Developed Subbasin and the adjacent sub-areas.<br />
7.1.3. Groundwater Elevation Contour Maps<br />
Contour maps of the model simulated groundwater elevation data were generated at selected<br />
key time periods. Model simulated groundwater elevation contour maps are presented in<br />
Attachment 10.1-F to show the model response to various pumping stresses and recovery<br />
periods, such as at the end of simulation (for all scenarios), and at the end of the Design<br />
Drought with the long-term take period (for Scenarios 2 and 4, each involving the GSR Project).<br />
These groundwater elevation contour maps demonstrate general and regional trends in<br />
groundwater flow directions and localized cones of depression around the primary pumping<br />
areas. Contour maps of the simulated groundwater elevation data were plotted for Model Layer<br />
1 (for Scenarios 1, 3a, 3b, and 4) and Model Layer 4 (for Scenarios 1, 2, and 4) to represent the<br />
D.5-46<br />
g:\isg-group\admin\job\08\0864001_sfpuc_eir support\09-reports\tech memos\tms\tm_10.1\tm 10-1_final.doc<br />
© Kennedy/Jenks Consultants, Inc.
Kennedy/Jenks Consultants<br />
Task 10.1 Technical Memorandum<br />
Greg Bartow and Jeff Gilman, SFPUC<br />
18 April 2012<br />
Page 43<br />
model response in the unconfined and deeper aquifers in the basin. Contour maps of the<br />
simulated groundwater elevation maps in Model Layer 1 were generated to demonstrate the<br />
model response in the SFGW Project area in the North Westside Basin where the Shallow<br />
Aquifer and unconfined groundwater conditions exist. Contour maps of the simulated<br />
groundwater elevation maps in Model Layer 4 generally represent the model response in the<br />
Primary Production Aquifer that is present in the GSR Project area in the South Westside Basin.<br />
Dry cells shown on the contour maps for Model Layer 1 define areas where MODFLOWsimulated<br />
groundwater elevations are below the bottom of the layer. Dry cells do not necessarily<br />
imply dewatering the aquifer. During the model simulation, simulated heads can oscillate, in<br />
which cells convert from wet to dry and then convert back from dry to wet.<br />
7.1.4. Lake Hydrographs<br />
Hydrographs for Lake Merced water levels were prepared for all of the five model scenarios<br />
using the Lake-Level Model discussed in Section 8. A composite graph showing results of all<br />
scenarios on a single graph based on the Lake-Level Model is shown in Section 8.2. The lake<br />
hydrographs for each model scenario are also presented in Attachment 10.1-G. To be<br />
consistent with the datum used in the Westside Basin Groundwater Model and the groundwater<br />
elevation hydrograph results from that model, lake levels are shown using both the NGVD 29<br />
datum and the City Datum. All five scenarios account for water removal from the lake to keep<br />
the lake levels below the spillway. As described earlier, the lake spillway is assumed to be 13<br />
feet (City Datum) for Scenarios 1, 2, 3a, and 3b, and to be 9.5 feet (City Datum) for Scenario 4.<br />
Because of limitations in the MODFLOW Lake Package (Section 4.3.3), the results of the<br />
Lake-Level Model are considered the most appropriate for analysis of groundwater-surface<br />
water interactions at Lake Merced.<br />
7.2. Model Scenario Assessment<br />
Model results were reviewed to check that simulated results from individual scenarios are<br />
appropriate and consistent with model inputs. General trends observed in groundwater levels,<br />
water balances, and resulting changes in groundwater storage were checked for consistency<br />
among model scenarios.<br />
7.2.1. Model Convergence<br />
All of the future model scenarios met the mathematical convergence criteria specified in the<br />
existing Westside Groundwater Flow Model in all time steps. Therefore, the model-simulated<br />
results converged appropriately, and the resulting water balance was considered acceptable.<br />
7.2.2. Assessment of Model Scenario Results<br />
Groundwater pumping assumptions used to develop the model scenarios are the significant<br />
model inputs that differentiate one scenario from another and can be used as a measure to<br />
check consistency among scenarios. Simulated groundwater levels are expected to vary<br />
D.5-47<br />
g:\isg-group\admin\job\08\0864001_sfpuc_eir support\09-reports\tech memos\tms\tm_10.1\tm 10-1_final.doc<br />
© Kennedy/Jenks Consultants, Inc.
Kennedy/Jenks Consultants<br />
Task 10.1 Technical Memorandum<br />
Greg Bartow and Jeff Gilman, SFPUC<br />
18 April 2012<br />
Page 44<br />
depending on the magnitude of pumping applied and the spatial and temporal distribution of<br />
pumping.<br />
Figure 10.1-6 presents simulated groundwater levels for the model scenarios for Model Layer 1<br />
at a monitoring well located in Golden Gate Park (SWM-GS). Figure 10.1-7 shows simulated<br />
differences in groundwater elevations at the same location relative to the Existing Conditions<br />
(Scenario 1). Given the proximity of this monitoring well to a proposed SFGW Project municipal<br />
well (South Windmill Replacement), groundwater levels in the vicinity of this well are expected<br />
to be most heavily influenced by the SFGW Project operations, while the GSR Project<br />
operations are not expected to have much effect. Therefore, Scenarios 3a, 3b, and 4 results are<br />
expected to be similar to each other throughout the simulation period. Since the SFGW Project<br />
pumping operations propose to produce additional year-round groundwater supply in the North<br />
Westside Basin compared to the Existing Conditions, groundwater levels resulting from<br />
Scenarios 3a, 3b, and 4 would be expected to be lower than those of the Existing Conditions in<br />
this area. The model results shown in Figures 10.1-6 and 10.1-7 are consistent with these<br />
expected results.<br />
On the other hand, due to the large distance between the SWM-GS monitoring location and the<br />
GSR Project operations in the South Westside Basin, the overall effect of the GSR Project<br />
pumping on groundwater levels in Golden Gate Park area would be expected to be minor<br />
(i.e., groundwater levels for Scenario 2 would be similar to those for the Existing Conditions). As<br />
also shown in Figures 10.1-6 and 10.1-7, all hydrographs start at the same level, as expected,<br />
representing the same initial conditions used in all five scenarios. As the simulation time<br />
elapses, groundwater levels for Scenarios 1 and 2 behave in similar ways at the location of this<br />
monitoring well because of the minor effect of the GSR Project operations on this location.<br />
Similarly, as the simulation time progresses, Scenarios 3a, 3b, and 4 show similar trends since<br />
the results are more influenced by the SFGW Project operations at this location. The model<br />
results shown in Figures 10.1-6 and 10.1-7 are consistent with these expected results.<br />
Figures 10.1-8 and 10.1-9 show the model-simulated groundwater elevations for Model Layer 4<br />
in the Daly City area (DC-A St), which would be subject to influence from the proposed GSR<br />
Project operations and possibly to the proposed pumping for the SFGW Project . Because of its<br />
location, the effect of the GSR Project on groundwater levels at the DC-A St monitoring location<br />
would be expected to be greater compared to that of the SFGW Project. As expected, the<br />
SFGW Project alone would result in a small, incremental decline in groundwater levels as a<br />
result of the year-round additional pumping compared to Scenario 1, while the effects of the<br />
GSR Project would vary significantly depending on the timing of the put/take/hold sequence and<br />
the associated pumping assumptions. Figures 10.1-8 and 10.1-9 demonstrate the expected<br />
results, where the effect of the GSR Project would be more pronounced at this location. As<br />
expected, model–simulated groundwater levels decline during take periods, recover during put<br />
periods, and return to the trends seen in Scenario 1 during hold periods.<br />
Figures 10.1-10 and 10.1-11 show the model-estimated aggregate change in groundwater<br />
storage and changes in groundwater storage relative to the Existing Conditions (Scenario 1). All<br />
five scenarios start with the same initial conditions of June 2009; thus, the storage plots start<br />
D.5-48<br />
g:\isg-group\admin\job\08\0864001_sfpuc_eir support\09-reports\tech memos\tms\tm_10.1\tm 10-1_final.doc<br />
© Kennedy/Jenks Consultants, Inc.
Kennedy/Jenks Consultants<br />
Task 10.1 Technical Memorandum<br />
Greg Bartow and Jeff Gilman, SFPUC<br />
18 April 2012<br />
Page 45<br />
with zero to indicate the beginning of the simulation. As discussed earlier, the June 2009<br />
groundwater levels account for the SFPUC Storage Account of 20,000 af in the basin, but do<br />
not account for basin hydraulic inefficiencies and potential storage losses. This subject is<br />
described in TM 10.4.<br />
As shown in Figures 10.1-10 and 10.1-11, groundwater storage results for Scenario 1 and<br />
Scenarios 3a and 3b follow similar trends of general decline, with the decline in Scenarios 3a<br />
and 3b greater than that under Scenario 1, due to the increased pumping under the SFGW<br />
Project. The aggregate changes in groundwater storage of Scenarios 3a and 3b are similar, as<br />
expected, with a slightly greater decline in Scenario 3a. This is in response to the seasonal<br />
irrigation pumping in Golden Gate Park under Scenario 3a, compared to Scenario 3b, which<br />
assumes regular municipal pumping from the two proposed SFGW Project wells and<br />
supplemental recycled water to replace the irrigation pumping in Golden Gate Park. Due to the<br />
combined pumping assumed under the Cumulative Scenario (Scenario 4), the change in<br />
storage would be greater under the Cumulative Scenario compared to Scenario 1, and<br />
compared to Scenario 2 (GSR Project) or Scenarios 3a and 3b (SFGW Project) alone. As<br />
expected, the trend in model-simulated groundwater storage decline is similar for Scenarios 2<br />
and 4. The additional storage decline in Scenarios 2 and 4 compared to Scenario 1 is due to the<br />
take periods during the 7.5-year Design Drought, but the overall decline is greater under<br />
Scenario 4 than Scenario 2 because of the greater combined pumping of the GSR and SFGW<br />
Projects in Scenario 4. Similar to the effects seen on groundwater levels, the resulting changes<br />
in groundwater storage from the scenarios involving the GSR Project are primarily controlled by<br />
the put/take/hold sequence.<br />
Figure 10.1-12 shows the net change in groundwater pumping relative to the Existing<br />
Conditions (Scenario 1). As expected for Scenario 2, additional pumping varies as a function of<br />
the put/take/hold sequence, where pumping goes below the Existing Conditions rates during put<br />
periods, goes above the Existing Conditions rates during take periods, and returns to similar<br />
rates as in the Existing Conditions during hold periods. Scenario 4 shows trends similar to<br />
Scenario 2, but pumping is greater due to the addition of Scenario 3b pumping for the SFGW<br />
Project to Scenario 4; as a result, the hold period pumping under Scenario 4 returns to levels<br />
similar to Scenario 3b, as opposed to those of the Existing Conditions.<br />
7.3. Application of Model Scenario Results<br />
In the context of the modeling scenarios and related analyses, the Westside Basin Groundwater<br />
Model is considered a useful tool for simulating the relative effect of model scenarios such as<br />
those presented in this TM.<br />
It is most useful to evaluate the relative changes of the model results presented here. Scenario<br />
1 represents the Existing Conditions that provides a basis of comparison for evaluating the<br />
relative change both with and without the SFPUC Projects in Scenario 2 (GSR Project),<br />
Scenarios 3a and 3b (SFGW Project), and Scenario 4 (Cumulative Scenario). Given the same<br />
hydrologic sequence and the same initial conditions used in all five model scenarios, the model<br />
scenarios can be directly compared to the Existing Conditions. Simulated relative changes in<br />
D.5-49<br />
g:\isg-group\admin\job\08\0864001_sfpuc_eir support\09-reports\tech memos\tms\tm_10.1\tm 10-1_final.doc<br />
© Kennedy/Jenks Consultants, Inc.
Kennedy/Jenks Consultants<br />
Task 10.1 Technical Memorandum<br />
Greg Bartow and Jeff Gilman, SFPUC<br />
18 April 2012<br />
Page 46<br />
groundwater levels and aquifer storage may not equal the actual changes determined from<br />
future observed hydrologic conditions, as also mentioned by HydroFocus (2007).<br />
D.5-50<br />
g:\isg-group\admin\job\08\0864001_sfpuc_eir support\09-reports\tech memos\tms\tm_10.1\tm 10-1_final.doc<br />
© Kennedy/Jenks Consultants, Inc.
Kennedy/Jenks Consultants<br />
Task 10.1 Technical Memorandum<br />
Greg Bartow and Jeff Gilman, SFPUC<br />
18 April 2012<br />
Page 47<br />
8. Lake Merced Lake-Level Model<br />
Because of concerns about the ability of MODFLOW (Westside Basin Groundwater Model) to<br />
accurately simulate lake levels in Lake Merced, the analysis also utilizes the Lake-Level Model.<br />
A more complete discussion of the development of the Lake-Level Model is included in<br />
Attachment 10.1-H. Below is a summary of the application of this model to the evaluation of<br />
Lake Merced for the analysis of the GSR and SFGW Projects and the Cumulative Scenario.<br />
8.1. Background on the Lake Merced Lake-Level Model<br />
The Lake-Level Model is a spreadsheet-based water balance model. The model sums up the<br />
inflows and outflows from Lake Merced on a monthly time scale. The water balance<br />
components are each calculated independently. The sum represents the net change in water<br />
volume in the lake for that month. Based on this net change in water volume, a new lake level is<br />
calculated. A positive net change represents an increase in the lake level, whereas a negative<br />
net change represents a decrease in lake level.<br />
The Lake-Level Model was calibrated to historical lake levels over a 70-year period from<br />
October 1939 to June 2009. This period includes a variety of hydrological conditions including<br />
wet, normal and dry precipitation years, flood events, and periods of high and low lake levels<br />
corresponding to a variety of conditions that are considered representative of future conditions.<br />
Overall, the Lake-Level Model closely follows both the long-term and short-term trends by<br />
demonstrating a very strong correlation of the magnitude of both annual and seasonal<br />
fluctuations reasonably well. The comparison of simulated and historical lake levels between<br />
October 1939 and June 2009 is discussed in more detail in the technical memorandum<br />
documenting the development of the Lake-Level Model, which is included as Attachment<br />
10.1-H.<br />
The Lake-Level Model previously has been used to support the Vista Grande Drainage Basin<br />
Alternatives Analysis in 2011 (Brown and Caldwell, 2010, Jacobs Associates, 2011a, 2011b).<br />
Some minor modifications have been made to the historical calibration analysis as part of this<br />
study, which primarily deal with shifting the basis for precipitation from the Mission Dolores to<br />
the Lake Merced Pump Station precipitation gauges. These changes are documented in<br />
Attachment 10.1-H.<br />
8.2. Simulation of the GSR and SFGW Projects<br />
For the analysis of the Existing Conditions and the GSR and SFGW Projects (Scenarios 1, 2, 3a<br />
and 3b), the Lake-Level Model was based on the historical calibration analysis model but with<br />
modifications to the natural hydrology with new provisions to simulate other reasonably<br />
foreseeable future projects. The water-balance components that constitute the natural<br />
background hydrology, such as precipitation, groundwater inflow/outflow, evaporation, and<br />
transpiration, are the foundation for the Lake-Level Model. However, some modifications were<br />
necessary for the analysis of the GSR and SFGW Projects to account for potential future<br />
conditions rather than historical conditions. These modifications include:<br />
D.5-51<br />
g:\isg-group\admin\job\08\0864001_sfpuc_eir support\09-reports\tech memos\tms\tm_10.1\tm 10-1_final.doc<br />
© Kennedy/Jenks Consultants, Inc.
Kennedy/Jenks Consultants<br />
Task 10.1 Technical Memorandum<br />
Greg Bartow and Jeff Gilman, SFPUC<br />
18 April 2012<br />
Page 48<br />
• The same 47.25-year rearranged hydrologic sequence that was used for the MODFLOW<br />
scenarios (see Section 6.3). The model inputs for the natural hydrology were based on<br />
the same historical data for the appropriate months in the sequence.<br />
• Initial Lake Merced level is set to the measured June 2009 lake level of 14.32 feet<br />
(NGVD 29) or 5.7 feet (City Datum).<br />
• The approach used for the groundwater inflow to and outflow from Lake Merced was<br />
changed to use the water balance values of groundwater inflow to and outflow from Lake<br />
Merced based on the corresponding scenario of the MODFLOW model. Using the<br />
MODFLOW water balance results is considered a more reliable approach because the<br />
proposed changes incorporate conditions, such as the in-lieu recharge from the GSR<br />
Project, that do not have a historical equivalent.<br />
The Lake-Level Model results for Scenarios 1, 2, 3a and 3b are discussed in Attachment<br />
10.1-G, and a composite hydrograph showing the Lake Merced water levels for these scenarios<br />
is shown in Figure 10.1-13.<br />
8.3. Simulation of the Vista Grande Drainage Basin Improvements<br />
For this analysis, the Vista Grande Drainage Basin Improvements project is considered a<br />
reasonably foreseeable future project as part of the Cumulative Scenario (Scenario 4). In<br />
addition to the conditions used in Scenarios 1, 2, 3a and 3b, Scenario 4 required additional<br />
modifications to accommodate the Vista Grande Drainage Basin Improvements project.<br />
The primary component of the Vista Grande Drainage Basin Improvements project is the<br />
diversion of stormwater flows directly into Lake Merced. As discussed in Section 6.9.4, Scenario<br />
4 incorporates the 75 cfs scenario of the Vista Grande Drainage Basin Improvements project.<br />
Below is a summary of how the various aspects of the Vista Grande Drainage Basin<br />
Improvements project are addressed in the Lake-Level Model.<br />
Stormwater discharges into Lake Merced would occur when discharge rates in the Vista Grande<br />
Canal exceed 75 cfs, and the excess flows would be diverted into Lake Merced. These flows<br />
occur periodically in response to large storms, and were calculated as part of the Vista Grande<br />
Drainage Basin Alternatives Analysis based on historical precipitation data (Brown and<br />
Caldwell, 2010, Jacobs Associates, 2011a, 2011b). Stormwater flows (greater than 75 cfs) were<br />
calculated to occur in every year, and range from 19 to 681 afy with an average of 207 afy<br />
(Brown and Caldwell, 2010). These stormwater flows were input directly into the Lake-Level<br />
Model as an inflow to Lake Merced. The Lake-Level Model was modified to incorporate the<br />
flows provided by Brown and Caldwell, and these changes are included here.<br />
The Lake Merced Alternative scenarios of the Vista Grande Drainage Basin Improvements<br />
project also include provisions for an engineered wetland and modification of the Lake Merced<br />
spillway (Brown and Caldwell, 2010). In the 75 cfs scenario, the average baseflow in the Vista<br />
Grande Canal is assumed to be diverted into an engineered wetland for treatment and then<br />
discharged to Lake Merced on an ongoing basis. Typical flows in the Vista Grande Canal, or<br />
D.5-52<br />
g:\isg-group\admin\job\08\0864001_sfpuc_eir support\09-reports\tech memos\tms\tm_10.1\tm 10-1_final.doc<br />
© Kennedy/Jenks Consultants, Inc.
Kennedy/Jenks Consultants<br />
Task 10.1 Technical Memorandum<br />
Greg Bartow and Jeff Gilman, SFPUC<br />
18 April 2012<br />
Page 49<br />
baseflow, would be continuously diverted through an engineered wetland for treatment prior to<br />
discharge into Lake Merced. Baseflows have been estimated to range from 18 to 26 af per<br />
month (Kennedy/Jenks, 2009). These were also added to the Lake-Level Model.<br />
The Lake-Level Model results for Scenario 4 are presented in Attachment 10.1-G, and a<br />
composite hydrograph showing the Lake Merced water levels for these scenarios is shown in<br />
Figure 10.1-13.<br />
8.4. Strengths and Limitations of the Lake Merced Lake-Level Model<br />
The primary strength of the Lake-Level Model is that it has a more realistic conceptualization of<br />
the lake than does the MODFLOW Lake Package, and has been calibrated to historical data<br />
(Attachment 10.1-H). The primary conceptualization strengths include the followings:<br />
• The Lake-Level Model has a significantly stronger correlation to the measured Lake<br />
Merced lake levels than the MODFLOW model over the 1958 to 2009 model calibration<br />
period. The MODFLOW model has periods where the simulated lake levels differ from<br />
the measured data by 3 to 6 feet. The improved performance by the Lake-Level Model is<br />
attributed to more site-specific and detailed handling of the hydrologic conditions. The<br />
relative strengths of the Lake-Level Model compared to the MODFLOW model for<br />
simulating Lake Merced are discussed in more detail in Attachment 10.1-H.<br />
• The Lake-Level Model uses the measured June 2009 lake level of 5.7 feet (City Datum)<br />
as the starting condition. The MODFLOW model needs to use the calibrated model lake<br />
level of 9.33 feet (City Datum) to maintain equilibrium and not create mass balance<br />
issues. Therefore, the Lake-Level Model is more consistent with the Existing Conditions.<br />
• The Lake-Level Model has a mechanism to account for the loss of water over the<br />
spillway that is automatically invoked anytime the lake level reaches the spillway level.<br />
• The Lake-Level Model uses measured lake levels whereas the MODFLOW model needs<br />
to use simulated lake levels from the Historical Simulation.<br />
• Estimates of stormwater runoff from the surrounding areas are calculated more<br />
realistically, allowing for variability of land use and other factors.<br />
• The physical characterization of the lake accounts for changing lake surface area with<br />
changing lake levels, which is not available in the MODFLOW Lake Package.<br />
• Evapotranspiration is allowed to vary depending on temperature data, based on whether<br />
the month is above, near, or below average.<br />
The primary limitation of the Lake-Level Model is that the groundwater-surface water<br />
interactions are based upon an assumption of overall groundwater conditions. This is addressed<br />
in the analysis for the GSR and SFGW Projects and for the Cumulative Scenario, by changing<br />
this assumption and replacing it with the MODFLOW-generated water balance results for<br />
inflows to and outflows from Lake Merced. This change provides a more realistic estimation of<br />
D.5-53<br />
g:\isg-group\admin\job\08\0864001_sfpuc_eir support\09-reports\tech memos\tms\tm_10.1\tm 10-1_final.doc<br />
© Kennedy/Jenks Consultants, Inc.
Kennedy/Jenks Consultants<br />
Task 10.1 Technical Memorandum<br />
Greg Bartow and Jeff Gilman, SFPUC<br />
18 April 2012<br />
Page 50<br />
groundwater-surface water interactions, especially for the proposed GSR and SFGW Project<br />
scenarios that do not necessarily have a historical precedent.<br />
In light of the modeling strengths listed above and the better performance of the Lake-Level<br />
Model in simulating lake levels, the Lake-Level Model is considered to be a more appropriate<br />
modeling approach and is the primary tool for evaluating the effects of the GSR and SFGW<br />
Projects and the Cumulative Scenario on Lake Merced.<br />
D.5-54<br />
g:\isg-group\admin\job\08\0864001_sfpuc_eir support\09-reports\tech memos\tms\tm_10.1\tm 10-1_final.doc<br />
© Kennedy/Jenks Consultants, Inc.
Kennedy/Jenks Consultants<br />
Task 10.1 Technical Memorandum<br />
Greg Bartow and Jeff Gilman, SFPUC<br />
18 April 2012<br />
Page 51<br />
References<br />
Brown and Caldwell, 2010, Historical Rain Data and Flow Evaluation, Technical Memorandum<br />
No. 1, April 13, 2010 (revised), prepared for City of Daly City.<br />
California Water Service Company (Cal Water), 2006, Urban Water Management Plan South<br />
<strong>San</strong> <strong>Francisco</strong> District, December 2006.<br />
California <strong>Department</strong> of Water Resources (DWR), 2003, California’s Groundwater, Bulletin<br />
No. 118, DWR, Sacramento, CA, 265p.<br />
Carollo, 2008, Recycled Water Feasibility Study, Cities of South <strong>San</strong> <strong>Francisco</strong>, <strong>San</strong> Bruno,<br />
Brisbane in Coordination with Cal Water and SFPUC.<br />
CDM, 2011, Draft Pine Lake Mass Balance Assessment for Scenarios 3a and 3b. Prepared for<br />
<strong>San</strong> <strong>Francisco</strong> Public Utilities Commissions.<br />
City of Daly City, 2003, AB 303 Grant Final Report. May 2003.<br />
City of Daly City, 2012, Web site for Vista Grande Drainage Basin Alternatives Analysis (2011)<br />
http://www.dalycity.org/City_Hall/<strong>Department</strong>s/public_works/Reports_1119/vistagrande_<br />
alts.htm.<br />
D. Cameron personal communication, September 6, 2011, Email communication between David<br />
Cameron and Michael Maley.<br />
EDAW, Inc. and Talavera & Richardson. 2004, Initiative to Raise and Maintain Lake Level and<br />
Improve Water Quality, Task 3 Technical Memorandum.<br />
ESI, 2001, Guide to Using Groundwater Vistas, Environmental Simulations, Inc., Herndon, VA,<br />
266p.<br />
G. Bartow, personal communication, July 2, 2010, Email communication between Greg Bartow<br />
and Pete Leffler.<br />
Harbaugh, A. W., 1990, A Computer Program for Calculating Subregional Water Budgets Using<br />
Results from the U.S. Geological Survey Modular three-dimensional Finite-difference<br />
Ground-water Flow Model, U.S. Geological Survey Open-File Report 90-392.<br />
Harbaugh, A. W., E. R. Banta, M. C. Hill, and M. G. McDonald, 2000, MODFLOW-2000, the<br />
U.S. Geological Survey modular ground-water model user guide to modularization<br />
concepts and the ground-water flow process. Denver, CO, Reston, VA: U.S. Geological<br />
Survey.<br />
D.5-55<br />
g:\isg-group\admin\job\08\0864001_sfpuc_eir support\09-reports\tech memos\tms\tm_10.1\tm 10-1_final.doc<br />
© Kennedy/Jenks Consultants, Inc.
Kennedy/Jenks Consultants<br />
Task 10.1 Technical Memorandum<br />
Greg Bartow and Jeff Gilman, SFPUC<br />
18 April 2012<br />
Page 52<br />
HydroFocus, 2007, Westside Basin Groundwater-Flow Model (version 2.0), Historical<br />
Calibration Run (1959-2005) Results and Sensitivity Analysis, 76p.<br />
HydroFocus, 2009, Westside Basin Groundwater-Flow Model: Revised Historical Simulation<br />
and No-Project Simulation”, August 2009.<br />
HydroFocus, 2011, Westside Basin Groundwater-Flow Model: Updated Model and 2008 No<br />
Project Simulation Results, May 2011.<br />
J. Gilman, personal communication, December 18, 2009, Email communication between Jeff<br />
Gilman and Sevim Onsoy.<br />
J. Gilman, personal communication, November 18, 2010, Email communication between Jeff<br />
Gilman and Sevim Onsoy.<br />
J. Gilman, personal communication April 6, 2011, Email communication between Jeff Gilman<br />
and Sevim Onsoy.<br />
Jacobs Associates, 2011a, Vista Grande Drainage Basin Alternatives Analysis Report,<br />
Alternatives Evaluation Report Executive Summary, prepared for City of Daly City,<br />
February 7, 2011 (Final Draft).<br />
Jacobs Associates, 2011b, Vista Grande Drainage Basin Alternatives Analysis Report,<br />
Volume 3 Lake Merced Alternative, prepared for City of Daly City, February 7, 2011<br />
(Final Draft).<br />
Kennedy/Jenks Consultants, 2009a, Lake Level Restoration Project Draft Conceptual<br />
Engineering Report (CER) prepared by Kennedy/Jenks Consultants for the SFPUC,<br />
January 2009.<br />
Kennedy/Jenks Consultants, 2009b, Restoration Project Draft Lake Merced Lake Level Model –<br />
Historical Analysis, technical memorandum prepared by Kennedy/Jenks Consultants for<br />
the SFPUC, August 25, 2009.<br />
Merritt, M.L., and Konikow, L.F., 2000, Documentation of a Computer Program to Simulate<br />
Lake-Aquifer Interaction Using the MODFLOW Ground-Water Flow Model and the<br />
MOC3D Solute-Transport Model: U.S. Geological Survey Water-Resources<br />
Investigations Report 00-4167, 146p.<br />
MWH, 2008, <strong>San</strong> <strong>Francisco</strong> Public Utilities Commission Water System Improvement Program<br />
Groundwater Conjunctive Use Project WSIP Project CUW30103, Conceptual<br />
Engineering Report, November 2008.<br />
D.5-56<br />
g:\isg-group\admin\job\08\0864001_sfpuc_eir support\09-reports\tech memos\tms\tm_10.1\tm 10-1_final.doc<br />
© Kennedy/Jenks Consultants, Inc.
Kennedy/Jenks Consultants<br />
Task 10.1 Technical Memorandum<br />
Greg Bartow and Jeff Gilman, SFPUC<br />
18 April 2012<br />
Page 53<br />
Luhdorff and Scalmanini Consulting Engineers (LSCE), 2002, Conceptualization of the Lake-<br />
Aquifer System, Westside Ground-Water Basin, <strong>San</strong> <strong>Francisco</strong> and <strong>San</strong> Mateo<br />
Counties, 100p.<br />
Luhdorff and Scalmanini Consulting Engineers (LSCE), 2004, Update on the Conceptualization<br />
of the Lake-Aquifer System, Westside Ground-Water Basin, <strong>San</strong> <strong>Francisco</strong> and <strong>San</strong><br />
Mateo Counties, 166p.<br />
Luhdorff and Scalmanini Consulting Engineers (LSCE), 2006, Hydrogeologic Conditions in the<br />
Westside Basin 2005, November 2006.<br />
Luhdorff and Scalmanini, Consulting Engineers (LSCE), 2005, Results of In-Lieu Charge<br />
Demonstration Fall 2002 Through Spring 2005 Westside Basin Conjunctive Use Pilot<br />
Project, October 2005.<br />
Luhdorff and Scalmanini Consulting Engineers (LSCE), 2008, Simulation of Lake Level<br />
Response to SFPUC Lake Addition Preferred Operating Criteria, Lake Merced, North<br />
Westside Groundwater Basin. Technical Memorandum. October 2008.<br />
Luhdorff and Scalmanini Consulting Engineers (LSCE), 2010, Task 8B Technical Memorandum<br />
No. 1: Hydrologic Setting of the Westside Basin, 40p.<br />
R. Appleby, personal communication, March 8, 2010, Verbal communication between Pete<br />
Leffler and Roger Appleby.<br />
R. Kavaoff, personal communication, November 17, 2009, Verbal communication between Pete<br />
Leffler and Rick Kavakoff.<br />
Rogge, 2003, Dimensions of the Westside Groundwater Basin <strong>San</strong> <strong>Francisco</strong> and <strong>San</strong> Mateo<br />
Counties, California.<br />
<strong>San</strong> Bruno, 2007, City of <strong>San</strong> Bruno Urban Water Management Plan Update, January 2007.<br />
<strong>San</strong> <strong>Francisco</strong> Public Utilities Commission (SFPUC), 2005, Final Draft North Westside<br />
Groundwater Basin Management Plan.<br />
<strong>San</strong> <strong>Francisco</strong> Public Utilities Commission (SFPUC), 2007, SFPUC Water System Improvement<br />
Program Programmatic Environmental Impact Report.<br />
<strong>San</strong> <strong>Francisco</strong> Public Utilities Commission (SFPUC), 2009a, Calaveras Dam Replacement<br />
Project Draft Environmental Impact Report, Appendix D.2: SFPUC Memorandum<br />
Detailing Revised 2018 HHLSM Model Run Performed for the Calaveras Dam<br />
Replacement Project.<br />
<strong>San</strong> <strong>Francisco</strong> Public Utilities Commission (SFPUC), 2009b, Conceptual Engineering Report<br />
Groundwater Sub-Project B North Westside Basin Local Supply, July 2009.<br />
D.5-57<br />
g:\isg-group\admin\job\08\0864001_sfpuc_eir support\09-reports\tech memos\tms\tm_10.1\tm 10-1_final.doc<br />
© Kennedy/Jenks Consultants, Inc.
Kennedy/Jenks Consultants<br />
Task 10.1 Technical Memorandum<br />
Greg Bartow and Jeff Gilman, SFPUC<br />
18 April 2012<br />
Page 54<br />
<strong>San</strong> <strong>Francisco</strong> Public Utilities Commission (SFPUC), 2009c, 2008 Annual Groundwater<br />
Monitoring Report, Westside Basin, <strong>San</strong> <strong>Francisco</strong> and <strong>San</strong> Mateo Counties, California,<br />
SFPUC, <strong>San</strong> <strong>Francisco</strong>, CA, 285p.<br />
<strong>San</strong> <strong>Francisco</strong> Public Utilities Commission (SFPUC), 2010, 2009 Annual Groundwater<br />
Monitoring Report, Westside Basin, <strong>San</strong> <strong>Francisco</strong> and <strong>San</strong> Mateo Counties, California,<br />
SFPUC, <strong>San</strong> <strong>Francisco</strong>, CA, 279p.<br />
<strong>San</strong> <strong>Francisco</strong> Public Utilities Commission (SFPUC), 2011, 2010 Annual Groundwater<br />
Monitoring Report, Westside Basin, <strong>San</strong> <strong>Francisco</strong> and <strong>San</strong> Mateo Counties, California,<br />
SFPUC, <strong>San</strong> <strong>Francisco</strong>, CA, 230p.<br />
<strong>San</strong> <strong>Francisco</strong> Recreation and Parks <strong>Department</strong> (SFRPD), 1994, Concept Design Report for<br />
Lakes Rehabilitation, October 1994 (prepared by Ace Pacific).<br />
Yates, E.B., S.N. Hamlin, and L.H. McCann, 1990, Geohydrology, water quality, and water<br />
budgets of Golden Gate Park and the Lake Merced area in the western part of <strong>San</strong><br />
<strong>Francisco</strong>, California, U.S. Geological Survey Water-Resources Investigations Report<br />
90-4080, U.S. Geological Survey, Sacramento, CA, 50p.<br />
D.5-58<br />
g:\isg-group\admin\job\08\0864001_sfpuc_eir support\09-reports\tech memos\tms\tm_10.1\tm 10-1_final.doc<br />
© Kennedy/Jenks Consultants, Inc.
Kennedy/Jenks Consultants<br />
Task 10.1 Technical Memorandum<br />
Greg Bartow and Jeff Gilman, SFPUC<br />
18 April 2012<br />
Page 55<br />
Figure List<br />
Figure 10.1-1<br />
Westside Groundwater Basin Boundary, North and South Westside Basins<br />
Figure 10.1-2<br />
Figure 10.1-3<br />
Figure 10.1-4<br />
Figure 10.1-5<br />
Westside Basin Groundwater-Flow Model Boundary<br />
Westside Basin Groundwater-Flow Model Layer Structure and Regional<br />
Subsurface Hydrogeology<br />
Locations of Partner Agency Wells, Proposed GSR and SFGW Project Municipal<br />
Wells, and Selected Representative Monitoring Wells with Model Results<br />
Cumulative Rainfall Departure Curve Analysis for Historical and Rearranged<br />
Hydrologic Sequence<br />
Figure 10.1-6 Model-Simulated Groundwater Elevations at SWM-GS-M (Model Layer 1)<br />
Figure 10.1-7<br />
Model-Simulated Groundwater Elevations Relative to Existing Conditions at<br />
SWM-GS-M (Model Layer 1)<br />
Figure 10.1-8 Model-Simulated Groundwater Elevations at DC-A St (Model Layer 4)<br />
Figure 10.1-9<br />
Figure 10.1-10<br />
Figure 10.1-11<br />
Figure 10.1-12<br />
Figure 10.1-13<br />
Model-Simulated Groundwater Elevations Relative to Existing Conditions at<br />
DC-A St (Model Layer 4)<br />
Model-Simulated Aggregate Change in Groundwater Storage<br />
Model-Simulated Aggregate Change in Groundwater Storage Relative to<br />
Existing Conditions<br />
Model-Simulated Net Change in Groundwater Pumping Relative to Existing<br />
Conditions<br />
Model-Simulated Lake Merced Lake Elevations Based on Lake Merced<br />
Lake-Level Model<br />
D.5-59<br />
g:\isg-group\admin\job\08\0864001_sfpuc_eir support\09-reports\tech memos\tms\tm_10.1\tm 10-1_final.doc<br />
© Kennedy/Jenks Consultants, Inc.
Kennedy/Jenks Consultants<br />
Task 10.1 Technical Memorandum<br />
Greg Bartow and Jeff Gilman, SFPUC<br />
18 April 2012<br />
Page 56<br />
Table List<br />
Table 10.1-1<br />
Table 10.1-2<br />
Table 10.1-3<br />
Table 10.1-4<br />
Table 10.1-5<br />
Table 10.1-6<br />
Table 10.1-7<br />
Table 10.1-8<br />
Table 10.1-9<br />
Table 10.1-10<br />
Table 10.1-11<br />
Table 10.1-12<br />
Summary of Model Scenario Descriptions<br />
Summary of Model Scenario Pumping Assumptions<br />
Regional Groundwater Storage and Recovery Project Proposed Municipal<br />
Wells<br />
Partner Agency Municipal Pumping Wells<br />
SFPUC Supplemental Surface Water Deliveries<br />
<strong>San</strong> <strong>Francisco</strong> Groundwater Supply Project Proposed Municipal Wells<br />
Proposed Pumping Rate Assumptions for Regional Groundwater Storage and<br />
Recovery Project Proposed Municipal Wells and Partner Agency Municipal<br />
Wells<br />
Depth Distribution of Pumping by Model Layers<br />
Put/Take/Hold Sequence for Model Scenarios<br />
Pumping Rate Assumptions for <strong>San</strong> <strong>Francisco</strong> Groundwater Supply Project<br />
Proposed Municipal Wells<br />
Monthly Pumping Rate Assumptions for <strong>San</strong> <strong>Francisco</strong> Groundwater Supply<br />
Project Proposed Municipal Wells<br />
Summary of Westside Basin Annual Water Balance<br />
Attachment List<br />
Attachment 10.1-A<br />
Attachment 10.1-B<br />
Attachment 10.1-C<br />
Attachment 10.1-D<br />
Attachment 10.1-E<br />
Key Proposed Elements of GSR Project Operating Agreement for EIR Analysis<br />
Model Scenario Hydrographs for Selected Locations<br />
Model Scenario Water Balance Results – Westside Basin<br />
Model Scenario Water Balance Results – North and South Westside Basins<br />
Model Scenario Water Balance Results – <strong>San</strong> <strong>Francisco</strong>, Daly City, Colma,<br />
South <strong>San</strong> <strong>Francisco</strong>, and <strong>San</strong> Bruno Water Budget Zones<br />
D.5-60<br />
g:\isg-group\admin\job\08\0864001_sfpuc_eir support\09-reports\tech memos\tms\tm_10.1\tm 10-1_final.doc<br />
© Kennedy/Jenks Consultants, Inc.
Kennedy/Jenks Consultants<br />
Task 10.1 Technical Memorandum<br />
Greg Bartow and Jeff Gilman, SFPUC<br />
18 April 2012<br />
Page 57<br />
Attachment 10.1-F<br />
Attachment 10.1-G<br />
Attachment 10.1-H<br />
Model Scenario Groundwater Elevation Contour Maps for Selected Time<br />
Periods<br />
Model Scenario Lake Hydrographs from Lake Merced Lake- Level Model<br />
Lake Merced Lake-Level Model Development Technical Memorandum<br />
D.5-61<br />
g:\isg-group\admin\job\08\0864001_sfpuc_eir support\09-reports\tech memos\tms\tm_10.1\tm 10-1_final.doc<br />
© Kennedy/Jenks Consultants, Inc.
D.5-62<br />
Figures
Path: Z:\Projects\SFPUC_ConjUse_CER\Events\Task_10\Task_10.1\20120229_TM\10-1_01_WestsideBasinBoundary.mxd<br />
280<br />
Alameda<br />
280<br />
1<br />
80<br />
<strong>San</strong> <strong>Francisco</strong><br />
North Westside Groundwater Basin<br />
Pine<br />
Lake<br />
Lake<br />
Merced<br />
35<br />
S S a a n n F F r r a a n n c c i i s s c c o o B B a a y y<br />
280<br />
Daly City<br />
82<br />
Brisbane<br />
1<br />
P P a a c c i i f f i i c c O O c c e e a a n n<br />
Colma<br />
82<br />
35<br />
35<br />
82<br />
35<br />
82<br />
South <strong>San</strong> <strong>Francisco</strong><br />
South Westside Groundwater Basin<br />
35<br />
<strong>San</strong> Bruno<br />
Pacifica<br />
35<br />
Millbrae<br />
Burlingame<br />
101<br />
Cayote<br />
Point<br />
82<br />
<strong>San</strong> Mateo<br />
1<br />
1<br />
Montara<br />
0 0.5 1 1.5 Miles<br />
280<br />
Hillsborough<br />
82<br />
Aerial Photo Source: World Imagery from ESRI. Copyright:© 2009 ESRI, AND, TANA, UNEP-WCMC<br />
CITY AND COUNTY OF SAN FRANCISCO<br />
PUBLIC UTILITIES COMMISSION<br />
ENGINEERING MANAGEMENT BUREAU<br />
WESTSIDE GROUNDWATER<br />
BASIN BOUNDARY<br />
NORTH AND SOUTH WESTSIDE BASINS<br />
D.5-63<br />
Kennedy/Jenks Consultants<br />
303 Second Street, Suite 300 South<br />
<strong>San</strong> <strong>Francisco</strong>, CA 94107<br />
Regional Groundwater Storage and Recovery Project<br />
and <strong>San</strong> <strong>Francisco</strong> Groundwater Supply Project<br />
Figure<br />
10.1-1<br />
Date<br />
April 2012
Source: Westside Basin Groundwater-Flow Model; Updated Model and 2008 No<br />
Project Simulation Results, HydroFocus, May 2011.<br />
D.5-64<br />
Kennedy/Jenks Consultants<br />
Regional Groundwater Storage and Recovery Project<br />
and <strong>San</strong> <strong>Francisco</strong> Groundwater Supply Project<br />
<strong>San</strong> <strong>Francisco</strong> Public Utilities Commission<br />
Westside Basin Groundwater-Flow<br />
Model Boundary<br />
K/J 0864001<br />
April 2012<br />
Figure 10.1-2
D.5-65<br />
Source: Westside Basin Groundwater-Flow Model; Updated Model and 2008 No Project Simulation Results, HydroFocus, May 2011.<br />
Note: Modification from North South Geologic Cross Section, Final Task 8B technical Memorandum No.1, Hydrologic Setting of the<br />
Westside Basin, LSCE, May 2010.<br />
Kennedy/Jenks Consultants<br />
Regional Groundwater Storage and Recovery Project<br />
and <strong>San</strong> <strong>Francisco</strong> Groundwater Supply Project<br />
<strong>San</strong> <strong>Francisco</strong> Public Utilities Commission<br />
Westside Basin Groundwater-Flow<br />
Model Layer Structure and Regional<br />
Subsurface Hydrogeology<br />
K/J 0864001<br />
April 2012<br />
Figure 10.1-3
Path: Z:\Projects\SFPUC_ConjUse_CER\Events\Task_10\Task_10.1\20120229_TM\10-1_04_PartnerAgency_ModelWells.mxd<br />
280<br />
Alameda<br />
280<br />
North Lake<br />
Golden Gate Park Central Pump Station<br />
80<br />
SWM-GS-M<br />
South Windmill Replacement<br />
Ortega_MW<br />
West Sunset Playground<br />
<strong>San</strong>tiago-S<br />
<strong>San</strong> <strong>Francisco</strong><br />
South Sunset Playground LMMW-5S<br />
Pine Lake<br />
LMMW-4S<br />
Lake<br />
Merced<br />
Harding-Park<br />
Lake Merced Pump Station<br />
Olympic-MW<br />
35<br />
CUP-03A<br />
Colma Creek<br />
S S a a n n F F r r a a n n c c i i s s c c o o B B a a y y<br />
DC-Westlake DC-3 DC-Junipero Serra<br />
CUP-05 CUP-06<br />
DC-Jefferson<br />
CUP-07<br />
DC-No.04<br />
DC-Vale<br />
DC-No.04 Replacement<br />
Daly City<br />
CUP-10A<br />
CUP-11A<br />
DC-A-St.<br />
Brisbane<br />
CUP-18<br />
P P a a c c i i f f i i c c O O c c e e a a n n<br />
35<br />
35<br />
DC-A Street<br />
Replacement<br />
35<br />
CUP-19<br />
CUP-22A<br />
82<br />
Cyp_Lawn_2<br />
Colma<br />
CUP-23<br />
SSF1-20<br />
CUP-31<br />
SSF1-21<br />
SSF1-18<br />
SSF1-15<br />
CUP-36-1<br />
SSF-02<br />
Proposed SSF1-22<br />
SSF1-19<br />
SSF1-14<br />
Proposed SSF1-24<br />
Proposed SSF1-23<br />
Proposed SSF1-25<br />
South <strong>San</strong> <strong>Francisco</strong><br />
CUP-44-2<br />
CUP-41-4<br />
35<br />
CUP-44-1<br />
SB-No.15<br />
<strong>San</strong> Bru no Creek<br />
SB-No.16<br />
SB-12<br />
<strong>San</strong> Bruno<br />
SB-No.20<br />
SB-No.17<br />
Pacifica<br />
SB-No.18<br />
CUP-M-1<br />
35<br />
Millbrae<br />
Millbrae Creek<br />
Burlingame<br />
101<br />
82<br />
<strong>San</strong> Mateo<br />
1<br />
1<br />
Montara<br />
0 0.5 1 1.5 Miles<br />
280<br />
Hillsborough<br />
82<br />
Aerial Photo Source: World Imagery from ESRI. Copyright:© 2009 ESRI, AND, TANA, UNEP-WCMC<br />
GSR Project Proposed Municipal Wells<br />
SFGW Project Proposed Municipal Wells<br />
Legend<br />
Selected Representative Monitoring Wells<br />
Cal Water Municipal Wells<br />
Daly City Municipal Wells<br />
<strong>San</strong> Bruno Municipal Wells<br />
South Westside Groundwater Basin<br />
North Westside Groundwater Basin<br />
D.5-66<br />
CITY AND COUNTY OF SAN FRANCISCO<br />
PUBLIC UTILITIES COMMISSION<br />
ENGINEERING MANAGEMENT BUREAU<br />
LOCATIONS OF PARTNER AGENCY WELLS,<br />
PROPOSED GSR AND SFGW<br />
PROJECT MUNICIPAL WELLS, AND<br />
SELECTED REPRESENTATIVE MONITORING<br />
WELLS WITH MODEL RESULTS<br />
Kennedy/Jenks Consultants<br />
303 Second Street, Suite 300 South<br />
<strong>San</strong> <strong>Francisco</strong>, CA 94107<br />
Regional Groundwater Storage and Recovery Project<br />
and <strong>San</strong> <strong>Francisco</strong> Groundwater Supply Project<br />
Figure<br />
10.1-4<br />
Date<br />
April 2012
40<br />
D.5-67<br />
Rainfa all Difference Relative to Lo ong‐Term Aver rage<br />
(inches)<br />
20<br />
0<br />
‐20<br />
‐40<br />
‐60<br />
‐80<br />
0 5 10 15 20 25 30 35 40 45 50<br />
Scenario Year<br />
Cumulative Rainfall (inches):<br />
-30<br />
20 70<br />
-80<br />
Rearranged Hydrologic Sequence<br />
Historical 1958 to 2005 Precipitation Data<br />
0 50<br />
Kennedy/Jenks Consultants<br />
Regional Groundwater Storage and Recovery Project<br />
and <strong>San</strong> <strong>Francisco</strong> Groundwater Supply Project<br />
<strong>San</strong> <strong>Francisco</strong> Public Utilities Commission<br />
Cumulative Rainfall Departure Curve<br />
Analysis for Historical and Rearranged<br />
Hydrological Sequence<br />
K/J 0864001<br />
April 2012<br />
Figure 10.1-5
NGVD 29)<br />
25<br />
20<br />
Design Drought<br />
evation (feet<br />
15<br />
10<br />
D.5-68<br />
oundwater El<br />
Simulated Gr<br />
5<br />
0<br />
‐5<br />
‐10<br />
50<br />
40<br />
30<br />
20<br />
10<br />
00<br />
Scenario Year<br />
Model Heads:<br />
Scenario 1 Scenario 2 Scenario 3a<br />
Scenario 3b Scenario 4<br />
Kennedy/Jenks Consultants<br />
Regional Groundwater Storage and Recovery Project<br />
and <strong>San</strong> <strong>Francisco</strong> Groundwater Supply Project<br />
<strong>San</strong> <strong>Francisco</strong> Public Utilities Commission<br />
Model-Simulated Groundwater<br />
Elevations at SWM-GS-M M (Model Layer 1)<br />
K/J 0864001<br />
April 2012<br />
Figure 10.1-6
15<br />
Design Drought<br />
from<br />
10<br />
D.5-69<br />
Groundw water Elevatio on Difference<br />
Existing Condi itions (feet)<br />
5<br />
0<br />
‐5<br />
‐10<br />
‐15<br />
50<br />
40<br />
30<br />
20<br />
10<br />
00<br />
Scenario Year<br />
Model Heads:<br />
Scenario 1 Scenario 2 Scenario 3a<br />
Scenario 3b Scenario 4<br />
Kennedy/Jenks Consultants<br />
Regional Groundwater Storage and Recovery Project<br />
and <strong>San</strong> <strong>Francisco</strong> Groundwater Supply Project<br />
<strong>San</strong> <strong>Francisco</strong> Public Utilities Commission<br />
Model-Simulated Groundwater Elevations<br />
Relative to Existing Conditions at<br />
SWM-GS-M (Model Layer 1)<br />
K/J 0864001<br />
April 2012<br />
Figure 10.1-7
0<br />
NGVD 29)<br />
‐50<br />
Design Drought<br />
evation (feet<br />
‐100<br />
D.5-70<br />
Simulated Gro oundwater El<br />
‐150<br />
‐200<br />
‐250<br />
50<br />
40<br />
30<br />
20<br />
10<br />
00<br />
Scenario Year<br />
Model Heads:<br />
Scenario 1 Scenario 2 Scenario 3a<br />
Scenario 3b Scenario 4<br />
Kennedy/Jenks Consultants<br />
Regional Groundwater Storage and Recovery Project<br />
and <strong>San</strong> <strong>Francisco</strong> Groundwater Supply Project<br />
<strong>San</strong> <strong>Francisco</strong> Public Utilities Commission<br />
Model-Simulated Groundwater<br />
Elevations at DC-A St (Model Layer 4)<br />
K/J 0864001<br />
April 2012<br />
Figure 10.1-8
80<br />
60<br />
Design Drought<br />
D.5-71<br />
Groundw water Elevatio on Difference from<br />
Existing Condit tions (feet)<br />
40<br />
20<br />
0<br />
‐20<br />
‐40<br />
‐60<br />
‐80<br />
‐100<br />
‐120<br />
50<br />
40<br />
30<br />
20<br />
10<br />
00<br />
Scenario Year<br />
Model Heads:<br />
Scenario 1 Scenario 2 Scenario 3a<br />
Scenario 3b Scenario 4<br />
Kennedy/Jenks Consultants<br />
Regional Groundwater Storage and Recovery Project<br />
and <strong>San</strong> <strong>Francisco</strong> Groundwater Supply Project<br />
<strong>San</strong> <strong>Francisco</strong> Public Utilities Commission<br />
Model-Simulated Groundwater Elevations<br />
Relative to Existing Conditions at<br />
DC-A St (Model Layer 4)<br />
K/J 0864001<br />
April 2012<br />
Figure 10.1-9
40,000<br />
20,000<br />
Design Drought<br />
D.5-72<br />
ar)<br />
Wate er Volume (acr re‐feet per ye<br />
0<br />
‐20,000<br />
‐40,000<br />
‐60,000<br />
‐80,000<br />
‐100,000<br />
‐120,000<br />
50<br />
40<br />
30<br />
20<br />
10<br />
0<br />
Scenario Year<br />
Aggregate Storages:<br />
Scenario 1 Scenario 2 Scenario 3a<br />
Scenario 3b Scenario 4<br />
Kennedy/Jenks Consultants<br />
Regional Groundwater Storage and Recovery Project<br />
and <strong>San</strong> <strong>Francisco</strong> Groundwater Supply Project<br />
<strong>San</strong> <strong>Francisco</strong> Public Utilities Commission<br />
Model-Simulated Aggregate Change in<br />
Groundwater Storage<br />
K/J 0864001<br />
April 2012<br />
Figure 10.1-10
60,000<br />
Design Drought<br />
40,000<br />
D.5-73<br />
Wate er Volume (acr re‐feet per ye ear)<br />
20,000<br />
0<br />
‐20,000<br />
‐40,000,<br />
‐60,000<br />
‐80,000<br />
000<br />
50<br />
40<br />
30<br />
20<br />
10<br />
0<br />
Scenario Year<br />
Aggregate Storages:<br />
Scenario 1 Scenario 2 Scenario 3a<br />
Scenario 3b Scenario 4<br />
Kennedy/Jenks Consultants<br />
Regional Groundwater Storage and Recovery Project<br />
and <strong>San</strong> <strong>Francisco</strong> Groundwater Supply Project<br />
<strong>San</strong> <strong>Francisco</strong> Public Utilities Commission<br />
Model-Simulated Aggregate Change in<br />
Groundwater Storage Relative to<br />
Existing Conditions<br />
K/J 0864001<br />
April 2012<br />
Figure 10.1-11
15,000<br />
Design Drought<br />
ar)<br />
10,000<br />
D.5-74<br />
Wate er Volume (acr re‐feet per ye<br />
5,000<br />
0<br />
‐5,000<br />
‐10,000<br />
‐15,000<br />
50<br />
40<br />
30<br />
20<br />
10<br />
0<br />
Scenario Year<br />
Pumping Relative to Existing Conditions:<br />
Scenario 1 Scenario 2 Scenario 3a<br />
Scenario 3b Scenario 4<br />
Kennedy/Jenks Consultants<br />
Regional Groundwater Storage and Recovery Project<br />
and <strong>San</strong> <strong>Francisco</strong> Groundwater Supply Project<br />
<strong>San</strong> <strong>Francisco</strong> Public Utilities Commission<br />
Model-Simulated Net Change in<br />
Groundwater Pumping Relative to Existing<br />
Conditions<br />
K/J 0864001<br />
April 2012<br />
Figure 10.1-12
30<br />
Design Drought<br />
21.38<br />
D.5-75<br />
Simulate ed Lake Elevat tion (feet NGV VD 29)<br />
25<br />
20<br />
15<br />
10<br />
5<br />
0<br />
‐5<br />
16.38<br />
11.38<br />
6.38<br />
1.38<br />
‐3.62<br />
‐8.62<br />
‐13.62<br />
Simulated<br />
Lake Elevatio on (feet City Datum)<br />
‐10<br />
0 10 20 30 40 50<br />
Scenario Year<br />
‐18.62<br />
Model Lake Elevations:<br />
Scenario 1 Scenario 2 Scenario 3a<br />
Scenario 3b Scenario 4<br />
Kennedy/Jenks Consultants<br />
Regional Groundwater Storage and Recovery Project<br />
and <strong>San</strong> <strong>Francisco</strong> Groundwater Supply Project<br />
<strong>San</strong> <strong>Francisco</strong> Public Utilities Commission<br />
Model-Simulated Lake Merced Lake<br />
Elevations Based on Lake Merced<br />
Lake-Level Model<br />
K/J 0864001<br />
April 2012<br />
Figure 10.1-13
D.5-76<br />
Tables
Kennedy/Jenks Consultants<br />
Table 10.1-1: Summary of Model Scenario Descriptions<br />
Ref No. Assumption Scenario 1 - Existing Conditions Scenario 2 - GSR Scenario 3a/3b - SFGW Scenario 4 - Cumulative<br />
1 Source Model 2008 No-Project Scenario (HydroFocus, May 2011, ver. 3.1) was used as the basis with changes made for Scenario 1, as Same as Scenario 1 Same as Scenario 1 Same as Scenario 1<br />
listed below.<br />
2 Hydrology Use the following sequence of historical hydrology provided by SFPUC (personal comm. between David Cameron and Same as Scenario 1 Same as Scenario 1 Same as Scenario 1<br />
Michael Maley, 2011). Total model Scenario duration is 47 years and 3 months, constructed as follows:<br />
- Jul 1996 to Sep 2003<br />
- Oct 1958 to Nov 1992<br />
- Dec 1975 to Jun 1978 (to form the last two years of the Design Drought)<br />
- Jul 2003 to Sept 2006 (recovery period after the Design Drought)<br />
3 Initial Groundwater Conditions Model simulated June 2009 groundwater levels from the HydroFocus Historical Model (May 2011, ver. 3.1). This is selected<br />
because the available field measured groundwater elevation data for June 2009 were too sparse to construct adequate new<br />
groundwater elevation maps of sufficient detail necessary for assigning initial model conditions to all model layers and model<br />
cells. Therefore, an approximation method was developed that used the model to generate the initial groundwater elevations.<br />
Same as Scenario 1 Same as Scenario 1 Same as Scenario 1<br />
D.5-77<br />
4 Initial Lake Merced Conditions Model simulated June 2009 Lake Merced levels (17.95 ft NGVD 1929 or 9.33 ft City Datum at South, North, and Impound Same as Scenario 1 Same as Scenario 1 Same as Scenario 1<br />
Lakes) from the HydroFocus Historical Simulation (May 2011, ver. 3.1). The reason SFPUC is proposing to use the simulated<br />
rather than measured (observed) Lake Merced water level is because this change will improve the model performance.<br />
Specifically, the use of simulated starting conditions will ensure that the model is in equilibrium. It is appropriate to use<br />
simulated starting conditions because the intent of the Model is to evaluate relative change and trends (rather than absolute<br />
changes and trends)<br />
5 Lake Merced Lake Package Lake package was revised consistent with the revised hydrological sequence; No stormwater inputs. Same as Scenario 1 Same as Scenario 1 Lake package was revised consistent with the new hydrological<br />
sequence. The groundwater models use the Daly City proposed<br />
scenario "75 cfs Scenario with Completed Wetlands" (which includes<br />
wetlands and a spillway at 9.5 feet City Datum).<br />
6 Recharge Package Soil Moisture Budget (SMB) and recharge package were revised consistent with the revised hydrological sequence. Same as Scenario 1 Same as Scenario 1 Same as Scenario 1<br />
7 Partner Agency Total Pumping 6.84 mgd total pumping, based on the median of each agency pumping from 1959-2009. Pumping distributed among<br />
individual wells based on HydroFocus 2008 No-Project Scenario.<br />
- Daly City: 3.78 mgd<br />
- <strong>San</strong> Bruno: 1.88 mgd<br />
- Cal Water: 1.18 mgd<br />
8 Daly City Municipal Wells Daly City Jefferson<br />
Daly City Vale<br />
Daly City Westlake<br />
Daly City Junipero Serra<br />
Daly City No.4<br />
9<br />
10<br />
Cal Water Municipal Wells<br />
<strong>San</strong> Bruno Municipal Wells<br />
SSF1-14<br />
SSF1-15<br />
SSF 1-17 (inactive)<br />
SSF1-18<br />
SSF1-19<br />
SSF1-20<br />
SSF1-21<br />
SSF1-22<br />
SSF1-23<br />
<strong>San</strong> Bruno No.15<br />
<strong>San</strong> Bruno No.16<br />
<strong>San</strong> Bruno No.17<br />
<strong>San</strong> Bruno No.18<br />
11 Irrigation pumping except changes<br />
noted below from Ref No. 12<br />
through 17.<br />
12 Golden Gate Park (GGP) irrigation<br />
wells - Elk Glen, South Windmill,<br />
and North Lake<br />
<strong>San</strong> Bruno No.20<br />
SMB was revised and irrigation pumping rates updated as necessary based on the results of the SMB, except for specific<br />
values noted in Ref No. 12 through 17 below.<br />
Modified irrigation pumping, based on 2008 metered data, provided by SFPUC (personal comm. between Jeff Gilman and<br />
Sevim Onsoy, 2011). Total pumping of 1.14 mgd (or 1,279 afy).<br />
- Elk Glen: 0.081 mgd (91 afy)<br />
- South Windmill: 0.498 mgd (558 afy)<br />
- North Lake: 0.563 mgd (631 afy)<br />
13 California Golf No. 02 Revised irrigation pumping from 198 afy to 215 afy (from 0.18 mgd to 0.19 mgd), based on pumping rates provided verbally<br />
by the California Golf Club (personal comm. between Rick Kavakoff and Pete Leffler,2009).<br />
14 Edgewood Development Center Revised irrigation pumping from 8 afy to 10 afy (from 0.007 mgd to 0.009 mgd), based on pumping rates provided by SFPUC<br />
(personal comm. between Jeff Gilman and Sevim Onsoy, 2009).<br />
15 Zoo. No.5 Revised from 447 to 360 afy (from 0.399 mgd to 0.321 mgd), based on average of 2005 - 2009, based on inputs provided by<br />
SFPUC (personal comm. between Jeff Gilman and Sevim Onsoy, 2011).<br />
16 Stern Grove Well Reduced pumping from 47 afy to 4.8 afy (from 0.042 mgd to 0.0043 mgd) for this well to account for the new information<br />
available about the use of this well as a supplemental water source for Pine Lake, based on inputs provided by SFPUC<br />
(personal comm. between Jeff Gilman and Sevim Onsoy, 2010).<br />
17 Holy Cross Irrigation pumping rates are based on the results of the revised SMB. The resulting annual average pumping is 0.19 mgd (212<br />
afy).<br />
Key:<br />
afy - acre-feet per year<br />
SMB - Soil Moisture Budget<br />
GGP - Golden Gate Park<br />
GSR - Regional Groundwater Storage and Recovery<br />
mgd - million gallons per day<br />
SFGW - <strong>San</strong> <strong>Francisco</strong> Groundwater Supply<br />
6.9 mgd total pumping - the amount of pumping determined to<br />
result in no appreciable storage change in the South Westside<br />
Basin (HydroFocus, 2011).<br />
- Daly City: 3.43 mgd<br />
- <strong>San</strong> Bruno: 2.10 mgd<br />
- Cal Water: 1 37 mgd<br />
Daly City Jefferson<br />
Daly City Vale<br />
Daly City Westlake<br />
Daly City Junipero Serra<br />
Daly City No.4<br />
SSF1-15<br />
SSF1-19<br />
SSF1-20<br />
SSF1-21<br />
SSF1-22<br />
SSF1-23<br />
<strong>San</strong> Bruno No.15<br />
<strong>San</strong> Bruno No.16<br />
<strong>San</strong> Bruno No.17<br />
<strong>San</strong> Bruno No.18<br />
<strong>San</strong> Bruno No.20<br />
Same as Scenario 1<br />
Same as Scenario 1 - 6.84 mgd total pumping<br />
Daly City Jefferson<br />
Daly City Vale<br />
Daly City Westlake<br />
Daly City Junipero Serra<br />
Daly City No.4<br />
SSF1-14<br />
SSF1-15<br />
SSF 1-17 (inactive)<br />
SSF1-18<br />
SSF1-19<br />
SSF1-20<br />
SSF1-21<br />
SSF1-22<br />
SSF1-23<br />
<strong>San</strong> Bruno No.15<br />
<strong>San</strong> Bruno No.16<br />
<strong>San</strong> Bruno No.17<br />
<strong>San</strong> Bruno No.18<br />
<strong>San</strong> Bruno No.20<br />
Same as Scenario 1, except changes noted below (see the GGP<br />
irrigation [Ref. No. 12] and Stern Grove well pumping [Ref. No. 16]).<br />
Same as Scenario 1 Scenario 3a assumes same pumping assumptions as Scenario 1;<br />
Scenario 3b assumes no irrigation pumping from the three GGP<br />
wells.<br />
Same as Scenario 2 - 6.9 mgd total pumping<br />
Daly City Jefferson<br />
Daly City Vale<br />
Daly City Westlake<br />
Daly City Junipero Serra<br />
Daly City No.4 Replacement<br />
Daly City A Street Replacement<br />
SSF1-20<br />
SSF1-21<br />
SSF1-22<br />
SSF1-23<br />
SSF1-24<br />
SSF1-25<br />
Same as Scenario 1 Same as Scenario 1 Same as Scenario 1<br />
Same as Scenario 1 Same as Scenario 1 Same as Scenario 1<br />
Same as Scenario 1 Same as Scenario 1 Same as Scenario 1<br />
Same as Scenario 1 Pumping reduced from 47 afy to 13.6 afy (from 0.042 mgd to 0.012<br />
mgd) for Scenario 3a, which is 8.8 acre‐feet more than under<br />
Scenario 1. Similarly, pumping reduced from 47 afy to 14.8 afy (from<br />
0.042 mgd to 0.013 mgd) for Scenario 3b, which is 10<br />
acre‐feet more than under Scenario 1. These pumping values are<br />
based on the supplemental water needed to maintain the water level<br />
in Pine Lake at 31.5 feet (City Datum), as discussed in the CDM<br />
report (January, 2011).<br />
<strong>San</strong> Bruno No.15<br />
<strong>San</strong> Bruno No.16<br />
<strong>San</strong> Bruno No.17<br />
<strong>San</strong> Bruno No.18<br />
<strong>San</strong> Bruno No.20<br />
Same as Scenario 1, except changes noted below (see the GGP<br />
irrigation [Ref. No. 12] and Holy Cross irrigation [Ref. No. 17]).<br />
Assumes no irrigation pumping from the three GGP wells.<br />
Same as Scenario 3b<br />
Same as Scenario 1 Same as Scenario 1 Additional pumping of 45 afy (0.04 mgd) estimated based on the<br />
future projected buildout (personal comm. between Roger Appleby<br />
and Pete Leffler, 2010).<br />
Task 10.1 - Technical Memorandum, <strong>San</strong> <strong>Francisco</strong> Public Utilities Commission<br />
G:\ISG-Group\Admin\Job\08\0864001_SFPUC_EIR Support\09-Reports\Tech Memos\TMs\TM_10.1\Tables\TM 10.1 Tables 20120408.xlsx Page 1 of 12
Kennedy/Jenks Consultants<br />
Table 10.1-2: Summary of Model Scenario Pumping Assumptions<br />
Scenario 1 Scenario 2 Scenario 3a Scenario 3b Scenario 4<br />
Model Scenarios<br />
Existing<br />
Conditions GSR SFGW SFGW Cumulative<br />
Establish Initial Conditions<br />
Hydrologic<br />
Sequence<br />
Hydrologic<br />
Sequence<br />
Hydrologic<br />
Sequence<br />
Hydrologic<br />
Sequence<br />
Hydrologic<br />
Sequence<br />
June 2009 Condition <br />
Model Scenario Simulation Period<br />
47.25 years (including Design Drought)<br />
Hydrologic Sequence:<br />
July 1996 to September 2003 -><br />
October 1958 to November 1992 -><br />
December 1975 to June 1978 -><br />
July 2003 - September 2006 <br />
Pumping Assumptions for Municipal Use<br />
PA Municipal Wells (mgd)<br />
"Take" Periods 6.84 6.90 6.84 6.84 6.90<br />
"Put" Periods 6.84 1.38 6.84 6.84 1.38<br />
"Hold" Periods 6.84 6.90 6.84 6.84 6.90<br />
GSR Project Proposed Municipal Wells (mgd)<br />
"Take" Periods 0.0 7.23 0.0 0.0 7.23<br />
"Put" Periods 0.0 0.04 0.0 0.0 0.04<br />
"Hold" Periods 0.0 0.04 0.0 0.0 0.04<br />
SFGW Project Proposed Municipal Wells (mgd)<br />
Year-Round Pumping 0.0 0.0 3.0 4.0 4.0<br />
Total Municipal Pumping (PA + GSR + SFGW)<br />
"Take" Periods<br />
"Put" Periods<br />
"Hold" Periods<br />
Irrigation and Other Non-Potable Pumping Assumptions (mgd) (1)<br />
Golden<br />
Gate Park<br />
Golf<br />
Courses<br />
Cemeteries<br />
Other<br />
6.84 14.13 9.84 10.84 18.13<br />
6.84 1.42 9.84 10.84 5.42<br />
6.84 6.94 9.84 10.84 10.94<br />
Elk Glen (GGP) 0.081 0.081 0.081 0.000 0.000<br />
South Windmill (GGP) 0.498 0.498 0.498 0.000 0.000<br />
North Lake (GGP) 0.563 0.563 0.563 0.000 0.000<br />
Sub-Total 1.142 1.142 1.142 0.000 0.000<br />
Burlingame Golf Club 0.150 0.150 0.150 0.150 0.150<br />
California Golf No. 02 0.192 0.192 0.192 0.192 0.192<br />
Green Hills No. 05 0.099 0.099 0.099 0.099 0.099<br />
Lake Merced Golf No. 01 0.004 0.004 0.004 0.004 0.004<br />
Lake Merced Golf No. 02 0.004 0.004 0.004 0.004 0.004<br />
Lake Merced Golf No. 03 0.010 0.010 0.010 0.010 0.010<br />
Olympic Club No. 09 (2) 0.002 0.002 0.002 0.002 0.002<br />
SF Golf West 0.035 0.035 0.035 0.035 0.035<br />
Sub-Total 0.495 0.495 0.495 0.495 0.495<br />
Cypress Lawn No. 02 0.020020 0.020020 0.020020 0.020020 0.020020<br />
Cypress Lawn No. 03 0.144 0.144 0.144 0.144 0.144<br />
Eternal Home 0.013 0.013 0.013 0.013 0.013<br />
Hills of Eternity No. 02 0.020 0.020 0.020 0.020 0.020<br />
Holy Cross No. 03 (3) 0.190 0.190 0.190 0.190 0.230<br />
Home of Peace No. 02 0.039 0.039 0.039 0.039 0.039<br />
Italian Cemetery 0.033 0.033 0.033 0.033 0.033<br />
Olivet 0.098 0.098 0.098 0.098 0.098<br />
Woodlawn No. 02 0.085 0.085 0.085 0.085 0.085<br />
Sub-Total 0.641 0.641 0.641 0.641 0.681<br />
Hillsborough Residents No. 1-12 0.291 0.291 0.291 0.291 0.291<br />
Edgewood Development Ctr. 0.009 0.009 0.009 0.009 0.009<br />
Zoo No.05 0.321 0.321 0.321 0.321 0.321<br />
Stern Grove 0.004 0.004 0.012 0.013 0.013<br />
Sub-Total 0.626 0.626 0.634 0.635 0.635<br />
Total Irrigation and Other Non-Potable Pumping 2.90 2.90 2.91 1.77 1.81<br />
Key:<br />
afy - acre-feet per year<br />
mgd - million gallons per day<br />
PA - Partner Agencies<br />
GGP - Golden Gate Park<br />
GSR - Regional Groundwater Storage and Recovery<br />
SFGW - <strong>San</strong> <strong>Francisco</strong> Groundwater Supply<br />
SFPUC - <strong>San</strong> <strong>Francisco</strong> Public Utilities Commission<br />
Notes:<br />
(1) Pumping wells that are listed identify the wells in the model scenarios whose pumping assumptions were modified compared to the 2008 No-Project Scenario by HydroFocus<br />
(May, 2011, ver. 3.1), as a result of revised Soil Moisture Budget (SMB). Pumping rates for the three wells in the GGP, California Golf No. 02, Edgewood Development Center,<br />
Zoo No. 05, and Stern Grove wells were further modified compared to the results of revised SMB.<br />
(2) Olympic Club No. 09 values include pumping for both Olympic Golf Club wells.<br />
(3) Holy Cross No. 3 well irrigation pumping for Scenarios 1, 2, 3a, and 3b is based on the results of revised SMB. Based on the projected future build-out at the Holy Cross<br />
cemetery, an additional pumping of 0.04 mgd (45 afy) was estimated to occur under Scenario 4 (Cumulative).<br />
Task 10.1 - Technical Memorandum, <strong>San</strong> <strong>Francisco</strong> Public Utilities Commission<br />
G:\ISG-Group\Admin\Job\08\0864001_SFPUC_EIR Support\09-Reports\Tech Memos\TMs\TM_10.1\Tables\TM 10.1 Tables 20120408.xlsx Page 2 of 12<br />
D.5-78
Kennedy/Jenks Consultants<br />
Table 10.1-3: Regional Groundwater Storage and Recovery Project<br />
Proposed Municipal Wells<br />
Well No. Well Site NOP Well Site (1) Location<br />
Estimated Pumping<br />
Capacity (gpm) (2)<br />
1 CUP-3A 1 Daly City 400<br />
2 CUP-5 3 Daly City 300<br />
3 CUP-6 2 Daly City 300<br />
4 CUP-7 4 Daly City 300<br />
5 CUP-10A 5 Daly City 400<br />
6 CUP-11A 6 Daly City 400<br />
7 CUP-18 7 Colma 400<br />
8 CUP-19 8 Colma 400<br />
9 CUP-22A 10 South <strong>San</strong> <strong>Francisco</strong> 330<br />
10 CUP-23 9 South <strong>San</strong> <strong>Francisco</strong> 330<br />
11 CUP-31 11 South <strong>San</strong> <strong>Francisco</strong> 220<br />
12 CUP-36-1 12 South <strong>San</strong> <strong>Francisco</strong> 220<br />
13 CUP-41-4 13 South <strong>San</strong> <strong>Francisco</strong> 220<br />
14 CUP-44-1 15 <strong>San</strong> Bruno 330<br />
15 CUP-44-2 14 <strong>San</strong> Bruno 330<br />
16 CUP-M-1 16 Millbrae 160<br />
Key:<br />
gpm - gallons per minute<br />
NOP - Notice of Preparation<br />
Notes:<br />
(1) NOP of the EIR for the Regional Groundwater Storage and Recovery Project dated June 24, 2009.<br />
(2) Estimated pumping capacities based on the Final Conceptual Engineering Report prepared for the Regional Groundwater Storage<br />
and Recovery Project (MWH, 2008).<br />
Task 10.1 - Technical Memorandum, <strong>San</strong> <strong>Francisco</strong> Public Utilities Commission<br />
G:\ISG-Group\Admin\Job\08\0864001_SFPUC_EIR Support\09-Reports\Tech Memos\TMs\TM_10.1\Tables\TM 10.1 Tables 20120408.xlsx Page 3 of 12<br />
D.5-79
Kennedy/Jenks Consultants<br />
Table 10.1-4: Partner Agency Municipal Pumping Wells<br />
Location Well Name Note<br />
Daly City Municipal Wells<br />
Daly City Daly City Jefferson Existing<br />
Daly City Daly City Vale Existing<br />
Daly City Daly City Westlake Existing<br />
Daly City Daly City Junipero Serra Existing<br />
Daly City Daly City No. 4 Existing<br />
Daly City Daly City No. 4 Replacement Proposed Replacement<br />
Daly City Daly City A Street Replacement Proposed Replacement<br />
Cal Water Municipal Wells<br />
South <strong>San</strong> <strong>Francisco</strong> SSF1-14 Existing<br />
South <strong>San</strong> <strong>Francisco</strong> SSF1-15 Existing<br />
South <strong>San</strong> <strong>Francisco</strong> SSF1-17 (inactive) Existing<br />
South <strong>San</strong> <strong>Francisco</strong> SSF1-18 Existing<br />
South <strong>San</strong> <strong>Francisco</strong> SSF1-19 Existing<br />
South <strong>San</strong> <strong>Francisco</strong> SSF1-20 Existing<br />
South <strong>San</strong> <strong>Francisco</strong> SSF1-21 Existing<br />
South <strong>San</strong> <strong>Francisco</strong> SSF1-22 Proposed<br />
South <strong>San</strong> <strong>Francisco</strong> SSF1-23 Proposed<br />
South <strong>San</strong> <strong>Francisco</strong> SSF1-24 (redundant) Proposed<br />
South <strong>San</strong> <strong>Francisco</strong> SSF1-25 (redundant) Proposed<br />
<strong>San</strong> Bruno Municipal Wells<br />
<strong>San</strong> Bruno <strong>San</strong> Bruno No. 15 Existing<br />
<strong>San</strong> Bruno <strong>San</strong> Bruno No. 16 Existing<br />
<strong>San</strong> Bruno <strong>San</strong> Bruno No. 17 Existing<br />
<strong>San</strong> Bruno <strong>San</strong> Bruno No. 18 Existing<br />
<strong>San</strong> Bruno <strong>San</strong> Bruno No. 20 Existing<br />
Task 10.1 - Technical Memorandum, <strong>San</strong> <strong>Francisco</strong> Public Utilities Commission<br />
G:\ISG-Group\Admin\Job\08\0864001_SFPUC_EIR Support\09-Reports\Tech Memos\TMs\TM_10.1\Tables\TM 10.1 Tables 20120408.xlsx Page 4 of 12<br />
D.5-80
Kennedy/Jenks Consultants<br />
Table 10.1-5: SFPUC Supplemental Surface Water Deliveries<br />
Date Cal Water (af) Daly City (afy) <strong>San</strong> Bruno (af)<br />
October-2002 0.0 189.2 0.0<br />
November-2002 0.0 241.5 0.0<br />
December-2002 0.0 250.2 0.0<br />
January-2003 0.0 258.5 72.1<br />
February-2003 77.9 225.7 183.6<br />
March-2003 86.3 248.7 203.3<br />
April-2003 83.5 240.9 196.7<br />
May-2003 86.3 248.3 203.3<br />
June-2003 83.5 240.7 196.7<br />
July-2003 86.3 248.2 203.3<br />
August-2003 86.3 248.9 198.1<br />
September-2003 83.5 239.7 196.7<br />
October-2003 86.3 250.9 190.2<br />
November-2003 41.7 0.0 24.2<br />
December-2003 0.0 0.0 0.0<br />
January-2004 0.0 0.0 0.0<br />
February-2004 0.0 0.0 0.0<br />
March-2004 0.0 0.0 0.0<br />
April-2004 86.3 250.9 150.8<br />
May-2004 83.5 259.2 203.3<br />
June-2004 86.3 280.2 144.3<br />
July-2004 83.5 289.8 203.3<br />
August-2004 86.3 291.4 203.3<br />
September-2004 86.3 282.6 196.7<br />
October-2004 83.5 324.6 203.3<br />
November-2004 86.3 267.0 196.7<br />
December-2004 83.5 286.8 203.3<br />
January-2005 86.3 0.0 203.3<br />
February-2005 86.3 251.6 137.7<br />
March-2005 77.9 285.7 0.0<br />
April-2005 86.3 252.4 0.0<br />
May-2005 83.5 285.8 0.0<br />
June-2005 86.3 276.3 0.0<br />
July-2005 83.5 286.6 0.0<br />
August-2005 86.3 287.4 0.0<br />
September-2005 86.3 278.8 0.0<br />
October-2005 83.5 288.0 0.0<br />
November-2005 86.3 280.1 0.0<br />
December-2005 83.5 297.7 0.0<br />
January-2006 86.3 286.7 0.0<br />
February-2006 86.3 261.4 0.0<br />
March-2006 77.9 289.2 0.0<br />
April-2006 86.3 277.9 0.0<br />
May-2006 83.5 0.0 0.0<br />
June-2006 86.3 0.0 0.0<br />
July-2006 83.5 318.4 0.0<br />
August-2006 86.3 264.9 0.0<br />
September-2006 86.3 259.2 0.0<br />
October-2006 83.5 264.9 0.0<br />
November-2006 86.3 275.4 0.0<br />
December-2006 83.5 286.0 0.0<br />
January-2007 86.3 284.9 0.0<br />
February-2007 0.0 250.7 0.0<br />
March-2007 0.0 251.8 0.0<br />
April-2007 0.0 235.1 0.0<br />
May-2007 to Dec-2009<br />
No supplemental water deliveries<br />
Total 3,685 12,541 3,914<br />
Source: Data provided by SFPUC.<br />
Key: af - acre-feet<br />
Note: This table contains SFPUC's monthly supplemental water deliveries to Daly City, Cal Water, and <strong>San</strong> Bruno from<br />
October 2002 to December 31, 2009. The supplemental water deliveries account for the SFPUC Storage Account of<br />
20,000 acre-feet of water stored in the basin through the In-Lieu Demonstration Study.<br />
Task 10.1 - Technical Memorandum, <strong>San</strong> <strong>Francisco</strong> Public Utilities Commission<br />
G:\ISG-Group\Admin\Job\08\0864001_SFPUC_EIR Support\09-Reports\Tech Memos\TMs\TM_10.1\Tables\Table_10.1-5_SupplWaterDelivery.xlsx<br />
D.5-81<br />
Page 5 of 12
Kennedy/Jenks Consultants<br />
Table 10.1-6: <strong>San</strong> <strong>Francisco</strong> Groundwater Supply Project<br />
Proposed Municipal Wells<br />
Normal Design Average Pumping Rate Based<br />
Pumping Capacity<br />
on 4.0 mgd Total (1)<br />
Well No. Well Name<br />
gpm mgd gpm mgd<br />
1 Lake Merced Pump Station 600 (17 hour/day) 0.61 299 0.43<br />
2 South Sunset Playground 500 0.72 317 0.46<br />
3 West Sunset Playground 650 0.94 412 0.59<br />
4 GGP Central Pump Station 1,500 2.16 951 1.37<br />
5 South Windmill Replacement 1,000 1.44 451 0.65<br />
6 North Lake 500 0.72 347 0.50<br />
Total - 6.59 - 4.00<br />
Key:<br />
gpm - gallons per minute<br />
mgd - million gallons per day<br />
GGP - Golden Gate Park<br />
Notes:<br />
(1) Six SFGW Project wells included in the table would be pumping for project target pumping rate at 4.0 mgd.<br />
Task 10.1 - Technical Memorandum, <strong>San</strong> <strong>Francisco</strong> Public Utilities Commission<br />
G:\ISG-Group\Admin\Job\08\0864001_SFPUC_EIR Support\09-Reports\Tech Memos\TMs\TM_10.1\Tables\TM 10.1 Tables 20120408.xlsx Page 6 of 12<br />
D.5-82
Table 10.1-7: Proposed Pumping Rate Assumptions for Regional Groundwater Storage<br />
and Recovery Project Proposed Municipal Wells and Partner Agency Municipal Wells<br />
Kennedy/Jenks Consultants<br />
Scenario 1<br />
Scenario 3a/3b - SFGW<br />
Scenario 2<br />
GSR<br />
Scenario 4<br />
Cumulative<br />
Location Well Site/ Well Name Pumping Year Round (mgd)<br />
Pumping During<br />
"Take" Periods<br />
(mgd)<br />
Pumping During<br />
"Put" Periods<br />
(mgd)<br />
Pumping During<br />
"Hold" Periods<br />
(mgd)<br />
In-Lieu Recharge<br />
During "Put"<br />
Periods (mgd)<br />
Pumping During<br />
"Take" Periods<br />
(mgd)<br />
Pumping During<br />
"Put" Periods<br />
(mgd)<br />
Pumping During<br />
"Hold" Periods<br />
(mgd)<br />
In-Lieu Recharge<br />
During "Put"<br />
Periods (mgd)<br />
Regional Groundwater Storage and Recovery Project Proposed Municipal Wells<br />
Daly City CUP-3A - 0.57 0.003 0.003 - 0.57 0.003 0.003 -<br />
Daly City CUP-5 - 0.43 0.002 0.002 - 0.43 0.002 0.002 -<br />
Daly City CUP-6 - 0.43 0.002 0.002 - 0.43 0.002 0.002 -<br />
Daly City CUP-7 - 0.43 0.002 0.002 - 0.43 0.002 0.002 -<br />
Daly City CUP-10A - 0.57 0.003 0.003 - 0.57 0.003 0.003 -<br />
Daly City CUP-11A - 0.57 0.003 0.003 - 0.57 0.003 0.003 -<br />
Colma CUP-18 - 0.57 0.003 0.003 - 0.57 0.003 0.003 -<br />
Colma CUP-19 - 0.57 0.003 0.003 - 0.57 0.003 0.003 -<br />
South <strong>San</strong> <strong>Francisco</strong> CUP-22A - 0.47 0.003 0.003 - 0.47 0.003 0.003 -<br />
South <strong>San</strong> <strong>Francisco</strong> CUP-23 - 0.47 0.003 0.003 - 0.47 0.003 0.003 -<br />
South <strong>San</strong> <strong>Francisco</strong> CUP-31 - 0.32 0.002 0.002 - 0.32 0.002 0.002 -<br />
South <strong>San</strong> <strong>Francisco</strong> CUP-36-1 - 0.32 0.002 0.002 - 0.32 0.002 0.002 -<br />
South <strong>San</strong> <strong>Francisco</strong> CUP-41-4 - 0.32 0.002 0.002 - 0.32 0.002 0.002 -<br />
<strong>San</strong> Bruno CUP-44-1 - 0.47 0.003 0.003 - 0.47 0.003 0.003 -<br />
<strong>San</strong> Bruno CUP-44-2 - 0.47 0.003 0.003 - 0.47 0.003 0.003 -<br />
Millbrae CUP-M-1 - 0.23 0.001 0.001 - 0.23 0.001 0.001 -<br />
Sub-Total 7.23 0.04 0.04 - 7.23 0.04 0.04 -<br />
Partner Agency Municipal Wells<br />
D.5-83<br />
Daly City Municipal Wells<br />
Daly City Daly City Jefferson 0.72 0.65 0.13 0.65 0.52 0.57 0.11 0.57 0.46<br />
Daly City Daly City Vale 0.98 0.89 0.18 0.89 0.71 0.57 0.11 0.57 0.46<br />
Daly City Daly City Westlake 0.76 0.69 0.14 0.69 0.55 0.57 0.11 0.57 0.46<br />
Daly City Daly City Junipero Serra 0.95 0.86 0.17 0.86 0.69 0.57 0.11 0.57 0.46<br />
Daly City Daly City No. 4 0.38 0.34 0.07 0.34 0.27 - - - -<br />
Daly City Daly City No.4 Replacement - - - - - 0.57 0.11 0.57 0.46<br />
Daly City Daly City A Street Replacement - - - - - 0.57 0.1 0.6 0.5<br />
Sub-Total 3.78 3.43 0.69 3.43 2.74 3.43 0.69 3.43 2.74<br />
Cal Water Municipal Wells<br />
South <strong>San</strong> <strong>Francisco</strong> SSF1-14 0.13 - - - - - - - -<br />
South <strong>San</strong> <strong>Francisco</strong> SSF1-15 0.09 0.0 0.0 0.0 0.0 - - - -<br />
South <strong>San</strong> <strong>Francisco</strong> SSF1-17 (inactive) 0.00 - - - - - - - -<br />
South <strong>San</strong> <strong>Francisco</strong> SSF1-18 0.23 - - - - - - - -<br />
South <strong>San</strong> <strong>Francisco</strong> SSF1-19 0.23 0.17 0.03 0.17 0.14 - - - -<br />
South <strong>San</strong> <strong>Francisco</strong> SSF1-20 0.22 0.16 0.03 0.16 0.13 0.26 0.05 0.26 0.21<br />
South <strong>San</strong> <strong>Francisco</strong> SSF1-21 0.28 0.22 0.04 0.22 0.18 0.29 0.06 0.29 0.23<br />
South <strong>San</strong> <strong>Francisco</strong> SSF1-22 0.00 0.48 0.10 0.48 0.38 0.48 0.10 0.48 0.38<br />
South <strong>San</strong> <strong>Francisco</strong> SSF1- 23 0.00 0.34 0.07 0.34 0.27 0.34 0.07 0.34 0.27<br />
South <strong>San</strong> <strong>Francisco</strong> SSF1-24 (redundant) - - - - - Per Cal Water letter to SFPUC dated Jan 19, 2011, this well is shown redundant<br />
South <strong>San</strong> <strong>Francisco</strong> SSF1-25 (redundant) - - - - - Per Cal Water letter to SFPUC dated Jan 19, 2011, this well is shown redundant<br />
Sub-Total 1.18 1.37 0.27 1.37 1.10 1.37 0.27 1.37 1.10<br />
<strong>San</strong> Bruno Municipal Wells<br />
<strong>San</strong> Bruno <strong>San</strong> Bruno No. 15 0.23 0.25 0.05 0.25 0.20 0.25 0.05 0.25 0.20<br />
<strong>San</strong> Bruno <strong>San</strong> Bruno No. 16 0.49 0.55 0.11 0.55 0.44 0.55 0.11 0.55 0.44<br />
<strong>San</strong> Bruno <strong>San</strong> Bruno No. 17 0.24 0.27 0.05 0.27 0.22 0.27 0.05 0.27 0.22<br />
<strong>San</strong> Bruno <strong>San</strong> Bruno No. 18 0.26 0.29 0.06 0.29 0.24 0.29 0.06 0.29 0.24<br />
<strong>San</strong> Bruno <strong>San</strong> Bruno No. 20 0.66 0.73 0.15 0.73 0.59 0.73 0.15 0.73 0.59<br />
Sub-Total 1.88 2.10 0.42 2.10 1.68 2.10 0.42 2.10 1.68<br />
Total Partner Agency Pumping 6.84 6.90 1.38 6.90 5.52 6.90 1.38 6.90 5.52<br />
Key:<br />
GSR - Regional Groundwater Storage and Recovery<br />
mgd - million gallons per day<br />
Shaded cells identify municipal pumping wells that are not applicable and not considered for a given model scenario.<br />
Task 10.1 - Technical Memorandum, <strong>San</strong> <strong>Francisco</strong> Public Utilities Commission<br />
G:\ISG-Group\Admin\Job\08\0864001_SFPUC_EIR Support\09-Reports\Tech Memos\TMs\TM_10.1\Tables\TM 10.1 Tables 20120408.xlsx Page 7 of 12
Kennedy/Jenks Consultants<br />
Table 10.1-8: Depth Distribution of Pumping by Model Layers<br />
Location<br />
Well Site/Well Name<br />
Depth Distribution of Pumping<br />
(Fraction in Model Layer 1 - 5)<br />
Layer 1 Layer 2 Layer 3 Layer 4 Layer 5<br />
Regional Groundwater Storage and Recovery Project Proposed Municipal Wells<br />
Daly City CUP-3A 0.00 0.00 1.00 0.00 0.00 1.00<br />
Daly City CUP-5 0.00 0.00 0.10 0.60 0.30 1.00<br />
Daly City CUP-6 0.00 0.00 0.10 0.70 0.20 1.00<br />
Daly City CUP-7 0.00 0.00 0.15 0.55 0.30 1.00<br />
Daly City CUP-10A 0.00 0.00 0.50 0.50 0.00 1.00<br />
Daly City CUP-11A 0.00 0.00 0.40 0.50 0.10 1.00<br />
Colma CUP-18 0.00 0.00 0.35 0.55 0.10 1.00<br />
Colma CUP-19 0.00 0.00 0.20 0.60 0.20 1.00<br />
South <strong>San</strong> <strong>Francisco</strong> CUP-22A 0.00 0.00 0.20 0.80 0.00 1.00<br />
South <strong>San</strong> <strong>Francisco</strong> CUP-23 0.00 0.00 0.20 0.80 0.00 1.00<br />
South <strong>San</strong> <strong>Francisco</strong> CUP-31 0.00 0.00 0.00 0.70 0.30 1.00<br />
South <strong>San</strong> <strong>Francisco</strong> CUP-36-1 0.00 0.00 0.00 0.75 0.25 1.00<br />
South <strong>San</strong> <strong>Francisco</strong> CUP-41-4 0.00 0.00 0.00 0.80 0.20 1.00<br />
<strong>San</strong> Bruno CUP-44-1 0.00 0.00 0.00 0.80 0.20 1.00<br />
<strong>San</strong> Bruno CUP-44-2 0.00 0.00 0.05 0.75 0.20 1.00<br />
Millbrae CUP-M-1 0.00 0.00 0.50 0.50 0.00 1.00<br />
Daly City Municipal Wells<br />
Daly City Daly City Jefferson 0.00 0.00 0.12 0.73 0.15 1.00<br />
Daly City Daly City Vale 0.00 0.00 0.15 0.70 0.15 1.00<br />
Daly City Daly City Westlake 0.00 0.00 0.15 0.56 0.29 1.00<br />
Daly City Daly City Junipero Serra 0.00 0.43 0.57 0.00 0.00 1.00<br />
Daly City Daly City No. 4 0.00 0.50 0.32 0.18 0.00 1.00<br />
Daly City Daly City No. 4 Replacement 0.00 0.50 0.32 0.18 0.00 1.00<br />
Daly City Daly City A Street Replacement 0.00 0.06 0.29 0.65 0.00 1.00<br />
Cal Water Municipal Wells<br />
South <strong>San</strong> <strong>Francisco</strong> SSF1-19 0.00 0.19 0.12 0.50 0.19 1.00<br />
South <strong>San</strong> <strong>Francisco</strong> SSF1-20 0.00 0.00 0.00 0.48 0.52 1.00<br />
South <strong>San</strong> <strong>Francisco</strong> SSF1-21 0.00 0.00 0.00 0.50 0.50 1.00<br />
South <strong>San</strong> <strong>Francisco</strong> SSF1-22 0.00 0.00 0.00 0.50 0.50 1.00<br />
South <strong>San</strong> <strong>Francisco</strong> SSF1-23 0.00 0.00 0.00 0.50 0.50 1.00<br />
South <strong>San</strong> <strong>Francisco</strong> SSF1-24 0.00 0.00 0.00 0.50 0.50 1.00<br />
South <strong>San</strong> <strong>Francisco</strong> SSF1-25 0.00 0.00 0.00 0.50 0.50 1.00<br />
<strong>San</strong> Bruno Municipal Wells<br />
<strong>San</strong> Bruno <strong>San</strong> Bruno No. 15 0.00 0.16 0.16 0.54 0.14 1.00<br />
<strong>San</strong> Bruno <strong>San</strong> Bruno No. 16 0.00 0.00 0.00 0.80 0.20 1.00<br />
<strong>San</strong> Bruno <strong>San</strong> Bruno No. 17 0.00 0.00 0.00 0.72 0.28 1.00<br />
<strong>San</strong> Bruno <strong>San</strong> Bruno No. 18 0.00 0.11 0.44 0.34 0.11 1.00<br />
<strong>San</strong> Bruno <strong>San</strong> Bruno No. 20 0.00 0.00 0.00 0.55 0.45 1.00<br />
<strong>San</strong> <strong>Francisco</strong> Groundwater Supply Project Proposed Municipal Wells<br />
<strong>San</strong> <strong>Francisco</strong> Lake Merced Pump Station 0.00 0.00 0.00 1.00 0.00 1.00<br />
<strong>San</strong> <strong>Francisco</strong> South Sunset Playground 0.21 0.38 0.16 0.26 0.00 1.00<br />
<strong>San</strong> <strong>Francisco</strong> West Sunset Playground 0.60 0.34 0.06 0.00 0.00 1.00<br />
<strong>San</strong> <strong>Francisco</strong> GGP Central Pump Station (1) 1.00 0.00 0.00 0.00 0.00 1.00<br />
<strong>San</strong> <strong>Francisco</strong> South Windmill Replacement 0.45 0.54 0.01 0.00 0.00 1.00<br />
<strong>San</strong> <strong>Francisco</strong> North Lake 0.44 0.17 0.39 0.00 0.00 1.00<br />
Key:<br />
GGP - Golden Gate Park<br />
Note:<br />
(1) All pumping assigned to Layer 1 because the HydroFocus Model (May 2011, ver. 3.1) assumes only one model layer in this vicinity.<br />
Total<br />
Task 10.1 - Technical Memorandum, <strong>San</strong> <strong>Francisco</strong> Public Utilities Commission<br />
G:\ISG-Group\Admin\Job\08\0864001_SFPUC_EIR Support\09-Reports\Tech Memos\TMs\TM_10.1\Tables\TM 10.1 Tables 20120408.xlsx Page 8 of 12<br />
D.5-84
Kennedy/Jenks Consultants<br />
Table 10.1-9: Put/Take/Hold Sequence for Model Scenarios<br />
Scenario Year No. of Months Oct Nov Dec Jan Feb Mar Apr May Jun Jul Aug Sep<br />
0 3 put put put<br />
1 15 put put put put put put put put put put put put<br />
2 27 put put put put put put put put put put put put<br />
3 39 put put put put put put put put put put put put<br />
4 51 put put put put put put put put put put put put<br />
5 63 put put put put put put put put put put put put<br />
6 75 put put put put put put put put put put put put<br />
7 87 put put put put hold hold hold hold hold hold hold hold<br />
8 99 hold hold hold hold hold hold hold hold hold hold hold hold<br />
9 111 hold hold hold hold hold hold hold hold hold take take take<br />
10 123 take take take take take take take take take take take take<br />
11 135 take take take take take take take take take put put put<br />
12 147 put put put put put put put put put put put put<br />
13 159 put put put put put put put put put put put put<br />
14 171 put put put put put hold hold hold hold hold hold hold<br />
15 183 hold hold hold hold hold hold hold hold hold hold hold hold<br />
16 195 hold hold hold hold hold hold hold hold hold hold hold hold<br />
17 207 hold hold hold hold hold hold hold hold hold hold hold hold<br />
18 219 hold hold hold hold hold hold hold hold hold hold hold hold<br />
19 231 hold hold hold hold hold hold hold hold hold hold hold hold<br />
20 243 hold hold hold hold hold hold hold hold hold hold hold hold<br />
21 255 hold hold hold hold hold hold hold hold hold hold hold hold<br />
22 267 hold hold hold hold hold hold hold hold hold hold hold hold<br />
23 279 hold hold hold hold hold hold hold hold hold hold hold hold<br />
24 291 hold hold hold hold hold hold hold hold hold hold hold hold<br />
25 303 hold hold hold hold hold hold hold hold hold take take take<br />
26 315 take take take take take take take take take take take take<br />
27 327 take take take take take take take take take put put put<br />
28 339 put put put put put put put put put put put put<br />
29 351 put put put put put put put put put put put put<br />
30 363 put put put put put hold hold hold hold hold hold hold<br />
31 375 hold hold hold hold hold hold hold hold hold hold hold hold<br />
32 387 hold hold hold hold hold hold hold hold hold hold hold hold<br />
33 399 hold hold hold hold hold hold hold hold hold hold hold hold<br />
34 411 hold hold hold hold hold hold hold hold hold hold hold hold<br />
35 423 hold hold hold hold hold hold hold hold hold hold hold hold<br />
36 435 hold hold hold hold hold hold hold hold hold take take take<br />
37 447 take take take take take take take take take take take take<br />
38 459 take take take take take take take take take take take take<br />
39 471 take take take take take take take take take take take take<br />
40 483 take take take take take take take take take take take take<br />
41 495 take take take take take take take take take take take take<br />
42 507 take take take take take take take take take take take take<br />
43 519 take take take take take take take take take take take take<br />
44 531 take take take hold hold hold hold hold hold put put put<br />
45 543 put put put put put put put put put put put put<br />
46 555 put put put put put put put put put put put put<br />
47 567 put put put put put put put put put put put put<br />
Task 10.1 - Technical Memorandum, <strong>San</strong> <strong>Francisco</strong> Public Utilities Commission<br />
G:\ISG-Group\Admin\Job\08\0864001_SFPUC_EIR Support\09-Reports\Tech Memos\TMs\TM_10.1\Tables\TM 10.1 Tables 20120408.xlsx Page 9 of 12<br />
D.5-85
Kennedy/Jenks Consultants<br />
Table 10.1-10: Pumping Rate Assumptions for <strong>San</strong> <strong>Francisco</strong> Groundwater<br />
Supply Project Proposed Municipal Wells<br />
Well No.<br />
Well Name<br />
Pumping Rates<br />
mgd<br />
Scenario 3a<br />
1 Lake Merced Pump Station 0.43 482 0.14<br />
2 South Sunset Playground 0.48 544 0.16<br />
3 West Sunset Playground 0.63 707 0.21<br />
4 GGP Central Pump Station 1.45 1,631 0.48<br />
5 South Windmill Replacement (3) - - -<br />
6 North Lake (3) - - -<br />
Total 3.00 3,363 1.00<br />
Scenario 3b (1)<br />
1 Lake Merced Pump Station 0.43 482 0.11<br />
2 South Sunset Playground 0.46 512 0.11<br />
3 West Sunset Playground 0.59 665 0.15<br />
4 GGP Central Pump Station 1.37 1,536 0.34<br />
5 South Windmill Replacement 0.65 729 0.16<br />
6 North Lake 0.50 561 0.13<br />
Total 4.00 4,484 1.00<br />
(1), (2)<br />
afy<br />
Pumping Proportion<br />
Relative to Total<br />
Key:<br />
afy - acre-feet per year<br />
mgd - million gallons per day<br />
GGP - Golden Gate Park<br />
Notes:<br />
(1) For Scenarios 3a and 3b, the pumping rate for each of the SFGW Project wells is provided by SFPUC.<br />
(2) Four of the SFGW Project wells would be pumping for municipal purposes for the SFGW Project under Scenario 3a.<br />
(3) For Scenario 3a, South Windmill Replacement and North Lake wells would remain as irrigation wells and not be used for municipal pumping<br />
as part of the SFGW Project. Irrigation pumping rates by South Windmill Replacement and North Lake wells would be the same as in<br />
Scenario 1, and they are accounted for in the irrigation pumping assumptions presented in Table 10.1-2.<br />
Task 10.1 - Technical Memorandum, <strong>San</strong> <strong>Francisco</strong> Public Utilities Commission<br />
G:\ISG-Group\Admin\Job\08\0864001_SFPUC_EIR Support\09-Reports\Tech Memos\TMs\TM_10.1\Tables\TM 10.1 Tables 20120408.xlsx Page 10 of 12<br />
D.5-86
Kennedy/Jenks Consultants<br />
Table 10.1-11: Monthly Pumping Rate Assumptions for <strong>San</strong> <strong>Francisco</strong> Groundwater Supply Project<br />
Proposed Municipal Wells<br />
Scenario 3a<br />
D.5-87<br />
Lake Merced<br />
Pump Station<br />
(af)<br />
South Sunset<br />
Playground<br />
(af)<br />
West Sunset<br />
Playground<br />
(af)<br />
GGP Central<br />
Pump Station<br />
(af)<br />
South Windmill<br />
Replacement<br />
(af)<br />
Total<br />
Pumping<br />
(af)<br />
North Lake<br />
Month<br />
(af)<br />
January 457 515 670 1,545 0 0 3,186<br />
February 485 547 711 1,642 0 0 3,386<br />
March 451 509 662 1,527 0 0 3,150<br />
April 464 523 680 1,570 0 0 3,237<br />
May 500 564 733 1,691 0 0 3,486<br />
June 523 590 767 1,770 0 0 3,651<br />
July 541 610 793 1,830 0 0 3,774<br />
August 524 590 768 1,771 0 0 3,653<br />
September 500 564 734 1,693 0 0 3,491<br />
October 482 543 707 1,630 0 0 3,362<br />
November 433 488 635 1,464 0 0 3,020<br />
December 424 478 622 1,435 0 0 2,959<br />
Annual Average (af) 482 544 707 1,631 0 0 3,363<br />
Annual Average (mgd) 0.43 0.48 0.63 1.45 0.00 0.00 3.0<br />
Scenario 3b<br />
Lake Merced<br />
Pump Station<br />
(af)<br />
South Sunset<br />
Playground<br />
(af)<br />
West Sunset<br />
Playground<br />
(af)<br />
GGP Central<br />
Pump Station<br />
(af)<br />
South Windmill<br />
Replacement<br />
(af)<br />
North Lake<br />
(af)<br />
Total<br />
Pumping<br />
(af)<br />
January 457 485 630 1,455 690 531 4,249<br />
February 485 515 670 1,546 734 564 4,515<br />
March 451 479 623 1,438 682 525 4,200<br />
April 464 493 641 1,478 701 540 4,316<br />
May 500 531 690 1,592 755 581 4,648<br />
June 523 556 722 1,667 791 608 4,868<br />
July 541 574 747 1,723 818 629 5,032<br />
August 524 556 723 1,668 792 609 4,871<br />
September 500 531 691 1,594 756 582 4,655<br />
October 482 512 665 1,535 728 560 4,483<br />
November 433 460 597 1,379 654 503 4,026<br />
December 424 450 586 1,351 641 493 3,946<br />
Annual Average (af) 482 512 665 1,536 729 561 4,484<br />
Annual Average (mgd) 0.4 0.5 0.6 1.4 0.7 0.5 4.0<br />
Key:<br />
af - acre-feet<br />
GGP - Golden Gate Park<br />
mgd - million gallons per day<br />
Task 10.1 - Technical Memorandum, <strong>San</strong> <strong>Francisco</strong> Public Utilities Commission<br />
G:\ISG-Group\Admin\Job\08\0864001_SFPUC_EIR Support\09-Reports\Tech Memos\TMs\TM_10.1\Tables\Table_10.1-11_SFGW Pumping.xlsx Page 11 of 12
Kennedy/Jenks Consultants<br />
Table 10.1-12: Summary of Westside Basin Annual Water Balance<br />
D.5-88<br />
Scenarios<br />
Inflow from<br />
Bay & Ocean<br />
(afy) (1)<br />
Rain +<br />
Seepage<br />
Lakes (afy) (1) (afy) (1)<br />
from GGP Irrigation<br />
Seepage<br />
from Lake<br />
Merced<br />
(afy) (1)<br />
Wells -<br />
Outflow to<br />
(afy) (2) (afy) (2)<br />
Bay & Ocean Pumping<br />
Seepage to<br />
Lake Merced<br />
(afy) (2)<br />
Drains<br />
(afy) (2)<br />
Change in<br />
Groundwater<br />
Storage<br />
(afy) (3)<br />
Average 12 551 14,034 846 -4,172 -10,814 -960 -94 -597<br />
Scenario 1 Maximum 31 558 24,922 1,171 -3,057 -10,230 -634 -68 9,340<br />
Minimum 5 545 7,618 456 -5,439 -11,398 -1,383 -129 -6,468<br />
Average 11 551 14,034 640 -4,418 -10,926 -784 -122 -1,013<br />
Scenario 2 Maximum 65 558 24,922 1,498 -2,948 -4,227 -522 -71 14,744<br />
Minimum 4 545 7,618 351 -5,526 -19,363 -1,453 -176 -14,738<br />
Average 403 551 14,034 940 -1,982 -14,189 -946 -93 -1,282<br />
Scenario 3a Maximum 1,123 558 24,922 1,105 -1,115 -13,604 -534 -68 9,072<br />
Minimum 5 545 7,618 485 -4,731 -14,773 -1,246 -128 -6,755<br />
Average 312 626 14,034 950 -2,012 -14,106 -949 -93 -1,237<br />
Scenario 3b Maximum 937 628 24,922 1,116 -1,114 -13,655 -531 -68 9,102<br />
Minimum 5 618 7,618 485 -4,703 -14,544 -1,257 -128 -6,666<br />
Average 186 626 14,034 760 -2,181 -14,264 -603 -122 -1,565<br />
Scenario 4 Maximum 681 628 24,922 1,390 -866 -7,671 -325 -71 11,867<br />
Minimum 5 618 7,618 336 -4,735 -22,607 -1,156 -177 -14,852<br />
Key:<br />
afy - acre-feet per year<br />
Notes:<br />
(1) Positive values define inflows to groundwater basin.<br />
(2) Negative values define outflows from groundwater basin.<br />
(3) Positive change in storage values define increase in groundwater storage; negative change in storage values define decline in groundwater storage.<br />
Task 10.1 - Technical Memorandum, <strong>San</strong> <strong>Francisco</strong> Public Utilities Commission<br />
G:\ISG-Group\Admin\Job\08\0864001_SFPUC_EIR Support\09-Reports\Tech Memos\TMs\TM_10.1\Tables\Table_10.1-12_WB_Avg-Min-Max.xlsx Page 12 of 12
Attachment 10.1-A<br />
Key Proposed Elements of GSR Project<br />
Operating Agreement for EIR Analysis<br />
D.5-89
SUMMARY OF DRAFT GSR PROJECT OPERATING AGREEMENT<br />
February 29, 2012<br />
Under a proposed agreement between the SFPUC and the Partner Agencies for operation of<br />
groundwater pumping by these entities from the South Westside Groundwater Basin, the SFPUC<br />
would "store" water in the South Westside Groundwater Basin through the mechanism of in-lieu<br />
recharge by providing surface water as a substitute for groundwater pumping by the Partner<br />
Agencies. As part of its annual April 15 estimate of water supply available to the Regional<br />
Water System, the SFPUC would determine and give notice to the Partner Agencies of the<br />
availability, anticipated quantities and timing of the in-lieu water deliveries, thereby requiring the<br />
Partner Agencies to accept delivery of surface water in lieu of groundwater pumped using their<br />
existing wells (generally during wet and normal water years). This determination would take<br />
into consideration the amount of groundwater that the Partner Agencies must continue to pump<br />
due to water quality blending, distribution system constraints, well maintenance, and other<br />
requirements.<br />
During these times when water would be stored in the groundwater basin (Put Periods 1 ), the<br />
SFPUC could require the Partner Agencies to take delivery of up to 5.52 mgd of in-lieu water<br />
using their existing turnouts on SFPUC transmission pipelines in lieu of pumping a like amount<br />
of groundwater from their existing facilities. As a result of the in-lieu deliveries, up to 60,500<br />
acre feet of groundwater storage or "put" credits could accrue to the SFPUC Storage Account<br />
described below. During shortages of SFPUC system water due to drought, emergencies or<br />
scheduled maintenance, the Partner Agencies would return to pumping from their existing wells.<br />
In addition, the SFPUC and the Partner Agencies would extract groundwater from the SFPUC<br />
Storage Account using the new wells installed by the SFPUC as part of the Project, at a<br />
maximum annual volume of 8,100 acre feet withdrawn at an average rate of 7.2 mgd. The<br />
SFPUC will not direct pumping during these periods (Take Periods 2 ) unless a positive balance<br />
exists in the SFPUC Storage Account as described below.<br />
An accounting of the additional storage volumes (the SFPUC Storage Account) accrued during<br />
Put Periods would be maintained by the SFPUC as a book account tracking the amount of water<br />
that has been stored during normal and wet years and the amount of water pumped from the<br />
SFPUC Storage Account during Take Periods. Accruals in the SFPUC Storage Account would<br />
be recorded based on metered, in-lieu surface water deliveries and corresponding metered<br />
decreases in groundwater pumping below "designated quantities" agreed to by the Partner<br />
Agencies. An operating committee would be formed to monitor and track the SFPUC Storage<br />
Account, including any losses from the system, and establish annual pumping schedules for<br />
Project wells.<br />
As discussed in Section 3.3, the Partner Agencies would continue to maintain and operate their<br />
existing wells and associated infrastructure, and could install new or replacement wells in the<br />
future if necessary. The Partner Agencies would agree to limit pumping from their existing wells<br />
and any new wells to the designated quantities totaling 6.9 mgd over a 5 year averaging period,<br />
the estimated modeled volume of municipal pumping that the South Westside Basin can sustain<br />
without causing a decline in groundwater levels on an annual average basis and the amounts<br />
identified in the respective Partner Agencies Urban Water Management Plans, allocated in the<br />
initial year as follows:<br />
1 Put Periods may also be referred to as Storage Periods in the operating agreement and other<br />
documentation concerning the Project.<br />
2 Take Periods may also be referred to as Recovery Periods in the operating agreement and other<br />
documentation concerning the Project.<br />
1<br />
D.5-90
Daly City: 3.43 mgd/ 3,840 acre feet per year<br />
Cal Water: 1.37 mgd/ 1,534 acre feet per year<br />
<strong>San</strong> Bruno: 2.1 mgd/ 2,350 acre feet per year<br />
Pumping from the Partner Agency existing facilities during years when the SFPUC has not<br />
directed take of water from the SFPUC Storage Account and years where the SFPUC has neither<br />
directed take nor put of in lieu groundwater (Hold Periods) could not exceed 7.6 mgd in any year<br />
of the 5 year averaging period. This 10% increase over 6.9 mgd could occur as a result of<br />
transfer of designated quantities between Partner Agencies, which would be permitted under the<br />
operating agreement provided such adjustment received unanimous approval of the operating<br />
committee based on actual operating experience that demonstrates that such an increase is<br />
consistent with sustainable groundwater basin management. If a Partner Agency engages in<br />
over production, then that agency would be required to (1) take steps to pump less during future<br />
years to bring pumping back within the 6.9 mgd aggregate designated quantity; (2) provide a<br />
source of water that has the effect of replacing water lost from the Basin due to the over<br />
production; or (3) take other actions that may be recommended by the operating committee.<br />
During normal and wet years, Project wells would be operated by the SFPUC or the Partner<br />
Agencies only periodically to exercise the wells for maintenance purposes at a rate of<br />
approximately 0.04 mgd and the Partner Agencies' would pump their existing wells at a rate of<br />
approximately 1.38 mgd to 1.9 mgd. In circumstances where the SFPUC determines that<br />
delivery of in-lieu water cannot be made due to a dry year, emergencies, system rehabilitation,<br />
scheduled maintenance or malfunctioning of the water system, or upon recommendation of the<br />
operating committee established by the operating agreement for purposes of Basin management,<br />
the SFPUC may direct the Partner Agencies to extract groundwater from the SFPUC Storage<br />
Account using Project wells, in addition to continued pumping from the Partner Agencies'<br />
existing wells to meet the remainder of their water supply needs. Pumping from the SFPUC<br />
Storage Account by the Partner Agencies and the SFPUC would only occur if a positive balance<br />
exists in the SFPUC Storage Account as a result of previous in lieu recharge.<br />
During droughts, Project wells would be operated beginning in the second consecutive year of a<br />
multi-year drought, following implementation of the Shortage Allocation Plan. Partner Agency<br />
pumping from the SFPUC Storage Account using Project wells during droughts, combined with<br />
the remaining reduced surface water deliveries from the Regional Water System to the Partner<br />
Agencies, would be limited to the total quantity of water allocated to each Partner Agency under<br />
Tier 2 of the Shortage Allocation Plan 3 . Partner Agency pumping during droughts using their<br />
existing wells would be limited to their respective Designated Quantities, which in total equal an<br />
aggregate volume of 7,724 acre feet per year, extracted at an annual cumulative rate of 6.9 mgd<br />
and computed on a 5 year rolling average basis. The specific volumes to be pumped during a<br />
drought shown in Figure 3-2 (see Section 3.3.1 above) are based on the Project Operations, but<br />
actual volumes in any given year could vary depending on factors including: (1) the final<br />
location and capacity of the Project well facilities, (2) the volume of water in the SFPUC Storage<br />
Account, and (3) direction from the operating committee regarding which wells should be used,<br />
based on the need to avoid well interference and other basin management considerations.<br />
3 In the July 2009 WSA, the SFPUC and its wholesale customers adopted a Water Shortage<br />
Allocation Plan to allocate water between retail and wholesale customers during system wide<br />
shortages of 20% or less (the Tier 1 plan). The specific amount of rationing required by each<br />
wholesale customer, including the Participating Pumpers, is determined either by agreement of<br />
the wholesale customers themselves (the Tier 2 Plan) or, in the absence of such agreement, by<br />
the SFPUC after discussion with the wholesale customers.<br />
2<br />
D.5-91
The SFPUC would own the Project well facilities, and there would be no change to the Partner<br />
Agencies' ownership and operation of their existing and any new well facilities, except to the<br />
extent of their agreement regarding cessation and resumption of groundwater pumping as agreed<br />
to under a proposed operating agreement. The SFPUC and the Partner Agencies would operate<br />
and maintain Project wells connected to their respective water systems. The Partner Agencies<br />
may be allowed to use Project facilities for non-Project purposes but only under certain specified<br />
conditions where necessary, with approval of the operating committee and only for periods not to<br />
exceed 30 days duration. In the event of a sudden, non-drought event such as an earthquake or<br />
other catastrophic event, the operating committee may allow Partner Agency use of Project<br />
facilities for the duration of the emergency.<br />
Project Operation<br />
As described above, the Project would use vacated storage space in the South Westside<br />
Groundwater Basin filled through in lieu recharge during normal and wet years. Neither Project<br />
wells nor Partner Agency wells would be pumped in these Put Periods, apart from volumes<br />
needed to periodically exercise the wells. Water would accrue in the SFPUC Storage Account<br />
based on the metered reduction in each Partner Agency's designated quantity described in section<br />
3.8.1.<br />
When the SFPUC Storage Account is full, defined as 60,500 acre feet, but there is no shortage<br />
requiring the SFPUC to pump groundwater from Project wells (Hold Periods), the Project wells<br />
installed by the SFPUC would remain inactive apart from well exercising. Existing Partner<br />
Agency wells would be pumped at rates not to exceed an annual amount of 6.9 mgd (or up to 7.6<br />
mgd in the event of a 10% increase) in any year of the 5 year periods as described in Section<br />
3.8.1. The Partner Agencies would continue to be able to take delivery of their entitlements to<br />
surface water from the SFPUC (their "Individual Supply Guarantees") during these Hold<br />
Periods, as the SFPUC Storage Account would remain full.<br />
New Project wells installed by the SFPUC would be operated under the following circumstances:<br />
<br />
<br />
<br />
<br />
Beginning in the second dry year of a multiple year drought<br />
During emergencies<br />
During system rehabilitation, scheduled maintenance or malfunctioning of the<br />
water system<br />
Upon recommendation of the operating committee established by the operating<br />
agreement for purposes of Basin management<br />
In these circumstances, new Project wells could be operated continuously or for shorter intervals,<br />
depending on the need for water. The primary purpose of the Project is to provide a dry year<br />
water supply during a multiple year drought. During these Take Periods, when groundwater is<br />
pumped to provide a dry year supply, pumping would reduce the balance of water in the SFPUC<br />
Storage Account. Project wells would be operated by the Partner Agencies and the SFPUC,<br />
depending on whether the water is sent to the Partner Agencies' retail water distribution systems<br />
or the SFPUC regional water transmission system. Project wells would only be pumped in Take<br />
Periods if there is a positive balance in the SFPUC Storage Account, and that pumping may not<br />
exceed 8,100 acre-feet per "supply year," defined as the period from July 1 to June 30 of the<br />
following year. Existing Partner Agency wells would be pumped at up to the rates indicated<br />
above during Hold Periods and the combined (reduced) deliveries of SFPUC surface water to the<br />
Partner Agencies and water pumped by the Partner Agencies from the SFPUC Storage Account<br />
using new Project wells would not exceed the Partner Agencies' individual Tier 2 allocations<br />
under the Shortage Allocation Plan.<br />
3<br />
D.5-92
Attachment 10.1-B<br />
Model Scenario Hydrographs for Selected Locations<br />
D.5-93
25<br />
SWM‐GS‐M Simulated Groundwater Elevation, Scenario 1<br />
Design Drought<br />
D.5-94<br />
Simulated Grou undwater Elevation (feet NGVD)<br />
20<br />
15<br />
10<br />
5<br />
0<br />
‐5<br />
‐10<br />
50<br />
40<br />
30<br />
20<br />
10<br />
00<br />
Note: At the location of SWM‐GS‐M, the model does not contain Model Layer 5.<br />
Scenario Year<br />
Layer 1 Layer 2 Layer 3 Layer 4
25<br />
Ortega_MW Simulated Groundwater Elevation, Scenario 1<br />
Design Drought<br />
D.5-95<br />
Simulated Grou undwater Elevation (feet NGVD)<br />
20<br />
15<br />
10<br />
5<br />
0<br />
‐5<br />
‐10<br />
50<br />
40<br />
30<br />
20<br />
10<br />
00<br />
Scenario Year<br />
Layer 1 Layer 2 Layer 3 Layer 4 Layer 5
<strong>San</strong>tiago‐S Simulated Groundwater Elevation, Scenario 1<br />
25<br />
Design Drought<br />
D.5-96<br />
Simulated Grou undwater Elevation (feet NGVD)<br />
20<br />
15<br />
10<br />
5<br />
0<br />
‐5<br />
‐10<br />
‐15<br />
‐20<br />
50<br />
40<br />
30<br />
20<br />
10<br />
00<br />
Scenario Year<br />
Layer 1 Layer 2 Layer 3 Layer 4 Layer 5
30<br />
LMMW‐4S Simulated Groundwater Elevation, Scenario 1<br />
Design Drought<br />
D.5-97<br />
Simulated Grou undwater Elevation (feet NGVD)<br />
20<br />
10<br />
0<br />
‐10<br />
‐20<br />
‐30<br />
‐40<br />
‐50<br />
50<br />
40<br />
30<br />
20<br />
10<br />
00<br />
Scenario Year<br />
Layer 1 Layer 2 Layer 3 Layer 4 Layer 5
50<br />
LMMW‐5S Simulated Groundwater Elevation, Scenario 1<br />
Design Drought<br />
D.5-98<br />
Simulated Grou undwater Elevation (feet NGVD)<br />
40<br />
30<br />
20<br />
10<br />
0<br />
‐10<br />
‐20<br />
50<br />
40<br />
30<br />
20<br />
10<br />
00<br />
Scenario Year<br />
Note: At the location of LMMW‐5S, the model does not contain Model Layers 4 and 5.<br />
Layer 1 Layer 2 Layer 3
40<br />
Harding Park Simulated Groundwater Elevation, Scenario 1<br />
Design Drought<br />
D.5-99<br />
Simulated Grou undwater Elevation (feet NGVD)<br />
20<br />
0<br />
‐20<br />
‐40<br />
‐60<br />
‐80<br />
50<br />
40<br />
30<br />
20<br />
10<br />
00<br />
Scenario Year<br />
Layer 1 Layer 2 Layer 3 Layer 4 Layer 5
D.5-100<br />
Simulated Grou undwater Elevation (feet NGVD)<br />
40<br />
20<br />
0<br />
‐20<br />
‐40<br />
‐60<br />
‐80<br />
‐100<br />
‐120<br />
Olympic‐MW Simulated Groundwater Elevation, Scenario 1<br />
Design Drought<br />
‐140<br />
50<br />
40<br />
30<br />
20<br />
10<br />
00<br />
Scenario Year<br />
Layer 1 Layer 2 Layer 3 Layer 4 Layer 5
0<br />
DC‐3 Simulated Groundwater Elevation, Scenario 1<br />
Design Drought<br />
D.5-101<br />
Simulated Grou undwater Elevation (feet NGVD)<br />
‐50<br />
‐100<br />
‐150<br />
‐200<br />
‐250<br />
50<br />
40<br />
30<br />
20<br />
10<br />
00<br />
Scenario Year<br />
Layer 1 Layer 2 Layer 3 Layer 4 Layer 5
0<br />
DC‐A‐St Simulated Groundwater Elevation, Scenario 1<br />
Design Drought<br />
D.5-102<br />
Simulated Grou undwater Elevation (feet NGVD)<br />
‐50<br />
‐100<br />
‐150<br />
‐200<br />
‐250<br />
50<br />
40<br />
30<br />
20<br />
10<br />
00<br />
Scenario Year<br />
Layer 1 Layer 2 Layer 3 Layer 4 Layer 5
D.5-103<br />
Simulated Grou undwater Elevation (feet NGVD)<br />
‐30<br />
‐60<br />
‐90<br />
‐120<br />
‐150<br />
‐180<br />
‐210<br />
‐240<br />
‐270<br />
Cyp_Lawn_2 Simulated Groundwater Elevation, Scenario 1<br />
Design Drought<br />
‐300<br />
50<br />
40<br />
30<br />
20<br />
10<br />
00<br />
Scenario Year<br />
Layer 1 Layer 2 Layer 3 Layer 4 Layer 5
0<br />
SSF‐02 Simulated Groundwater Elevation, Scenario 1<br />
Design Drought<br />
D.5-104<br />
Simulated Grou undwater Elevation (feet NGVD)<br />
‐50<br />
‐100<br />
‐150<br />
‐200<br />
‐250<br />
50<br />
40<br />
30<br />
20<br />
10<br />
00<br />
Scenario Year<br />
Layer 1 Layer 2 Layer 3 Layer 4 Layer 5
50<br />
SB‐12 Simulated Groundwater Elevation, Scenario 1<br />
Design Drought<br />
D.5-105<br />
Simulated Grou undwater Elevation (feet NGVD)<br />
0<br />
‐50<br />
‐100<br />
‐150<br />
‐200<br />
‐250<br />
‐300<br />
50<br />
40<br />
30<br />
20<br />
10<br />
00<br />
Scenario Year<br />
Note: At the location of SB‐12, the model does not contain Model Layer 5.<br />
Layer 1 Layer 2 Layer 3 Layer 4
25<br />
SWM‐GS‐M Simulated Groundwater Elevation, Scenario 2<br />
Design Drought<br />
D.5-106<br />
Simulated Grou undwater Elevation (feet NGVD)<br />
20<br />
15<br />
10<br />
5<br />
0<br />
‐5<br />
‐10<br />
50<br />
40<br />
30<br />
20<br />
10<br />
00<br />
Scenario Year<br />
Note: At the location of SWM‐GS‐M, the model does not contain Model Layer 5.<br />
Layer 1 Layer 2 Layer 3 Layer 4
25<br />
Ortega_MW Simulated Groundwater Elevation, Scenario 2<br />
Design Drought<br />
D.5-107<br />
Simulated Grou undwater Elevation (feet NGVD)<br />
20<br />
15<br />
10<br />
5<br />
0<br />
‐5<br />
‐10<br />
50<br />
40<br />
30<br />
20<br />
10<br />
00<br />
Scenario Year<br />
Layer 1 Layer 2 Layer 3 Layer 4 Layer 5
<strong>San</strong>tiago‐S Simulated Groundwater Elevation, Scenario 2<br />
25<br />
Design Drought<br />
D.5-108<br />
Simulated Grou undwater Elevation (feet NGVD)<br />
20<br />
15<br />
10<br />
5<br />
0<br />
‐5<br />
‐10<br />
‐15<br />
‐20<br />
50<br />
40<br />
30<br />
20<br />
10<br />
00<br />
Scenario Year<br />
Layer 1 Layer 2 Layer 3 Layer 4 Layer 5
30<br />
LMMW‐4S Simulated Groundwater Elevation, Scenario 2<br />
Design Drought<br />
D.5-109<br />
Simulated Grou undwater Elevation (feet NGVD)<br />
20<br />
10<br />
0<br />
‐10<br />
‐20<br />
‐30<br />
‐40<br />
‐50<br />
50<br />
40<br />
30<br />
20<br />
10<br />
00<br />
Scenario Year<br />
Layer 1 Layer 2 Layer 3 Layer 4 Layer 5
50<br />
LMMW‐5S Simulated Groundwater Elevation, Scenario 2<br />
Design Drought<br />
D.5-110<br />
Simulated Grou undwater Elevation (feet NGVD)<br />
40<br />
30<br />
20<br />
10<br />
0<br />
‐10<br />
‐20<br />
50<br />
40<br />
30<br />
20<br />
10<br />
00<br />
Scenario Year<br />
Note: At the location of LMMW‐5S, the model does not contain Model Layers 4 and 5.<br />
Layer 1 Layer 2 Layer 3
40<br />
Harding Park Simulated Groundwater Elevation, Scenario 2<br />
Design Drought<br />
D.5-111<br />
Simulated Grou undwater Elevation (feet NGVD)<br />
20<br />
0<br />
‐20<br />
‐40<br />
‐60<br />
‐80<br />
‐100<br />
‐120<br />
50<br />
40<br />
30<br />
20<br />
10<br />
00<br />
Scenario Year<br />
Layer 1 Layer 2 Layer 3 Layer 4 Layer 5
40<br />
Olympic‐MW Simulated Groundwater Elevation, Scenario 2<br />
Design Drought<br />
D.5-112<br />
Simulated Grou undwater Elevation (feet NGVD)<br />
0<br />
‐40<br />
‐80<br />
‐120<br />
‐160<br />
‐200<br />
‐240<br />
50<br />
40<br />
30<br />
20<br />
10<br />
00<br />
Scenario Year<br />
Layer 1 Layer 2 Layer 3 Layer 4 Layer 5
0<br />
DC‐3 Simulated Groundwater Elevation, Scenario 2<br />
Design Drought<br />
D.5-113<br />
Simulated Grou undwater Elevation (feet NGVD)<br />
‐50<br />
‐100<br />
‐150<br />
‐200<br />
‐250<br />
‐300<br />
‐350<br />
‐400<br />
50<br />
40<br />
30<br />
20<br />
10<br />
00<br />
Scenario Year<br />
Layer 1 Layer 2 Layer 3 Layer 4 Layer 5
0<br />
DC‐A‐St Simulated Groundwater Elevation, Scenario 2<br />
Design Drought<br />
D.5-114<br />
Simulated Grou undwater Elevation (feet NGVD)<br />
‐50<br />
‐100<br />
‐150<br />
‐200<br />
‐250<br />
‐300<br />
‐350<br />
Dry cell in Model Layer 1<br />
during Design Drought<br />
‐400<br />
50<br />
40<br />
30<br />
20<br />
10<br />
00<br />
Scenario Year<br />
Layer 1 Layer 2 Layer 3 Layer 4 Layer 5
0<br />
Cyp_Lawn_2 Simulated Groundwater Elevation, Scenario 2<br />
Design Drought<br />
D.5-115<br />
Simulated Grou undwater Elevation (feet NGVD)<br />
‐50<br />
‐100<br />
‐150<br />
‐200<br />
‐250<br />
‐300<br />
‐350<br />
50<br />
40<br />
30<br />
20<br />
10<br />
00<br />
Scenario Year<br />
Layer 1 Layer 2 Layer 3 Layer 4 Layer 5
0<br />
SSF‐02 Simulated Groundwater Elevation, Scenario 2<br />
D.5-116<br />
Simulated Grou undwater Elevation (feet NGVD)<br />
‐50<br />
‐100<br />
‐150<br />
‐200<br />
‐250<br />
‐300<br />
‐350<br />
Design Drought<br />
‐400<br />
50<br />
40<br />
30<br />
20<br />
10<br />
00<br />
Scenario Year<br />
Layer 1 Layer 2 Layer 3 Layer 4 Layer 5
SB‐12 Simulated Groundwater Elevation, Scenario 2<br />
50<br />
Design Drought<br />
D.5-117<br />
Simulated Grou undwater Elevation (feet NGVD)<br />
0<br />
‐50<br />
‐100<br />
‐150<br />
‐200<br />
‐2502 0<br />
‐300<br />
‐350<br />
‐400<br />
50<br />
40<br />
30<br />
20<br />
10<br />
00<br />
Scenario Year<br />
Note: At the location of SB‐12, the model does not contain Model Layer 5.<br />
Layer 1 Layer 2 Layer 3 Layer 4
25<br />
SWM‐GS‐M Simulated Groundwater Elevation, Scenario 3a<br />
Design Drought<br />
D.5-118<br />
Simulated Grou undwater Elevation (feet NGVD)<br />
20<br />
15<br />
10<br />
5<br />
0<br />
‐5<br />
‐10<br />
50<br />
40<br />
30<br />
20<br />
10<br />
00<br />
Scenario Year<br />
Note: At the location of SWM‐GS‐M, the model does not contain Model Layer 5.<br />
Layer 1 Layer 2 Layer 3 Layer 4
25<br />
Ortega_MW Simulated Groundwater Elevation, Scenario 3a<br />
Design Drought<br />
D.5-119<br />
Simulated Grou undwater Elevation (feet NGVD)<br />
20<br />
15<br />
10<br />
5<br />
0<br />
‐5<br />
‐10<br />
50<br />
40<br />
30<br />
20<br />
10<br />
00<br />
Scenario Year<br />
Layer 1 Layer 2 Layer 3 Layer 4 Layer 5
<strong>San</strong>tiago‐S Simulated Groundwater Elevation, Scenario 3a<br />
25<br />
Design Drought<br />
D.5-120<br />
Simulated Grou undwater Elevation (feet NGVD)<br />
20<br />
15<br />
10<br />
5<br />
0<br />
‐5<br />
‐10<br />
‐15<br />
‐20<br />
50<br />
40<br />
30<br />
20<br />
10<br />
00<br />
Scenario Year<br />
Layer 1 Layer 2 Layer 3 Layer 4 Layer 5
30<br />
LMMW‐4S Simulated Groundwater Elevation, Scenario 3a<br />
Design Drought<br />
D.5-121<br />
Simulated Grou undwater Elevation (feet NGVD)<br />
20<br />
10<br />
0<br />
‐10<br />
‐20<br />
‐30<br />
‐40<br />
‐50<br />
50<br />
40<br />
30<br />
20<br />
10<br />
00<br />
Scenario Year<br />
Layer 1 Layer 2 Layer 3 Layer 4 Layer 5
50<br />
LMMW‐5S Simulated Groundwater Elevation, Scenario 3a<br />
Design Drought<br />
D.5-122<br />
Simulated Grou undwater Elevation (feet NGVD)<br />
40<br />
30<br />
20<br />
10<br />
0<br />
‐10<br />
‐20<br />
50<br />
40<br />
30<br />
20<br />
10<br />
00<br />
Scenario Year<br />
Note: At the location of LMMW‐5S, the model does not contain Model Layers 4 and 5.<br />
Layer 1 Layer 2 Layer 3
40<br />
Harding Park Simulated Groundwater Elevation, Scenario 3a<br />
Design Drought<br />
D.5-123<br />
Simulated Grou undwater Elevation (feet NGVD)<br />
20<br />
0<br />
‐20<br />
‐40<br />
‐60<br />
‐80<br />
50<br />
40<br />
30<br />
20<br />
10<br />
00<br />
Scenario Year<br />
Layer 1 Layer 2 Layer 3 Layer 4 Layer 5
D.5-124<br />
Simulated Grou undwater Elevation (feet NGVD)<br />
40<br />
20<br />
0<br />
‐20<br />
‐40<br />
‐60<br />
‐80<br />
‐100<br />
‐120<br />
Olympic‐MW Simulated Groundwater Elevation, Scenario 3a<br />
Design Drought<br />
‐140<br />
50<br />
40<br />
30<br />
20<br />
10<br />
00<br />
Scenario Year<br />
Layer 1 Layer 2 Layer 3 Layer 4 Layer 5
0<br />
DC‐3 Simulated Groundwater Elevation, Scenario 3a<br />
Design Drought<br />
D.5-125<br />
Simulated Grou undwater Elevation (feet NGVD)<br />
‐50<br />
‐100<br />
‐150<br />
‐200<br />
‐250<br />
50<br />
40<br />
30<br />
20<br />
10<br />
00<br />
Scenario Year<br />
Layer 1 Layer 2 Layer 3 Layer 4 Layer 5
0<br />
DC‐A‐St Simulated Groundwater Elevation, Scenario 3a<br />
Design Drought<br />
D.5-126<br />
Simulated Grou undwater Elevation (feet NGVD)<br />
‐50<br />
‐100<br />
‐150<br />
‐200<br />
‐250<br />
50<br />
40<br />
30<br />
20<br />
10<br />
00<br />
Scenario Year<br />
Layer 1 Layer 2 Layer 3 Layer 4 Layer 5
D.5-127<br />
Simulated Grou undwater Elevation (feet NGVD)<br />
‐30<br />
‐60<br />
‐90<br />
‐120<br />
‐150<br />
‐180<br />
‐210<br />
‐240<br />
‐270<br />
Cyp_Lawn_2 Simulated Groundwater Elevation, Scenario 3a<br />
Design Drought<br />
‐300<br />
50<br />
40<br />
30<br />
20<br />
10<br />
00<br />
Scenario Year<br />
Layer 1 Layer 2 Layer 3 Layer 4 Layer 5
0<br />
SSF‐02 Simulated Groundwater Elevation, Scenario 3a<br />
Design Drought<br />
D.5-128<br />
Simulated Grou undwater Elevation (feet NGVD)<br />
‐50<br />
‐100<br />
‐150<br />
‐200<br />
‐250<br />
50<br />
40<br />
30<br />
20<br />
10<br />
00<br />
Scenario Year<br />
Layer 1 Layer 2 Layer 3 Layer 4 Layer 5
50<br />
SB‐12 Simulated Groundwater Elevation, Scenario 3a<br />
Design Drought<br />
D.5-129<br />
Simulated Grou undwater Elevation (feet NGVD)<br />
0<br />
‐50<br />
‐100<br />
‐150<br />
‐200<br />
‐250<br />
‐300<br />
50<br />
40<br />
30<br />
20<br />
10<br />
00<br />
Scenario Year<br />
Note: At the location of SB‐12, the model does not contain Model Layer 5.<br />
Layer 1 Layer 2 Layer 3 Layer 4
25<br />
SWM‐GS‐M Simulated Groundwater Elevation, Scenario 3b<br />
Design Drought<br />
D.5-130<br />
Simulated Grou undwater Elevation (feet NGVD)<br />
20<br />
15<br />
10<br />
5<br />
0<br />
‐5<br />
‐10<br />
50<br />
40<br />
30<br />
20<br />
10<br />
00<br />
Scenario Year<br />
Note: At the location of SWM‐GS‐M, the model does not contain Model Layer 5.<br />
Layer 1 Layer 2 Layer 3 Layer 4
25<br />
Ortega_MW Simulated Groundwater Elevation, Scenario 3b<br />
Design Drought<br />
D.5-131<br />
Simulated Grou undwater Elevation (feet NGVD)<br />
20<br />
15<br />
10<br />
5<br />
0<br />
‐5<br />
‐10<br />
50<br />
40<br />
30<br />
20<br />
10<br />
00<br />
Scenario Year<br />
Layer 1 Layer 2 Layer 3 Layer 4 Layer 5
<strong>San</strong>tiago‐S Simulated Groundwater Elevation, Scenario 3b<br />
25<br />
Design Drought<br />
D.5-132<br />
Simulated Grou undwater Elevation (feet NGVD)<br />
20<br />
15<br />
10<br />
5<br />
0<br />
‐5<br />
‐10<br />
‐15<br />
‐20<br />
50<br />
40<br />
30<br />
20<br />
10<br />
00<br />
Scenario Year<br />
Layer 1 Layer 2 Layer 3 Layer 4 Layer 5
30<br />
LMMW‐4S Simulated Groundwater Elevation, Scenario 3b<br />
Design Drought<br />
D.5-133<br />
Simulated Grou undwater Elevation (feet NGVD)<br />
20<br />
10<br />
0<br />
‐10<br />
‐20<br />
‐30<br />
‐40<br />
‐50<br />
50<br />
40<br />
30<br />
20<br />
10<br />
00<br />
Scenario Year<br />
Layer 1 Layer 2 Layer 3 Layer 4 Layer 5
50<br />
LMMW‐5S Simulated Groundwater Elevation, Scenario 3b<br />
Design Drought<br />
D.5-134<br />
Simulated Grou undwater Elevation (feet NGVD)<br />
40<br />
30<br />
20<br />
10<br />
0<br />
‐10<br />
‐20<br />
50<br />
40<br />
30<br />
20<br />
10<br />
00<br />
Scenario Year<br />
Note: At the location of LMMW‐5S, the model does not contain Model Layers 4 and 5.<br />
Layer 1 Layer 2 Layer 3
40<br />
Harding Park Simulated Groundwater Elevation, Scenario 3b<br />
Design Drought<br />
D.5-135<br />
Simulated Grou undwater Elevation (feet NGVD)<br />
20<br />
0<br />
‐20<br />
‐40<br />
‐60<br />
‐80<br />
50<br />
40<br />
30<br />
20<br />
10<br />
00<br />
Scenario Year<br />
Layer 1 Layer 2 Layer 3 Layer 4 Layer 5
D.5-136<br />
Simulated Grou undwater Elevation (feet NGVD)<br />
40<br />
20<br />
0<br />
‐20<br />
‐40<br />
‐60<br />
‐80<br />
‐100<br />
‐120<br />
Olympic‐MW Simulated Groundwater Elevation, Scenario 3b<br />
Design Drought<br />
‐140<br />
50<br />
40<br />
30<br />
20<br />
10<br />
00<br />
Scenario Year<br />
Layer 1 Layer 2 Layer 3 Layer 4 Layer 5
0<br />
DC‐3 Simulated Groundwater Elevation, Scenario 3b<br />
Design Drought<br />
D.5-137<br />
Simulated Grou undwater Elevation (feet NGVD)<br />
‐50<br />
‐100<br />
‐150<br />
‐200<br />
‐250<br />
50<br />
40<br />
30<br />
20<br />
10<br />
00<br />
Scenario Year<br />
Layer 1 Layer 2 Layer 3 Layer 4 Layer 5
0<br />
DC‐A‐St Simulated Groundwater Elevation, Scenario 3b<br />
Design Drought<br />
D.5-138<br />
Simulated Grou undwater Elevation (feet NGVD)<br />
‐50<br />
‐100<br />
‐150<br />
‐200<br />
‐250<br />
50<br />
40<br />
30<br />
20<br />
10<br />
00<br />
Scenario Year<br />
Layer 1 Layer 2 Layer 3 Layer 4 Layer 5
D.5-139<br />
Simulated Grou undwater Elevation (feet NGVD)<br />
‐30<br />
‐60<br />
‐90<br />
‐120<br />
‐150<br />
‐180<br />
‐210<br />
‐240<br />
‐270<br />
Cyp_Lawn_2 Simulated Groundwater Elevation, Scenario 3b<br />
Design Drought<br />
‐300<br />
50<br />
40<br />
30<br />
20<br />
10<br />
00<br />
Scenario Year<br />
Layer 1 Layer 2 Layer 3 Layer 4 Layer 5
0<br />
SSF‐02 Simulated Groundwater Elevation, Scenario 3b<br />
Design Drought<br />
D.5-140<br />
Simulated Grou undwater Elevation (feet NGVD)<br />
‐50<br />
‐100<br />
‐150<br />
‐200<br />
‐250<br />
50<br />
40<br />
30<br />
20<br />
10<br />
00<br />
Scenario Year<br />
Layer 1 Layer 2 Layer 3 Layer 4 Layer 5
50<br />
SB‐12 Simulated Groundwater Elevation, Scenario 3b<br />
Design Drought<br />
D.5-141<br />
Simulated Grou undwater Elevation (feet NGVD)<br />
0<br />
‐50<br />
‐100<br />
‐150<br />
‐200<br />
‐250<br />
‐300<br />
50<br />
40<br />
30<br />
20<br />
10<br />
00<br />
Scenario Year<br />
Note: At the location of SB‐12, the model does not contain Model Layer 5.<br />
Layer 1 Layer 2 Layer 3 Layer 4
25<br />
SWM‐GS‐M Simulated Groundwater Elevation, Scenario 4<br />
Design Drought<br />
D.5-142<br />
Simulated Grou undwater Elevation (feet NGVD)<br />
20<br />
15<br />
10<br />
5<br />
0<br />
‐5<br />
‐10<br />
50<br />
40<br />
30<br />
20<br />
10<br />
00<br />
Scenario Year<br />
Note: At the location of SWM‐GS‐M, the model does not contain Model Layer 5.<br />
Layer 1 Layer 2 Layer 3 Layer 4
25<br />
Ortega_MW Simulated Groundwater Elevation, Scenario 4<br />
Design Drought<br />
D.5-143<br />
Simulated Grou undwater Elevation (feet NGVD)<br />
20<br />
15<br />
10<br />
5<br />
0<br />
‐5<br />
‐10<br />
50<br />
40<br />
30<br />
20<br />
10<br />
00<br />
Scenario Year<br />
Layer 1 Layer 2 Layer 3 Layer 4 Layer 5
<strong>San</strong>tiago‐S Simulated Groundwater Elevation, Scenario 4<br />
25<br />
Design Drought<br />
D.5-144<br />
Simulated Grou undwater Elevation (feet NGVD)<br />
20<br />
15<br />
10<br />
5<br />
0<br />
‐5<br />
‐10<br />
‐15<br />
‐20<br />
50<br />
40<br />
30<br />
20<br />
10<br />
00<br />
Scenario Year<br />
Layer 1 Layer 2 Layer 3 Layer 4 Layer 5
LMMW‐4S Simulated Groundwater Elevation, Scenario 4<br />
30<br />
Design Drought<br />
D.5-145<br />
Simulated Grou undwater Elevation (feet NGVD)<br />
20<br />
10<br />
0<br />
‐10<br />
‐20<br />
‐30<br />
‐40<br />
‐50<br />
‐60<br />
50<br />
40<br />
30<br />
20<br />
10<br />
00<br />
Scenario Year<br />
Layer 1 Layer 2 Layer 3 Layer 4 Layer 5
50<br />
LMMW‐5S Simulated Groundwater Elevation, Scenario 4<br />
Design Drought<br />
D.5-146<br />
Simulated Grou undwater Elevation (feet NGVD)<br />
40<br />
30<br />
20<br />
10<br />
0<br />
‐10<br />
‐20<br />
50<br />
40<br />
30<br />
20<br />
10<br />
00<br />
Scenario Year<br />
Note: At the location of LMMW‐5S, the model does not contain Model Layers 4 and 5.<br />
Layer 1 Layer 2 Layer 3
40<br />
Harding Park Simulated Groundwater Elevation, Scenario 4<br />
Design Drought<br />
D.5-147<br />
Simulated Grou undwater Elevation (feet NGVD)<br />
20<br />
0<br />
‐20<br />
‐40<br />
‐60<br />
‐80<br />
‐100<br />
‐120<br />
50<br />
40<br />
30<br />
20<br />
10<br />
00<br />
Scenario Year<br />
Layer 1 Layer 2 Layer 3 Layer 4 Layer 5
40<br />
Olympic‐MW Simulated Groundwater Elevation, Scenario 4<br />
Design Drought<br />
D.5-148<br />
Simulated Grou undwater Elevation (feet NGVD)<br />
0<br />
‐40<br />
‐80<br />
‐120<br />
‐160<br />
‐200<br />
‐240<br />
50<br />
40<br />
30<br />
20<br />
10<br />
00<br />
Scenario Year<br />
Layer 1 Layer 2 Layer 3 Layer 4 Layer 5
0<br />
DC‐3 Simulated Groundwater Elevation, Scenario 4<br />
Design Drought<br />
D.5-149<br />
Simulated Grou undwater Elevation (feet NGVD)<br />
‐50<br />
‐100<br />
‐150<br />
‐200<br />
‐250<br />
‐300<br />
‐350<br />
‐400<br />
50<br />
40<br />
30<br />
20<br />
10<br />
00<br />
Scenario Year<br />
Layer 1 Layer 2 Layer 3 Layer 4 Layer 5
0<br />
DC‐A‐St Simulated Groundwater Elevation, Scenario 4<br />
Design Drought<br />
D.5-150<br />
Simulated Grou undwater Elevation (feet NGVD)<br />
‐50<br />
‐100<br />
‐150<br />
‐200<br />
‐250<br />
‐300<br />
‐350<br />
Dry cell in Model Layer 1<br />
during Design Drought<br />
‐400<br />
50<br />
40<br />
30<br />
20<br />
10<br />
00<br />
Scenario Year<br />
Layer 1 Layer 2 Layer 3 Layer 4 Layer 5
0<br />
Cyp_Lawn_2 Simulated Groundwater Elevation, Scenario 4<br />
Design Drought<br />
D.5-151<br />
Simulated Grou undwater Elevation (feet NGVD)<br />
‐50<br />
‐100<br />
‐150<br />
‐200<br />
‐250<br />
‐300<br />
‐350<br />
50<br />
40<br />
30<br />
20<br />
10<br />
00<br />
Scenario Year<br />
Layer 1 Layer 2 Layer 3 Layer 4 Layer 5
0<br />
SSF‐02 Simulated Groundwater Elevation, Scenario 4<br />
D.5-152<br />
Simulated Grou undwater Elevation (feet NGVD)<br />
‐50<br />
‐100<br />
‐150<br />
‐200<br />
‐250<br />
‐300<br />
‐350<br />
Design Drought<br />
‐400<br />
50<br />
40<br />
30<br />
20<br />
10<br />
00<br />
Scenario Year<br />
Layer 1 Layer 2 Layer 3 Layer 4 Layer 5
SB‐12 Simulated Groundwater Elevation, Scenario 4<br />
50<br />
Design Drought<br />
D.5-153<br />
Simulated Grou undwater Elevation (feet NGVD)<br />
0<br />
‐50<br />
‐100<br />
‐150<br />
‐200<br />
‐2502 0<br />
‐300<br />
‐350<br />
‐400<br />
50<br />
40<br />
30<br />
20<br />
10<br />
00<br />
Scenario Year<br />
Note: At the location of LMMW‐5S, the model does not contain Model Layers 4 and 5.<br />
Layer 1 Layer 2 Layer 3 Layer 4
SWM‐GS‐M Simulated Groundwater Elevation, Model Layer 1<br />
25<br />
Design Drought<br />
D.5-154<br />
undwater Elevation (feet NGVD)<br />
Simulated Gro<br />
20<br />
15<br />
10<br />
5<br />
0<br />
‐5<br />
‐10<br />
50<br />
40<br />
30<br />
20<br />
10<br />
00<br />
Scenario Year<br />
Scenario 1 Scenario 2 Scenario 3a Scenario 3b Scenario 4
Ortega_MW Simulated Groundwater Elevation, Model Layer 1<br />
25<br />
Design Drought<br />
D.5-155<br />
Simulated Gro oundwater Elevation (feet NGVD)<br />
20<br />
15<br />
10<br />
5<br />
0<br />
‐5<br />
‐10<br />
50<br />
40<br />
30<br />
20<br />
10<br />
00<br />
Scenario Year<br />
Scenario 1 Scenario 2 Scenario 3a Scenario 3b Scenario 4
<strong>San</strong>tiago‐S Simulated Groundwater Elevation, Model Layer 1<br />
25<br />
Design Drought<br />
D.5-156<br />
Simulated Grou undwater Elevation (feet NGVD)<br />
20<br />
15<br />
10<br />
5<br />
0<br />
‐5<br />
‐10<br />
‐15<br />
‐20<br />
50<br />
40<br />
30<br />
20<br />
10<br />
00<br />
Scenario Year<br />
Scenario 1 Scenario 2 Scenario 3a Scenario 3b Scenario 4
LMMW‐4S Simulated Groundwater Elevation, Model Layer 1<br />
30<br />
Design Drought<br />
D.5-157<br />
Simulated Grou undwater Elevation (feet NGVD)<br />
20<br />
10<br />
0<br />
‐10<br />
‐20<br />
‐30<br />
‐40<br />
‐50<br />
50<br />
40<br />
30<br />
20<br />
10<br />
00<br />
Scenario Year<br />
Scenario 1 Scenario 2 Scenario 3a Scenario 3b Scenario 4
LMMW‐5S Simulated Groundwater Elevation, Model Layer 1<br />
50<br />
Design Drought<br />
D.5-158<br />
Simulated Grou undwater Elevation (feet NGVD)<br />
40<br />
30<br />
20<br />
10<br />
0<br />
‐10<br />
‐20<br />
50<br />
40<br />
30<br />
20<br />
10<br />
00<br />
Scenario Year<br />
Scenario 1 Scenario 2 Scenario 3a Scenario 3b Scenario 4
Harding Park Simulated Groundwater Elevation, Model Layer 1<br />
50<br />
Design Drought<br />
D.5-159<br />
Simulated Grou undwater Elevation (feet NGVD)<br />
40<br />
30<br />
20<br />
10<br />
0<br />
‐10<br />
‐20<br />
50<br />
40<br />
30<br />
20<br />
10<br />
00<br />
Scenario Year<br />
Scenario 1 Scenario 2 Scenario 3a Scenario 3b Scenario 4
Olympic‐MW Simulated Groundwater Elevation, Model Layer 1<br />
40<br />
Design Drought<br />
D.5-160<br />
Simulated Grou undwater Elevation (feet NGVD)<br />
30<br />
20<br />
10<br />
0<br />
‐10<br />
‐20<br />
‐30<br />
‐40<br />
50<br />
40<br />
30<br />
20<br />
10<br />
00<br />
Scenario Year<br />
Scenario 1 Scenario 2 Scenario 3a Scenario 3b Scenario 4
DC‐3 Simulated Groundwater Elevation, Model Layer 1<br />
0<br />
Design Drought<br />
D.5-161<br />
Simulated Grou undwater Elevation (feet NGVD)<br />
‐50<br />
‐100<br />
‐150<br />
‐200<br />
‐250<br />
50<br />
40<br />
30<br />
20<br />
10<br />
00<br />
Scenario Year<br />
Scenario 1 Scenario 2 Scenario 3a Scenario 3b Scenario 4
DC‐A‐St Simulated Groundwater Elevation, Model Layer 1<br />
D.5-162<br />
Simulated Grou undwater Elevation (feet NGVD)<br />
0<br />
‐50<br />
‐100<br />
‐150<br />
‐200<br />
Design Drought<br />
Dry cell in Model Layer 1<br />
during Design Drought<br />
‐250<br />
50<br />
40<br />
30<br />
20<br />
10<br />
00<br />
Scenario Year<br />
Scenario 1 Scenario 2 Scenario 3a Scenario 3b Scenario 4
Cyp_Lawn_2 Simulated Groundwater Elevation, Model Layer 1<br />
0<br />
Design Drought<br />
D.5-163<br />
Simulated Grou undwater Elevation (feet NGVD)<br />
‐20<br />
‐40<br />
‐60<br />
‐80<br />
‐100<br />
50<br />
40<br />
30<br />
20<br />
10<br />
00<br />
Scenario Year<br />
Scenario 1 Scenario 2 Scenario 3a Scenario 3b Scenario 4
SSF‐02 Simulated Groundwater Elevation, Model Layer 1<br />
40<br />
Design Drought<br />
D.5-164<br />
Simulated Grou undwater Elevation (feet NGVD)<br />
30<br />
20<br />
10<br />
0<br />
‐10<br />
‐20<br />
‐30<br />
‐40<br />
50<br />
40<br />
30<br />
20<br />
10<br />
00<br />
Scenario Year<br />
Scenario 1 Scenario 2 Scenario 3a Scenario 3b Scenario 4
SB‐12 Simulated Groundwater Elevation, Model Layer 1<br />
40<br />
Design Drought<br />
D.5-165<br />
Simulated Grou undwater Elevation (feet NGVD)<br />
30<br />
20<br />
10<br />
0<br />
‐10<br />
‐20<br />
‐30<br />
‐40<br />
50<br />
40<br />
30<br />
20<br />
10<br />
00<br />
Scenario Year<br />
Scenario 1 Scenario 2 Scenario 3a Scenario 3b Scenario 4
SWM‐GS‐M Simulated Groundwater Elevation, Model Layer 4<br />
25<br />
Design Drought<br />
D.5-166<br />
Simulated Grou undwater Elevation (feet NGVD)<br />
20<br />
15<br />
10<br />
5<br />
0<br />
‐5<br />
‐10<br />
50<br />
40<br />
30<br />
20<br />
10<br />
00<br />
Scenario Year<br />
Scenario 1 Scenario 2 Scenario 3a Scenario 3b Scenario 4
Ortega_MW Simulated Groundwater Elevation, Model Layer 4<br />
25<br />
Design Drought<br />
D.5-167<br />
Simulated Grou undwater Elevation (feet NGVD)<br />
20<br />
15<br />
10<br />
5<br />
0<br />
‐5<br />
‐10<br />
50<br />
40<br />
30<br />
20<br />
10<br />
00<br />
Scenario Year<br />
Scenario 1 Scenario 2 Scenario 3a Scenario 3b Scenario 4
<strong>San</strong>tiago‐S Simulated Groundwater Elevation, Model Layer 4<br />
25<br />
Design Drought<br />
D.5-168<br />
Simulated Grou undwater Elevation (feet NGVD)<br />
20<br />
15<br />
10<br />
5<br />
0<br />
‐5<br />
‐10<br />
‐15<br />
‐20<br />
50<br />
40<br />
30<br />
20<br />
10<br />
00<br />
Scenario Year<br />
Scenario 1 Scenario 2 Scenario 3a Scenario 3b Scenario 4
LMMW‐4S Simulated Groundwater Elevation, Model Layer 4<br />
30<br />
Design Drought<br />
D.5-169<br />
Simulated Grou undwater Elevation (feet NGVD)<br />
20<br />
10<br />
0<br />
‐10<br />
‐20<br />
‐30<br />
‐40<br />
‐50<br />
50<br />
40<br />
30<br />
20<br />
10<br />
00<br />
Scenario Year<br />
Scenario 1 Scenario 2 Scenario 3a Scenario 3b Scenario 4
LMMW‐5S Simulated Groundwater Elevation, Model Layer 3<br />
50<br />
Design Drought<br />
D.5-170<br />
Simulated Grou undwater Elevation (feet NGVD)<br />
40<br />
30<br />
20<br />
10<br />
0<br />
‐10<br />
‐20<br />
50<br />
40<br />
30<br />
20<br />
10<br />
00<br />
Scenario Year<br />
Scenario 1 Scenario 2 Scenario 3a Scenario 3b Scenario 4<br />
Note: At the location of LMMW‐5S, the model does not contain layer 4. Layer 3 is presented in order to show the deepest layer response.
Harding Park Simulated Groundwater Elevation, Model Layer 4<br />
40<br />
Design Drought<br />
D.5-171<br />
Simulated Grou undwater Elevation (feet NGVD)<br />
20<br />
0<br />
‐20<br />
‐40<br />
‐60<br />
‐80<br />
50<br />
40<br />
30<br />
20<br />
10<br />
00<br />
Scenario Year<br />
Scenario 1 Scenario 2 Scenario 3a Scenario 3b Scenario 4
Olympic‐MW Simulated Groundwater Elevation, Model Layer 4<br />
20<br />
Design Drought<br />
D.5-172<br />
Simulated Grou undwater Elevation (feet NGVD)<br />
0<br />
‐20<br />
‐40<br />
‐60<br />
‐80<br />
‐100<br />
50<br />
40<br />
30<br />
20<br />
10<br />
00<br />
Scenario Year<br />
Scenario 1 Scenario 2 Scenario 3a Scenario 3b Scenario 4
DC‐3 Simulated Groundwater Elevation, Model Layer 4<br />
0<br />
Design Drought<br />
D.5-173<br />
Simulated Grou undwater Elevation (feet NGVD)<br />
‐50<br />
‐100<br />
‐150<br />
‐200<br />
‐250<br />
50<br />
40<br />
30<br />
20<br />
10<br />
00<br />
Scenario Year<br />
Scenario 1 Scenario 2 Scenario 3a Scenario 3b Scenario 4
DC‐A‐St Simulated Groundwater Elevation, Model Layer 4<br />
0<br />
Design Drought<br />
D.5-174<br />
Simulated Grou undwater Elevation (feet NGVD)<br />
‐50<br />
‐100<br />
‐150<br />
‐200<br />
‐250<br />
50<br />
40<br />
30<br />
20<br />
10<br />
00<br />
Scenario Year<br />
Scenario 1 Scenario 2 Scenario 3a Scenario 3b Scenario 4
D.5-175<br />
Simulated Grou undwater Elevation (feet NGVD)<br />
‐30<br />
‐60<br />
‐90<br />
‐120<br />
‐150<br />
‐180<br />
‐210<br />
‐240<br />
‐270<br />
Cyp_Lawn_2 Simulated Groundwater Elevation, Model Layer 4<br />
Design Drought<br />
‐300<br />
50<br />
40<br />
30<br />
20<br />
10<br />
00<br />
Scenario Year<br />
Scenario 1 Scenario 2 Scenario 3a Scenario 3b Scenario 4
SSF‐02 Simulated Groundwater Elevation, Model Layer 4<br />
0<br />
Design Drought<br />
D.5-176<br />
Simulated Grou undwater Elevation (feet NGVD)<br />
‐50<br />
‐100<br />
‐150<br />
‐200<br />
‐250<br />
‐300<br />
‐350<br />
‐400<br />
50<br />
40<br />
30<br />
20<br />
10<br />
00<br />
Scenario Year<br />
Scenario 1 Scenario 2 Scenario 3a Scenario 3b Scenario 4
SB‐12 Simulated Groundwater Elevation, Model Layer 4<br />
‐100<br />
Design Drought<br />
D.5-177<br />
Simulated Grou undwater Elevation (feet NGVD)<br />
‐150<br />
‐200<br />
‐250<br />
‐300<br />
‐350<br />
‐400<br />
50<br />
40<br />
30<br />
20<br />
10<br />
00<br />
Scenario Year<br />
Scenario 1 Scenario 2 Scenario 3a Scenario 3b Scenario 4