Sensitivity Analysis
Sensitivity Analysis
Sensitivity Analysis

Create successful ePaper yourself
Turn your PDF publications into a flip-book with our unique Google optimized e-Paper software.
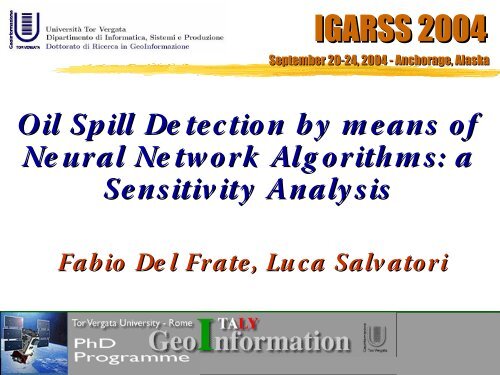
IGARSS 2004<br />
September 20-24, 2004 - Anchorage, Alaska<br />
Oil Spill De te c tio n b y m e ans of o f<br />
Ne ur al Ne tw o r k Alg o r ith m s : a<br />
Se nsitiv ity Analy s is<br />
Fab io De l Fr ate , Lu c a Salv ato r i
Sea Oil Pollution<br />
Oil spills over the sea surface pollute the marine environment to a varying<br />
degree during large oil tanker accidents.<br />
But the total oil pollution worldwide is mainly due to illegal dumping as oil<br />
released from ships that clean their tanks.<br />
Map of illegal dumping in 1999.<br />
N° of SAR images analy sed = 1600<br />
N° of oil spill detected = 1638<br />
(JRC / Institute for the Protection and Security of the Citizen)
Oil Spill Detection from SAR Images<br />
Radar cross section mainly due to short<br />
gravity and gravity-capillary waves (1 ÷ 10<br />
1<br />
cm), according to the Bragg scattering theory.<br />
The presence of an oil film on the sea surface<br />
damps these kinds of waves reducing the<br />
measured backscattering energy (Marangoni<br />
theory).<br />
Pixel histogram of the polluted region:<br />
Number<br />
of point<br />
Grey levels
Oil Spill Detection from SAR Images<br />
However, careful image analysis is<br />
required because dark areas might<br />
also be caused by natural<br />
phenomena.<br />
Low wi nd region<br />
Atmospheric front<br />
natural sea slicks<br />
particular atmospheric conditions<br />
locally low winds<br />
Current v ortex<br />
Oil spill<br />
These phenomena are called.<br />
“look-alikes”<br />
Oil spill close to a<br />
ship<br />
Oil Spill<br />
modifi ed by<br />
wi nd
Classification by means of Neural Networks<br />
Neural Networks have already demonstrated their effectiveness in<br />
discriminating between “ real ” oil spills and “ look-alikes ”<br />
It is necessary to extract some salient features which characterize the<br />
selected dark spot (slicks “ ”)and that will be included in the neural<br />
network input vector.<br />
The featurescan be of three different types .<br />
• Containing information on the backscattering intensity(in dB)<br />
gradientalong the border of the dark spot.<br />
• Containing information on the backscattering intensity values in<br />
the dark spot and/or in the background.<br />
• Containing information on the geometry and the shape of the<br />
dark spot.
The Local Wind Speed<br />
In this work we considered an additional feature containing information<br />
on the local wind speed (WS).<br />
The wind speed is the responsible of the short gravity and of the gravitycapillary<br />
wave, so it can strongly influence the appearance of the oil<br />
slicks in the SAR images.<br />
•Wind Speed calculated by inverting theCMOD4 model<br />
•WS < 2- 3 m/ s<br />
•7- 8 m/ s < WS < 15 m/ s<br />
•WS > 15 m/ s<br />
presence of dark areas<br />
due only to the lack of wi nd<br />
natur al slicks are di spersed<br />
whereas oil slicks remain still connected<br />
possibly emu lsion between water and oil<br />
→ oil slick inv isible to the SAR
Oil Spill Detection Algorithm<br />
σ 0 =<br />
Image<br />
Calibration<br />
1 ∑<br />
N<br />
N<br />
DN ij<br />
i , j=1<br />
2 1 K<br />
sin α<br />
sin α ref<br />
ROI<br />
Selection<br />
User<br />
interaction<br />
Wind<br />
direction<br />
estimation<br />
User<br />
interaction<br />
Wind Speed<br />
Computation<br />
by CMOD4<br />
Inversion<br />
Threshold<br />
Estimation<br />
Threshold<br />
Optimisation<br />
Output<br />
Georeferenced<br />
and<br />
GIS Compatible<br />
NN Object<br />
Classification<br />
Features<br />
Extraction<br />
User<br />
interaction<br />
Grouping of<br />
Different<br />
Objects<br />
GeoTiff and<br />
ESRI Shapefile<br />
Formats<br />
User<br />
interaction
Oil Spill Detection Algorithm<br />
ROI Selection<br />
and<br />
Slick<br />
Extraction<br />
Wind Speed<br />
Features<br />
Extraction and NN<br />
Slick Classifi cation
Oil Spill Detection Algorithm<br />
ROI Selection<br />
and<br />
Slick<br />
Extraction<br />
Wind Speed<br />
Features<br />
Extraction and NN<br />
Slick Classifi cation
Oil Spill Detection Algorithm<br />
ROI Selection<br />
and<br />
Slick<br />
Extraction<br />
Wind Speed<br />
Features<br />
Extraction and NN<br />
Slick Classifi cation<br />
Neural Network response
The Training of the Neural Network<br />
Starting from an archive of about 70 ERS-SAR images mainly taken<br />
over the Mediterranean basin in the time period between 1996 and 2003<br />
we extracted 189 dark objects, 111 oil spills and 78 look-alikes.<br />
A : Are a<br />
P: Pe rim e te r<br />
C: Co m p le xity<br />
S: Spre adin g<br />
Geometric<br />
al<br />
featur es<br />
1<br />
MLP (Multi Layer Perceptron)<br />
networ k wi th topology 12- 8- 8- 1<br />
BSd: Ba c k g ro un d Sd.<br />
OSd: Obj e c t Sd.<br />
ConMe: Me an c o ntras t<br />
ConMax: Max c o n tras t<br />
GSd: Gr adie nt Sd.<br />
GMe: Me an Gr adie nt<br />
GMax: Max Gr adie nt<br />
WS: Wind Spe e d<br />
Phy sical<br />
featur es<br />
Wind<br />
Speed<br />
12<br />
1 = oil spill<br />
0 = look<br />
alike<br />
RMS = 0.22 709<br />
Misclassified<br />
Samples = 3/ 60
Toward Automatic Oil Spill Detection<br />
Image<br />
Calibration<br />
External<br />
Geographic<br />
Inf ormation<br />
Land<br />
Masking<br />
Dark Object<br />
Detection<br />
Grouping of<br />
Near<br />
Objects<br />
Estimation of<br />
an Optimum<br />
Threshold<br />
Output<br />
Georeferenced<br />
and<br />
GIS Compatible<br />
GeoTiff and<br />
ESRI Shapefile<br />
Formats<br />
NN Object<br />
Classification<br />
Features<br />
Extraction<br />
Same Features<br />
wi thout Wind Speed
Automatic Oil Spill Detection<br />
a) SAR Image<br />
b) Detection of Dark Objects<br />
c) Identification of the Oil Spills
The <strong>Sensitivity</strong> <strong>Analysis</strong><br />
•Importance of correctly managing the edge detection utilities.<br />
(Correct threshold estimation)<br />
•In a fully automatic toolit is reasonable to suppose that the S/N ratio may<br />
significantly decrease. But loss of accuracy acceptable considering the<br />
importance of an automatic algorithm which can work autonomously and<br />
continuously<br />
•A selection of the most important inputs might eliminate unnecessary or<br />
misleading inputs.<br />
Sensitiv ity Analy sis (we considered two methods).
The <strong>Sensitivity</strong> <strong>Analysis</strong> – First Methodology<br />
Network performance in terms of rmse and of misclassification rate, removing, in turn, one of the input<br />
All 12 inputs<br />
11<br />
inputs<br />
wi thou<br />
t:<br />
A<br />
P<br />
C<br />
S<br />
Osd<br />
BSd<br />
ConMa<br />
x<br />
ConMe<br />
GMax<br />
GMe<br />
GSd<br />
WS<br />
RMS<br />
0.22 70 9<br />
0.23 98 7<br />
0.22 89 4<br />
0.23 57 4<br />
0.23 64 2<br />
0.24 05 5<br />
0.39 81 1<br />
0.23 41 6<br />
0.23 32 7<br />
0.23 11 2<br />
0.22 90 6<br />
0.24 40 6<br />
0.22 76 5<br />
Misclassifi<br />
ed sampl es<br />
ov er a total<br />
of 60<br />
sampl es<br />
3<br />
3.9<br />
3.2<br />
3.4<br />
3.1<br />
4<br />
13<br />
3.5<br />
3.5<br />
3.8<br />
3.1<br />
4<br />
3.8<br />
Δ% (RMS)<br />
+ 5.62%<br />
+ 0.81%<br />
+ 3.81<br />
+ 4.1%<br />
+ 5.92%<br />
+ 75.31 %<br />
+ 3.11%<br />
+ 2.72 %<br />
+ 1.77%<br />
+ 0.87%<br />
+ 7.47%<br />
+ 0.24%<br />
Δ%<br />
(mi sclassifi cati<br />
on<br />
rate)<br />
+ 30%<br />
+ 6.66 6%<br />
+ 13.33 %<br />
+ 3.33%<br />
+ 33.33 %<br />
+ 433 .33 %<br />
+ 16.66 %<br />
+ 16.66 %<br />
+ 26.66 %<br />
+ 3.33%<br />
+ 33.33 %<br />
+ 26.66 %<br />
•Decrease of the of the<br />
classifi cation accuracy<br />
•= > Ability of the NNs to<br />
constructiv ely use the<br />
different pi eces of<br />
inf ormation.<br />
•In most cases, the<br />
wor sening does not<br />
exceed the v alue of 10%<br />
in terms of rmse.<br />
•Most significant<br />
exception is represented<br />
BSd.<br />
•In general ph y sical<br />
features seem to be mor e<br />
signifi cant then
The <strong>Sensitivity</strong> <strong>Analysis</strong> – Second Methodology<br />
The Extended Pruni ng Procedure<br />
1) Evaluation of the relative importance of connections<br />
2) Removal of the weakest connection<br />
3) The procedure is prolonged to the input layer until 11 of the 12 initial<br />
inputs are removed<br />
…<br />
…<br />
…<br />
…<br />
…<br />
…
The <strong>Sensitivity</strong> <strong>Analysis</strong> – Second Methodology<br />
The results are in good agreement with the first analysis.<br />
1<br />
Pruning Procedure:<br />
Order of Remov al<br />
BSd, GSd, OSd, WS<br />
•BSd feature is the last one to be removed during<br />
the input units elimination process.<br />
2<br />
3<br />
ConMax, ConMe, P,<br />
A<br />
C, S, GMax, GMe<br />
•Also the information content brought in by wind<br />
speed is important.<br />
In agreement with the fact that the general<br />
conditions of the sea surface surrounding the slicks<br />
affects the actual capability of the SAR to detect<br />
the slicks.
Conclusions and Future Developments<br />
•A new algorithm for the oil spill detection which consider also the wind speed<br />
information has been realized.<br />
•The neural network created has been able to correctly discriminate over a set of<br />
independent examples between oil spills and look-alikes with a largely acceptable<br />
rate of success<br />
•The possibility of making the oil spill detection completely automatic has also<br />
been explored, producing a prototypal system, and is still matter of study.<br />
•A new technique of sensitivity analysis, based on an extended pruning procedure,<br />
has been carried out together whit a more “ classical ” one.<br />
Both the analysis pointed out that, in general, the information content of physical<br />
parameters seems to be larger than the one of geometrical and shape parameters.<br />
•The designed procedure can process both ERS and ENVISAT imagery, but<br />
they can be easily adapted to other formats.