Full Text (PDF) - Official Documents
Full Text (PDF) - Official Documents
Full Text (PDF) - Official Documents

Create successful ePaper yourself
Turn your PDF publications into a flip-book with our unique Google optimized e-Paper software.
30 Part Two Managing the expansion of the Academies Programme<br />
Figure 8<br />
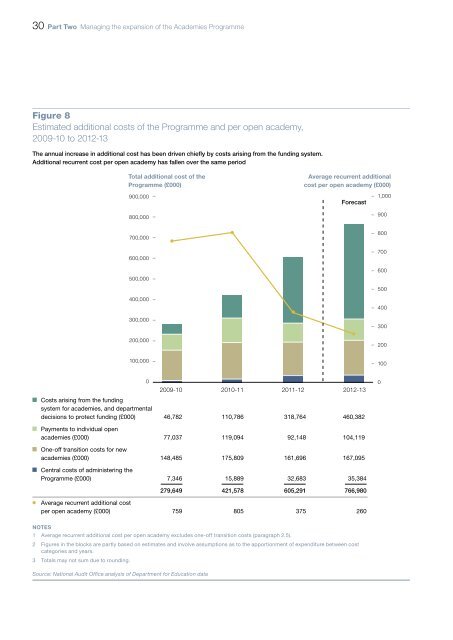
Estimated additional costs of the Programme and per open academy,<br />
2009-10 to 2012-13<br />
The annual increase in additional cost has been driven chiefly by costs arising from the funding system.<br />
Additional recurrent cost per open academy has fallen over the same period<br />
Total additional cost of the<br />
Programme (£000)<br />
Average recurrent additional<br />
cost per open academy (£000)<br />
900,000<br />
800,000<br />
Forecast<br />
1,000<br />
900<br />
700,000<br />
800<br />
600,000<br />
500,000<br />
400,000<br />
300,000<br />
700<br />
600<br />
500<br />
400<br />
300<br />
200,000<br />
200<br />
100,000<br />
100<br />
0<br />
2009-10 2010-11 2011-12 2012-13<br />
Costs arising from the funding<br />
system for academies, and departmental<br />
decisions to protect funding (£000) 46,782 110,786 318,764 460,382<br />
0<br />
Payments to individual open<br />
academies (£000) 77,037 119,094 92,148 104,119<br />
One-off transition costs for new<br />
academies (£000) 148,485 175,809 161,696 167,095<br />
Central costs of administering the<br />
Programme (£000) 7,346 15,889 32,683 35,384<br />
279,649 421,578 605,291 766,980<br />
Average recurrent additional cost<br />
per open academy (£000) 759 805 375 260<br />
NOTES<br />
1 Average recurrent additional cost per open academy excludes one-off transition costs (paragraph 2.5).<br />
2 Figures in the blocks are partly based on estimates and involve assumptions as to the apportionment of expenditure between cost<br />
categories and years.<br />
3 Totals may not sum due to rounding.<br />
Source: National Audit Office analysis of Department for Education data