Lesson #4 - Flowcharting - Publish
Lesson #4 - Flowcharting - Publish
Lesson #4 - Flowcharting - Publish

Create successful ePaper yourself
Turn your PDF publications into a flip-book with our unique Google optimized e-Paper software.
UNIT 1 – LESSON 4<br />
Flow Charts<br />
Flow charts are easy-to-understand diagrams showing how steps in a process fit<br />
together. This makes them useful tools for communicating how processes work, and<br />
for clearly documenting how a particular job is done. Furthermore, the act of mapping<br />
a process out in flow chart format helps you clarify your understanding of the process,<br />
and helps you think about where the process can be improved.<br />
A flow chart can therefore be used to:<br />
• Define and analyze processes.<br />
• Build a step-by-step picture of the process for analysis, discussion, or<br />
communication.<br />
• Define, standardize or find areas for improvement in a process<br />
Also, by conveying the information or processes in a step-by-step flow, you can then<br />
concentrate more intently on each individual step, without feeling overwhelmed by the<br />
bigger picture.<br />
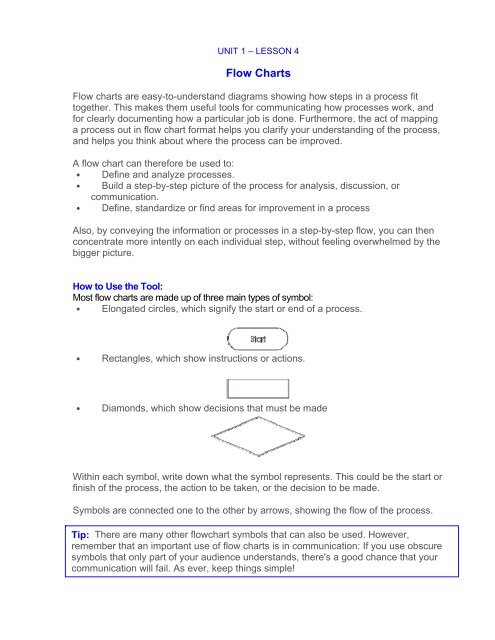
How to Use the Tool:<br />
Most flow charts are made up of three main types of symbol:<br />
• Elongated circles, which signify the start or end of a process.<br />
• Rectangles, which show instructions or actions.<br />
• Diamonds, which show decisions that must be made<br />
Within each symbol, write down what the symbol represents. This could be the start or<br />
finish of the process, the action to be taken, or the decision to be made.<br />
Symbols are connected one to the other by arrows, showing the flow of the process.<br />
Tip: There are many other flowchart symbols that can also be used. However,<br />
remember that an important use of flow charts is in communication: If you use obscure<br />
symbols that only part of your audience understands, there's a good chance that your<br />
communication will fail. As ever, keep things simple!
Drawing a Flow Chart:<br />
To draw the flow chart, brainstorm process tasks, and list them in the order they occur. Ask<br />
questions such as "What really happens next in the process?" and "Does a decision need to<br />
be made before the next step?" or "What approvals are required before moving on to the next<br />
task?"<br />
Start the flow chart by drawing the elongated circle shape, and labeling it "Start".<br />
Then move to the first action or question, and draw a rectangle or diamond<br />
appropriately. Write the action or question down, and draw an arrow from the start<br />
symbol to this shape.<br />
Get information<br />
Make decision<br />
Work through your whole process, showing actions and decisions appropriately in the<br />
order they occur, and linking these together using arrows to show the flow of the<br />
process. Where a decision needs to be made, draw arrows leaving the decision<br />
diamond for each possible outcome, and label them with the outcome. And remember<br />
to show the end of the process using an elongated circle labeled "Finish".<br />
Finally, challenge your flow chart. Work from step to step asking yourself if you have<br />
correctly represented the sequence of actions and decisions involved in the process.<br />
And then (if you're looking to improve the process) look at the steps identified and<br />
think about whether work is duplicated, whether other steps should be involved, and<br />
whether the right people are doing the right jobs.<br />
Tip:<br />
Flow charts can quickly become so complicated that you can't show them on one<br />
piece of paper. This is where you can use "connectors" (shown as numbered<br />
circles) where the flow moves off one page, and where it moves onto another. By<br />
using the same number for the off-page connector and the on-page connector, you<br />
show that the flow is moving from one page to the next.
Example:<br />
The example below shows part of a simple flow chart which helps receptionists route<br />
incoming phone calls to the correct department in a company:<br />
Key Points:<br />
Flow charts are simple diagrams that map out a process so that it can easily be<br />
communicated to other people.<br />
To draw a flowchart…<br />
1. Brainstorm the tasks and decisions made during a process, and write them<br />
down in order.<br />
2. Map these out in flow chart format using appropriate symbols for the start and<br />
end of a process, for actions to be taken and for decisions to be made.<br />
3. Challenge your flow chart to make sure that it's an accurate representation of<br />
the process, and that that it represents the most efficient way of doing the job.
Practice: Flowcharts<br />
1. The end of the semester has arrived. There is a procedure in place to<br />
determine the outcome for each student. The teacher calculates the term<br />
mark, grades the summative project and scores the final exam. The overall<br />
average is calculated as: 70% term mark, 15% project and 15% exam.<br />
Provide a flowchart that illustrates this process.<br />
2. Provide a flowchart that illustrates a procedure to update a bankbook after a<br />
single transaction. There are two types of transactions: deposit or withdrawal.<br />
Your procedure should get the beginning balance, the transaction type, and the<br />
transaction amount. It should output the beginning balance, transaction type<br />
and amount, and the ending balance. Translate your flowchart into<br />
pseudocode.<br />
3. Technically speaking, the ALU (Arithmetic Logic Unit) in a computer is not<br />
capable of multiplying. In order to multiply two integers (except when powers<br />
of 2 are involved), the computer executes a series of additions: the<br />
multiplicand is added to itself one less time than the value of the multiplier.<br />
Provide the flowchart and pseudocode for this algorithm.<br />
Challenge:<br />
Develop an algorithm for solving the system of linear equations:<br />
ax + by = c<br />
dx + ey = f