Ch 5 Fair Game Review - pg 1 &2 of pdf - the Stowe School District
Ch 5 Fair Game Review - pg 1 &2 of pdf - the Stowe School District
Ch 5 Fair Game Review - pg 1 &2 of pdf - the Stowe School District

Create successful ePaper yourself
Turn your PDF publications into a flip-book with our unique Google optimized e-Paper software.
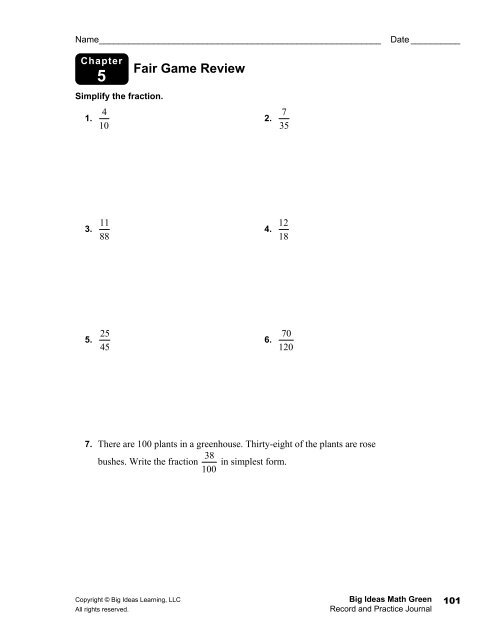
Name_________________________________________________________<br />
Date __________<br />
<strong>Ch</strong>apter<br />
5<br />
Simplify <strong>the</strong> fraction.<br />
1.<br />
4<br />
10<br />
<strong>Fair</strong> <strong>Game</strong> <strong>Review</strong><br />
2.<br />
7<br />
35<br />
3.<br />
11<br />
88<br />
4. 12<br />
18<br />
5.<br />
25<br />
45<br />
6.<br />
70<br />
120<br />
7. There are 100 plants in a greenhouse. Thirty-eight <strong>of</strong> <strong>the</strong> plants are rose<br />
bushes. Write <strong>the</strong> fraction 38 in simplest form.<br />
100<br />
Copyright © Big Ideas Learning, LLC<br />
All rights reserved.<br />
Big Ideas Math Green<br />
Record and Practice Journal<br />
101
Name _________________________________________________________<br />
Date _________<br />
<strong>Ch</strong>apter<br />
5<br />
<strong>Fair</strong> <strong>Game</strong> <strong>Review</strong> (continued)<br />
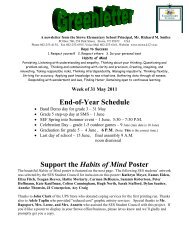
The double bar graph shows <strong>the</strong> sales <strong>of</strong> a clothing store over two days.<br />
Sales<br />
Dollars<br />
1400<br />
1200<br />
1000<br />
800<br />
600<br />
400<br />
200<br />
1308 Day 1 Day 2<br />
1254<br />
1119 1132<br />
1027 980<br />
846 956<br />
689 721<br />
Accessories<br />
Outerwear<br />
Pants<br />
Shirts<br />
Shoes<br />
Item<br />
8. How many more shirts did <strong>the</strong> store sell on Day 1 than on Day 2?<br />
9. Which item had <strong>the</strong> largest change in sales?<br />
10. Which item had <strong>the</strong> highest sales total for <strong>the</strong> two days?<br />
102<br />
Big Ideas Math Green Copyright © Big Ideas Learning, LLC<br />
Record and Practice Journal<br />
All rights reserved.
Name_________________________________________________________<br />
Date __________<br />
5.1<br />
Ratios<br />
For use with Activity 5.1<br />
Essential Question How can you tell whe<strong>the</strong>r two recipes make <strong>the</strong><br />
same mixture?<br />
A ratio is a comparison <strong>of</strong> two quantities using division.<br />
1 ACTIVITY: Comparing Recipes<br />
Work with a partner.<br />
Ratios<br />
4 ft 3 c 20 sec 120 mi<br />
2 ft 5 c 45 sec 80 mi<br />
You are making some homemade hand lotion. You find three recipes.<br />
Do <strong>the</strong> recipes make <strong>the</strong> same lotion? How can you tell?<br />
Recipe 1<br />
Recipe 3<br />
Melt <strong>the</strong>se ingredients over<br />
low heat:<br />
2 3 cup <strong>of</strong> apricot oil<br />
Recipe 2<br />
1<br />
low heat:<br />
3 cup <strong>of</strong> cocoa butter<br />
Melt <strong>the</strong>se ingredients over 1 1 2 cups <strong>of</strong> apricot oil<br />
1 teaspoon <strong>of</strong> lanolin<br />
1 low heat:<br />
2 3 cup <strong>of</strong> cocoa butter<br />
2 ounce <strong>of</strong> grated beeswax<br />
1 cup <strong>of</strong> apricot oil<br />
1 2 cup <strong>of</strong> cocoa butter<br />
1 1 2 teaspoons <strong>of</strong> lanolin<br />
3 4<br />
When cool, add <strong>the</strong> following:<br />
2 3 cup <strong>of</strong> rosewater<br />
1 3 cup <strong>of</strong> aloe vera gel<br />
2 drops <strong>of</strong> rose oil<br />
1 Vitamin E capsule<br />
Whip toge<strong>the</strong>r until <strong>the</strong><br />
mixture resembles lotion.<br />
When cool, add <strong>the</strong> following:<br />
1 cup <strong>of</strong> rosewater<br />
cup <strong>of</strong> aloe vera gel<br />
3 drops <strong>of</strong> rose oil<br />
1 1 2 Vitamin E capsules<br />
1 2<br />
ounce <strong>of</strong> grated beeswax<br />
Whip toge<strong>the</strong>r until <strong>the</strong><br />
mixture resembles lotion.<br />
Melt <strong>the</strong>se ingredients over<br />
2 teaspoons <strong>of</strong> lanolin<br />
1 ounce <strong>of</strong> grated beeswax<br />
When cool, add <strong>the</strong> following:<br />
1 1 2 cups <strong>of</strong> rosewater<br />
2 3 cup <strong>of</strong> aloe vera gel<br />
4 drops <strong>of</strong> rose oil<br />
2 Vitamin E capsules<br />
Whip toge<strong>the</strong>r until <strong>the</strong><br />
mixture resembles lotion.<br />
Copyright © Big Ideas Learning, LLC<br />
All rights reserved.<br />
Big Ideas Math Green<br />
Record and Practice Journal<br />
103
Name _________________________________________________________<br />
Date _________<br />
5.1 Ratios (continued)<br />
2 ACTIVITY: Finding Equivalent Ratios<br />
Work with a partner.<br />
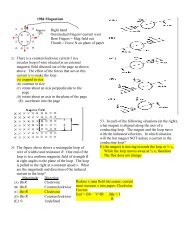
a. The ratios 1 , 2 , 3 , 4 , 5 ,<br />
6 are all equivalent. Explain how you can use <strong>the</strong><br />
3 6 9 12 15 18<br />
multiplication table to show this.<br />
1 2 3 4 5 6 7 8 9 10 11 12<br />
1 1 2 3 4 5 6 7 8 9 10 11 12<br />
2 2 4 6 8 10 12 14 16 18 20 22 24<br />
3 3 6 9 12 15 18 21 24 27 30 33 36<br />
4 4 8 12 16 20 24 28 32 36 40 44 48<br />
5 5 10 15 20 25 30 35 40 45 50 55 60<br />
6 6 12 18 24 30 36 42 48 54 60 66 72<br />
7 7 14 21 28 35 42 49 56 63 70 77 84<br />
8 8 16 24 32 40 48 56 64 72 80 88 96<br />
9 9 18 27 36 45 54 63 72 81 90 99 108<br />
10 10 20 30 40 50 60 70 80 90 100 110 120<br />
11 11 22 33 44 55 66 77 88 99 110 121 132<br />
12 12 24 36 48 60 72 84 96 108 120 132 144<br />
Use <strong>the</strong> multiplication table to find 10 more ratios that are equivalent to each ratio.<br />
Original<br />
Fraction<br />
b.<br />
c.<br />
2<br />
7<br />
8<br />
3<br />
104<br />
Big Ideas Math Green Copyright © Big Ideas Learning, LLC<br />
Record and Practice Journal<br />
All rights reserved.
Name_________________________________________________________<br />
Date __________<br />
5.1 Ratios (continued)<br />
d. Explain why <strong>the</strong> strategy in parts (a), (b), and (c) works to produce<br />
equivalent ratios.<br />
What Is Your Answer?<br />
3. You and two friends are making cookies. You make <strong>the</strong> original recipe<br />
amount. One <strong>of</strong> your friends makes a “half batch.” Your o<strong>the</strong>r friend makes<br />
a “double batch.” If you taste a spoonful <strong>of</strong> cookie dough from each batch,<br />
will <strong>the</strong>y all taste <strong>the</strong> same? Explain your reasoning.<br />
4. IN YOUR OWN WORDS How can you tell whe<strong>the</strong>r two recipes make <strong>the</strong><br />
same mixture? Give an example.<br />
Copyright © Big Ideas Learning, LLC<br />
All rights reserved.<br />
Big Ideas Math Green<br />
Record and Practice Journal<br />
105
Name _________________________________________________________<br />
Date _________<br />
5.1<br />
Practice<br />
For use after Lesson 5.1<br />
Write <strong>the</strong> ratio in three ways. Explain what <strong>the</strong> ratio means.<br />
1. forks to spoons 2. toothbrushes : toothpaste<br />
Write <strong>the</strong> ratio in simplest form.<br />
3.<br />
48<br />
36<br />
4. 14<br />
50<br />
5.<br />
9<br />
72<br />
Write two equivalent ratios for <strong>the</strong> given ratio.<br />
5<br />
6.<br />
7. 15 20<br />
7<br />
8. 12<br />
60<br />
9. There are 22 events at an indoor track and field meet. The ratio <strong>of</strong> track<br />
events to field events is 8 : 3. How many <strong>of</strong> <strong>the</strong> events are track events?<br />
Explain how you found your answer.<br />
10. The directions for making orange juice from concentrate call for one part<br />
concentrate to three parts water. How much water is needed with four cans<br />
<strong>of</strong> concentrate?<br />
106<br />
Big Ideas Math Green Copyright © Big Ideas Learning, LLC<br />
Record and Practice Journal<br />
All rights reserved.
Name_________________________________________________________<br />
Date __________<br />
5.2<br />
Rates<br />
For use with Activity 5.2<br />
Essential Question How can you use rates to describe changes in<br />
real-life problems?<br />
1 ACTIVITY: Stories Without Words<br />
Work with a partner. Each diagram shows a story problem.<br />
a.<br />
• Describe <strong>the</strong> story problem in your own words.<br />
• Write <strong>the</strong> rate indicated by <strong>the</strong> diagram. What are <strong>the</strong> units?<br />
• Rewrite <strong>the</strong> rate so that <strong>the</strong> denominator is 1. (This is a unit rate).<br />
80 mi<br />
b.<br />
Copyright © Big Ideas Learning, LLC<br />
All rights reserved.<br />
Big Ideas Math Green<br />
Record and Practice Journal<br />
107
Population<br />
Name _________________________________________________________<br />
Date _________<br />
5.2 Rates (continued)<br />
c.<br />
Population <strong>of</strong> Sunny Acres Condos<br />
1400<br />
1200<br />
1000<br />
800<br />
600<br />
400<br />
200<br />
0<br />
2005 2006 2007 2008 2009 2010 2011<br />
Year<br />
d.<br />
January 2008<br />
Length: 3 ft<br />
January 2012<br />
Length: 7 ft<br />
2 ACTIVITY: <strong>Ch</strong>anging Units in a Rate<br />
Work with a partner.<br />
• <strong>Ch</strong>ange <strong>the</strong> units <strong>of</strong> <strong>the</strong> rate by multiplying by a “Magic One.”<br />
Show your work.<br />
• Write your answer as a unit rate.<br />
Original Rate Magic One New Units Unit Rate<br />
a.<br />
$120<br />
h<br />
× = =<br />
$<br />
1 min<br />
108<br />
Big Ideas Math Green Copyright © Big Ideas Learning, LLC<br />
Record and Practice Journal<br />
All rights reserved.
Name_________________________________________________________<br />
Date __________<br />
5.2 Rates (continued)<br />
b.<br />
$3<br />
min<br />
× = =<br />
$<br />
1 h<br />
c.<br />
36 people<br />
yr<br />
× = =<br />
people<br />
1 mo<br />
d.<br />
12 in.<br />
ft<br />
× = =<br />
1 yd<br />
in.<br />
e.<br />
60 mi<br />
h<br />
× = =<br />
1 min<br />
mi<br />
f.<br />
2 ft<br />
week<br />
× = =<br />
1 yr<br />
ft<br />
What Is Your Answer?<br />
3. One problem-solving strategy is called Working Backwards. What does this<br />
mean? How can this strategy be used to find <strong>the</strong> rates in Activity 2?<br />
4. IN YOUR OWN WORDS How can you use rates to describe changes in<br />
real-life problems? Give two examples.<br />
Copyright © Big Ideas Learning, LLC<br />
All rights reserved.<br />
Big Ideas Math Green<br />
Record and Practice Journal<br />
109
Name _________________________________________________________<br />
Date _________<br />
5.2<br />
Practice<br />
For use after Lesson 5.2<br />
Write a rate that represents <strong>the</strong> situation.<br />
1. 110 calories in 20 minutes 2. $5.00 for 2 boxes<br />
Write a unit rate for <strong>the</strong> situation.<br />
3. 9 strikes in 3 innings 4. 117 points in 13 minutes<br />
Decide whe<strong>the</strong>r <strong>the</strong> rates are equivalent.<br />
30 beats 90 beats<br />
5.<br />
,<br />
20 seconds 60 seconds<br />
6.<br />
15 pages 10 pages<br />
,<br />
20 minutes 15 minutes<br />
7. One <strong>of</strong> <strong>the</strong> valves on <strong>the</strong> Hoover Dam releases 40,000 gallons <strong>of</strong> water<br />
per second. What is <strong>the</strong> rate, in gallons per minute?<br />
8. A 12-pack <strong>of</strong> water costs $3.90. A 20-pack <strong>of</strong> water costs $5.60.<br />
a. Which is <strong>the</strong> better buy? Why?<br />
b. You need to buy water for 60 people. How much money will you save<br />
by buying <strong>the</strong> better buy?<br />
110<br />
Big Ideas Math Green Copyright © Big Ideas Learning, LLC<br />
Record and Practice Journal<br />
All rights reserved.
Name_________________________________________________________<br />
Date __________<br />
5.3<br />
Solving Rate Problems<br />
For use with Activity 5.3<br />
Essential Question How can you use rates to help show how<br />
a country can save valuable natural resources?<br />
1 ACTIVITY: Saving Water<br />
The nursery rhyme above is an example <strong>of</strong> how<br />
a small problem can lead to a big problem.<br />
Work with a partner. Here is an example about a<br />
leaky faucet that drips a drop <strong>of</strong> water every 2 seconds.<br />
a. Complete <strong>the</strong> table showing how many drops <strong>of</strong> water<br />
drip in different amounts <strong>of</strong> time. Write each entry<br />
in <strong>the</strong> table as a rate in drops per unit <strong>of</strong> time.<br />
Drops 1<br />
Time 2 sec 1 min 1 h 1 d 1 wk 1 yr<br />
b. How many gallons <strong>of</strong> water are wasted in a year?<br />
Show your work.<br />
80 drops = 1 teaspoon<br />
96 teaspoons = 1 pint<br />
8 pints = 1 gallon<br />
Copyright © Big Ideas Learning, LLC<br />
Big Ideas Math Green 111<br />
All rights reserved. Record and Practice Journal
Name_________________________________________________________<br />
Date __________<br />
5.3 Solving Rate Problems (continued)<br />
c. There are about 125 million homes and apartments in <strong>the</strong> United States.<br />
Suppose every one <strong>of</strong> <strong>the</strong>m has a leaky faucet. How many gallons <strong>of</strong><br />
water will be wasted each year? Explain your reasoning.<br />
d. The swimming pool shown at <strong>the</strong> right holds<br />
about 15,000 gallons <strong>of</strong> water. How many<br />
times could this pool be filled by <strong>the</strong> amount<br />
<strong>of</strong> water you found in part (c)?<br />
36 ft<br />
4 ft<br />
14 ft<br />
2 ACTIVITY: Saving Gasoline<br />
Work with a partner.<br />
Drivers in <strong>the</strong> United States use about 400 million gallons <strong>of</strong> gasoline each day.<br />
There are about 250 million automobiles in <strong>the</strong> United States. The typical fuel<br />
economy <strong>of</strong> automobiles is about 17 miles per gallon.<br />
32 m<strong>pg</strong> City<br />
40 m<strong>pg</strong> Highway<br />
20 m<strong>pg</strong> City<br />
29 m<strong>pg</strong> Highway<br />
13 m<strong>pg</strong> City<br />
17 m<strong>pg</strong> Highway<br />
10.3 gallon tank<br />
17.5 gallon tank<br />
25.0 gallon tank<br />
112<br />
Big Ideas Math Green Copyright © Big Ideas Learning, LLC<br />
Record and Practice Journal<br />
All rights reserved.
Name_________________________________________________________<br />
Date __________<br />
5.3 Solving Rate Problems (continued)<br />
a. How much gas does <strong>the</strong> typical automobile in <strong>the</strong> United States use<br />
each day?<br />
Gallons per car<br />
per day<br />
=<br />
Number <strong>of</strong><br />
gallons used<br />
Number<br />
<strong>of</strong> cars<br />
b. How many miles is a typical automobile in <strong>the</strong> United States driven each day?<br />
Miles per car<br />
per day<br />
=<br />
Gallons per car<br />
×<br />
per day<br />
Fuel economy<br />
c. How much gas can be saved each day by increasing <strong>the</strong> typical fuel economy<br />
in <strong>the</strong> United States to 25 miles per gallon? Explain your reasoning.<br />
What Is Your Answer?<br />
3. IN YOUR OWN WORDS How can you use rates to help show how a<br />
country can save valuable natural resources? Give an example.<br />
4. RESEARCH In Activities 1 and 2, rates are used to show how to save<br />
water and gasoline. Think <strong>of</strong> ano<strong>the</strong>r example in which rates can be used<br />
in efforts to save a natural resource.<br />
Copyright © Big Ideas Learning, LLC<br />
Big Ideas Math Green 113<br />
All rights reserved. Record and Practice Journal
Name _________________________________________________________<br />
Date _________<br />
5.3<br />
Practice<br />
For use after Lesson 5.3<br />
Find <strong>the</strong> distance.<br />
1. d = ______, r = 45 mi/h, t = 5 h 2. d = ______, r = 7 ft/sec, t = 12 sec<br />
Find <strong>the</strong> speed.<br />
3. 200 meters in 25 seconds 4. 250 miles in 4 hours<br />
Find how far <strong>the</strong> object travels in <strong>the</strong> given amount <strong>of</strong> time.<br />
5. 10 hours 6. 3 minutes<br />
Moves 138 miles every 3 hours<br />
Moves 3.75 meters<br />
in 25 seconds.<br />
7. You can type 115 words in three minutes. About how many words can you<br />
type in seven minutes?<br />
8. You leave your house at 1 P.M. to go to a wedding. The ceremony starts at<br />
5 P.M. and is 350 miles away. You drive 65 miles per hour. Will you make<br />
it to <strong>the</strong> wedding on time? If so, how much time do you have to spare? If<br />
not, how late will you be?<br />
114<br />
Big Ideas Math Green Copyright © Big Ideas Learning, LLC<br />
Record and Practice Journal<br />
All rights reserved.
Name_________________________________________________________<br />
Date __________<br />
5.4<br />
Mean<br />
For use with Activity 5.4<br />
Essential Question What is <strong>the</strong> meaning <strong>of</strong> <strong>the</strong> word “average?” How<br />
can you find <strong>the</strong> average <strong>of</strong> a collection <strong>of</strong> numbers?<br />
1 ACTIVITY: Describing an Average<br />
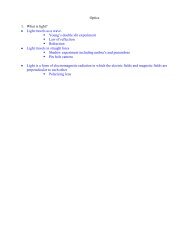
Work with a partner. A women’s<br />
shoe store is analyzing its stock.<br />
The bar graph shows <strong>the</strong> percent<br />
<strong>of</strong> women’s shoes in stock for<br />
each size.<br />
a. What percent <strong>of</strong> <strong>the</strong> shoes<br />
1 1<br />
are size 7 , 8, or 8 ?<br />
2 2<br />
Percent<br />
16<br />
14<br />
12<br />
10<br />
8<br />
6<br />
4<br />
2<br />
Women’s Shoes<br />
0<br />
4 1 5 1 6 1 7 1 8 1 9 1 10 1 11 1 2 5 2 6 2 7 2 8 2 9 2 10 2 11 2<br />
Shoe Size<br />
b. There are 200 pairs <strong>of</strong> shoes in stock. c. What is <strong>the</strong> average shoe size<br />
How many are size 7?<br />
for <strong>the</strong> shoes in stock? Explain.<br />
Explain your reasoning.<br />
2 ACTIVITY: Describing a Collection <strong>of</strong> Shoe Sizes<br />
Work with a partner. A women’s shoe store has 20 customers with <strong>the</strong><br />
following sizes.<br />
6 1 2<br />
8 9 7 7 6 10 8 8 1 2<br />
11<br />
7 1 2<br />
8 1 2<br />
8 7 8 5 1 2<br />
6 9 8 8 1 2<br />
Copyright © Big Ideas Learning, LLC<br />
All rights reserved.<br />
Big Ideas Math Green<br />
Record and Practice Journal<br />
115
Name _________________________________________________________<br />
Date _________<br />
5.4 Mean (continued)<br />
a. Use a table or a graph to organize b. Write a short paragraph describing<br />
<strong>the</strong> shoe sizes <strong>of</strong> <strong>the</strong> 20 customers. <strong>the</strong> shoe sizes.<br />
c. Is <strong>the</strong> entire stock in <strong>the</strong> shoe store, as shown in Activity 1, well<br />
represented by <strong>the</strong>se 20 customers?<br />
3 ACTIVITY: Talking About Averages<br />
Work with a partner. Talk about <strong>the</strong> statement. What type <strong>of</strong> survey or<br />
research do you think was done to write each statement?<br />
a. The average height for men in <strong>the</strong> b. The average annual income for a family<br />
United States is 5 feet, 9 inches. in <strong>the</strong> United States is $52,000.<br />
c. The average fuel economy for a car in d. The average age <strong>of</strong> a person living in <strong>the</strong><br />
<strong>the</strong> United States is 17 miles per gallon. United States is 36.4 years.<br />
116<br />
Big Ideas Math Green Copyright © Big Ideas Learning, LLC<br />
Record and Practice Journal<br />
All rights reserved.
Name_________________________________________________________<br />
Date __________<br />
5.4 Mean (continued)<br />
e. The average amount <strong>of</strong> dog food eaten by a dog in <strong>the</strong> United States is<br />
1.2 pounds per day.<br />
What Is Your Answer?<br />
4. IN YOUR OWN WORDS What is <strong>the</strong> meaning <strong>of</strong> <strong>the</strong> word “average?”<br />
How can you find <strong>the</strong> average <strong>of</strong> a collection <strong>of</strong> numbers? Give two<br />
examples <strong>of</strong> averages.<br />
5. There are 5 students in <strong>the</strong> cartoon.<br />
Four <strong>of</strong> <strong>the</strong> students are 66 inches tall.<br />
One is 96 inches tall.<br />
a. How do you think <strong>the</strong> students<br />
decided <strong>the</strong>ir average height is<br />
6 feet?<br />
“Yup, <strong>the</strong> average height in<br />
our class is 6 feet.”<br />
b. Does a height <strong>of</strong> 6 feet seem like a good representation <strong>of</strong> <strong>the</strong> average<br />
height <strong>of</strong> <strong>the</strong> 5 students? Explain why or why not.<br />
Copyright © Big Ideas Learning, LLC<br />
All rights reserved.<br />
Big Ideas Math Green<br />
Record and Practice Journal<br />
117
Name _________________________________________________________<br />
Date _________<br />
5.4<br />
Practice<br />
For use after Lesson 5.4<br />
Find <strong>the</strong> mean <strong>of</strong> <strong>the</strong> data.<br />
1. Emails sent in <strong>the</strong> last 4 hours: 2. Magazine subscriptions sold this week:<br />
2, 5, 4, 5 3, 6, 7, 6, 7, 9, 11<br />
3.<br />
Books Brought Home<br />
Monday |<br />
Tuesday |||<br />
Wednesday ||||<br />
Thursday ||||<br />
Friday |<br />
4. The table shows <strong>the</strong> number <strong>of</strong> points scored by your team in each quarter<br />
<strong>of</strong> a football game. What is <strong>the</strong> mean number <strong>of</strong> points scored in a quarter?<br />
Quarter 1 2 3 4<br />
Points 3 14 10 0<br />
5. A group <strong>of</strong> 12 students has a mean height <strong>of</strong> 58 inches. Ano<strong>the</strong>r group <strong>of</strong><br />
6 students has a mean height <strong>of</strong> 52 inches. What is <strong>the</strong> mean height <strong>of</strong> <strong>the</strong><br />
18 students? Explain how you found your answer.<br />
118<br />
Big Ideas Math Green Copyright © Big Ideas Learning, LLC<br />
Record and Practice Journal<br />
All rights reserved.
Name_________________________________________________________<br />
Date __________<br />
5.5<br />
Median, Mode, and Range<br />
For use with Activity 5.5<br />
Essential Question Describe situations in real life where <strong>the</strong> mean is not<br />
a good representation <strong>of</strong> <strong>the</strong> average.<br />
1 ACTIVITY: Comparing Three Samples<br />
Work with a partner. Surveys are taken in three grade 6–12 schools. Make<br />
up a story about <strong>the</strong> three surveys. Find <strong>the</strong> mean for each survey. Do you<br />
think <strong>the</strong> mean is a good way to represent <strong>the</strong> “average”<br />
<strong>of</strong> each group? Why or why not?<br />
a.<br />
11 12 13 14 15 16 17 18<br />
Copyright © Big Ideas Learning, LLC<br />
All rights reserved.<br />
Big Ideas Math Green<br />
Record and Practice Journal<br />
119
Name _________________________________________________________<br />
Date _________<br />
5.5 Median, Mode, and Range (continued)<br />
b.<br />
11 12 13 14 15 16 17 18<br />
c.<br />
11 12 13 14 15 16 17 18<br />
120<br />
Big Ideas Math Green Copyright © Big Ideas Learning, LLC<br />
Record and Practice Journal<br />
All rights reserved.
Name_________________________________________________________<br />
Date __________<br />
5.5 Median, Mode, and Range (continued)<br />
2 ACTIVITY: When <strong>the</strong> Mean is Misleading<br />
Work with a partner. Read and re-read each statement. Think <strong>of</strong> a better<br />
way to represent <strong>the</strong> “average” so that <strong>the</strong> statement is not so misleading.<br />
a. Someone is trying to criticize a small high school by saying “Last year,<br />
<strong>the</strong> average age <strong>of</strong> <strong>the</strong> graduating class was 22 years old.” When you look<br />
into <strong>the</strong> facts, you find that <strong>the</strong> class had a senior citizen who went back<br />
to school to earn a diploma. Here are <strong>the</strong> ages for <strong>the</strong> class.<br />
18, 18, 18, 18, 18, 17, 18, 19, 18 ,18, 18, 18, 18, 74<br />
What percent <strong>of</strong> <strong>the</strong> ages are below <strong>the</strong> mean?<br />
b. There is a small town where most <strong>of</strong> <strong>the</strong> people are having a difficult time<br />
getting by because <strong>of</strong> low incomes. Someone is trying to ignore <strong>the</strong><br />
problem and writes an article in <strong>the</strong> newspaper saying “It is not so bad in<br />
<strong>the</strong> town. The average income for a family is $52,000 a year.” Here are<br />
<strong>the</strong> incomes.<br />
$20,000, $20,000, $20,000, $20,000, $30,000, $30,000, $30,000, $30,000,<br />
$40,000, $40,000, $40,000, $50,000, $50,000, $50,000, $310,000<br />
What percent <strong>of</strong> families have incomes below <strong>the</strong> mean?<br />
What Is Your Answer?<br />
3. IN YOUR OWN WORDS Describe situations in real life where <strong>the</strong> mean is<br />
not a good representation <strong>of</strong> <strong>the</strong> average. What measures (o<strong>the</strong>r than mean)<br />
can you use to describe an average?<br />
Copyright © Big Ideas Learning, LLC<br />
All rights reserved.<br />
Big Ideas Math Green<br />
Record and Practice Journal<br />
121
Name _________________________________________________________<br />
Date _________<br />
5.5<br />
Practice<br />
For use after Lesson 5.5<br />
Find <strong>the</strong> median, mode(s), and range <strong>of</strong> <strong>the</strong> data.<br />
1. 3, 2, 3, 6, 7, 5, 9 2. 12, 14, 15, 13, 12, 12, 15, 10, 14<br />
3. 15, 53, 34, 64, 28, 79, 66, 41 4. 3.4, 7.5, 8.8, 9.2, 3.4, 5.1, 7.5, 2.4, 8.3, 7.6<br />
5. Find <strong>the</strong> median, mode, and range <strong>of</strong> <strong>the</strong> number <strong>of</strong> dots in <strong>the</strong> Braille<br />
alphabet. Explain how you found your answers.<br />
The Braille Alphabet<br />
a b c d e f g h i j<br />
k l m n o p q r s t<br />
u v w x y z<br />
6. Your quiz scores are 17, 17, 16, 20, 18, 19, 17, 14, 19, and 20. Your teacher<br />
drops <strong>the</strong> lowest quiz score. How are <strong>the</strong> mean, median, mode, and range <strong>of</strong><br />
<strong>the</strong> points affected?<br />
122<br />
Big Ideas Math Green Copyright © Big Ideas Learning, LLC<br />
Record and Practice Journal<br />
All rights reserved.
Name_________________________________________________________<br />
Date __________<br />
5.6<br />
Analyzing Data Sets<br />
For use with Activity 5.6<br />
Essential Question How can you use tables and graphs to help<br />
organize data?<br />
1 ACTIVITY: Conducting an Experiment<br />
Work with a partner.<br />
a. Roll a number cube 20 times. Record your results in a tally chart.<br />
Tally<br />
1 2 3 4 5 6<br />
Key: | = 1 |||| = 5<br />
b. Make a bar graph <strong>of</strong> your totals.<br />
c. Go to <strong>the</strong> board and enter your totals in <strong>the</strong> class tally chart.<br />
d. Make a second bar graph showing <strong>the</strong> class totals. Compare and contrast<br />
<strong>the</strong> two bar graphs.<br />
Copyright © Big Ideas Learning, LLC<br />
All rights reserved.<br />
Big Ideas Math Green<br />
Record and Practice Journal<br />
123
Name _________________________________________________________<br />
Date _________<br />
5.6 Analyzing Data Sets (continued)<br />
2 ACTIVITY: Organizing Data<br />
Work with a partner. You are judging a paper airplane contest. Each contestant<br />
flies his or her paper airplane 20 times. Make a tally chart and a graph <strong>of</strong> <strong>the</strong><br />
distances.<br />
Complete <strong>the</strong> table and <strong>the</strong> graph using <strong>the</strong> data shown.<br />
20.5 ft, 24.5 ft, 18.5 ft, 19.5 ft, 21.0 ft, 14.0 ft, 12.5 ft, 20.5 ft, 17.5 ft, 24.9 ft,<br />
19.5 ft, 17.0 ft, 18.5 ft, 12.0 ft, 21.5 ft, 23.0 ft, 13.5 ft, 19.0 ft, 22.5 ft, 19.0 ft<br />
Interval Tally Total<br />
10.0–12.9<br />
13.0–15.9<br />
16.0–18.9<br />
19.0–21.9<br />
22.0–24.9<br />
Totals<br />
9<br />
8<br />
7<br />
6<br />
5<br />
4<br />
3<br />
2<br />
1<br />
0<br />
Paper Airplane Contest<br />
13.0−15.9<br />
10.0−12.9<br />
22.0−24.9<br />
19.0−21.9<br />
16.0−18.9<br />
Interval<br />
a. Make a different tally chart and graph <strong>of</strong> <strong>the</strong> distances using <strong>the</strong><br />
following intervals.<br />
10.0–11.9, 12.0–13.9, 14.0–15.9, 16.0–17.9,<br />
18.0–19.9, 20.0–21.9, 22.0–23.9, 24.0–25.9<br />
124<br />
Big Ideas Math Green Copyright © Big Ideas Learning, LLC<br />
Record and Practice Journal<br />
All rights reserved.
Name_________________________________________________________<br />
Date __________<br />
5.6 Analyzing Data Sets (continued)<br />
b. Which graph do you think represents <strong>the</strong> distances better? Explain.<br />
3 ACTIVITY: Developing an Experiment<br />
Work with a partner.<br />
a. Design and make a paper airplane from a single sheet <strong>of</strong><br />
1<br />
8 -by-11inch paper.<br />
2<br />
b. Fly <strong>the</strong> airplane 20 times. Keep track <strong>of</strong> <strong>the</strong> distance flown each time.<br />
Flight 1 2 3 4 5 6 7 8 9 10<br />
Distance<br />
Flight 11 12 13 14 15 16 17 18 19 20<br />
Distance<br />
c. Organize your results in a tally chart and a graph. What is <strong>the</strong> mean<br />
distance flown by <strong>the</strong> airplane?<br />
What Is Your Answer?<br />
4. IN YOUR OWN WORDS How can you use tables and graphs to help<br />
organize data? Give examples <strong>of</strong> careers in which <strong>the</strong> organization <strong>of</strong><br />
data is important.<br />
Copyright © Big Ideas Learning, LLC<br />
All rights reserved.<br />
Big Ideas Math Green<br />
Record and Practice Journal<br />
125
Name _________________________________________________________<br />
Date _________<br />
5.6<br />
Practice<br />
For use after Lesson 5.6<br />
Find <strong>the</strong> mean, median, and mode(s) <strong>of</strong> <strong>the</strong> data. <strong>Ch</strong>oose <strong>the</strong> measure that<br />
best represents <strong>the</strong> data. Explain your reasoning.<br />
1. 2, 32, 35, 35, 38, 29 2. 14, 26, 45, 43, 57<br />
Find <strong>the</strong> mean, median, and mode(s) <strong>of</strong> <strong>the</strong> data with and without <strong>the</strong> outlier.<br />
Describe <strong>the</strong> effect <strong>of</strong> <strong>the</strong> outlier on <strong>the</strong> measures <strong>of</strong> central tendency.<br />
3. 4, 15, 6, 12, 68, 12 4. 0, 54, 62, 64, 55, 55, 54, 62<br />
5. The data show your strokes for 18 holes <strong>of</strong> miniature golf.<br />
4, 5, 3, 3, 1, 2, 3, 2, 4, 8, 2, 4, 4, 5, 2, 3, 6, 2<br />
Find <strong>the</strong> mean, median, and mode(s) <strong>of</strong> <strong>the</strong> data. Which measure best<br />
represents <strong>the</strong> data? Explain your reasoning.<br />
6. The table shows <strong>the</strong> amount <strong>of</strong> time you spend practicing <strong>the</strong> piano in a week.<br />
Day Sun Mon Tues Wed Thurs Fri Sat<br />
Time<br />
(minutes)<br />
0 30 20 40 40 20 40<br />
Which measure best represents <strong>the</strong> data? Explain your reasoning.<br />
126<br />
Big Ideas Math Green Copyright © Big Ideas Learning, LLC<br />
Record and Practice Journal<br />
All rights reserved.