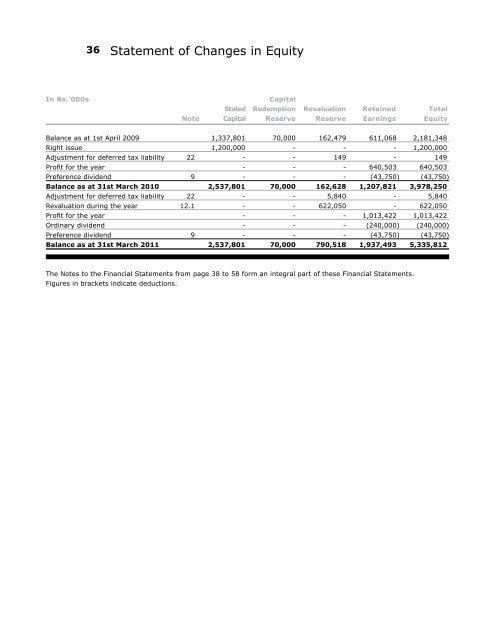
36 Statement of Changes in Equity In Rs.’000s Capital Stated Redemption Revaluation Retained Total Note Capital Reserve Reserve Earnings Equity Balance as at 1st April 2009 1,337,801 70,000 162,479 611,068 2,181,348 Right issue 1,200,000 - - - 1,200,000 Adjustment for deferred tax liability 22 - - 149 - 149 Profit for the year - - - 640,503 640,503 Preference dividend 9 - - - (43,750) (43,750) Balance as at 31st March 2010 2,537,801 70,000 162,628 1,207,821 3,978,250 Adjustment for deferred tax liability 22 - - 5,840 - 5,840 Revaluation during the year 12.1 - - 622,050 - 622,050 Profit for the year - - - 1,013,422 1,013,422 Ordinary dividend - - - (240,000) (240,000) Preference dividend 9 - - - (43,750) (43,750) Balance as at 31st March <strong>2011</strong> 2,537,801 70,000 790,518 1,937,493 5,335,812 The Notes to the Financial Statements from page 38 to 58 form an integral part of these Financial Statements. Figures in brackets indicate deductions.
37 Cash Flow Statement For the year ended 31st March Note <strong>2011</strong> 2010 In Rs.’000s Cash Flows from Operating Activities Profit before taxation 1,600,002 632,695 Adjustments for: Finance expenses 7 156,340 240,105 Depreciation on property, plant & equipment 12 130,330 125,357 Net inventory provisions <strong>and</strong> write offs 15.1 385 56,435 Amortisation of intangible assets 13 12,639 13,559 Interest cost capitalised 12 (537) (5,587) Adjustments made for property, plant <strong>and</strong> equipments 12 - 4,524 Provision for gratuity 21 17,613 7,063 Profit on disposal of property, plant & equipments 5 (543) (926) Exchange loss on revaluation of foreign currency term loans 2,484 - Interest income 5 (9,510) (1,606) Operating cash flow before working capital changes 1,909,203 1,071,619 Increase in inventories (136,973) (2,027) Increase in trade <strong>and</strong> other receivables (203,764) (184,871) Decrease / (increase) in amounts due from related companies 22,041 (17,488) Increase in trade <strong>and</strong> other payables 281,158 190,127 Decrease in amounts due to related companies (13,527) (59,548) Cash generated from operations 1,858,138 997,812 Finance expenses paid 7 (156,340) (240,105) Gratuity paid 21 (926) (1,177) Income tax paid (105,344) - Economic service charge paid (73,378) (17,676) Net cash generated from operating activities 1,522,150 738,854 Cash Flows from Investing Activities Purchase <strong>and</strong> construction of property, plant & equipment <strong>and</strong> Intangible assets 12 & 13 (668,682) (118,240) Proceeds from sale of property, plant & equipment 7,229 1,044 Agent deposits received 20.3 117,557 59,931 Agent deposits refunded 20.3 (1,069) (25,966) Long term investment 14 (739,671) (355,738) Interest received 5 9,510 1,606 Net cash used in investing activities (1,275,126) (437,363) Cash Flows from Financing Activities Proceeds from new shares issue - 1,200,000 Long term loan received 20.1 1,244,820 - Repayments of long term borrowings 20.1 (48,205) (37,447) Dividend paid (283,631) (43,895) Net cash generated from financing activities 912,984 1,118,658 Net increase in cash & cash equivalents 1,160,008 1,420,149 Cash & cash equivalents at the beginning of the year (180,129) (1,600,278) Cash & cash equivalents at the end of the year 979,879 (180,129) Analysis Cash & cash equivalents Cash & cash equivalents 1,099,878 151,545 Bank overdraft (119,999) (331,674) 979,879 (180,129) The Notes to the Financial Statements from page 38 to 58 form an integral part of these Financial Statements. Figures in brackets indicate deductions.