Crop Circle and Green Seeker NDVI SDI cotton Lubbock, 2008 - Fluid ...
Crop Circle and Green Seeker NDVI SDI cotton Lubbock, 2008 - Fluid ...
Crop Circle and Green Seeker NDVI SDI cotton Lubbock, 2008 - Fluid ...

Create successful ePaper yourself
Turn your PDF publications into a flip-book with our unique Google optimized e-Paper software.
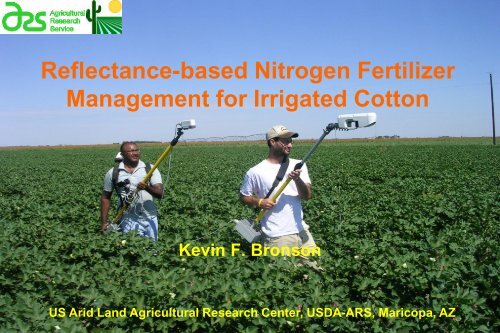
Reflectance-based Nitrogen Fertilizer<br />
Management for Irrigated Cotton<br />
Kevin F. Bronson<br />
US Arid L<strong>and</strong> Agricultural Research Center, USDA-ARS, Maricopa, AZ
Objectives<br />
• To compare two active spectroradiometers for<br />
in-season N status assessment of Subsurface<br />
Drip Irrigation (<strong>SDI</strong>) <strong>cotton</strong><br />
• To assess lint yields <strong>and</strong> N fertilizer use<br />
efficiency with two spectral reflectance based N<br />
management strategies compared to soil testbased<br />
N management in a <strong>SDI</strong> <strong>cotton</strong> system.
Materials & Methods
Nitrogen requirements for high-yielding <strong>cotton</strong><br />
Yield goal Nitrogen requirement 1<br />
bales/ac<br />
lb N/ac<br />
1.5 75<br />
2.0 100<br />
2.5 125<br />
3.0 150<br />
3.5 175<br />
1<br />
Nitrogen fertilizer plus 0-24 inch NO 3 -N
Methods<br />
• AFD 5065 B2FRR<br />
• Five N mgt treatments in RCB<br />
• Three replicates<br />
• H<strong>and</strong>-picking (1/000 ac) <strong>and</strong> yield<br />
mapping
Treatments<br />
• Soil test based N mgt (STB) 32-0-0 injected early square<br />
to mid bloom for 2.5 bale/ac yield goal (125 lb N/ac –<br />
0-24 in soil test NO 3 -N – irrigation water NO 3 )<br />
• 0.5 X Soil test based (0.5 STB)<br />
• 1.5 X Soil test based (1.5 STB)<br />
• Zero-N (1 plot/station/rep)<br />
• Reflectance-based mgt 1: initially 0.5 STB N rate, N<br />
injection rate adjusted upwards to STB rate when <strong>NDVI</strong><br />
REF1 is statistically < <strong>NDVI</strong> REF1.<br />
• Reflectance-based mgt 2 : initially STB N rate, N<br />
injection rate adjusted upwards to 1.5 STB rate when<br />
<strong>NDVI</strong> REF2 is statistically < <strong>NDVI</strong> 1.5 STB.
Percent reflectance<br />
<strong>Crop</strong>scan MSR 16<br />
• Passive sensor<br />
(natural light)<br />
• 16 waveb<strong>and</strong>s<br />
• Percent reflectance =<br />
Refltd irrad @ λ /<br />
Incoming irrad @ λ<br />
70<br />
60<br />
50<br />
40<br />
30<br />
20<br />
10<br />
0<br />
r450 r470 r500 r530 r550 r570 r600 r630 r650 r670 r700 r780 r820 r870 r1600 r170<br />
Wavelength (nm)
<strong>Green</strong><strong>Seeker</strong><br />
• Active sensor<br />
• 2 waveb<strong>and</strong>s, red (660<br />
nm) <strong>and</strong> NIR (770 nm)<br />
• 40 inches above canopy<br />
• Percent reflectance =<br />
Refltd irrad @ λ /<br />
Incoming irrad @ λ
<strong>Crop</strong><strong>Circle</strong><br />
• Active sensor<br />
• 2 waveb<strong>and</strong>s, amber<br />
(590 nm) <strong>and</strong> NIR (880<br />
nm)<br />
• 40 inches above canopy<br />
• Percent reflectance =<br />
Refltd irrad @ λ /<br />
Incoming irrad @ λ
Vegetative indices<br />
• Red <strong>NDVI</strong> = (R 770 -R 660 )/(R 770 +R 660 )<br />
• Amber <strong>NDVI</strong> = (R 880 -R 590 )/(R 880 +R 590 )<br />
R = percent reflectance at λ (nm)
8, 40-in<br />
rows<br />
Plot plan<br />
Station<br />
1<br />
Station<br />
2<br />
Station<br />
3<br />
Station<br />
4<br />
Station<br />
5<br />
Station<br />
6<br />
Station<br />
7<br />
Station<br />
8<br />
Station<br />
9<br />
Station<br />
10<br />
Station<br />
11<br />
Station<br />
12<br />
Station<br />
13<br />
Station<br />
14<br />
Station<br />
15<br />
0.5 STB REF1 STB REF2 1.5 STB 1.5 STB REF1 REF2 Zero STB 0.5 STB REF1 STB REF2 1.5STB<br />
Rep 1 Rep 1 Rep 1 Rep 1 Rep 1 Rep 2 Rep 2 Rep2 Rep 2 Rep 2 Rep 2 Rep3 Rep 3 Rep 3 Rep 3<br />
101 105 109 113 117 201 205 209 001 213 217 301 305 309 313<br />
600<br />
ft<br />
102 106 110 114 118 202 206 210 002 214 218 302 306 310 314<br />
103 107 111 115 119 203 207 211 003 215 219 303 307 311 315<br />
104 108 112 116 120 204 208 212 004 216 220 304 308 312 316
Results
Correlation of <strong>Crop</strong> <strong>Circle</strong> (CC) <strong>and</strong> <strong>Green</strong> <strong>Seeker</strong> (GS) <strong>NDVI</strong>,<br />
Biomass, Leaf N, Chlorophyll meter at mid-bloom sampling<br />
<strong>and</strong> Lint yields, <strong>Lubbock</strong>, TX 2007.<br />
N Rate<br />
CC<br />
<strong>NDVI</strong><br />
GS<br />
<strong>NDVI</strong><br />
Biomass<br />
Leaf<br />
N<br />
Chlor.<br />
Meter<br />
Lint<br />
Yield<br />
N rate 0.60** 0.69** 0.53** 0.63** 0.71** 0.23*<br />
CC <strong>NDVI</strong> 0.60** 0.57** 0.44* 0.55** 0.50** 0.48**<br />
GS <strong>NDVI</strong> 0.69** 0.57** 0.36* 0.62** 0.65** 0.27*<br />
Biomass 0.53** 0.44* 0.36* 0.46** 0.35* 0.33*<br />
Leaf N 0.63** 0.55** 0.62** 0.46** 0.65** 0.32*<br />
Chlor. Meter 0.71** 0.50** 0.65** 0.35* 0.65**<br />
Lint yield 0.23* 0.48** 0.27* 0.33* 0.32*<br />
**P
<strong>NDVI</strong><br />
0.9<br />
<strong>Crop</strong> <strong>Circle</strong> <strong>and</strong> <strong>Green</strong> <strong>Seeker</strong> <strong>NDVI</strong> <strong>SDI</strong> <strong>cotton</strong><br />
<strong>Lubbock</strong>, 2007<br />
0.8<br />
0.7<br />
0.6<br />
0.5<br />
CC_STB<br />
CC_ Zero<br />
0.4<br />
CC_Refl-based<br />
GS_STB<br />
0.3<br />
GS_Zero<br />
GS_Refl-based<br />
0.2<br />
177 187 197 207 217 227<br />
Julian Days
<strong>NDVI</strong><br />
0.9<br />
<strong>Crop</strong> <strong>Circle</strong> <strong>and</strong> <strong>Green</strong> <strong>Seeker</strong> <strong>NDVI</strong> <strong>SDI</strong> <strong>cotton</strong><br />
<strong>Lubbock</strong>, <strong>2008</strong><br />
0.8<br />
0.7<br />
0.6<br />
0.5<br />
0.4<br />
0.3<br />
CC_STB<br />
CC_Refl-based<br />
GS_Zero<br />
CC_Zero<br />
GS_STB<br />
GS_Refl-based<br />
0.2<br />
177 187 197 207 217 227<br />
Julian Days
<strong>NDVI</strong><br />
0.9<br />
<strong>Crop</strong> <strong>Circle</strong> <strong>and</strong> <strong>Green</strong> <strong>Seeker</strong> <strong>NDVI</strong> <strong>SDI</strong> <strong>cotton</strong><br />
<strong>Lubbock</strong>, 2009<br />
0.8<br />
0.7<br />
0.6<br />
0.5<br />
CC_STB<br />
CC Zero<br />
0.4<br />
CC_Refl-based<br />
GS_STB<br />
0.3<br />
GS_Zero<br />
GS_Refl-based<br />
0.2<br />
170 180 190 200 210 220<br />
Julian Days
Spring soil nitrate, N fertilizer amounts injected, well water<br />
nitrate, <strong>and</strong> total N supply, <strong>Lubbock</strong>, TX, 2007<br />
N treatment<br />
Spring soil<br />
NO 3<br />
1<br />
N fertilizer<br />
injected 2<br />
Well water-<br />
NO 3<br />
Total N<br />
supply<br />
--------------------------- lb N/ac ---------------------------<br />
1.5*Soil test-based 18 a 120 20 158<br />
Reflectance strategy 2 22 a 90 20 132<br />
Soil test-based 24 a 80 20 124<br />
Reflectance strategy 1 17 a 62 20 99<br />
0.5*Soil test-based 18 a 40 20 78<br />
Zero-N 18 a 0 20 38<br />
1 0-24 inches<br />
2 Injected from 11 July to 11 August
First open boll biomass, N accumulation, N fertilizer recovery<br />
efficiency, seed <strong>and</strong> lint yields as affected by nitrogen<br />
management, <strong>Lubbock</strong>, TX, 2007.<br />
N treatment<br />
N fertilizer<br />
injected a<br />
Total N<br />
uptake<br />
Recovery<br />
efficiency Biomass Seed<br />
yield<br />
Lint<br />
yield<br />
---- lb N/ac ----- % --------------- lb/ac --------------<br />
1.5*STB 120 - - - 2379 a 1347 a<br />
Refl- strategy 2 90 131 a* 62 a 7666 a 2253 a 1330 a<br />
STB 80 128 a 65 a 7704 a 2241 a 1326 a<br />
Refl.strategy 1 62 120 a 72 a 7561 a 2350 a 1372 a<br />
0.5*STB 40 - - - 2270 a 1365 a<br />
Zero-N 0 76 - 5362 1692 1062<br />
a<br />
Injected from 11 July to 11 August<br />
*Means in a column followed by the same letter are not significantly different at P = 0.05
First open boll biomass, N accumulation, N fertilizer recovery<br />
efficiency, seed <strong>and</strong> lint yields as affected by nitrogen<br />
management, <strong>Lubbock</strong>, TX, <strong>2008</strong>.<br />
N treatment<br />
N fertilizer<br />
injected 1<br />
Total N<br />
uptake<br />
Recovery<br />
efficiency<br />
Biomass<br />
Seed<br />
yield<br />
Lint<br />
yield<br />
--------- lb N/ac ------ % --------------- lb/ac -------------<br />
1.5*STB 94 138 a 75 a 7993 a 2553 a 1532 a<br />
Refl.strategy 2 62 - - - 2572 a 1586 a<br />
STB 62 130 a 101 a 7546 a 2455 a 1495 a<br />
Refl.strategy 1 46 110 b 94 a 6587 b 2542 a 1538 a<br />
0.5*STB 31 - - - 2129 b 1283 b<br />
Zero-N 0 67 - 4968 1640 1006<br />
a<br />
Injected from 26 June to 16 July <strong>and</strong> 5 to 8 August<br />
*Means in a column followed by the same letter are not significantly different at P = 0.05
First open boll biomass, N accumulation, N fertilizer recovery<br />
efficiency, seed <strong>and</strong> lint yields as affected by nitrogen<br />
management, <strong>Lubbock</strong>, TX, 2009<br />
N treatment<br />
N fertilizer<br />
injected 1<br />
Total N<br />
uptake<br />
Recovery<br />
Efficiency Biomass Seed<br />
yield<br />
Lint<br />
yield<br />
---------- lb N/ac ------- % --------------- lb/ac -------------<br />
1.5*STB 72 124 a 47 a 7761 a 2526 a 1527 a<br />
Refl.strategy 2 48 - - - 2487 ab 1509 a<br />
STB 48 114 a 49 a 7670 a 2471 ab 1522 a<br />
Refl.strategy 1 24 109 a 77a 8058 a 2581 a 1610 a<br />
0.5*STB 24 - - - 2326 b 1487 a<br />
Zero-N 0 90 - 6962 2029 1336
Lint yields as affected by cultivar <strong>and</strong> nitrogen management,<br />
<strong>Lubbock</strong>, TX, 2010<br />
Cultivar<br />
N management FM9180 ST5458 Means<br />
----------------------------- lb/ac --------------------------------<br />
Reflectance-based<br />
(100 lb UAN-N/ac)<br />
Soil test-based<br />
(50 lb UAN-N/ac)<br />
1435 1602 1519<br />
1351 1513 1432<br />
Zero-N 1047 1136 1091<br />
Means 1277 1417<br />
Cultivar **<br />
Nitrogen **<br />
Cultivar x Nitrogen<br />
NS
Summary of three years of Refl. Strategy 1 N fertilizer<br />
management in <strong>SDI</strong> <strong>cotton</strong>, <strong>Lubbock</strong>, TX, 2007-2009<br />
Units 2007 <strong>2008</strong> 2009<br />
0-24 inch NO 3 lb /ac 17 30 18<br />
Starter N fertilizer lb N/ac 0 10 22<br />
Irrigation NO 3 lb N/ac 20 30 22<br />
Injected fertilizer lb N/ac 62 46 24<br />
Recovery efficiency % 72 94 77<br />
Lint yield lb /ac 1372 1538 1610
Summary of three years of soil test based strategy for N<br />
fertilizer management in <strong>SDI</strong> <strong>cotton</strong>, <strong>Lubbock</strong>, TX, 2007-2009<br />
Units 2007 <strong>2008</strong> 2009<br />
0-24 inch NO 3 lb /ac 24 35 21<br />
Starter N fertilizer lb N/ac 0 10 22<br />
Irrigation NO 3 lb N/ac 20 30 22<br />
Injected fertilizer lb N/ac 80 62 48<br />
Recovery efficiency % 65 101 49<br />
Lint yield lb /ac 1326 1495 1522
Economic optimum nitrogen rate (EONR) for lint, seed <strong>and</strong><br />
lint + seed, <strong>Lubbock</strong>, TX, 2007-09 ($0.50/lb lint, $0.55/lb N)<br />
Quadratic-plateau<br />
for lint<br />
Quadratic-plateau<br />
for seed<br />
Quadratic-plateau<br />
for dollar value of<br />
lint + seed<br />
Reflectance-1 N rate<br />
--------------------------------------------------- lb N ac -1 --------------------------------------------------<br />
2007<br />
35 41 38 62<br />
<strong>2008</strong><br />
68 57 71 46<br />
2009<br />
22 29 23 24
Conclusions<br />
• Recovery efficiency of daily injection of N<br />
between early square <strong>and</strong> mid bloom was 62 to<br />
94 %.<br />
• Reflectance-based N management strategy1<br />
saved 22, 26, <strong>and</strong> 50 % N compared to soil test<br />
based management during 2007, <strong>2008</strong>, <strong>and</strong><br />
2009, respectively.<br />
• EONRs ranged from 22 to 68 lb N/ac for lint.<br />
• Need to test for center pivots <strong>and</strong> furrow<br />
irrigation