Rice: a high or low glycemic index food?1'2 - American Journal of ...
Rice: a high or low glycemic index food?1'2 - American Journal of ...
Rice: a high or low glycemic index food?1'2 - American Journal of ...

Create successful ePaper yourself
Turn your PDF publications into a flip-book with our unique Google optimized e-Paper software.
<strong>Rice</strong>: a <strong>high</strong> <strong>or</strong> <strong>low</strong> <strong>glycemic</strong> <strong>index</strong> <strong>food</strong>?1’2<br />
.Jaiwite Brand )fj//j Edna Pang, and Lindsai’ Brainall<br />
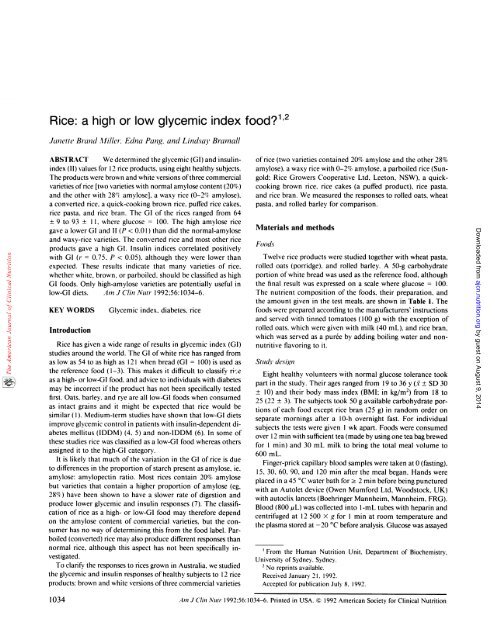
ABSTRACT We determined the <strong>glycemic</strong> (GI) and insulin<strong>index</strong><br />
(II) values f<strong>or</strong> 12 rice products, using eight healthy subjects.<br />
The products were brown and white versions <strong>of</strong>three commercial<br />
varieties <strong>of</strong>rice [two varieties with n<strong>or</strong>mal amylose content (20%)<br />
and the other with 28 amylose]. a waxy rice (0-2% amylose),<br />
a converted rice, a quick-cooking brown rice, puffed rice cakes,<br />
rice pasta. and rice bran. The GI <strong>of</strong> the rices ranged from 64<br />
± 9 to 93 ± 1 1. where glucose = 100. The <strong>high</strong> amylose rice<br />
gave a <strong>low</strong>er GI and II (P < 0.0 1 ) than did the n<strong>or</strong>mal-amylose<br />
and waxy-rice varieties. The converted rice and most other rice<br />
products gave a <strong>high</strong> GI. Insulin indices c<strong>or</strong>related positively<br />
with GI (r = 0.75. P < 0.05). although they were <strong>low</strong>er than<br />
expected. These results indicate that many varieties <strong>of</strong> rice,<br />
whether white, brown, <strong>or</strong> parboiled, should be classified as <strong>high</strong><br />
GI <strong>food</strong>s. Only <strong>high</strong>-amylose varieties are potentially useful in<br />
<strong>low</strong>-GI diets. Am J C/ui Nutr 1992:56:1034-6.<br />
KEY WORDS Glycemic <strong>index</strong>, diabetes, rice<br />
Introduction<br />
<strong>Rice</strong> has given a wide range <strong>of</strong> results in <strong>glycemic</strong> <strong>index</strong> (GI)<br />
studies around the w<strong>or</strong>ld. The GI <strong>of</strong>white rice has ranged from<br />
as <strong>low</strong> as 54 to as <strong>high</strong> as 121 when bread (GI = 100) is used as<br />
the reference <strong>food</strong> (1-3). This makes it difficult to classify ri’e<br />
as a <strong>high</strong>- <strong>or</strong> <strong>low</strong>-GI <strong>food</strong>. and advice to individuals with diabetes<br />
may be inc<strong>or</strong>rect if the product has not been specifically tested<br />
first. Oats, barley, and rye are all <strong>low</strong>-GI <strong>food</strong>s when consumed<br />
as intact grains and it might be expected that rice would be<br />
similar ( 1). Medium-term studies have shown that <strong>low</strong>-GI diets<br />
improve <strong>glycemic</strong> control in patients with insulin-dependent diabetes<br />
mellitus (IDDM) (4. 5) and non-IDDM (6). In some <strong>of</strong><br />
these studies rice was classified as a <strong>low</strong>-GI <strong>food</strong> whereas others<br />
assigned it to the <strong>high</strong>-GI categ<strong>or</strong>y.<br />
It is likely that much <strong>of</strong> the variation in the GI <strong>of</strong> rice is due<br />
to differences in the prop<strong>or</strong>tion <strong>of</strong>starch present as amylose. ie.<br />
amylose: amylopectin ratio. Most rices contain 20% amylose<br />
but varieties that contain a <strong>high</strong>er prop<strong>or</strong>tion <strong>of</strong> amylose (eg,<br />
28%) have been shown to have a s<strong>low</strong>er rate <strong>of</strong> digestion and<br />
produce <strong>low</strong>er <strong>glycemic</strong> and insulin responses (7). The classification<br />
<strong>of</strong> rice as a <strong>high</strong>- <strong>or</strong> <strong>low</strong>-GI <strong>food</strong> may theref<strong>or</strong>e depend<br />
on the amylose content <strong>of</strong> commercial varieties, but the consumer<br />
has no way <strong>of</strong>determining this from the <strong>food</strong> label. Parboiled<br />
(converted) rice may also produce different responses than<br />
n<strong>or</strong>mal rice, although this aspect has not been specifically investigated.<br />
To clarify the responses to rices grown in Australia, we studied<br />
the <strong>glycemic</strong> and insulin responses <strong>of</strong>healthy subjects to 12 rice<br />
products: brown and white versions <strong>of</strong>three commercial varieties<br />
<strong>of</strong>rice (two varieties contained 20% amylose and the other 28%<br />
amylose), a waxy rice with 0-2% amylose, a parboiled rice (Sungold;<br />
<strong>Rice</strong> Growers Cooperative Ltd. Leeton, NSW), a quickcooking<br />
brown rice. rice cakes (a puffed product), rice pasta,<br />
and rice bran. We measured the responses to rolled oats, wheat<br />
pasta. and rolled barley f<strong>or</strong> comparison.<br />
Materials and methods<br />
[‘ODdS<br />
Twelve rice products were studied together with wheat pasta,<br />
rolled oats (p<strong>or</strong>ridge), and rolled barley. A 50-g carbohydrate<br />
p<strong>or</strong>tion <strong>of</strong>white bread was used as the reference <strong>food</strong>, although<br />
the final result was expressed on a scale where glucose = 100.<br />
The nutrient composition <strong>of</strong> the <strong>food</strong>s, their preparation, and<br />
the amount given in the test meals, are shown in Table 1. The<br />
<strong>food</strong>s were prepared acc<strong>or</strong>ding to the manufacturers’ instructions<br />
and served with tinned tomatoes (100 g) with the exception <strong>of</strong><br />
rolled oats. which were given with milk (40 mL), and rice bran,<br />
which was served as a pur#{233}eby adding boiling water and nonnutritive<br />
flav<strong>or</strong>ing to it.<br />
Studi<br />
c/L’sign<br />
Eight healthy volunteers with n<strong>or</strong>mal glucose tolerance took<br />
part in the study. Their ages ranged from 19 to 36 y (1 ± SD 30<br />
± 10) and their body mass <strong>index</strong> (BMI; in kg/m2) from 18 to<br />
25 (22 ± 3). The subjects took 50 g available carbohydrate p<strong>or</strong>tions<br />
<strong>of</strong> each <strong>food</strong> except rice bran (25 g) in random <strong>or</strong>der on<br />
separate m<strong>or</strong>nings after a 10-h overnight fast. F<strong>or</strong> individual<br />
subjects the tests were given 1 wk apart. Foods were consumed<br />
over 1 2 mm with sufficient tea (made by using one tea bag brewed<br />
f<strong>or</strong> 1 mm) and 30 mL milk to bring the total meal volume to<br />
600 mL.<br />
Finger-prick capillary blood samples were taken at 0 (fasting),<br />
15, 30, 60, 90, and 120 mm after the meal began. Hands were<br />
placed in a 45 #{176}C water bath f<strong>or</strong> 2 mm bef<strong>or</strong>e being punctured<br />
with an Autolet device (Owen Mumf<strong>or</strong>d Ltd. Woodstock, UK)<br />
with autoclix lancets (Boehringer Mannheim, Mannheim, FRG).<br />
Blood (800 tL) was collected into l-mL tubes with heparin and<br />
centrifuged at 12 500 X g f<strong>or</strong> 1 mm at room temperature and<br />
the plasma st<strong>or</strong>ed at -20 #{176}C bef<strong>or</strong>e analysis. Glucose was assayed<br />
I From the Human Nutrition Unit. Department <strong>of</strong> Biochemistry,<br />
University <strong>of</strong> Sydney. Sydney.<br />
2 No reprints available.<br />
Received Ianuarv 21. 1992.<br />
Accepted f<strong>or</strong> publication July 8. 1992.<br />
Downloaded from ajcn.nutrition.<strong>or</strong>g by guest on August 9, 2014<br />
1034 Am J C/in Nuir 1992:56:1034-6. Printed in USA. © 1992 <strong>American</strong> Society f<strong>or</strong> Clinical Nutrition
GLYCEMIC INDEX OF RICE 1035<br />
TABLE 1<br />
The composition and weight <strong>of</strong>the <strong>food</strong>s<br />
Foods<br />
Protein<br />
(nitrogen X 6.25) Fat<br />
Carbohydrate<br />
by difference<br />
Weight <strong>of</strong> uncooked<br />
50-g carbohydrate<br />
p<strong>or</strong>tion<br />
Preparation<br />
% % % g<br />
Calrose white 5.7 0.5 79.9 62.6 Boiled f<strong>or</strong> 14 mm<br />
Calrose brown 6.6 2.7 75.6 66.1 Boiled f<strong>or</strong> 35 mm<br />
Pelde white 6.4 0.5 79.6 62.8 Boiled f<strong>or</strong> 14 mm<br />
Pelde brown 7.2 2.9 75.4 66.3 Boiled f<strong>or</strong> 30 mm<br />
Pelde (parboiled)5 7.0 1.0 79.4 63.0 Boiled f<strong>or</strong> 14 mm<br />
Doongara white (<strong>high</strong> amylose) 8.0 0.6 77.5 64.5 Boiled f<strong>or</strong> 14 mm<br />
Doongara brown (<strong>high</strong> amylose) 8.7 2.5 74. 1 67.5 Boiled f<strong>or</strong> 30 mm<br />
Sunbrown Quick 8.3 3.0 77.4 64.6 Boiled f<strong>or</strong> 16 mm<br />
Waxy rice (0-2% amylose) 7.3 0.8 77.2 64.8 Boiled f<strong>or</strong> 14 mm<br />
<strong>Rice</strong> cakes 8.0 2.7 8 1.5 6 1.3 Puffed product<br />
<strong>Rice</strong> bran 13.7 22.4 47.4 52.8t Pur#{233}ed with boiling<br />
water and flav<strong>or</strong>ing<br />
Brown rice pasta 8.9 2.6 75.5 66.2 Boiled f<strong>or</strong> 16 mm<br />
Wheat pasta 12. 1 0.2 75.9 65.9 Boiled f<strong>or</strong> 20 mm<br />
Rolled oats 8.9 9.7 68.8 72.7 Boiled f<strong>or</strong> 10 mm<br />
Rolled barley 7.5 2.4 76.9 65.0 Boiled f<strong>or</strong> 10 mm<br />
S Sungold: <strong>Rice</strong> Growers Cooperative Ltd. Leeton, NSW.<br />
t Weight <strong>of</strong> 25-g carbohydrate p<strong>or</strong>tion.<br />
by using the glucose hexokinase method on a Cobas-Fara centifugal<br />
analyzer (Roche Diagnostica, Basle, Switzerland) and insulin<br />
by radioimmunoassay with the Bio-RIA ‘25I-Insulin Chromacode<br />
Radioimmunoassay kit (Bio-Mega Diagnostica Inc.<br />
Hamon,<br />
Montreal).<br />
The GI and insulin <strong>index</strong> (II) <strong>of</strong> each <strong>food</strong> was calculated as<br />
described previously (3) by using a 50-g carbohydrate p<strong>or</strong>tion<br />
<strong>of</strong> white bread as the reference <strong>food</strong>. F<strong>or</strong> rice bran a 25-g carbohydrate<br />
p<strong>or</strong>tion was consumed and the incremental area under<br />
the curve was doubled. The GI was then multiplied by the fact<strong>or</strong><br />
70/ 100 to express the final result on a scale where glucose = 100.<br />
When glucose is used as the reference <strong>food</strong> the GI <strong>of</strong> bread is<br />
70 (2). The mean ± SE <strong>of</strong>eight subjects was calculated. In some<br />
instances, one <strong>or</strong> two subjects gave a GI <strong>or</strong> II outside two SDs<br />
from the mean <strong>of</strong> the group. Their results were excluded and<br />
the mean <strong>of</strong> the remaining subjects rep<strong>or</strong>ted. Comparisons between<br />
the <strong>food</strong>s were made by using two-way analysis <strong>of</strong> variance<br />
and the Bonferroni adjustment <strong>of</strong> the Student’s t test. Linearregression<br />
analysis was used to test f<strong>or</strong> an association between<br />
<strong>glycemic</strong> and insulin responses. The protocol was approved by<br />
the Medical Ethical Review Committee <strong>of</strong> the University <strong>of</strong><br />
Sydney and all subjects gave written, inf<strong>or</strong>med consent.<br />
Results<br />
The GI and II <strong>of</strong> the <strong>food</strong>s tested are shown in Table 2. The<br />
GIs <strong>of</strong> the white rices ranged from 64 ± 9 to 93 ± 1 1 . The rice<br />
with a <strong>high</strong>er amylose content (Doongara, 28% amylose) gave<br />
a significantly <strong>low</strong>er GI and II (P < 0.01) than did the n<strong>or</strong>malamylose<br />
rice varieties (Calrose and Pelde, 20% amylose). The<br />
waxy rice with 0-2% amylose had a GI similar to that <strong>of</strong> those<br />
containing n<strong>or</strong>mal amounts <strong>of</strong> amylose.<br />
The GIs <strong>of</strong> the brown rices were similar to their white counterparts<br />
except f<strong>or</strong> the Pelde variety. Pelde brown rice (GI = 76<br />
± 1 1) gave a significantly <strong>low</strong>er GI than did white Pelde (GI<br />
= 93 ± 1 1, P < 0.0 1). The parboiled (converted) Pelde rice gave<br />
a <strong>high</strong> GI (87 ± 7). Brown rice pasta and rice cakes gave <strong>high</strong><br />
GIs (92 ± 8 and 82 ± 1 1, respectively) whereas rice bran gave<br />
an extremely <strong>low</strong> GI ( 19 ± 3). The wheat pasta (GI = 58), rolled<br />
oats (GI = 58), and rolled barley (GI = 66) gave results that<br />
were similar to those rep<strong>or</strong>ted by others (3).<br />
TABLE 2<br />
The <strong>glycemic</strong> and insulin <strong>index</strong>es <strong>of</strong>the <strong>food</strong>s5<br />
Foods<br />
Glycemic <strong>index</strong><br />
(glucose = 100)<br />
Insulin <strong>index</strong><br />
(glucose = 100)<br />
Calrose white (n = 8) 83 ± 13 67 ± 15<br />
Calrose brown (n = 8) 87 ± 8 51 ± 7<br />
Pelde white (n = 7) 93 ± 1 1 67 ± 1 1<br />
Pelde brown (n = 8) 76 ± 6 55 ± 10<br />
Pelde (parboiled) (n = 8) 87 ± 7 57 ± 6<br />
Doongara white (<strong>high</strong><br />
amylose) (n = 8) 64 ± 9 40 ± 10<br />
Doongara brown (<strong>high</strong><br />
amylose) (n = 8) 66 ± 7 39 ± 6<br />
Sunbrown Quick (n = 8) 80 ± 7 54 ± 6<br />
Waxy rice<br />
(0-2% amylose)<br />
(11 = 7) 88 ± 11 89 ± 19<br />
<strong>Rice</strong> cakes (n = 6) 82 ± 1 1 73 ± 12<br />
<strong>Rice</strong> bran (n = 8) 19 ± 3 23 ± 4<br />
Brownricepasta(n=6) 92±8 72±18<br />
Wheat pasta (n = 6) 58 ± 7 52 ± 9<br />
Rolled oats (n = 7) 58 ± 4 54 ± 12<br />
Rolled barley (n = 8) 66 ± 5 64 ± 1 1<br />
S SE. The rice with a <strong>high</strong>er amylose content (Doongara, 28%<br />
amylose) gave a significantly <strong>low</strong>er <strong>glycemic</strong> <strong>index</strong> and insulin <strong>index</strong> (P<br />
< 0.0 1) than did the n<strong>or</strong>mal-amylose rice varieties (Calrose and Pelde,<br />
20% amylose).<br />
Downloaded from ajcn.nutrition.<strong>or</strong>g by guest on August 9, 2014
1036 MILLER ET AL<br />
The II <strong>of</strong>the rices c<strong>or</strong>related positively with their GI (r = 0.75,<br />
P < 0.05) but were relatively <strong>low</strong> compared with the GI. That<br />
is. the regression equation predicts that a rice with a GI <strong>of</strong> 80<br />
has an II <strong>of</strong> 60.<br />
Discussion<br />
These results indicate that most varieties <strong>of</strong> rice sold in<br />
Australia, whether white, brown, <strong>or</strong> parboiled, should be classified<br />
as <strong>high</strong>-GI <strong>food</strong>s. Only one variety with a <strong>high</strong>er amylose<br />
content (Doongara) could be said to be potentially useful in <strong>low</strong>-<br />
G1 diets. The white Doongara rice had a GI and II <strong>of</strong> 64 and<br />
40, respectively. These values are similar to those <strong>of</strong>wheat pasta<br />
and p<strong>or</strong>ridge, which are recognized as <strong>low</strong>-GI <strong>food</strong>s. <strong>Rice</strong> bran,<br />
which is rich in fiber and oil, had an extremely <strong>low</strong> GI and may<br />
be a useful supplement in diabetic diets.<br />
The relationship between amylose content and GI <strong>of</strong>rice may<br />
be exponential rather than linear. The GI <strong>of</strong> a rice with 20%<br />
amylose is already very <strong>high</strong>: 93 ± 1 1 in the Pelde variety. It is<br />
conceivable that this is approaching the maximum that is physiologically<br />
possible (the <strong>glycemic</strong> response to a similar carbohydrate<br />
load <strong>of</strong> glucose is not much <strong>high</strong>er). Hence, reducing<br />
the amylose content to only 0-2% amylose appears to make<br />
little difference. However. increasing amylose has a pronounced<br />
effect that has been shown by others (7). There are now varieties<br />
<strong>of</strong> rice with 35% amylose that may be predicted to have <strong>low</strong>er<br />
GIs than that <strong>of</strong>the Doongara rice (28% amylose) studied here.<br />
The parboiled rice in the present study gave a <strong>high</strong> GI (87<br />
± 7), unlike the parboiled rice studied by Jenkins et al (1) (GI<br />
= 54, glucose = 100). Parboiling <strong>of</strong>rice involves steeping paddy<br />
rice in water at 60 #{176}C f<strong>or</strong> > 1 h fol<strong>low</strong>ed by steaming, drying,<br />
and milling. This process does not appear to alter the <strong>glycemic</strong><br />
response because the GI <strong>of</strong> this variety <strong>of</strong> rice (Pelde) was 93<br />
± 1 1 bef<strong>or</strong>e and 87 ± 7 after parboiling (P> 0.05). The parboiled<br />
rice used by Jenkins et al may have a <strong>low</strong> GI because the variety<br />
used has a <strong>high</strong> amylose content rather than because <strong>of</strong>the parboiling<br />
process per se. This suggestion, however, needs to be<br />
c<strong>or</strong>rob<strong>or</strong>ated by GI testing and amylose:amylopectin analysis <strong>of</strong><br />
other parboiled rices.<br />
An unexpected observation was the relationship between GI<br />
and II: the II was usually <strong>low</strong>er on the relative scale than was<br />
the GI <strong>of</strong> the <strong>food</strong>s. F<strong>or</strong> example, the GI <strong>of</strong> Calrose brown rice<br />
is 83 but its II was only 5 1 . We have no explanation f<strong>or</strong> this<br />
result unless bread, the reference <strong>food</strong>, is unique in its capacity<br />
to stimulate insulin. The effect may be increasingly observed as<br />
<strong>glycemic</strong> and insulin responses to real <strong>food</strong>s are measured. Collier<br />
et al (8) rep<strong>or</strong>ted that insulin responses to carbohydrate <strong>food</strong>s<br />
were potentiated by coingestion <strong>of</strong>large amounts <strong>of</strong>fat, ie, insulin<br />
responses were <strong>high</strong>er than the relative <strong>glycemic</strong> response if fat<br />
was added to the <strong>food</strong>. In the present study, fat content is negligible<br />
and insulin secretion is decreased relative to the <strong>glycemic</strong><br />
response. The <strong>high</strong>er protein content <strong>of</strong> wheat pasta and rice<br />
bran may explain the <strong>high</strong>er parity <strong>of</strong> GI and II f<strong>or</strong> these two<br />
<strong>food</strong>s. Coingestion <strong>of</strong> protein is known to increase the insulin<br />
response to a carbohydrate load (9).<br />
Findings such as this indicate that both GI and II should be<br />
considered when determining the optimal carbohydrate <strong>food</strong>s<br />
f<strong>or</strong> individuals with diabetes. Insulin concentrations are a maj<strong>or</strong><br />
determinant <strong>of</strong> blood cholesterol and triglyceride concentrations<br />
and influence the progression <strong>of</strong>c<strong>or</strong>onary heart disease (10). We<br />
cannot assume that a <strong>food</strong> with a <strong>high</strong> <strong>glycemic</strong> response will<br />
have a <strong>high</strong> insulin response. It may be possible that many rice<br />
varieties, despite having a <strong>high</strong> GI, can be included in diets that<br />
improve carbohydrate and insulin metabolism in individuals<br />
with diabetes. Both the Canadian and the French groups have<br />
specifically included rice in their long-term GI diet studies (4,<br />
5). In the Canadian studies, parboiled rice with a GI <strong>of</strong>54 (glucose<br />
= 100) was specified and in the French studies a rice with a GI<br />
<strong>of</strong> 56 (measured directly) was used.<br />
All subjects received a 50-g carbohydrate p<strong>or</strong>tion <strong>of</strong> white<br />
bread as the reference <strong>food</strong> in this study. However, we then<br />
adjusted all the results down by a fact<strong>or</strong> <strong>of</strong> 70/100 so that glucose<br />
would the<strong>or</strong>etically have the <strong>high</strong>est sc<strong>or</strong>e on the scale, ie, 100<br />
[bread has a GI <strong>of</strong> 70 if glucose is the standard (2)]. We feel<br />
strongly that an <strong>index</strong> where glucose is 100 is easier to understand<br />
because, the<strong>or</strong>etically, nothing is likely to be <strong>high</strong>er than this.<br />
Jenkins et al (1) have made this adjustment in the other direction<br />
to many <strong>of</strong>their <strong>food</strong>s in <strong>or</strong>der to express their early results with<br />
a white-bread standard ( 1 ). Their decision to make white bread<br />
- 100 has resulted in some confusion. We recommend that GI<br />
testing and calculation be carried out as we have done, with the<br />
final result expressed on a scale where glucose is 100. This means<br />
that any <strong>food</strong> can be used as the standard as long as its relationship<br />
to a 50-g glucose load is known.<br />
These results emphasize the need f<strong>or</strong> individual countries to<br />
carry out their own GI testing, particularly <strong>of</strong> raw agricultural<br />
products, which are m<strong>or</strong>e likely to vary from one geographical<br />
location to another than do processed products, such as breakfast<br />
cereals. The findings also raise questions about the value <strong>of</strong> the<br />
GI alone without knowledge <strong>of</strong>the insulin response. In Australia,<br />
long-term studies are needed <strong>of</strong> the clinical utility <strong>of</strong> <strong>low</strong>-GI<br />
diets that specifically inc<strong>or</strong>p<strong>or</strong>ate rice. C]<br />
References<br />
1. lenkins DIA. Wolever DIA, Jenkins AL. Starchy <strong>food</strong>s and <strong>glycemic</strong><br />
<strong>index</strong>. Diabetes Care 1988:11:149-59.<br />
2. Jenkins DJA, Wolever TMS, Tayl<strong>or</strong> RH. et al. Glycemic <strong>index</strong> <strong>of</strong><br />
<strong>food</strong>s: a physiological basis f<strong>or</strong> carbohydrate exchange. Am I Clin<br />
Nutr 1981:34:362-6.<br />
3. Brand IC. Nicholson PL, Th<strong>or</strong>burn AW, Truswell AS. Food processing<br />
and the <strong>glycemic</strong> <strong>index</strong>. Am I Clin Nutr 1985:42:1192-6.<br />
4. Fontvieille AM, Acosta M, Rizkalla SW, et al. A moderate shift<br />
from <strong>high</strong> to <strong>low</strong> <strong>glycemic</strong> <strong>index</strong> <strong>food</strong>s f<strong>or</strong> 3 weeks improves the<br />
metabolic control <strong>of</strong> Type I (IDDM) diabetic subjects. Diabetes<br />
Nutr Metab 1988:1:139-43.<br />
5. Collier GR. Giudici 5, Wolever TMS, et al. Low <strong>glycemic</strong> <strong>index</strong><br />
starchy <strong>food</strong>s improve glucose control and <strong>low</strong>er serum cholesterol<br />
in diabetic children. Diabetes Nutr Metab 1988:1:11-18.<br />
6. Brand IC. Colagiuri S. Crossman 5, Allen A, Roberts DCK, Truswell<br />
AS. Low <strong>glycemic</strong> <strong>index</strong> <strong>food</strong>s improve long term <strong>glycemic</strong> control<br />
in NIDDM. Diabetes Care 1991:14:95-101.<br />
7. luliano BO. Goddard MS. Cause <strong>of</strong> varietal difference in insulin<br />
and glucose responses to ingested rice. Plant Foods Hum Nutr<br />
1986:36:35-41.<br />
8. Collier G, McLean A, O’Dea K. Effect <strong>of</strong>co-ingestion <strong>of</strong>fat on the<br />
metabolic responses to s<strong>low</strong>ly and rapidly abs<strong>or</strong>bed carbohydrates.<br />
Diabetologia 1984:26:50-4.<br />
9. Nuttall FQ. Mo<strong>or</strong>adian AD. Gannon MC, Billington C, Krezowski<br />
P. Effect <strong>of</strong>protein ingestion on the glucose and insulin response to<br />
a standardized <strong>or</strong>al glucose load. Diabetes Care 1984:5:465-70.<br />
10. Zavaroni I, Bon<strong>or</strong>a E, Pagliara M, et aI. Risk fact<strong>or</strong>s f<strong>or</strong> c<strong>or</strong>onary<br />
artery disease in healthy persons with hyperinsulinaemia and n<strong>or</strong>mal<br />
glucose tolerance. N Engl I Med 1989:320:702-6.<br />
Downloaded from ajcn.nutrition.<strong>or</strong>g by guest on August 9, 2014