Organic micropollutants in Rhine and Meuse a - Riwa
Organic micropollutants in Rhine and Meuse a - Riwa
Organic micropollutants in Rhine and Meuse a - Riwa

Create successful ePaper yourself
Turn your PDF publications into a flip-book with our unique Google optimized e-Paper software.
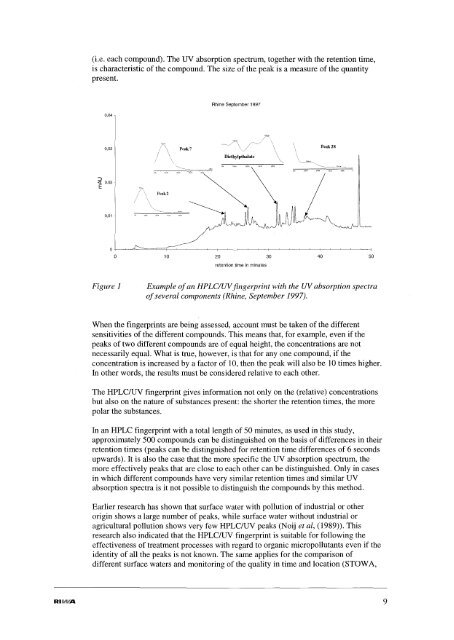
(i.e. each compound). The UV absorption spectrum, together with the retention time,<br />
is characteristic of the compound. The size of the peak is a measure of the quantity<br />
present.<br />
0,04<br />
Rh<strong>in</strong>e September 1997<br />
0,03<br />
Peak7<br />
Peak 28<br />
Diethytpthalate<br />
::::><br />
« 0,02<br />
E<br />
Peak2<br />
0,Q1<br />
L<br />
o<br />
10<br />
20<br />
30<br />
40<br />
50<br />
retention time <strong>in</strong> m<strong>in</strong>utes<br />
Figure 1<br />
Example ofan HPLC/UVf<strong>in</strong>gerpr<strong>in</strong>t with the UVabsorption spectra<br />
ofseveral components (Rh<strong>in</strong>e, September 1997).<br />
When the f<strong>in</strong>gerpr<strong>in</strong>ts are be<strong>in</strong>g assessed, account must be taken of the different<br />
sensitivities of the different compounds. This means that, for example, even if the<br />
peaks of two different compounds are of equal height, the concentrations are not<br />
necessarily equal. What is true, however, is that for anyone compound, if the<br />
concentration is <strong>in</strong>creased by a factor of 10, then the peak will also be 10 times higher.<br />
In other words, the results must be considered relative to each other.<br />
The HPLC/UV f<strong>in</strong>gerpr<strong>in</strong>t gives <strong>in</strong>formation not only on the (relative) concentrations<br />
but also on the nature of substances present: the shorter the retention times, the more<br />
polar the substances.<br />
In an HPLC f<strong>in</strong>gerpr<strong>in</strong>t with a total length of 50 m<strong>in</strong>utes, as used <strong>in</strong> this study,<br />
approximately 500 compounds can be dist<strong>in</strong>guished on the basis of differences <strong>in</strong> their<br />
retention times (peaks can be dist<strong>in</strong>guished for retention time differences of 6 seconds<br />
upwards). It is also the case that the more specific the UV absorption spectrum, the<br />
more effectively peaks that are close to each other can be dist<strong>in</strong>guished. Only <strong>in</strong> cases<br />
<strong>in</strong> which different compounds have very similar retention times <strong>and</strong> similar UV<br />
absorption spectra is it not possible to dist<strong>in</strong>guish the compounds by this method.<br />
Earlier research has shown that surface water with pollution of <strong>in</strong>dustrial or other<br />
orig<strong>in</strong> shows a large number of peaks, while surface water without <strong>in</strong>dustrial or<br />
agricultural pollution shows very few HPLC/UV peaks (Noij et al, (1989)). This<br />
research also <strong>in</strong>dicated that the HPLC/UV f<strong>in</strong>gerpr<strong>in</strong>t is suitable for follow<strong>in</strong>g the<br />
effectiveness of treatment processes with regard to organic <strong>micropollutants</strong> even if the<br />
identity of all the peaks is not known. The same applies for the comparison of<br />
different surface waters <strong>and</strong> monitor<strong>in</strong>g of the quality <strong>in</strong> time <strong>and</strong> location (STOWA,<br />
RIIIN'A<br />
9