South African Child Gauge 2009/2010 - Children's Institute
South African Child Gauge 2009/2010 - Children's Institute
South African Child Gauge 2009/2010 - Children's Institute

You also want an ePaper? Increase the reach of your titles
YUMPU automatically turns print PDFs into web optimized ePapers that Google loves.
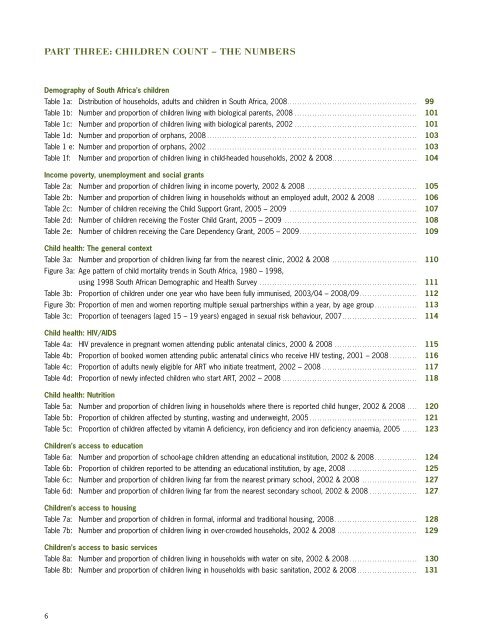
PART THREE: CHILDREN COUNT – THE NUMBERS<br />
Demography of <strong>South</strong> Africa’s children<br />
Table 1a: Distribution of households, adults and children in <strong>South</strong> Africa, 2008.................................................... 99<br />
Table 1b: Number and proportion of children living with biological parents, 2008 . ................................................ 101<br />
Table 1c: Number and proportion of children living with biological parents, 2002 ................................................. 101<br />
Table 1d: Number and proportion of orphans, 2008 .................................................................................... 103<br />
Table 1 e: Number and proportion of orphans, 2002 . ................................................................................... 103<br />
Table 1f: Number and proportion of children living in child-headed households, 2002 & 2008.................................. 104<br />
Income poverty, unemployment and social grants<br />
Table 2a: Number and proportion of children living in income poverty, 2002 & 2008 ............................................ 105<br />
Table 2b: Number and proportion of children living in households without an employed adult, 2002 & 2008 . ............... 106<br />
Table 2c: Number of children receiving the <strong>Child</strong> Support Grant, 2005 – <strong>2009</strong> ................................................... 107<br />
Table 2d: Number of children receiving the Foster <strong>Child</strong> Grant, 2005 – <strong>2009</strong> ..................................................... 108<br />
Table 2e: Number of children receiving the Care Dependency Grant, 2005 – <strong>2009</strong> . .............................................. 109<br />
<strong>Child</strong> health: The general context<br />
Table 3a: Number and proportion of children living far from the nearest clinic, 2002 & 2008 .................................. 110<br />
Figure 3a: Age pattern of child mortality trends in <strong>South</strong> Africa, 1980 – 1998,<br />
using 1998 <strong>South</strong> <strong>African</strong> Demographic and Health Survey . .............................................................. 111<br />
Table 3b: Proportion of children under one year who have been fully immunised, 2003/04 – 2008/09 ....................... 112<br />
Figure 3b: Proportion of men and women reporting multiple sexual partnerships within a year, by age group ................. 113<br />
Table 3c: Proportion of teenagers (aged 15 – 19 years) engaged in sexual risk behaviour, 2007 . ............................. 114<br />
<strong>Child</strong> health: HIV/AIDS<br />
Table 4a: HIV prevalence in pregnant women attending public antenatal clinics, 2000 & 2008 ................................. 115<br />
Table 4b: Proportion of booked women attending public antenatal clinics who receive HIV testing, 2001 – 2008 ........... 116<br />
Table 4c: Proportion of adults newly eligible for ART who initiate treatment, 2002 – 2008 ...................................... 117<br />
Table 4d: Proportion of newly infected children who start ART, 2002 – 2008 ...................................................... 118<br />
<strong>Child</strong> health: Nutrition<br />
Table 5a: Number and proportion of children living in households where there is reported child hunger, 2002 & 2008 .... 120<br />
Table 5b: Proportion of children affected by stunting, wasting and underweight, 2005 ........................................... 121<br />
Table 5c: Proportion of children affected by vitamin A deficiency, iron deficiency and iron deficiency anaemia, 2005 ...... 123<br />
<strong>Child</strong>ren’s access to education<br />
Table 6a: Number and proportion of school-age children attending an educational institution, 2002 & 2008 ................. 124<br />
Table 6b: Proportion of children reported to be attending an educational institution, by age, 2008 ............................ 125<br />
Table 6c: Number and proportion of children living far from the nearest primary school, 2002 & 2008 ...................... 127<br />
Table 6d: Number and proportion of children living far from the nearest secondary school, 2002 & 2008 ................... 127<br />
<strong>Child</strong>ren’s access to housing<br />
Table 7a: Number and proportion of children in formal, informal and traditional housing, 2008 ................................. 128<br />
Table 7b: Number and proportion of children living in over-crowded households, 2002 & 2008 ................................ 129<br />
<strong>Child</strong>ren’s access to basic services<br />
Table 8a: Number and proportion of children living in households with water on site, 2002 & 2008 ........................... 130<br />
Table 8b: Number and proportion of children living in households with basic sanitation, 2002 & 2008 ........................ 131<br />
6