Meta-análisis - Web de Ferran Torres
Meta-análisis - Web de Ferran Torres
Meta-análisis - Web de Ferran Torres
Create successful ePaper yourself
Turn your PDF publications into a flip-book with our unique Google optimized e-Paper software.
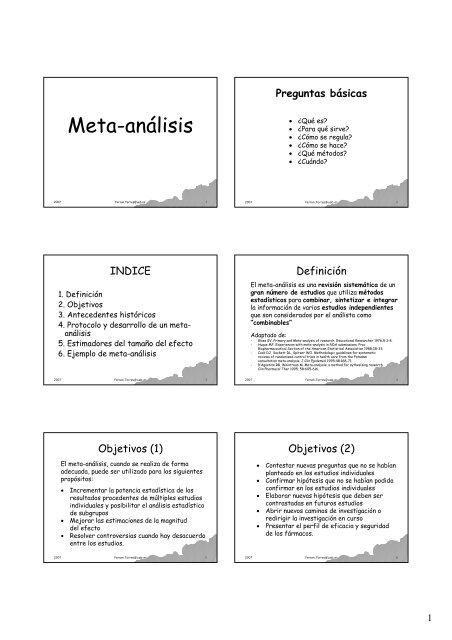
Preguntas básicasb<br />
<strong>Meta</strong>-an<br />
<strong>análisis</strong><br />
• ¿Qué es?<br />
• ¿Para qué sirve?<br />
• ¿Cómo se regula?<br />
• ¿Cómo se hace?<br />
• ¿Qué métodos?<br />
• ¿Cuándo?<br />
2007 <strong>Ferran</strong>.<strong>Torres</strong>@uab.es 1<br />
2007 <strong>Ferran</strong>.<strong>Torres</strong>@uab.es 2<br />
INDICE<br />
1. Definición<br />
2. Objetivos<br />
3. Antece<strong>de</strong>ntes históricos<br />
4. Protocolo y <strong>de</strong>sarrollo <strong>de</strong> un meta-<br />
<strong>análisis</strong><br />
5. Estimadores <strong>de</strong>l tamaño o <strong>de</strong>l efecto<br />
6. Ejemplo <strong>de</strong> meta-an<br />
<strong>análisis</strong><br />
Definición<br />
El meta-an<br />
<strong>análisis</strong> es una revisión n sistemática<br />
tica <strong>de</strong> un<br />
gran númeron<br />
<strong>de</strong> estudios que utiliza métodos<br />
estadísticos<br />
sticos para combinar, sintetizar e integrar<br />
la información n <strong>de</strong> varios estudios in<strong>de</strong>pendientes<br />
que son consi<strong>de</strong>rados por el análista<br />
como<br />
“combinables”<br />
Adaptado <strong>de</strong>:<br />
- Glass GV. Primary and <strong>Meta</strong>-analysis of research. Educational Researcher 1976;5:3-8.<br />
- Huque MF. Experiences with meta-analysis in NDA submissions. Proc<br />
Biopharmaceutical Section of the American Statistical Association 1988;28-33.<br />
- Cook DJ, Sackett DL, Spitzer WO. Methodologic gui<strong>de</strong>lines for systematic<br />
reviews of randomized control trials in health care from the Potsdam<br />
consultation meta-analysis. J Clin Epi<strong>de</strong>miol 1995;48:168-71.<br />
- D’Agostino RB, Weintraub M. <strong>Meta</strong>-analysis: a method for sythesizing research.<br />
Clin Pharmacol Ther 1995; 58:605-616.<br />
2007 <strong>Ferran</strong>.<strong>Torres</strong>@uab.es 3<br />
2007 <strong>Ferran</strong>.<strong>Torres</strong>@uab.es 4<br />
Objetivos (1)<br />
El meta-an<br />
<strong>análisis</strong>, cuando se realiza <strong>de</strong> forma<br />
a<strong>de</strong>cuada, pue<strong>de</strong> ser utilizado para los siguientes<br />
propósitos:<br />
• Incrementar la potencia estadística stica <strong>de</strong> los<br />
resultados proce<strong>de</strong>ntes <strong>de</strong> múltiples m<br />
estudios<br />
individuales y posibilitar el <strong>análisis</strong> estadístico<br />
stico<br />
<strong>de</strong> subgrupos<br />
• Mejorar las estimaciones <strong>de</strong> la magnitud<br />
<strong>de</strong>l efecto<br />
• Resolver controversias cuando hay <strong>de</strong>sacuerdo<br />
entre los estudios.<br />
Objetivos (2)<br />
• Contestar nuevas preguntas que no se habían<br />
an<br />
planteado en los estudios individuales<br />
• Confirmar hipótesis que no se habían an podido<br />
confirmar en los estudios individuales<br />
• Elaborar nuevas hipótesis que <strong>de</strong>ben ser<br />
contrastadas en futuros estudios<br />
• Abrir nuevos caminos <strong>de</strong> investigación n o<br />
redirigir la investigación n en curso<br />
• Presentar el perfil <strong>de</strong> eficacia y seguridad<br />
<strong>de</strong> los fármacos. f<br />
2007 <strong>Ferran</strong>.<strong>Torres</strong>@uab.es 5<br />
2007 <strong>Ferran</strong>.<strong>Torres</strong>@uab.es 6<br />
1
Objetivos (3)<br />
• Obtención n <strong>de</strong> estimadores o parámetros para<br />
estudios <strong>de</strong> farmacoeconomía, , calidad <strong>de</strong> vida,<br />
etc.<br />
Adaptado <strong>de</strong>:<br />
- Fleiss JL, Gross A. <strong>Meta</strong>-analysis in epi<strong>de</strong>miology, with special<br />
reference to studies of association between exposure to<br />
environmental tobacco smoke and lung cancer: a critique.<br />
J Clin Epi<strong>de</strong>miol 1991; 127-139.<br />
OBJETIVOS<br />
Conclusión:<br />
n:<br />
– Ganancia en precisión<br />
– Comparación n crítica <strong>de</strong> los resultados<br />
– Diferencias en magnitud o sentido<br />
– Posibilidad <strong>de</strong> generalizar<br />
2007 <strong>Ferran</strong>.<strong>Torres</strong>@uab.es 7<br />
2007 <strong>Ferran</strong>.<strong>Torres</strong>@uab.es 8<br />
EVOLUCIÓN N DEL USO DEL MÉTODO M<br />
META-ANAL<br />
ANALÍTICO<br />
Período <strong>de</strong> tiempo Total Ratio articulos/mes<br />
EVOLUCIÓN N DEL USO DEL MÉTODO M<br />
META-ANAL<br />
ANALÍTICO<br />
Ratio articulos/mes<br />
1950-1959 1 0.008<br />
1960-1969 8 0.067<br />
1970-1979 18 0.150<br />
1980-1984 73 1.217<br />
1985-1989 333 5.550<br />
1990-1992 (Junio) 245 5.833<br />
1992 (Julio)-1995 1503 36.429<br />
40,000<br />
35,000<br />
30,000<br />
25,000<br />
20,000<br />
15,000<br />
10,000<br />
5,000<br />
0,000<br />
1950-<br />
1959<br />
1960-<br />
1969<br />
1970-<br />
1979<br />
1980-<br />
1984<br />
1985-<br />
1989<br />
Ratio articulos/mes<br />
1990-<br />
1992<br />
(Junio)<br />
1992<br />
(Julio)-<br />
1995<br />
2007 <strong>Ferran</strong>.<strong>Torres</strong>@uab.es 9<br />
2007 <strong>Ferran</strong>.<strong>Torres</strong>@uab.es 10<br />
CARACTERÍSTICAS<br />
Areas <strong>de</strong> aplicación<br />
Ciencias <strong>de</strong> la educación<br />
Psicología<br />
Biología<br />
Medicina<br />
Ciencias medio-ambientales<br />
Química<br />
Física<br />
Economía<br />
Etc...<br />
CARACTERÍSTICAS<br />
Problemas preliminares<br />
– Selección n <strong>de</strong> material<br />
Bibliografía<br />
– Búsqueda informatizada (Medline(<br />
Medline, Science Citacion In<strong>de</strong>x, , ...)<br />
– Búsqueda manual (Citas referenciadas, conferencias)<br />
– Lenguas extranjeras<br />
– Estudios presentados a conferencias y congresos<br />
– Calidad <strong>de</strong> los estudios<br />
– Diseños distintos (estudios <strong>de</strong> cohortes, caso-control, control, ...)<br />
2007 <strong>Ferran</strong>.<strong>Torres</strong>@uab.es 11<br />
2007 <strong>Ferran</strong>.<strong>Torres</strong>@uab.es 12<br />
2
CARACTERÍSTICAS<br />
Datos:<br />
– Tipos <strong>de</strong> medida <strong>de</strong> los efectos<br />
– Escalas <strong>de</strong> medida<br />
– Extensión n <strong>de</strong> la información<br />
Datos originales<br />
Estadísticos sticos <strong>de</strong> resumen<br />
Estimación n <strong>de</strong>l efecto y errores estándar<br />
Valores <strong>de</strong> significación<br />
CARACTERÍSTICAS<br />
Datos:<br />
– Toda la información, n, a excepción n <strong>de</strong> los<br />
datos originales, complica enormemente el<br />
ajuste por distinto factores <strong>de</strong> confusión<br />
potenciales<br />
Disponibilidad <strong>de</strong> los estudios: Sesgo<br />
<strong>de</strong> publicación<br />
2007 <strong>Ferran</strong>.<strong>Torres</strong>@uab.es 13<br />
2007 <strong>Ferran</strong>.<strong>Torres</strong>@uab.es 14<br />
CARACTERÍSTICAS<br />
No in<strong>de</strong>pen<strong>de</strong>ncia <strong>de</strong> los estudios<br />
– Tiempo: momento en que se realiza el<br />
estudio<br />
– Centro o investigador<br />
– Múltiple publicación n <strong>de</strong> los resultados<br />
– Mismos sujetos (en distintos estudios)<br />
Ventajas y limitaciones<br />
Ventajas<br />
Consi<strong>de</strong>ración n sistemática tica (evaluación n no<br />
sesgada)<br />
Cuantificación n <strong>de</strong> los resultados<br />
Aumento <strong>de</strong> precisión n <strong>de</strong> los resultados<br />
Mayor Mayor capacidad <strong>de</strong> estudiar efectos en<br />
subgrupos<br />
Mayor Mayor facilidad para evaluar las discrepancias<br />
entre estudios<br />
Mayor Mayor generalización n <strong>de</strong> las conclusiones<br />
2007 <strong>Ferran</strong>.<strong>Torres</strong>@uab.es 15<br />
2007 <strong>Ferran</strong>.<strong>Torres</strong>@uab.es 16<br />
Ventajas y limitaciones<br />
Limitaciones:<br />
La La calidad está limitada por los estudios<br />
individuales<br />
Dificultad para establecer los criterios <strong>de</strong> inclusión<br />
Sesgo Sesgo <strong>de</strong> selección n (publicación, lengua, calidad ...)<br />
Protocolo<br />
• Como en cualquier otro estudio, antes <strong>de</strong> iniciar un<br />
meta-an<br />
<strong>análisis</strong> se <strong>de</strong>be elaborar un protocolo completo<br />
y <strong>de</strong>tallado<br />
• El protocolo <strong>de</strong>bería a incluir como mínimo: m<br />
- Una <strong>de</strong>scripción n <strong>de</strong>tallada <strong>de</strong> los objetivos e hipótesis que<br />
se van a probar<br />
- Los criterios <strong>de</strong> inclusión n y exclusión n <strong>de</strong> los estudios<br />
- Los procedimientos que se utilizarán n para probar la<br />
homogeneidad <strong>de</strong> los tamaños <strong>de</strong> los efectos entre<br />
estudios<br />
- Los métodos m<br />
estadísticos sticos que se utilizarán n para estimar el<br />
tamaño o <strong>de</strong>l efecto global<br />
- Los métodos m<br />
que se utilizarán n para presentar y resumir<br />
los resultados<br />
2007 <strong>Ferran</strong>.<strong>Torres</strong>@uab.es 17<br />
2007 <strong>Ferran</strong>.<strong>Torres</strong>@uab.es 18<br />
3
Análisis <strong>de</strong> la heterogeneidad<br />
• Respuesta a la siguiente pregunta:<br />
¿SON COMBINABLES LOS ESTUDIOS?<br />
• Pruebas <strong>de</strong> homogeneidad <strong>de</strong> los resultados <strong>de</strong> los<br />
estudios individuales:<br />
- Prueba ji-cadrado<br />
Q <strong>de</strong> Cochran<br />
- Prueba ji-cuadrado <strong>de</strong> Breslow-Day<br />
• Las pruebas <strong>de</strong> homogeneidad tienen baja potencia<br />
para <strong>de</strong>tectar la heterogeneidad<br />
• Un valor p <strong>de</strong> la prueba <strong>de</strong> homogeneidad 0.10,<br />
sugiere heterogeneidad entre estudios y, por tanto,<br />
podría a no ser válido v<br />
combinar los estudios<br />
2007 <strong>Ferran</strong>.<strong>Torres</strong>@uab.es 19<br />
Egger et al. Systematic reviews in health care. London: BMJ books, 2001.<br />
2007 <strong>Ferran</strong>.<strong>Torres</strong>@uab.es 20<br />
Magnitud <strong>de</strong>l efecto (1)<br />
• Los métodos m<br />
estadísticos sticos utilizados para estimar<br />
el tamaño o <strong>de</strong>l efecto global <strong>de</strong> diferentes estudios<br />
se basan en Mo<strong>de</strong>los <strong>de</strong> Efectos Fijos y Efectos<br />
Aleatorios<br />
• Los Mo<strong>de</strong>los <strong>de</strong> Efectos Fijos asumen un efecto<br />
constante <strong>de</strong>l tratamiento entre estudios, es <strong>de</strong>cir,<br />
los tamaños <strong>de</strong> los efectos entre estudios son<br />
homogéneos o similares.<br />
- Los diferentes estudios pertenecen a una misma<br />
población<br />
- Consi<strong>de</strong>ran la variabilidad intra-estudio<br />
Magnitud <strong>de</strong>l efecto (2)<br />
• Los Mo<strong>de</strong>los <strong>de</strong> Efectos Aleatorios consi<strong>de</strong>ran que<br />
existe una variación n entre estudios<br />
- Los estudios provienen <strong>de</strong> poblaciones diferentes<br />
- Consi<strong>de</strong>ran la variabilidad intra e inter-estudio<br />
estudio<br />
2007 <strong>Ferran</strong>.<strong>Torres</strong>@uab.es 21<br />
2007 <strong>Ferran</strong>.<strong>Torres</strong>@uab.es 22<br />
Magnitud <strong>de</strong>l efecto (3)<br />
• Ninguno <strong>de</strong> los dos mo<strong>de</strong>los se pue<strong>de</strong> consi<strong>de</strong>rar<br />
“correcto”:<br />
- Si los estudios son homogéneos<br />
La elección n entre un mo<strong>de</strong>lo <strong>de</strong> efectos fijos<br />
y efectos aleatorios no es importante, ya que los<br />
resultados serán n idénticos<br />
- Si los estudios no son homogéneos<br />
Es más m s apropiado elegir un mo<strong>de</strong>lo <strong>de</strong> efectos<br />
aleatorios<br />
• Los mo<strong>de</strong>los <strong>de</strong> efectos fijos y efectos aleatorios<br />
utilizan diferentes métodos m<br />
estadísticos sticos para<br />
combinarlos resultados<br />
2007 <strong>Ferran</strong>.<strong>Torres</strong>@uab.es 23<br />
Magnitud <strong>de</strong>l efecto (4)<br />
Efectos fijos Efectos aleatorios<br />
Método Efecto Método Efecto<br />
V. Cualit. Mantel-Haenszel OR, RR DerSimonian-<br />
Laird<br />
Ratios y<br />
Diferencias<br />
Peto<br />
OR<br />
Basado en la<br />
varianza general<br />
Ratios y<br />
diferencias<br />
V. Cuantit. Diferencias<br />
tipificadas entre<br />
medias<br />
Cuantitativas<br />
Diferencias<br />
tipificadas<br />
entre medias<br />
Cuantitativas<br />
2007 <strong>Ferran</strong>.<strong>Torres</strong>@uab.es 24<br />
4
Unbiased Hedges’ g estimate<br />
Corrections for small sample size will be ma<strong>de</strong>.<br />
3<br />
= 1−<br />
4m<br />
−1<br />
μe − μc<br />
δ =<br />
σ<br />
m = n c<br />
+ ne<br />
− 2<br />
Effect size interpretation<br />
Since effect sizes are non-dimensional<br />
measurements (no units), some<br />
conventions have been proposed [1],[2] [2]:<br />
– small≈0.20,<br />
– medium≈0.50<br />
– large≈0.80<br />
J m<br />
⎛ 3 ⎞ ⎛ 3<br />
( ) ⎟ ⎞<br />
d = g⎜1−<br />
⎟ = g<br />
⎜1−<br />
⎝ 4m<br />
−1⎠<br />
⎝ 4 n e<br />
+ n e<br />
− 9 ⎠<br />
2007 <strong>Ferran</strong>.<strong>Torres</strong>@uab.es 25<br />
– [1] Cohen, J. (1988). Statistical power analysis for the behavioral<br />
sciences (2nd ed.).<br />
Hillsdale, , NJ: Erlbaum.<br />
– [2] Cohen, J. (1992). A power primer. Psychological Bulletin, 112,<br />
155-159.<br />
159.<br />
2007 <strong>Ferran</strong>.<strong>Torres</strong>@uab.es 26<br />
Análisis <strong>de</strong> sensibilidad (resumen)<br />
• Un <strong>análisis</strong> <strong>de</strong> sensibilidad evalúa a la<br />
estabilidad <strong>de</strong> las conclusiones <strong>de</strong> un <strong>análisis</strong><br />
según n las asunciones (supuestos) que se han<br />
realizado en el <strong>análisis</strong><br />
• Cuando una conclusión n permanece invariante<br />
al variar las asunciones <strong>de</strong>l <strong>análisis</strong>, se<br />
refuerza la confianza en la vali<strong>de</strong>z <strong>de</strong> las<br />
conclusiones <strong>de</strong>l <strong>análisis</strong><br />
2007 <strong>Ferran</strong>.<strong>Torres</strong>@uab.es 27<br />
Análisis <strong>de</strong> sensibilidad (1)<br />
• Un <strong>análisis</strong> <strong>de</strong> sensibilidad evalúa a la estabilidad <strong>de</strong><br />
las conclusiones <strong>de</strong> un <strong>análisis</strong> según n las asunciones<br />
(supuestos) que se han realizado en el <strong>análisis</strong><br />
• Cuando una conclusión n permanece invariante al variar<br />
las asunciones <strong>de</strong>l <strong>análisis</strong>, se refuerza la confianza<br />
en la vali<strong>de</strong>z <strong>de</strong> las conclusiones <strong>de</strong>l <strong>análisis</strong><br />
• El <strong>análisis</strong> <strong>de</strong> sensibilidad permite i<strong>de</strong>ntificar las<br />
asunciones más m s críticas <strong>de</strong>l <strong>análisis</strong><br />
• Conocer las asunciones críticas <strong>de</strong> un <strong>análisis</strong> pue<strong>de</strong><br />
ser utilizado para formular las priorida<strong>de</strong>s para una<br />
futura investigación n enfocada a resolver el problema<br />
planteado en el <strong>análisis</strong><br />
2007 <strong>Ferran</strong>.<strong>Torres</strong>@uab.es 28<br />
Análisis <strong>de</strong> sensibilidad (2)<br />
ANÁLISIS ASUNCIONES<br />
ANÁLISIS DE<br />
SENSIBILIDAD<br />
- Estim a c ió n d e la<br />
magnitud <strong>de</strong>l<br />
efecto global<br />
mediante un<br />
- La s m a g nitud e s<br />
d e lo s e fe c t o s d e<br />
lo s e st u d io s so n<br />
homogéneos o<br />
- Estimar la magnitud<br />
<strong>de</strong>l efecto global<br />
mediante un mo<strong>de</strong>lo<br />
<strong>de</strong> efectos aleatorios<br />
mo<strong>de</strong>lo <strong>de</strong> efectos<br />
fijos<br />
sim ila re s<br />
Si lo s re su lta d o s d e lo s d o s a n á lisis so n sim ila re s, la a su n c ió n d e l<br />
<strong>análisis</strong> es correcta<br />
La magnitud <strong>de</strong>l efecto global estimado es valido<br />
Si lo s re su lta d o s d e lo s d o s a n á lisis so n d ife re n te s, la a su n c ió n<br />
d e l a n á lisis n o e s c o rre c ta , e s d e c ir, la s m a g n itu d e s d e lo s<br />
e fe c t o s d e lo s e st u d io s n o so n h o m o g é n e o s<br />
La magnitud <strong>de</strong>l efecto global estimado podría no ser valido<br />
RELATIVE LIVE-BIRTH RATIO<br />
Análisis se sensibilidad (3)<br />
2.0<br />
1.8<br />
1.6<br />
1.4<br />
1.2<br />
1.0<br />
0.8<br />
0.6<br />
0.4<br />
0.2<br />
0.0<br />
FAVOURS CONTROL FAVOURS TREATMENT<br />
Homogeneity test<br />
P = 0.06 (0.10)<br />
2007 <strong>Ferran</strong>.<strong>Torres</strong>@uab.es 29<br />
2007 <strong>Ferran</strong>.<strong>Torres</strong>@uab.es 30<br />
5
Análisis <strong>de</strong> la correlación<br />
• Una correlación n significativa entre la magnitud<br />
<strong>de</strong>l efecto y el tamaño o <strong>de</strong> la muestra <strong>de</strong> los estudios<br />
indica que el tamaño o <strong>de</strong>l efecto <strong>de</strong>pen<strong>de</strong> <strong>de</strong>l tamaño<br />
<strong>de</strong>l estudio<br />
• Esta correlación n pue<strong>de</strong> indicar una verda<strong>de</strong>ra<br />
heterogeneidad entre estudios, fundamentalmente<br />
<strong>de</strong>bida a un diferente esfuerzo experimental entre<br />
estudios, es <strong>de</strong>cir, la rigurosidad <strong>de</strong>l estudio estaría<br />
en función n <strong>de</strong> su tamaño<br />
• En este caso podría a no ser valido el meta-an<br />
<strong>análisis</strong><br />
Análisis <strong>de</strong> la correlación<br />
ODDS RATIO<br />
2.4<br />
2.2<br />
2.0<br />
1.8<br />
1.6<br />
1.4<br />
1.2<br />
1.0<br />
0.8<br />
0.6<br />
0.4<br />
0.2<br />
CORRELATION BETWEEN THE EFFECT SIZE AND SAMPLE SIZE<br />
0.0<br />
100 140 180 220 260 300 340 380 420<br />
SAMPLE SIZE<br />
r 2 = 0.01<br />
b = 0.0009<br />
p = 0.70<br />
2007 <strong>Ferran</strong>.<strong>Torres</strong>@uab.es 31<br />
2007 <strong>Ferran</strong>.<strong>Torres</strong>@uab.es 32<br />
Análisis <strong>de</strong> la robustez<br />
Análisis <strong>de</strong>l sesgo <strong>de</strong> publicación n y/o<br />
inclusión n selectiva <strong>de</strong> estudios positivos (1)<br />
• Análisis <strong>de</strong>l sesgo <strong>de</strong> publicación n y/o inclusión<br />
selectiva <strong>de</strong> estudios positivos<br />
• Correlación n entre la magnitud <strong>de</strong>l efecto y<br />
el tamaño o muestral <strong>de</strong> los estudios.<br />
2007 <strong>Ferran</strong>.<strong>Torres</strong>@uab.es 33<br />
• La introducción n <strong>de</strong>l sesgo <strong>de</strong> publicación n y/o<br />
inclusión n selectiva <strong>de</strong> estudios positivos en un<br />
meta-an<br />
<strong>análisis</strong> se <strong>de</strong>be fundamentalmente a que:<br />
- La mayoría a <strong>de</strong> estudios publicados presentan<br />
resultados positivos significativos y una minoría<br />
muestran resultados negativos o no significativos<br />
- Hay una ten<strong>de</strong>ncia a seleccionar y, por tanto,<br />
incluir en el meta-an<br />
<strong>análisis</strong> los estudios o datos no<br />
publicados con resultados positivos significativos<br />
y a guardar los que muestran resultados<br />
negativos o no significativos<br />
2007 <strong>Ferran</strong>.<strong>Torres</strong>@uab.es 34<br />
Análisis <strong>de</strong>l sesgo <strong>de</strong> publicación n y/o inclusión<br />
selectiva <strong>de</strong> estudios positivos (2)<br />
RELATIVE LIVE-BIRTH RATIO<br />
PUBLISHED STUDIES VS UNPUBLISHED STUDIES<br />
1.8<br />
FAVOURS TREATMENT<br />
1.6<br />
1.4<br />
1.2<br />
1.0<br />
0.8<br />
0.6<br />
FAVOURS CONTROL<br />
0.4<br />
PUBLISHED UNPUBLISHED PUBLISHED PUBLISHED<br />
+ UNPUBLISHED + UNPUBLISHED<br />
Data from Jeng GT et al. JAMA 1995; 274:830-836<br />
DATA<br />
Análisis <strong>de</strong>l sesgo <strong>de</strong> publicación n y/o<br />
inclusión n selectiva <strong>de</strong> estudios positivos (3)<br />
Los métodos m<br />
utilizados para <strong>de</strong>tectar la introducción<br />
<strong>de</strong>l sesgo <strong>de</strong> publicación n en un meta-an<br />
<strong>análisis</strong> son:<br />
– Funnel plot<br />
– El <strong>análisis</strong> <strong>de</strong> la asimetria <strong>de</strong>l funnel plot<br />
Si el número n<br />
<strong>de</strong> estudios incluidos en el meta-an<br />
<strong>análisis</strong><br />
es pequeño, el funnel plot es poco útil. En este caso, el<br />
mejor método m<br />
es comparar el tamaño o <strong>de</strong>l efecto<br />
global entre los estudios publicados y no publicados<br />
En un meta-an<br />
<strong>análisis</strong> basado en todos los estudios<br />
originales, no es necesario analizar el sesgo <strong>de</strong><br />
publicación<br />
2007 <strong>Ferran</strong>.<strong>Torres</strong>@uab.es 35<br />
2007 <strong>Ferran</strong>.<strong>Torres</strong>@uab.es 36<br />
6
Funnel plot<br />
Funnel plot<br />
SAMPLE SIZE<br />
DEMONSTRATION OF FUNNEL PLOT<br />
220<br />
200<br />
180<br />
160<br />
140<br />
120<br />
100<br />
80<br />
60<br />
40<br />
20<br />
0<br />
0.2 0.4 0.6 0.8 1.0 1.2 1.4 1.6 1.8 2.0<br />
ODDS RATIO<br />
Published<br />
Unpublished<br />
Overall OR<br />
SAMPLE SIZE<br />
DEMONSTRATION OF FUNNEL PLOT<br />
220<br />
200<br />
180<br />
160<br />
140<br />
120<br />
100<br />
80<br />
60<br />
40<br />
20<br />
0<br />
0.2 0.4 0.6 0.8 1.0 1.2 1.4 1.6 1.8 2.0 2.2<br />
ODDS RATIO<br />
Published<br />
Overall OR<br />
2007 <strong>Ferran</strong>.<strong>Torres</strong>@uab.es 37<br />
2007 <strong>Ferran</strong>.<strong>Torres</strong>@uab.es 38<br />
Presentación n gráfica<br />
2007 <strong>Ferran</strong>.<strong>Torres</strong>@uab.es 39<br />
Conclusiones (1)<br />
1. El meta-an<br />
<strong>análisis</strong> es un herramienta valida y<br />
po<strong>de</strong>rosa para la síntesis s<br />
<strong>de</strong> la investigación<br />
siempre y cuando se aplique <strong>de</strong> forma a<strong>de</strong>cuada<br />
(justificación, protocolo, etc.)<br />
2. La utilización n no crítica <strong>de</strong>l meta-an<br />
<strong>análisis</strong> pue<strong>de</strong><br />
llevar a conclusiones erróneas. Las principales<br />
críticas que se realizan a un meta-an<br />
<strong>análisis</strong> son:<br />
- Sesgo <strong>de</strong> publicación n y/o inclusión n selectiva <strong>de</strong><br />
estudios positivos<br />
- Heterogeneidad entre estudios<br />
- Correlación n entre el tamaño o <strong>de</strong>l efecto y el<br />
tamaño o <strong>de</strong> la muestra<br />
2007 <strong>Ferran</strong>.<strong>Torres</strong>@uab.es 40<br />
Conclusiones (2)<br />
3. Únicamente cuando estos problemas son<br />
<strong>de</strong>bidamente consi<strong>de</strong>rados y analizados por<br />
medio <strong>de</strong>:<br />
- Análisis <strong>de</strong> la asimetría a <strong>de</strong>l funnel plot<br />
- Pruebas <strong>de</strong> homogeneidad<br />
- Análisis <strong>de</strong> la correlación n entre el<br />
tamaño o <strong>de</strong>l efecto y el tamaño o <strong>de</strong> la<br />
muestra <strong>de</strong> los estudios<br />
Es posible aplicar esta técnica t<br />
estadística<br />
stica<br />
para combinar los estudios <strong>de</strong> forma que los<br />
resultados globales sean científicamente<br />
validos<br />
<strong>Meta</strong>-an<br />
<strong>análisis</strong><br />
Ejemplo<br />
<strong>Ferran</strong> <strong>Torres</strong><br />
<strong>Ferran</strong>.<strong>Torres</strong>@uab.es<br />
2007 <strong>Ferran</strong>.<strong>Torres</strong>@uab.es 41<br />
2007 <strong>Ferran</strong>.<strong>Torres</strong>@uab.es 42<br />
7
Selection of studies<br />
Effects of plantago ovata<br />
husk on lipid metabolism.<br />
A meta-analysis<br />
analysis<br />
<br />
<br />
I<strong>de</strong>ntified 26 studies =>18 were valid<br />
according to the pre<strong>de</strong>fined criteria<br />
Exclu<strong>de</strong>d studies.<br />
– Most of them (7 of 8) insufficient information<br />
on <strong>de</strong>scriptive statistics to calculate the<br />
meta-analysis analysis estimates from those studies;<br />
– the other one was erroneously pre-selected<br />
since only insoluble fiber was used in that<br />
trial.<br />
2007 <strong>Ferran</strong>.<strong>Torres</strong>@uab.es 43<br />
2007 <strong>Ferran</strong>.<strong>Torres</strong>@uab.es 44<br />
<br />
<br />
Statistical issues on the results (1)<br />
Poor quality of information<br />
withdrawals and <strong>de</strong>scriptive results:<br />
Complete available <strong>de</strong>scriptive data, n, mean and<br />
dispersion (SD or SE), for the baseline subtracted effect<br />
was found only for one study (Williams 1995).<br />
– SD (or SE to <strong>de</strong>rive the SD):<br />
Estimated from baseline and final values by using<br />
correlation coefficients from other published data.<br />
If baseline or final SD not available: SD for the baseline<br />
difference was directly imputed from other published data.<br />
cross-over over <strong>de</strong>sign<br />
– Intrasubject correlation for the estimation of the SD of the<br />
treatment differences has been ignored for the cross-over<br />
over<br />
<strong>de</strong>sign because of (a) it was not available and (b) this is<br />
conservative since it leads to less significant results.<br />
<br />
Statistical issues on the results (2)<br />
Treatment arms<br />
2 per study except 1:<br />
– (MacMahon<br />
1998): The mentioned study was a<br />
three arm trial with a control group (n=74) and<br />
2 active doses of 7 G/d (n=101), and 10.5G/d<br />
(n=91).<br />
– Half the sample size of the control group (n=37;<br />
74/2) was used for the comparison between<br />
each active group.<br />
2007 <strong>Ferran</strong>.<strong>Torres</strong>@uab.es 45<br />
2007 <strong>Ferran</strong>.<strong>Torres</strong>@uab.es 46<br />
2007 <strong>Ferran</strong>.<strong>Torres</strong>@uab.es 47 2007 <strong>Ferran</strong>.<strong>Torres</strong>@uab.es 48<br />
8
Statistical issues on the results (3)<br />
Statistical issues on the results (3)<br />
<br />
Potential Publication Bias<br />
<br />
Heterogeneity and sensibility analysis<br />
– (a) The biggest studies have the lowest magnitu<strong>de</strong><br />
effect for Total Cholesterol, although the direction of<br />
the effect is positive for all of them.<br />
– (b) There are probably some unpublished small<br />
studies with negative results, although the bigger<br />
studies are positive.<br />
– (a) The biggest studies have the lowest magnitu<strong>de</strong> effect<br />
for Total Cholesterol, although the direction of the effect is<br />
positive for all of them.<br />
– (b) There are probably some unpublished small studies<br />
with negative results, although the bigger studies are<br />
positive.<br />
=><br />
– Pooled results too heterogeneous<br />
very cautious with the conclusions<br />
fixed effects not valid<br />
2007 <strong>Ferran</strong>.<strong>Torres</strong>@uab.es 49<br />
2007 <strong>Ferran</strong>.<strong>Torres</strong>@uab.es 50<br />
<strong>Meta</strong>-analysis analysis estimations<br />
Significant effect for<br />
– Total Cholesterol (p
Fiber vs Placebo effect in lipid reduction. HDL<br />
Hedges unbiased g, Random effects<br />
Fiber vs Placebo effect in lipid reduction. LDL<br />
Hedges unbiased g, Random effects<br />
Estimates with 95% confi<strong>de</strong>nce intervals<br />
Estimates with 95% confi<strong>de</strong>nce intervals<br />
Fiber<br />
Study<br />
n: mean(SD)<br />
ANDERSON 1988 13: -0.090(0.042)<br />
BELL 1989 40: 0.050(0.066)<br />
BELL 1990 19: -0.020(0.080)<br />
LEVIN 1990 30: 0.026(0.168)<br />
NEAL 1990 27: 0.060(0.168)<br />
ANDERSON 1991 27: -0.020(0.099)<br />
ANDERSON 1992 21: -0.020(0.057)<br />
EVERSON 1992 20: 0.026(0.100)<br />
SPRECHER 1993 59: -0.026(0.055)<br />
SPRECHERON 1993 20: -0.020(0.224)<br />
MACIEJKO 1994 18: 0.130(0.154)<br />
SUMMERBELL 1994 19: -0.010(0.070)<br />
WOLEVER 1994 18: -0.040(0.030)<br />
WILLIAMS 1995 26: 0.106(0.094)<br />
WEINGAND 1997 23: 0.055(0.168)<br />
RODRIGUEZ-MORAN 1998 62: 0.440(0.454)<br />
ANDERSON 1999 14: 0.005(0.168)<br />
Control<br />
n: mean(SD)<br />
13: -0.090(0.141)<br />
35: 0.030(0.058)<br />
19: -0.020(0.072)<br />
28: 0.078(0.168)<br />
27: 0.140(0.168)<br />
25: 0.000(0.072)<br />
23: -0.010(0.024)<br />
20: 0.000(0.094)<br />
59: -0.013(0.059)<br />
20: -0.040(0.134)<br />
18: 0.130(0.120)<br />
18: 0.070(0.085)<br />
18: 0.040(0.030)<br />
24: 0.039(0.031)<br />
23: -0.185(0.168)<br />
63: 0.078(0.044)<br />
15: 0.017(0.168)<br />
Fiber<br />
Study<br />
n: mean(SD)<br />
ANDERSON 1988 13: -0.840(0.264)<br />
BELL 1989 40: -0.310(0.081)<br />
BELL 1990 19: -0.160(0.100)<br />
LEVIN 1990 30: -0.337(0.224)<br />
NEAL 1990 27: -0.480(0.448)<br />
ANDERSON 1991 27: -0.590(0.283)<br />
ANDERSON 1992 21: -0.560(0.385)<br />
EVERSON 1992 20: -0.389(0.372)<br />
SPRECHER 1993 59: -0.332(0.096)<br />
SPRECHERON 1993 20: 0.040(0.358)<br />
MACIEJKO 1994 18: -1.090(0.216)<br />
SUMMERBELL 1994 19: -0.440(0.194)<br />
WOLEVER 1994 18: -0.260(0.016)<br />
WILLIAMS 1995 26: -0.613(0.093)<br />
WEINGAND 1997 23: -0.320(0.427)<br />
MACMAHON 1998 101: -0.630(0.427)<br />
MACMAHON 1998 91: -0.710(0.427)<br />
RODRIGUEZ-MORAN 1998 62: -0.725(0.427)<br />
ANDERSON 1999 14: -0.179(0.427)<br />
Control<br />
n: mean(SD)<br />
13: -0.110(0.321)<br />
35: 0.000(0.232)<br />
19: -0.140(0.252)<br />
28: -0.104(0.144)<br />
27: -0.140(0.523)<br />
25: -0.200(0.147)<br />
23: -0.130(0.211)<br />
20: -0.130(0.099)<br />
59: -0.057(0.200)<br />
20: -0.060(0.358)<br />
18: -0.850(0.941)<br />
18: -0.250(0.261)<br />
18: 0.280(0.316)<br />
24: -0.221(0.238)<br />
23: -0.020(0.427)<br />
37: -0.580(0.427)<br />
37: -0.580(0.427)<br />
63: -0.440(0.427)<br />
15: 0.281(0.427)<br />
Pooled(random effects)<br />
n=448<br />
n=456<br />
-0.03 ( -0.39 , 0.33 )<br />
Pooled(random effects)<br />
n=522<br />
n=648<br />
-1.02 ( -1.36 , -0.69 )<br />
-5 -4 -3 -2 -1 0 1 2 3 4 5<br />
-5 -4 -3 -2 -1 0 1 2 3 4 5<br />
Absolute Baseline Reduction<br />
Absolute Baseline Reduction<br />
Control better<br />
Fiber better<br />
2007 <strong>Ferran</strong>.<strong>Torres</strong>@uab.es 55<br />
Fiber better<br />
Control better<br />
2007 <strong>Ferran</strong>.<strong>Torres</strong>@uab.es 56<br />
Fiber vs Placebo effect in lipid reduction. LDL<br />
Hedges unbiased g, Fixed effects<br />
Fiber vs Placebo effect in lipid reduction. LDL<br />
Difference of means (mmol/L), Random effects<br />
Estimates with 95% confi<strong>de</strong>nce intervals<br />
Estimates with 95% confi<strong>de</strong>nce intervals<br />
Fiber<br />
Study<br />
n: mean(SD)<br />
ANDERSON 1988 13: -0.840(0.264)<br />
BELL 1989 40: -0.310(0.081)<br />
BELL 1990 19: -0.160(0.100)<br />
LEVIN 1990 30: -0.337(0.224)<br />
NEAL 1990 27: -0.480(0.448)<br />
ANDERSON 1991 27: -0.590(0.283)<br />
ANDERSON 1992 21: -0.560(0.385)<br />
EVERSON 1992 20: -0.389(0.372)<br />
SPRECHER 1993 59: -0.332(0.096)<br />
SPRECHERON 1993 20: 0.040(0.358)<br />
MACIEJKO 1994 18: -1.090(0.216)<br />
SUMMERBELL 1994 19: -0.440(0.194)<br />
WOLEVER 1994 18: -0.260(0.016)<br />
WILLIAMS 1995 26: -0.613(0.093)<br />
WEINGAND 1997 23: -0.320(0.427)<br />
MACMAHON 1998 101: -0.630(0.427)<br />
MACMAHON 1998 91: -0.710(0.427)<br />
RODRIGUEZ-MORAN 1998 62: -0.725(0.427)<br />
ANDERSON 1999 14: -0.179(0.427)<br />
Control<br />
n: mean(SD)<br />
13: -0.110(0.321)<br />
35: 0.000(0.232)<br />
19: -0.140(0.252)<br />
28: -0.104(0.144)<br />
27: -0.140(0.523)<br />
25: -0.200(0.147)<br />
23: -0.130(0.211)<br />
20: -0.130(0.099)<br />
59: -0.057(0.200)<br />
20: -0.060(0.358)<br />
18: -0.850(0.941)<br />
18: -0.250(0.261)<br />
18: 0.280(0.316)<br />
24: -0.221(0.238)<br />
23: -0.020(0.427)<br />
37: -0.580(0.427)<br />
37: -0.580(0.427)<br />
63: -0.440(0.427)<br />
15: 0.281(0.427)<br />
Pooled(fixed effects)<br />
n=522<br />
n=648<br />
-0.88 ( -1.01 , -0.75 )<br />
Pooled(random effects)<br />
n=522<br />
n=648<br />
-0.28 ( -0.35 , -0.21 )<br />
-5 -4 -3 -2 -1 0 1 2 3 4 5<br />
-1.0 -0.7 -0.4 -0.1 0.1 0.3 0.5 0.7 0.9<br />
Absolute Baseline Reduction<br />
Absolute Baseline Reduction<br />
Fiber better<br />
Control better<br />
2007 <strong>Ferran</strong>.<strong>Torres</strong>@uab.es 57<br />
Fiber better<br />
Control better<br />
2007 <strong>Ferran</strong>.<strong>Torres</strong>@uab.es 58<br />
Fiber vs Placebo effect in lipid reduction. Triglyceri<strong>de</strong>s<br />
Hedges unbiased g, Random effects<br />
Fiber vs Placebo effect in lipid reduction. Triglyceri<strong>de</strong>s<br />
Hedges unbiased g, Fixed effects<br />
Estimates with 95% confi<strong>de</strong>nce intervals<br />
Estimates with 95% confi<strong>de</strong>nce intervals<br />
Study<br />
ANDERSON 1988<br />
Fiber<br />
n: mean(SD)<br />
13: -0.210(0.058)<br />
Control<br />
n: mean(SD)<br />
13: 0.190(0.479)<br />
Study<br />
ANDERSON 1988<br />
Fiber<br />
n: mean(SD)<br />
13: -0.210(0.058)<br />
Control<br />
n: mean(SD)<br />
13: 0.190(0.479)<br />
BELL 1989<br />
40: 0.030(0.302)<br />
35: -0.050(0.102)<br />
BELL 1989<br />
40: 0.030(0.302)<br />
35: -0.050(0.102)<br />
BELL 1990<br />
19: -0.135(0.214)<br />
19: 0.030(0.201)<br />
BELL 1990<br />
19: -0.135(0.214)<br />
19: 0.030(0.201)<br />
LEVIN 1990<br />
30: -0.011(0.320)<br />
28: 0.000(0.088)<br />
LEVIN 1990<br />
30: -0.011(0.320)<br />
28: 0.000(0.088)<br />
NEAL 1990<br />
27: -0.240(0.293)<br />
27: -0.140(0.313)<br />
NEAL 1990<br />
27: -0.240(0.293)<br />
27: -0.140(0.313)<br />
ANDERSON 1991<br />
27: 0.200(0.516)<br />
25: -0.120(0.185)<br />
ANDERSON 1991<br />
27: 0.200(0.516)<br />
25: -0.120(0.185)<br />
ANDERSON 1992<br />
21: 0.080(0.455)<br />
23: 0.300(0.791)<br />
ANDERSON 1992<br />
21: 0.080(0.455)<br />
23: 0.300(0.791)<br />
EVERSON 1992<br />
20: 0.102(0.630)<br />
20: 0.000(0.224)<br />
EVERSON 1992<br />
20: 0.102(0.630)<br />
20: 0.000(0.224)<br />
SPRECHER 1993<br />
59: 0.006(0.308)<br />
59: 0.150(0.345)<br />
SPRECHER 1993<br />
59: 0.006(0.308)<br />
59: 0.150(0.345)<br />
SPRECHERON 1993<br />
20: 0.240(0.805)<br />
20: 0.920(1.163)<br />
SPRECHERON 1993<br />
20: 0.240(0.805)<br />
20: 0.920(1.163)<br />
MACIEJKO 1994<br />
18: 0.450(1.008)<br />
18: 0.410(0.351)<br />
MACIEJKO 1994<br />
18: 0.450(1.008)<br />
18: 0.410(0.351)<br />
WILLIAMS 1995<br />
26: -0.142(0.249)<br />
24: -0.232(0.137)<br />
WILLIAMS 1995<br />
26: -0.142(0.249)<br />
24: -0.232(0.137)<br />
WEINGAND 1997<br />
23: 0.002(0.781)<br />
23: 0.002(0.781)<br />
WEINGAND 1997<br />
23: 0.002(0.781)<br />
23: 0.002(0.781)<br />
RODRIGUEZ-MORAN 1998<br />
62: -0.554(0.781)<br />
63: -0.181(0.781)<br />
RODRIGUEZ-MORAN 1998<br />
62: -0.554(0.781)<br />
63: -0.181(0.781)<br />
ANDERSON 1999<br />
14: 0.165(0.781)<br />
15: 0.342(0.781)<br />
ANDERSON 1999<br />
14: 0.165(0.781)<br />
15: 0.342(0.781)<br />
Pooled(random effects)<br />
n=412<br />
n=419<br />
-0.15 ( -0.39 , 0.09 )<br />
Pooled(fixed effects)<br />
n=412<br />
n=419<br />
-0.16 ( -0.30 , -0.02 )<br />
-5 -4 -3 -2 -1 0 1 2 3 4 5<br />
-5 -4 -3 -2 -1 0 1 2 3 4 5<br />
Absolute Baseline Reduction<br />
Absolute Baseline Reduction<br />
Fiber better<br />
Control better<br />
2007 <strong>Ferran</strong>.<strong>Torres</strong>@uab.es 59<br />
Fiber better<br />
Control better<br />
2007 <strong>Ferran</strong>.<strong>Torres</strong>@uab.es 60<br />
10
Study<br />
ANDERSON 1988<br />
BELL 1989<br />
BELL 1990<br />
LEVIN 1990<br />
NEAL 1990<br />
ANDERSON 1991<br />
ANDERSON 1992<br />
EVERSON 1992<br />
SPRECHER 1993<br />
SPRECHERON 1993<br />
MACIEJKO 1994<br />
WILLIAMS 1995<br />
WEINGAND 1997<br />
RODRIGUEZ-MORAN 1998<br />
ANDERSON 1999<br />
Fiber vs Placebo effect in lipid reduction. Triglyceri<strong>de</strong>s<br />
Difference of means (mmol/L), Random effects<br />
Fiber<br />
n: mean(SD)<br />
13: -0.210(0.058)<br />
40: 0.030(0.302)<br />
19: -0.135(0.214)<br />
30: -0.011(0.320)<br />
27: -0.240(0.293)<br />
27: 0.200(0.516)<br />
21: 0.080(0.455)<br />
20: 0.102(0.630)<br />
59: 0.006(0.308)<br />
20: 0.240(0.805)<br />
18: 0.450(1.008)<br />
26: -0.142(0.249)<br />
23: 0.002(0.781)<br />
62: -0.554(0.781)<br />
14: 0.165(0.781)<br />
Control<br />
n: mean(SD)<br />
13: 0.190(0.479)<br />
35: -0.050(0.102)<br />
19: 0.030(0.201)<br />
28: 0.000(0.088)<br />
27: -0.140(0.313)<br />
25: -0.120(0.185)<br />
23: 0.300(0.791)<br />
20: 0.000(0.224)<br />
59: 0.150(0.345)<br />
20: 0.920(1.163)<br />
18: 0.410(0.351)<br />
24: -0.232(0.137)<br />
23: 0.002(0.781)<br />
63: -0.181(0.781)<br />
15: 0.342(0.781)<br />
Estimates with 95% confi<strong>de</strong>nce intervals<br />
Subgroups<br />
SS with ES>1<br />
– Cholesterol and LDL<br />
fiber food supplement compound<br />
intake duration between 4 and 8 weeks<br />
daily doses >10G/d<br />
Mo<strong>de</strong>rate SS ES<br />
– >8 weeks regimens<br />
-0.7 cholesterol and -0.8 LDL<br />
SS with ES≈1<br />
– periods of study publication: no clear trend<br />
Pooled(random effects)<br />
n=412<br />
n=419<br />
-0.07 ( -0.16 , 0.03 )<br />
-1.0 -0.7 -0.4 -0.1 0.1 0.3 0.5 0.7 0.9<br />
Absolute Baseline Reduction<br />
Adult population: replication of the main pooled<br />
effect because only 2 studies on childhood.<br />
Fiber better<br />
Control better<br />
2007 <strong>Ferran</strong>.<strong>Torres</strong>@uab.es 61<br />
2007 <strong>Ferran</strong>.<strong>Torres</strong>@uab.es 62<br />
Group<br />
Cholesterol<br />
Hedges’ g<br />
estimator<br />
(random)<br />
95%<br />
Lower<br />
Limit<br />
95%<br />
Upper<br />
Limit<br />
P value<br />
Main pooled effect 0.000 -1.007 -1.311 -0.703<br />
Type of fiber<br />
Fiber food supplement compound 0.000 -1.134 -1.561 -0.707<br />
Diet or Cereals supplements 0.000 -0.869 -1.313 -0.426<br />
Duration of fiber Intake<br />
4 to 8 weeks 0.024 -0.672 -1.255 -0.088<br />
Daily dose<br />
< 5 G/d 0.939 -0.024 -0.644 0.596<br />
>= 5 to 10 G/d 0.005 -0.908 -1.542 -0.275<br />
>10 G/d 0.000 -1.123 -1.477 -0.769<br />
Population<br />
Non Adults 0.303 -0.786 -2.282 0.711<br />
Adults 0.000 -1.032 -1.350 -0.714<br />
Year of publication<br />
1988-1990 0.000 -1.807 -2.418 -1.196<br />
1991-1993 0.001 -0.786 -1.234 -0.338<br />
1994-1997 0.000 -0.971 -1.456 -0.486<br />
>=1998 0.016 -0.370 -0.673 -0.068<br />
Group<br />
LDL<br />
Hedges’ g<br />
estimator<br />
(random)<br />
95%<br />
Lower<br />
Limit<br />
95%<br />
Upper<br />
Limit<br />
P value<br />
Main pooled effect 0.000 -1.023 -1.356 -0.690<br />
Type of fiber<br />
Fiber food supplement compound 0.000 -1.191 -1.569 -0.813<br />
Diet or Cereals supplements 0.002 -0.833 -1.360 -0.306<br />
Duration of fiber Intake<br />
4 to 8 weeks 0.036 -0.765 -1.480 -0.051<br />
Daily dose<br />
< 5 G/d 0.389 0.274 -0.349 0.897<br />
>= 5 to 10 G/d 0.022 -0.950 -1.761 -0.139<br />
>10 G/d 0.000 -1.154 -1.457 -0.851<br />
Population<br />
Non Adults 0.441 -0.942 -3.338 1.454<br />
Adults 0.000 -1.029 -1.354 -0.704<br />
Year of publication<br />
1988-1990 0.001 -1.192 -1.891 -0.493<br />
1991-1993 0.003 -1.102 -1.834 -0.370<br />
1994-1997 0.001 -1.245 -2.008 -0.481<br />
>=1998 0.008 -0.453 -0.788 -0.118<br />
2007 <strong>Ferran</strong>.<strong>Torres</strong>@uab.es 63<br />
2007 <strong>Ferran</strong>.<strong>Torres</strong>@uab.es 64<br />
<strong>Meta</strong>-an<br />
<strong>análisis</strong><br />
Ejemplo<br />
<strong>Ferran</strong> <strong>Torres</strong><br />
<strong>Ferran</strong>.<strong>Torres</strong>@uab.es<br />
Example<br />
Fleiss JL The statistical basis of meta-analysis.<br />
analysis.<br />
Statistical Methods in Medical research 1993; 2:<br />
121-145.<br />
145.<br />
Results of seven placebo-controlled controlled randomised<br />
studies of the effect of aspirin in preventing<br />
<strong>de</strong>ath after myocardial infarction<br />
2007 <strong>Ferran</strong>.<strong>Torres</strong>@uab.es 65<br />
2007 <strong>Ferran</strong>.<strong>Torres</strong>@uab.es 66<br />
11
Studies of aspirin in myocardial<br />
infarction<br />
Study<br />
<strong>de</strong>aths<br />
Total patients<br />
AAS Placebo AAS Placebo<br />
MRC-1 49 67 615 624<br />
CDP 44 64 758 771<br />
MRC-2 102 126 832 850<br />
GASP 32 38 317 309<br />
PARIS 85 104 810 812<br />
AMIS 246 219 2267 2257<br />
ISIS-2 1570 1720 8587 8600<br />
<strong>Meta</strong>-analysis of Aspirin trials<br />
Study OR 95% CI y=ln(OR) se{lnOR} w Prop weight<br />
MRC-1 0.72 0.49 1.06 -0.33 0.19 26.3 2.9%<br />
CDP 0.68 0.46 1.01 -0.38 0.20 25.1 2.8%<br />
MRC-2 0.80 0.61 1.06 -0.22 0.14 49.3 5.4%<br />
GASP 0.80 0.49 1.32 -0.22 0.25 15.6 1.7%<br />
PARIS 0.79 0.54 1.16 -0.23 0.19 27.1 3.0%<br />
AMIS 1.13 0.94 1.37 0.12 0.10 104.3 11.4%<br />
ISIS-2 0.90 0.83 0.97 -0.11 0.04 665.1 72.9%<br />
∑ w i<br />
y i<br />
= −99.3<br />
∑ wi<br />
= 910.8<br />
Pooled estimate of ln(OR) =<br />
− 99.3<br />
= −0.11<br />
910.8<br />
OR = 0.90 (0.84 0.96)<br />
2007 <strong>Ferran</strong>.<strong>Torres</strong>@uab.es 67<br />
2007 <strong>Ferran</strong>.<strong>Torres</strong>@uab.es 68<br />
Graphical representation<br />
Fixed OR = 0.90 (0.84 0.96)<br />
Study OR 95% CI y=ln(OR) se{lnOR} w Prop weight<br />
MRC-1 0.72 0.49 1.06 -0.33 0.19 26.3 2.9%<br />
CDP 0.68 0.46 1.01 -0.38 0.20 25.1 2.8%<br />
MRC-2 0.80 0.61 1.06 -0.22 0.14 49.3 5.4%<br />
GASP 0.80 0.49 1.32 -0.22 0.25 15.6 1.7%<br />
PARIS 0.79 0.54 1.16 -0.23 0.19 27.1 3.0%<br />
AMIS 1.13 0.94 1.37 0.12 0.10 104.3 11.4%<br />
ISIS-2 0.90 0.83 0.97 -0.11 0.04 665.1 72.9%<br />
Random OR= 0.88 95%CI : (0.77 ; 0.99)<br />
2007 <strong>Ferran</strong>.<strong>Torres</strong>@uab.es 69<br />
Study OR 95% CI y=ln(OR) var Prop weight<br />
MRC-1 0.72 0.46 1.10 -0.33 0.05 8.0%<br />
CDP 0.68 0.43 1.05 -0.38 0.05 8.0%<br />
MRC-2 0.80 0.57 1.12 -0.22 0.03 13.0%<br />
GASP 0.80 0.46 1.36 -0.22 0.07 5.0%<br />
PARIS 0.79 0.52 1.20 -0.23 0.05 9.0%<br />
AMIS 1.13 0.86 1.48 0.12 0.02 21.0%<br />
ISIS-2 0.90 0.72 1.10 -0.11 0.01 36.0%<br />
2007 <strong>Ferran</strong>.<strong>Torres</strong>@uab.es 70<br />
2007 <strong>Ferran</strong>.<strong>Torres</strong>@uab.es 71 2007 <strong>Ferran</strong>.<strong>Torres</strong>@uab.es 72<br />
12
10.4%-14.2% = 3.8%<br />
2007 <strong>Ferran</strong>.<strong>Torres</strong>@uab.es 73 2007 <strong>Ferran</strong>.<strong>Torres</strong>@uab.es 74<br />
<strong>Meta</strong>-an<br />
<strong>análisis</strong><br />
Normativas<br />
<strong>Ferran</strong> <strong>Torres</strong><br />
<strong>Ferran</strong>.<strong>Torres</strong>@uab.es<br />
2007 <strong>Ferran</strong>.<strong>Torres</strong>@uab.es 75<br />
Guias y Normativas<br />
ICH - E9: Statistical Principles for Clinical<br />
Trials Note for Guidance on Statistical<br />
Principles for Clinical Trials.<br />
CMP/ICH/363/96. September 1998<br />
CPMP/EWP/2330/99: Validity and<br />
Interpretation of Pooled Analyses, and one<br />
Pivotal study<br />
The Potsdam International Consultation on<br />
<strong>Meta</strong>-analysis analysis Potsdam, Germany, March 1994<br />
QUORUM. Statement. Lancet 1999; 354:<br />
1896-1900.<br />
1900.<br />
2007 <strong>Ferran</strong>.<strong>Torres</strong>@uab.es 76<br />
Potsdam International<br />
Cosultation<br />
• Journal of Clinical Epi<strong>de</strong>miology 1995; 48: 1-711<br />
• Cook DJ, Sackett DL, Spitzer WO. Methodologic<br />
gui<strong>de</strong>lines for systematic reviews of randomized<br />
control trials in health care from the Potsdam<br />
consultation meta-analysis<br />
analysis. . J Clin Epi<strong>de</strong>miol 1995;<br />
48:168-71.<br />
Describen los pasos que se <strong>de</strong>ben seguir en el<br />
<strong>de</strong>sarrollo <strong>de</strong> un meta-an<br />
<strong>análisis</strong> riguroso<br />
2007 <strong>Ferran</strong>.<strong>Torres</strong>@uab.es 77<br />
2007 <strong>Ferran</strong>.<strong>Torres</strong>@uab.es 78<br />
13
ICH Biostatistical gui<strong>de</strong>line<br />
”Individual clinical trials should always be large<br />
enough to satisfy their objectives.”<br />
”The<br />
use of meta-analytic analytic techniques to<br />
combine these estimates is often useful,<br />
because it allows a more precise estimate of<br />
the size of the treatment effects.”<br />
ICH Biostatistical gui<strong>de</strong>line<br />
”Un<strong>de</strong>r<br />
exceptional circumstances a meta-<br />
analytic approach may be the most<br />
appropriate way to, or the only way, , of<br />
providing sufficient overall evi<strong>de</strong>nce of<br />
efficacy ...”<br />
2007 <strong>Ferran</strong>.<strong>Torres</strong>@uab.es 79<br />
2007 <strong>Ferran</strong>.<strong>Torres</strong>@uab.es 80<br />
PtC on <strong>Meta</strong>-analyses<br />
analyses<br />
Acceptable regulatory purposes for meta analysis<br />
”… not to encourage applicants to rely on a<br />
submission where stand alone studies<br />
have been substituted by a meta-<br />
analysis of trials of ina<strong>de</strong>quate size.”<br />
To improve the precision of the estimate of<br />
efficacy<br />
To evaluate whether overall positive results<br />
are also seen in pre-specified subgroups<br />
To evaluate apparently conflicting results.<br />
2007 <strong>Ferran</strong>.<strong>Torres</strong>@uab.es 81<br />
2007 <strong>Ferran</strong>.<strong>Torres</strong>@uab.es 82<br />
Acceptable regulatory purposes for meta<br />
analysis<br />
To evaluate an additional efficacy outcome<br />
that requires more power than the individual<br />
trials can provi<strong>de</strong>.<br />
To evaluate safety in a subgroup, , or a rare<br />
event in all patients.<br />
Pre-specification<br />
specification: : <strong>Meta</strong>-analysis analysis protocol<br />
The objective of the analyis.<br />
Criteria for inclusion and exclusion of studies<br />
(study<br />
populations, study <strong>de</strong>sign, dosage,<br />
duration etc).<br />
Strategy for in<strong>de</strong>ntification of studies.<br />
Endpoints. . The <strong>de</strong>finitions set up for the<br />
individual studies should be followed.<br />
2007 <strong>Ferran</strong>.<strong>Torres</strong>@uab.es 83<br />
2007 <strong>Ferran</strong>.<strong>Torres</strong>@uab.es 84<br />
14
Pre-specification<br />
specification: : <strong>Meta</strong>-analysis analysis protocol<br />
Statistical methods. . P-value P<br />
more extreme<br />
than the conventional 0.05. Evaluation of<br />
hetreogeneity.<br />
Plan for evaluation of robustness.<br />
Demonstration of consistency in alternative<br />
analyses.<br />
Timing of the meta-analysis analysis protocol<br />
A retrospective specification should be<br />
avoi<strong>de</strong>d if possible.<br />
In retrospectively specified protocols the<br />
primary specifications and <strong>de</strong>finitions set up<br />
in the indivi-dual dual studies should be followed.<br />
2007 <strong>Ferran</strong>.<strong>Torres</strong>@uab.es 85<br />
2007 <strong>Ferran</strong>.<strong>Torres</strong>@uab.es 86<br />
Retrospective meta-analysis<br />
analysis<br />
May be acceptable if<br />
some studies clearly positive<br />
no major numerical interactions<br />
positive trend in inconclusive studies<br />
pooled CI well away from zero (or unity)<br />
selection bias unlikely<br />
robustness of the findings<br />
Selection of studies<br />
Obligation to submit all studies relevant to<br />
the claims ma<strong>de</strong>.<br />
Selection bias normally not a problem for new<br />
chemical entities.<br />
Selection bias in drug applications not specific<br />
to applications with a meta-analysis<br />
analysis<br />
2007 <strong>Ferran</strong>.<strong>Torres</strong>@uab.es 87<br />
2007 <strong>Ferran</strong>.<strong>Torres</strong>@uab.es 88<br />
Selection of studies<br />
Clinical relevance of pooled results<br />
Substantial risk for selection bias in<br />
applications wholly or partly relying on<br />
bibliographical data.<br />
The strategy for in<strong>de</strong>ntifying relevant<br />
studies should be presented together with a<br />
thorough discussion of a potential selection<br />
bias.<br />
Statistical significance vs clinical relevance.<br />
Emphasis on clinical judgement.<br />
Significant effects might be to small to<br />
result in a positive overall risk/benefit<br />
benefit.<br />
2007 <strong>Ferran</strong>.<strong>Torres</strong>@uab.es 89<br />
2007 <strong>Ferran</strong>.<strong>Torres</strong>@uab.es 90<br />
15
Heterogeneity and external validity<br />
Are the study populations sufficiently<br />
representative of a common target population<br />
(dosage, duration, severity etc)?<br />
Are there any reason to suspect a clinically<br />
relevant interaction?<br />
Suspected interactions and major clinical<br />
differences among the individual studies should be<br />
evaluated in alternative analyses.<br />
2007 <strong>Ferran</strong>.<strong>Torres</strong>@uab.es 91<br />
Pooled analyses of safety endpoints<br />
Less sophisticated pooling of data from<br />
variable sources.<br />
Strigent meta-analysis<br />
analysis for in <strong>de</strong>pth evaluation<br />
of safety signals from less reliable analyses.<br />
Special attention to the inclusion of studies<br />
that are likely to dilute potential negative<br />
effect.<br />
Intra-study comparisons a minimum<br />
requirement.<br />
2007 <strong>Ferran</strong>.<strong>Torres</strong>@uab.es 92<br />
ICH E9 Statistical principles for Clinical<br />
Trials, , 1998<br />
What is the crucial question?<br />
”The<br />
results of the confirmatory trial(s)<br />
should be robust.”<br />
”In<br />
some circumstances the weight of<br />
evi<strong>de</strong>nce from a single confirmatory<br />
trial may be sufficient.”<br />
Do we have enough studies?<br />
or<br />
Do we have enough data?<br />
2007 <strong>Ferran</strong>.<strong>Torres</strong>@uab.es 93<br />
2007 <strong>Ferran</strong>.<strong>Torres</strong>@uab.es 94<br />
Arguments for replication<br />
More than one study provi<strong>de</strong>s a broa<strong>de</strong>r basis<br />
for generalisation of the results.<br />
Protection against fraud<br />
Reduced risk for some hid<strong>de</strong>n systematic bias<br />
The general <strong>de</strong>mand for replication of<br />
scientific results<br />
Fundamental requirement on the phase<br />
III documentation<br />
A<strong>de</strong>quate and well-controlled<br />
data of good quality<br />
A sufficient number of patients,<br />
with a sufficient variety and disease conditions,<br />
collected by a sufficent number of investigators,<br />
<strong>de</strong>monstrating a positive risk/benefit<br />
in the inten<strong>de</strong>d<br />
population at the inten<strong>de</strong>d dose and manner of use.<br />
Minimum requirement: One controlled study with<br />
sta-tistically tistically compelling and clinically relevant<br />
results.<br />
2007 <strong>Ferran</strong>.<strong>Torres</strong>@uab.es 95<br />
2007 <strong>Ferran</strong>.<strong>Torres</strong>@uab.es 96<br />
16
Reasons to plan for more than one study<br />
Lack of pharmacological rationale<br />
A new pharmocological principle<br />
Phase I and phase II data limited or<br />
unconvincing<br />
A therapeutic area with a history of failed<br />
studies or failures to confirm seemingly<br />
convincing results<br />
Any other need to address additional<br />
questions in the phase III program<br />
Crucial issues in the one pivotal study situation<br />
Internal and external validity.<br />
Clinical relevance. . The treatment benefit<br />
must be large enough to be clinically<br />
relevant.<br />
Statistical significance. Passing the<br />
conventional 5% significance level is usually<br />
not sufficient.<br />
2007 <strong>Ferran</strong>.<strong>Torres</strong>@uab.es 97<br />
2007 <strong>Ferran</strong>.<strong>Torres</strong>@uab.es 98<br />
Crucial issues in the one pivotal study situation<br />
Data quality<br />
Internal consistency. Similar findings in<br />
pre-specified sub-populations and for<br />
different endpoints.<br />
Center effects.<br />
Plausibility of the hypothesis tested.<br />
Scientific advice on One confirmatory study<br />
Sponsors’ argument<br />
New/exten<strong>de</strong>d exten<strong>de</strong>d indication, pediatric indication<br />
New formulation<br />
Effects on survival<br />
Serious disease (e.g. cancer)<br />
Life-long disease without cure<br />
No therapy currently available<br />
Rare disease (orphan drug)<br />
One study in each of two indications<br />
Placebo controlled dose-finding<br />
study positive<br />
2007 <strong>Ferran</strong>.<strong>Torres</strong>@uab.es 99<br />
2007 <strong>Ferran</strong>.<strong>Torres</strong>@uab.es 100<br />
Conclusion on One Pivotal study<br />
There is no formal requirement to inclu<strong>de</strong> two<br />
or more pivotal studies in the phase III<br />
program.<br />
In most cases several studies is the most<br />
feasible way to provi<strong>de</strong> the data nee<strong>de</strong>d.<br />
In the exceptional event of a one pivotal<br />
study application, theis study has to be<br />
particularly compelling.<br />
2007 <strong>Ferran</strong>.<strong>Torres</strong>@uab.es 101<br />
17


