Untitled - Joint Center for Housing Studies - Harvard University
Untitled - Joint Center for Housing Studies - Harvard University
Untitled - Joint Center for Housing Studies - Harvard University

Create successful ePaper yourself
Turn your PDF publications into a flip-book with our unique Google optimized e-Paper software.
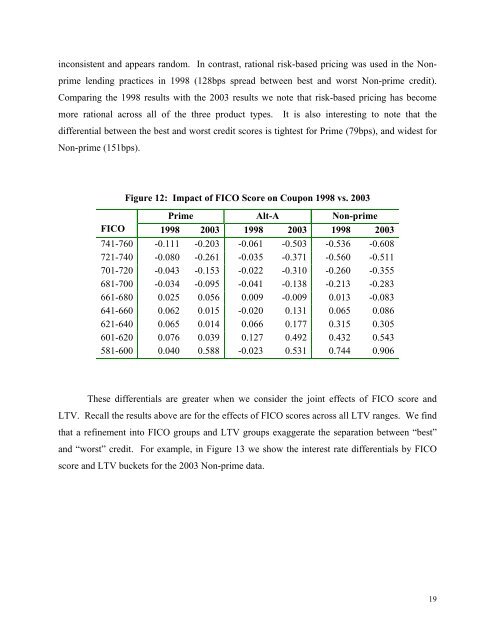
inconsistent and appears random. In contrast, rational risk-based pricing was used in the Nonprime<br />
lending practices in 1998 (128bps spread between best and worst Non-prime credit).<br />
Comparing the 1998 results with the 2003 results we note that risk-based pricing has become<br />
more rational across all of the three product types. It is also interesting to note that the<br />
differential between the best and worst credit scores is tightest <strong>for</strong> Prime (79bps), and widest <strong>for</strong><br />
Non-prime (151bps).<br />
Figure 12: Impact of FICO Score on Coupon 1998 vs. 2003<br />
Prime Alt-A Non-prime<br />
FICO 1998 2003 1998 2003 1998 2003<br />
741-760 -0.111 -0.203 -0.061 -0.503 -0.536 -0.608<br />
721-740 -0.080 -0.261 -0.035 -0.371 -0.560 -0.511<br />
701-720 -0.043 -0.153 -0.022 -0.310 -0.260 -0.355<br />
681-700 -0.034 -0.095 -0.041 -0.138 -0.213 -0.283<br />
661-680 0.025 0.056 0.009 -0.009 0.013 -0.083<br />
641-660 0.062 0.015 -0.020 0.131 0.065 0.086<br />
621-640 0.065 0.014 0.066 0.177 0.315 0.305<br />
601-620 0.076 0.039 0.127 0.492 0.432 0.543<br />
581-600 0.040 0.588 -0.023 0.531 0.744 0.906<br />
These differentials are greater when we consider the joint effects of FICO score and<br />
LTV. Recall the results above are <strong>for</strong> the effects of FICO scores across all LTV ranges. We find<br />
that a refinement into FICO groups and LTV groups exaggerate the separation between “best”<br />
and “worst” credit. For example, in Figure 13 we show the interest rate differentials by FICO<br />
score and LTV buckets <strong>for</strong> the 2003 Non-prime data.<br />
19