Untitled - Joint Center for Housing Studies - Harvard University
Untitled - Joint Center for Housing Studies - Harvard University
Untitled - Joint Center for Housing Studies - Harvard University

You also want an ePaper? Increase the reach of your titles
YUMPU automatically turns print PDFs into web optimized ePapers that Google loves.
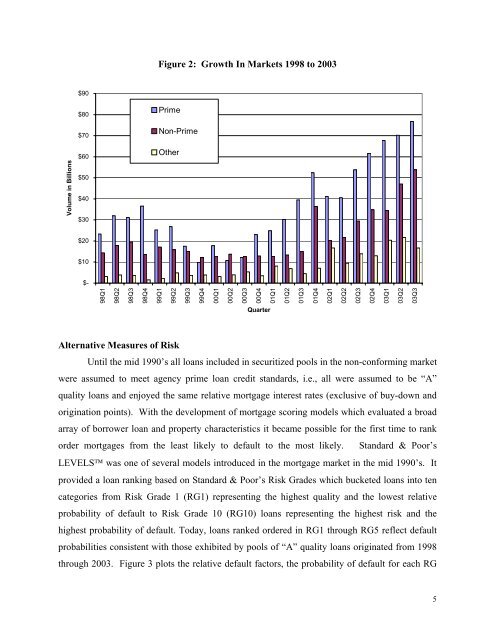
Figure 2: Growth In Markets 1998 to 2003<br />
$90<br />
Volume in Billions<br />
$80<br />
$70<br />
$60<br />
$50<br />
$40<br />
$30<br />
Prime<br />
Non-Prime<br />
Other<br />
$20<br />
$10<br />
$-<br />
98Q1<br />
98Q2<br />
98Q3<br />
98Q4<br />
99Q1<br />
99Q2<br />
99Q3<br />
99Q4<br />
00Q1<br />
00Q2<br />
00Q3<br />
00Q4<br />
01Q1<br />
01Q2<br />
01Q3<br />
01Q4<br />
02Q1<br />
02Q2<br />
02Q3<br />
02Q4<br />
03Q1<br />
03Q2<br />
03Q3<br />
Quarter<br />
Alternative Measures of Risk<br />
Until the mid 1990’s all loans included in securitized pools in the non-con<strong>for</strong>ming market<br />
were assumed to meet agency prime loan credit standards, i.e., all were assumed to be “A”<br />
quality loans and enjoyed the same relative mortgage interest rates (exclusive of buy-down and<br />
origination points). With the development of mortgage scoring models which evaluated a broad<br />
array of borrower loan and property characteristics it became possible <strong>for</strong> the first time to rank<br />
order mortgages from the least likely to default to the most likely. Standard & Poor’s<br />
LEVELS was one of several models introduced in the mortgage market in the mid 1990’s. It<br />
provided a loan ranking based on Standard & Poor’s Risk Grades which bucketed loans into ten<br />
categories from Risk Grade 1 (RG1) representing the highest quality and the lowest relative<br />
probability of default to Risk Grade 10 (RG10) loans representing the highest risk and the<br />
highest probability of default. Today, loans ranked ordered in RG1 through RG5 reflect default<br />
probabilities consistent with those exhibited by pools of “A” quality loans originated from 1998<br />
through 2003. Figure 3 plots the relative default factors, the probability of default <strong>for</strong> each RG<br />
5