Biohydrogen production in anaerobic fluidized bed reactors: Effect of ...
Biohydrogen production in anaerobic fluidized bed reactors: Effect of ...
Biohydrogen production in anaerobic fluidized bed reactors: Effect of ...

Create successful ePaper yourself
Turn your PDF publications into a flip-book with our unique Google optimized e-Paper software.
<strong>in</strong>ternational journal <strong>of</strong> hydrogen energy 35 (2010) 3379–3388<br />
Available at www.sciencedirect.com<br />
journal homepage: www.elsevier.com/locate/he<br />
<strong>Biohydrogen</strong> <strong>production</strong> <strong>in</strong> <strong>anaerobic</strong> <strong>fluidized</strong> <strong>bed</strong> <strong>reactors</strong>:<br />
<strong>Effect</strong> <strong>of</strong> support material and hydraulic retention time<br />
Aruana Rocha Barros a , Eduardo Lucena Cavalcante de Amorim b , Cristiane Marques Reis a ,<br />
Gessia Momoe Shida b , Edson Luiz Silva a, *<br />
a Departament <strong>of</strong> Chemical Eng<strong>in</strong>eer<strong>in</strong>g – Federal University <strong>of</strong> São Carlos. Rod. Wash<strong>in</strong>gton Luis, km 235 – CEP 13565-905,<br />
São Carlos/SP, Brazil<br />
b Department <strong>of</strong> Hydraulic and Sanitation – University <strong>of</strong> São Paulo. Av. Trabalhador Sãocarlense, 400 - Centro – CEP 13566-590,<br />
São Carlos/SP, Brazil<br />
article <strong>in</strong>fo<br />
Article history:<br />
Received 19 September 2009<br />
Received <strong>in</strong> revised form<br />
13 January 2010<br />
Accepted 24 January 2010<br />
Available onl<strong>in</strong>e 26 February 2010<br />
Keywords:<br />
<strong>Biohydrogen</strong> <strong>production</strong><br />
Anaerobic <strong>fluidized</strong> <strong>bed</strong> reactor<br />
Support material<br />
Polystyrene<br />
Expanded clay<br />
Hydraulic retention time<br />
abstract<br />
This study evaluated two different support materials (polystyrene and expanded clay) for<br />
biohydrogen <strong>production</strong> <strong>in</strong> an <strong>anaerobic</strong> <strong>fluidized</strong> <strong>bed</strong> reactor (AFBR) treat<strong>in</strong>g synthetic<br />
wastewater conta<strong>in</strong><strong>in</strong>g glucose (4000 mg L 1 ). The AFBRs conta<strong>in</strong>ed either polystyrene (R1)<br />
or expanded clay (R2) as support materials were <strong>in</strong>oculated with thermally pre-treated<br />
<strong>anaerobic</strong> sludge and operated at a temperature <strong>of</strong> 30 C and a pH <strong>of</strong> approximately 5.5.<br />
The AFBRs were operated with a range <strong>of</strong> hydraulic retention times (HRTs) between 1 and<br />
8 h. For R1 with an HRT <strong>of</strong> 2 h, the maximum hydrogen yield (HY) was 1.90 mol H 2 mol 1<br />
glucose, with 0.805 mg <strong>of</strong> biomass (as total volatile solids, or TVS) attached to each g <strong>of</strong><br />
polystyrene. For R2 operated at an HRT <strong>of</strong> 2 h, the maximum HY was 2.59 mol H 2 mol 1<br />
glucose, with 1.100 mg <strong>of</strong> attached biomass (as TVS) g 1 expanded clay. The highest<br />
hydrogen <strong>production</strong> rates (HPR) were 0.95 and 1.21 L h 1 L 1 for R1 and R2, respectively,<br />
us<strong>in</strong>g an HRT <strong>of</strong> 1 h. The H 2 content <strong>in</strong>creased from 16–47% for R1 and from 22–51% for R2.<br />
No methane was detected <strong>in</strong> the biogas produced throughout the period <strong>of</strong> AFBR operation.<br />
These results show that the values <strong>of</strong> HY, HPR, H 2 content, and g <strong>of</strong> attached biomass g 1<br />
support material were all higher for AFBRs conta<strong>in</strong><strong>in</strong>g expanded clay than for <strong>reactors</strong><br />
conta<strong>in</strong><strong>in</strong>g polystyrene.<br />
ª 2010 Pr<strong>of</strong>essor T. Nejat Veziroglu. Published by Elsevier Ltd. All rights reserved.<br />
1. Introduction<br />
Today, global energy requirements are met primarily through<br />
the burn<strong>in</strong>g <strong>of</strong> fossil fuels (about 80% <strong>of</strong> the world’s energy<br />
demand). Hydrogen is a promis<strong>in</strong>g alternative to fossil fuels,<br />
both from an economic and environmental standpo<strong>in</strong>t. It is<br />
a clean and environmentally friendly fuel that produces water<br />
<strong>in</strong>stead <strong>of</strong> green house gases when combusted [1,2]. Although<br />
most H 2 is generated from fossil fuels through thermochemical<br />
processes [1,3], it may also be produced by biological processes<br />
[4], which is potentially more attractive than thermochemical<br />
methods, especially if wastewater or other biomass can be<br />
used as the raw material [5–7]. Under <strong>anaerobic</strong> conditions,<br />
hydrogen is formed as a by-product dur<strong>in</strong>g the conversion <strong>of</strong><br />
organic wastes <strong>in</strong>to organic acids, which are then used<br />
for methane generation. The acidogenic phase <strong>of</strong> <strong>anaerobic</strong><br />
waste digestion can be manipulated to improve H 2 <strong>production</strong><br />
[1,2].<br />
Hydrogen fermentation has been carried out with a variety<br />
<strong>of</strong> substrates and different pure and mixed cultures [6–8].<br />
* Correspond<strong>in</strong>g author.<br />
E-mail address: edsilva@power.ufscar.br (E.L. Silva).<br />
0360-3199/$ – see front matter ª 2010 Pr<strong>of</strong>essor T. Nejat Veziroglu. Published by Elsevier Ltd. All rights reserved.<br />
doi:10.1016/j.ijhydene.2010.01.108
3380<br />
<strong>in</strong>ternational journal <strong>of</strong> hydrogen energy 35 (2010) 3379–3388<br />
Notation<br />
TVFA Total volatile fatty acids, mg L 1<br />
HRT Hydraulic retention time, h<br />
HPR Hydrogen <strong>production</strong> rate, L h 1 L 1<br />
Abbreviations<br />
HY Hydrogen yield, mol H 2 mol 1 AFBR Anaerobic <strong>fluidized</strong> <strong>bed</strong> reactor<br />
glucose<br />
HAc Acetic acid concentration, mg L 1<br />
APBR Anaerobic packed <strong>bed</strong> reactor<br />
HBu Butyric acid concentration, mg L 1<br />
CSTR Cont<strong>in</strong>uous stirred tank reactor<br />
HPr Propionic acid concentration, mg L 1<br />
EPS Extracellular polymeric substances<br />
EtOH Ethanol concentration, mg L 1<br />
FID Flame ionization detector<br />
Q Total liquid flow rate, L h 1<br />
SEM Scann<strong>in</strong>g electron microscopy<br />
SMP Soluble microbial products, mg L 1 TCD Thermal conductivity detector<br />
UASB Upflow <strong>anaerobic</strong> sludge blanket<br />
TVS Total volatile solids, mg L 1<br />
Symbols<br />
VFA Volatile fatty acids, mg L 1<br />
COD Chemical oxygen demand, mg L 1<br />
VSS Volatile suspended solids, mg L 1<br />
Many studies have exam<strong>in</strong>ed the hydrogen <strong>production</strong><br />
potential <strong>of</strong> various carbon sources, <strong>in</strong>clud<strong>in</strong>g glucose [9,10],<br />
sucrose [11–13], starch [14,15], and xylose [16,17]. Although<br />
biohydrogen <strong>production</strong> from simple sugars is well<br />
researched, only a handful <strong>of</strong> studies have explored the use <strong>of</strong><br />
<strong>in</strong>dustrial/domestic wastewater as a potential feedstock.<br />
These sources <strong>in</strong>clude rice w<strong>in</strong>ery wastewater [18], food process<strong>in</strong>g<br />
and domestic wastewater [19], glycerol-conta<strong>in</strong><strong>in</strong>g<br />
wastes [20], citric acid wastewater [21], dairy wastewater<br />
[22], and cheese process<strong>in</strong>g wastewater [23].<br />
Cont<strong>in</strong>uous stirred tank <strong>reactors</strong> (CSTRs) are the most<br />
frequently-used reactor type for cont<strong>in</strong>uous biohydrogen<br />
<strong>production</strong>. However, a range <strong>of</strong> other reactor types exist,<br />
mostly based on methanogenic <strong>anaerobic</strong> digestion [24].<br />
Upflow <strong>anaerobic</strong> sludge blanket (UASB), <strong>anaerobic</strong> packed<br />
<strong>bed</strong> reactor (APBR) and the <strong>anaerobic</strong> <strong>fluidized</strong> <strong>bed</strong> <strong>reactors</strong><br />
(AFBR) are considered superior to CSTRs because <strong>of</strong> their<br />
ability to reta<strong>in</strong> large amounts <strong>of</strong> biomass <strong>in</strong> the reactor. In<br />
these systems, microorganisms are reta<strong>in</strong>ed <strong>in</strong> an immobilized<br />
<strong>bed</strong> (UASB) or attached to solids (APBR and AFBR) <strong>in</strong> the<br />
form <strong>of</strong> bi<strong>of</strong>ilms or granules, and ma<strong>in</strong>ta<strong>in</strong>ed <strong>in</strong> suspension by<br />
the drag force <strong>of</strong> upward wastewater flow [24,25].<br />
The AFBR configuration with attached bi<strong>of</strong>ilms has been<br />
widely used as a biological treatment system for wastewater<br />
and is characterized by high efficiency and low hydraulic<br />
retention time (HRT) [26,27]. For high density support materials<br />
<strong>in</strong> <strong>fluidized</strong> <strong>bed</strong> <strong>reactors</strong> (sand, coal, clay and so forth), the<br />
atta<strong>in</strong>ment <strong>of</strong> adequate fluidization conditions requires the<br />
utilization <strong>of</strong> small diameter particles. Under these conditions,<br />
heavy bi<strong>of</strong>ilm accumulation and high fluidization velocity<br />
cause significant washout <strong>of</strong> bioparticles from the reactor. To<br />
overcome this problem, synthetic polymers previously subjected<br />
to chemical treatment to improve their surface characteristics<br />
(rugosity, porosity and electrical charge) have been<br />
successfully employed as support materials [28–30].<br />
Although AFBRs possess characteristics favorable for the<br />
<strong>production</strong> <strong>of</strong> gaseous products such as H 2 , they have been<br />
utilized less frequently for dark H 2 fermentation [31]. A literature<br />
survey revealed that the only support materials that<br />
have been tested for biohydrogen <strong>production</strong> <strong>in</strong> AFBRs were<br />
activated carbon [32], celite [33], and expanded clay [34,35].<br />
Expanded clay is a cheap material and <strong>in</strong>sensitive to abrasion.<br />
Meanwhile, activated carbon and celite are more expensive<br />
and require care with respect to abrasion because turbulence<br />
<strong>in</strong> the system can easily reduce these support materials <strong>in</strong><br />
size. Moreover, there are no studies <strong>in</strong> the literature that have<br />
compared the startup, steady-state performance and biomass<br />
retention <strong>of</strong> AFBRs conta<strong>in</strong><strong>in</strong>g different types <strong>of</strong> attachment<br />
media under similar operat<strong>in</strong>g conditions <strong>in</strong> wastewater<br />
treatment for H 2 <strong>production</strong>.<br />
However, it is critical that the media particles used are<br />
conducive to the rapid and extensive buildup <strong>of</strong> attached<br />
biomass to ensure that stable AFBR performance is atta<strong>in</strong>ed<br />
shortly after startup. Although not all <strong>of</strong> the mechanisms and<br />
substances <strong>in</strong>volved <strong>in</strong> bi<strong>of</strong>ilm adhesion and formation are<br />
known, most studies have emphasized that extracellular<br />
polymeric substances (EPSs) are primarily responsible for the<br />
structural and functional <strong>in</strong>tegrity <strong>of</strong> bi<strong>of</strong>ilms due to the<br />
cohesive forces they exert, which are responsible for keep<strong>in</strong>g<br />
cells together <strong>in</strong> the form <strong>of</strong> bi<strong>of</strong>ilms, flocs and sludge [25,29,36].<br />
In H 2 -produc<strong>in</strong>g <strong>reactors</strong>, retention <strong>of</strong> more bacteria <strong>in</strong> the<br />
reactor should provide more driv<strong>in</strong>g power, allow<strong>in</strong>g <strong>in</strong>creased<br />
organic load<strong>in</strong>g rates (OLRs) and volumetric H 2 <strong>production</strong><br />
rates (HPR) [24]. It is obvious that substantial differences <strong>in</strong><br />
hydrogen <strong>production</strong> rate still rema<strong>in</strong> among these H 2 -<br />
produc<strong>in</strong>g <strong>reactors</strong>, which could be attributed to the difference<br />
<strong>in</strong> the microbial population and the operat<strong>in</strong>g conditions.<br />
Therefore, the present study focused on cont<strong>in</strong>uous biohydrogen<br />
<strong>production</strong> <strong>in</strong> AFBRs via mixed-culture bi<strong>of</strong>ilms<br />
grown on polystyrene and expanded clay support materials.<br />
Bi<strong>of</strong>ilms that formed <strong>in</strong> pores and on the surfaces <strong>of</strong> support<br />
material particles were evaluated to quantify biomass and<br />
characterize extracellular polymers. The effect <strong>of</strong> HRT on the<br />
performance <strong>of</strong> AFBRs was also <strong>in</strong>vestigated.<br />
2. Materials and methods<br />
2.1. Heat-treatment <strong>of</strong> <strong>in</strong>oculum and synthetic<br />
wastewater<br />
The <strong>in</strong>oculum used <strong>in</strong> this study was obta<strong>in</strong>ed from the<br />
<strong>anaerobic</strong> sludge <strong>of</strong> a UASB reactor treat<strong>in</strong>g effluent from sw<strong>in</strong>e<br />
wastewaters [37]. The sludge was subjected to heat-treatment<br />
accord<strong>in</strong>g to the methodology <strong>of</strong> Kim et al. [38]. This treatment<br />
consisted <strong>of</strong> preheat<strong>in</strong>g the sludge for 10 m<strong>in</strong> at 90 C.
<strong>in</strong>ternational journal <strong>of</strong> hydrogen energy 35 (2010) 3379–3388 3381<br />
Subsequently, the sludge was placed <strong>in</strong> an ice bath until the<br />
temperature reached 25 C. This heat treatment elim<strong>in</strong>ated<br />
nonsporulat<strong>in</strong>g vegetative methanogenic and acidogenic cells,<br />
while endospore-produc<strong>in</strong>g acidogenic cells (which are resistant<br />
to harsh environmental conditions) rema<strong>in</strong>ed <strong>in</strong>tact.<br />
The synthetic wastewater conta<strong>in</strong>ed glucose (4000 mg L 1 )<br />
as the ma<strong>in</strong> carbon source and was supplemented with<br />
nutrients as descri<strong>bed</strong> by Leite et al. [39]. The wastewater pH<br />
was approximately 7.0; accord<strong>in</strong>gly, 1000 mg L 1 <strong>of</strong> sodium<br />
bicarbonate and 1 mL L 1 <strong>of</strong> hydrochloric acid (10 M) were<br />
added to ma<strong>in</strong>ta<strong>in</strong> the reactor pH at approximately 5.5.<br />
2.2. Support materials<br />
Particles <strong>of</strong> polystyrene and expanded clay were used <strong>in</strong> the<br />
AFBRs as support materials for biomass immobilization. The<br />
polystyrene particles were submitted to prior chemical treatment<br />
to enhance their surface roughness. This chemical<br />
treatment consisted <strong>of</strong> soak<strong>in</strong>g the particles <strong>in</strong> sulphochromic<br />
solution for 50 m<strong>in</strong>, r<strong>in</strong>s<strong>in</strong>g <strong>in</strong> water, soak<strong>in</strong>g <strong>in</strong> concentrated<br />
nitric acid for 20 m<strong>in</strong>, r<strong>in</strong>s<strong>in</strong>g <strong>in</strong> water aga<strong>in</strong>, and oven-dry<strong>in</strong>g<br />
at 40 C [28,40]. The expanded clay pellets – commonly found<br />
at garden<strong>in</strong>g stores – were ground, washed, oven-dried at<br />
40 C, and sifted to the desired gra<strong>in</strong> size. The basic characteristics<br />
<strong>of</strong> the support materials are shown <strong>in</strong> Table 1.<br />
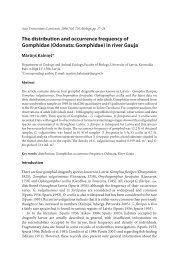
Fig. 1 – Schematic description <strong>of</strong> the <strong>anaerobic</strong> <strong>fluidized</strong><br />
<strong>bed</strong> reactor (AFBR).<br />
2.3. Anaerobic <strong>fluidized</strong> <strong>bed</strong> reactor<br />
Fig. 1 shows a schematic diagram <strong>of</strong> the two identical jacketed<br />
<strong>reactors</strong> used <strong>in</strong> this study. The <strong>reactors</strong> were constructed <strong>of</strong><br />
transparent acrylic with the follow<strong>in</strong>g dimensions: 190 cm<br />
tall, an <strong>in</strong>ternal diameter <strong>of</strong> 5.3 cm, and a total volume <strong>of</strong><br />
4192 cm 3 . The effluent was recycled through a recycl<strong>in</strong>g pump<br />
connect<strong>in</strong>g effluent outlety and feed <strong>in</strong>let. The temperature <strong>in</strong><br />
the AFBRs was ma<strong>in</strong>ta<strong>in</strong>ed at 30 C by recirculat<strong>in</strong>g heated<br />
water from a thermostatic bath through the column water<br />
jackets. A gas–liquid separator was used at the effluent outlet<br />
to collect gaseous and soluble products separately. A gas<br />
meter (TG1; Ritter Inc., Germany) was used to quantify the<br />
amount <strong>of</strong> hydrogen generated.<br />
2.4. AFBR startup and operational conditions for<br />
biohydrogen <strong>production</strong><br />
The AFBRs were fed with synthetic wastewater conta<strong>in</strong><strong>in</strong>g<br />
glucose (4000 mg L 1 ), nutrients, sodium bicarbonate<br />
(1000 mg L 1 ), sufficient hydrochloric acid (1 mL L 1 ;10M)to<br />
Table 1 – Support materials characteristics.<br />
Polystyrene Expanded clay<br />
Diameter (mm) 2.2 2.2 2.8–3.35<br />
Density (g cm 3 ) 1.05 1.50<br />
Shape Cyl<strong>in</strong>ders Granules<br />
Roughness 14.6 18.1<br />
M<strong>in</strong>imum fluidization<br />
velocity (cm s 1 )<br />
0.74 1.24<br />
ma<strong>in</strong>ta<strong>in</strong> a pH near 5.5, and 10% v/v <strong>of</strong> heat-treated <strong>in</strong>oculum<br />
(VSS w 20 g L 1 ). In <strong>reactors</strong> R1 (polystyrene) and R2 (expanded<br />
clay), the total liquid flow (Q) was kept at 76 and 128 L h 1 ,<br />
respectively (<strong>bed</strong> expansion ¼ 30%). These flow rates generated<br />
a superficial velocity 1.3 times higher than the m<strong>in</strong>imum<br />
fluidization velocity. The <strong>reactors</strong> were operated <strong>in</strong> batch<br />
mode for the first 48 h to activate H 2 -produc<strong>in</strong>g microorganisms,<br />
and then switched to cont<strong>in</strong>uous mode with a designated<br />
HRT <strong>of</strong> 8 h.<br />
The <strong>reactors</strong> were operated for 191 days. To facilitate data<br />
analysis, the study was divided <strong>in</strong>to five experimental phases<br />
with different HRT values last<strong>in</strong>g 30–40 days each. After<br />
steady-state conditions were established (based on constant<br />
volumetric hydrogen <strong>production</strong> rates rang<strong>in</strong>g from 5 to 10%<br />
over 5–10 days), HRT was progressively reduced from 8 h to<br />
1 h. The composition <strong>of</strong> gaseous products (H 2 and CO 2 )and<br />
soluble metabolites (volatile organic acids and alcohols)<br />
produced dur<strong>in</strong>g fermentative H 2 <strong>production</strong> were monitored<br />
as a function <strong>of</strong> time. Glucose concentration, pH,<br />
chemical oxygen demand (COD) and solids were regularly<br />
measured. The results reported <strong>in</strong> this study were the<br />
average values <strong>of</strong> triplicate. Ten data obta<strong>in</strong>ed at steadystate<br />
were used for the determ<strong>in</strong>ation <strong>of</strong> the mean values<br />
and standard deviations.<br />
2.5. Chemical and microbiological analyses<br />
The biogas hydrogen content was determ<strong>in</strong>ed by gas chromatography<br />
(GC-2010, Shimadzu, Japan) us<strong>in</strong>g a thermal<br />
conductivity detector (TCD) with argon as the carrier gas.<br />
Injector, detector, and column temperatures were 30 C,<br />
200 C, and 230 C, respectively [37].
3382<br />
<strong>in</strong>ternational journal <strong>of</strong> hydrogen energy 35 (2010) 3379–3388<br />
Concentrations <strong>of</strong> volatile fatty acids (VFA) and alcohols<br />
were also measured by gas chromatography (GC-2010,<br />
Shimadzu, Japan, equipped with FID and COMBI-PAL headspace<br />
<strong>in</strong>jection; AOC 5000 model and 30 m HP-INNOWAX<br />
column 0.25 mm 0.25 mm film thickness) [37].<br />
Glucose concentration was measured with an enzymatic<br />
GOD-PAP [34,35]. COD, pH, and solids (total solids, TS; volatile<br />
suspended solids, VSS; and total volatile solids, TVS) were<br />
measured <strong>in</strong> accordance with Standard Methods [41].<br />
Structural analysis <strong>of</strong> bi<strong>of</strong>ilm samples was performed<br />
us<strong>in</strong>g a Zeiss DSM-960 digital scann<strong>in</strong>g microscope. Samples<br />
were fixed for 12 h at 4 C <strong>in</strong> 0.1 M phosphate buffer (pH 7.3)<br />
conta<strong>in</strong><strong>in</strong>g 2.5% glutaraldehyde. The samples were subsequently<br />
r<strong>in</strong>sed three times <strong>in</strong> 0.1 M phosphate buffer (pH 7.3)<br />
and gradually dehydrated via successive immersions <strong>in</strong><br />
<strong>in</strong>creas<strong>in</strong>gly concentrated ethanol solutions (50, 70, 80, 90 and<br />
95%). Each r<strong>in</strong>se/dehydration cycle took 10 m<strong>in</strong>. The samples<br />
were then washed three times <strong>in</strong> 100% ethanol and immersed<br />
for 30 s <strong>in</strong> hexamethyldisilazane. Dry<strong>in</strong>g was completed at<br />
60 C for 2 h. The particles were then coated with gold powder,<br />
attached to supports with silver glue, and observed by digital<br />
scann<strong>in</strong>g microscopy [42].<br />
Biomass adhesion to the expanded clay and polystyrene<br />
particles was determ<strong>in</strong>ed accord<strong>in</strong>g to the methods <strong>of</strong> Chen<br />
and Chen [43]. Quantification <strong>of</strong> extracellular polymeric<br />
substances (EPSs) <strong>in</strong> prote<strong>in</strong> form was performed <strong>in</strong> accordance<br />
with the method proposed by Lowry et al. [44] and<br />
modified by Peterson [45], us<strong>in</strong>g bov<strong>in</strong>e serum album<strong>in</strong> as<br />
a standard. Analysis <strong>of</strong> EPSs <strong>in</strong> carbohydrate form was carried<br />
out accord<strong>in</strong>g to the methods <strong>of</strong> Dubois et al. [46] us<strong>in</strong>g lactose<br />
as a standard.<br />
3. Results and discussion<br />
3.1. H 2 content, H 2 yield <strong>production</strong> and H 2 <strong>production</strong><br />
rate <strong>in</strong> AFBRs<br />
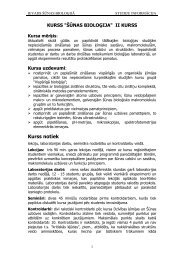
Fig. 2 shows the variation <strong>in</strong> H 2 content as a function <strong>of</strong> HRT<br />
for the two AFBRs used <strong>in</strong> this study. H 2 content <strong>in</strong> the AFBR<br />
conta<strong>in</strong><strong>in</strong>g polystyrene (R1) <strong>in</strong>creased from 16% to 47% when<br />
the HRT decreased from 8 h to 1 h. The AFRBR conta<strong>in</strong><strong>in</strong>g<br />
expanded clay (R2) performed similarly; when the HRT<br />
H Y (mol H 2 m o l<br />
- 1 glucose )<br />
8.0<br />
7.0<br />
6.0<br />
5.0<br />
4.0<br />
3.0<br />
2.0<br />
1.0<br />
0.0<br />
HY - R1<br />
HY - R2<br />
% H2 - R1<br />
% H2 - R2<br />
0 1 2 3 4 5 6 7 8 9<br />
HRT (h)<br />
Fig. 2 – <strong>Effect</strong> <strong>of</strong> HRT on H 2 yield and H 2 content <strong>in</strong> AFBRs<br />
conta<strong>in</strong><strong>in</strong>g polystyrene (R1) and expanded clay (R2).<br />
60<br />
50<br />
40<br />
30<br />
20<br />
10<br />
0<br />
H2 content (% )<br />
decreased from 8 h to 1 h, the H 2 content <strong>in</strong>creased from 22%<br />
to 51%. Both AFBRs reached their highest H 2 concentrations<br />
when operated with an HRT <strong>of</strong> 1 h (Fig. 2). These values are <strong>in</strong><br />
agreement with other studies us<strong>in</strong>g AFBRs with glucose<br />
concentrations <strong>of</strong> 2000 mg L 1 [34,35], 5000 mg L 1 [33], 10,000<br />
and 30,000 mg L 1 [32], and sucrose concentrations rang<strong>in</strong>g<br />
from 5000 to 40,000 mg COD L 1 [31]. The expanded clay<br />
reactor generated a higher H 2 concentration than the polystyrene<br />
reactor, reach<strong>in</strong>g a maximum <strong>of</strong> 51% (Fig. 2). Methane<br />
was not detected dur<strong>in</strong>g operation <strong>in</strong> either reactor.<br />
Fig. 2 also shows that hydrogen yield (HY) values for R1<br />
(polystyrene) <strong>in</strong>creased from 0.90 to 1.90 mol H 2 mol 1 glucose<br />
when HRT decreased from 8 h to 2 h, but HY decl<strong>in</strong>ed to<br />
1.40 mol H 2 mol 1 glucose when HRT decreased to 1 h. The<br />
same behavior was observed <strong>in</strong> R2 (expanded clay): HY values<br />
<strong>in</strong>creased from 1.51 to 2.52 mol H 2 mol 1 glucose when HRT<br />
decreased from 8 to 2 h, but decreased to 1.84 mol H 2 mol 1<br />
glucose when HRT decreased to 1 h. Therefore, the maximum<br />
HY values obta<strong>in</strong>ed for R1 (polystyrene) and R2 (expanded<br />
clay) were 1.90 and 2.52 mol H 2 mol 1 glucose, respectively,<br />
with an HRT <strong>of</strong> 2 h (Fig. 2). Consider<strong>in</strong>g that the maximum<br />
theoretical HY for glucose is 4 mol H 2 mol 1 glucose, the<br />
results obta<strong>in</strong>ed <strong>in</strong> the present study with glucose concentration<br />
<strong>of</strong> 4000 mg L 1 correspond to 47.5 and 63.0% yields for<br />
R1 (polystyrene) and R2 (expanded clay), respectively. Table 2<br />
summarizes the maximum H 2 yields obta<strong>in</strong>ed <strong>in</strong> various types<br />
<strong>of</strong> H 2 -produc<strong>in</strong>g systems for comparison. In these AFBRs, the<br />
maximum HY, 1.90 and 2.52 mol H 2 mol 1 glucose for R1<br />
(polystyrene) and R2 (expanded clay), respectively, were<br />
comparable with those <strong>of</strong> other <strong>reactors</strong>. Furthermore, H 2 has<br />
been produced cont<strong>in</strong>uously and stably for over 6 months <strong>in</strong><br />
these AFBRs. This might be attributed to the high biomass<br />
level reta<strong>in</strong>ed <strong>in</strong> the systems.<br />
L<strong>in</strong> et al. [31] operated an AFBR with a draft tube us<strong>in</strong>g<br />
silicone gel for trapp<strong>in</strong>g <strong>anaerobic</strong> sludge, and used sucrose<br />
concentrations rang<strong>in</strong>g from 5000 to 40,000 mg COD L 1 . The<br />
highest HY value (4.98 mol H 2 mol 1 sucrose, which corresponds<br />
to 62.3% yield consider<strong>in</strong>g that the maximum theoretical<br />
HY for sucrose is 8 mol H 2 mol 1 sucrose,) was obta<strong>in</strong>ed<br />
at 35,300 mg L 1 sucrose and the optimal HRT was 8.9 h. For an<br />
AFBR operated with a glucose concentration <strong>of</strong> 10,000 mg L 1<br />
and activated carbon as a support material, Zhang et al. [32]<br />
obta<strong>in</strong>ed a maximum HY <strong>production</strong> value <strong>of</strong><br />
1.19 mol H 2 mol 1 glucose with the optimal HRT <strong>of</strong> 1 h.<br />
Amorim et al. [34] and Shida et al. [35] evaluated AFBRs conta<strong>in</strong><strong>in</strong>g<br />
expanded clay at glucose concentrations <strong>of</strong><br />
2000 mg L 1 , and obta<strong>in</strong>ed maximum HY values <strong>of</strong> 2.49 and<br />
2.29 mol H 2 mol 1 glucose, respectively for HRTs <strong>of</strong> 2 h.<br />
The HPR values improved <strong>in</strong> both R1 (polystyrene) and R2<br />
(expanded clay) when HRT was decreased (Fig. 3). Maximum<br />
HPRs for R1 and R2 were 0.95 and 1.21 L h 1 L 1 , respectively,<br />
for an HRT <strong>of</strong> 1 h (Fig. 3). Similarly, HPR values <strong>in</strong>creased with<br />
decreas<strong>in</strong>g HRT <strong>in</strong> the AFBR studies <strong>of</strong> L<strong>in</strong> et al. [31], Zhang<br />
et al. [32], Amorim et al. [34], and Shida et al. [35]. L<strong>in</strong> et al. [31]<br />
obta<strong>in</strong>ed an HPR <strong>of</strong> 2.27 L h 1 L 1 with an HRT <strong>of</strong> 2.2 h and<br />
a sucrose concentration <strong>of</strong> 40,000 mg COD L 1 . Zhang et al. [32]<br />
obta<strong>in</strong>ed an HPR <strong>of</strong> 2.22 L h 1 L 1 with an HRT <strong>of</strong> 0.5 h and<br />
10,000 mg L 1 glucose. Amorim et al. [34] and Shida et al. [35]<br />
obta<strong>in</strong>ed HPRs <strong>of</strong> 0.97 and 1.15 L h 1 L 1 , respectively, with<br />
an HRT <strong>of</strong> 1 h and 2000 mg L 1 glucose. These results show
<strong>in</strong>ternational journal <strong>of</strong> hydrogen energy 35 (2010) 3379–3388 3383<br />
Table 2 – Comparison <strong>of</strong> the maximum H 2 yield obta<strong>in</strong>ed <strong>in</strong> various types <strong>of</strong> H 2 -produc<strong>in</strong>g reactor.<br />
Reactor Substrate Optimal HRT (h) Maximum HY Reference<br />
CSTR Glucose 6 2.1 mol H 2 mol 1 glucose [10]<br />
CSTR Glucose 13.3 1.63 mol H 2 mol 1 glucose [47]<br />
UASB Sucrose 13 1.61 mol H 2 mol 1 sucrose [13]<br />
UASB Rice w<strong>in</strong>ery wastewater 24 1.61 mol H 2 mol 1 hexose [18]<br />
APBR (horizontal flow) Glucose 0.5 2.48 mol H 2 mol 1 glucose [39]<br />
APBR (vertical flow) Sucrose 1 1.14 mol H 2 mol 1 sucrose a [48]<br />
AFBR (draft tube) Sucrose 8.9 4.98 mol H 2 mol 1 sucrose [31]<br />
AFBR Glucose 1 1.19 mol H 2 mol 1 glucose [32]<br />
AFBR Glucose 2 2.49 mol H 2 mol 1 glucose [34]<br />
AFBR Glucose 2 2.29 mol H 2 mol 1 glucose [35]<br />
AFBR (R1 – polystyrene) Glucose 2 1.90 mol H 2 mol 1 glucose This study<br />
AFBR (R2 – expanded clay Glucose 2 2.52 mol H 2 mol 1 glucose This study<br />
a Based on the article data.<br />
that HPR values are <strong>in</strong>fluenced by both HRT and substrate<br />
concentration (or OLR).<br />
Some studies employ<strong>in</strong>g 1–2 h HRTs have shown optimum<br />
HPR and HY values [32,34,35], which were attributed to the<br />
high flow effect wash<strong>in</strong>g away non-sporulated, methanogenic<br />
microorganisms [11]. The m<strong>in</strong>imum HRT needed to ma<strong>in</strong>ta<strong>in</strong><br />
specific hydrogen <strong>production</strong> from glucose conversion is<br />
related to ma<strong>in</strong>ta<strong>in</strong><strong>in</strong>g adequate concentrations <strong>of</strong> H 2 -<br />
produc<strong>in</strong>g microorganisms <strong>in</strong> the system, and that contam<strong>in</strong>ation<br />
<strong>of</strong> the system by non-H 2 -produc<strong>in</strong>g organisms, which<br />
compete for substrate, must be prevented. The H 2 <strong>production</strong><br />
obta<strong>in</strong>ed with effluent pH <strong>of</strong> 5.5 <strong>in</strong> this study (Fig. 3) similar to<br />
that obta<strong>in</strong>ed by Zhang et al. [32], Amorim et al. [34] and Shida<br />
et al. [35] at pHs less than 4.0, and to results obta<strong>in</strong>ed by L<strong>in</strong><br />
et al. [31] under pH conditions between 5.8 and 6.8, which are<br />
regarded as favor<strong>in</strong>g hydrogen <strong>production</strong> [10].<br />
3.2. Soluble microbial products and glucose conversion<br />
Table 3 shows the distribution <strong>of</strong> soluble microbial products<br />
(SMP) associated with HRT reduction <strong>in</strong> the AFBRs. The soluble<br />
metabolites for R1 (polystyrene) were acetate (HAc) (27.38–<br />
49.05%), butyrate (HBu) (30.40–38.22%), ethanol (EtOH) (9.97–<br />
HPR (L h -1<br />
L 1 )<br />
1.5<br />
1.2<br />
0.9<br />
0.6<br />
0.3<br />
0.0<br />
0 1 2 3 4 5 6 7 8 9<br />
HRT (h)<br />
Fig. 3 – <strong>Effect</strong> <strong>of</strong> HRT on the H 2 <strong>production</strong> rate <strong>in</strong> AFBRs<br />
conta<strong>in</strong><strong>in</strong>g polystyrene (R1) and expanded clay (R2).<br />
R1<br />
R2<br />
38.41%), and propionate (HPr) (2.75–5.38%). For R2 (expanded<br />
clay), the soluble metabolites were HAc (32.99–46.81%), HBu<br />
(37.30–41.49%), EtOH (10.18–22.95%), and HPr (1.26–4.90%).<br />
Zhang et al. [32], who also employed glucose as a substrate,<br />
noted the predom<strong>in</strong>ance <strong>of</strong> HAc (43–46% <strong>of</strong> all soluble<br />
metabolites) over HBu (20–31%), and reported significant<br />
ethanol <strong>production</strong> <strong>in</strong> the effluent (14–21%). Only a small<br />
quantity <strong>of</strong> propionic acid was detected (less than 5.38%)<br />
dur<strong>in</strong>g operation <strong>of</strong> the AFBRs. This observation corresponds<br />
to the <strong>in</strong>creased H 2 <strong>production</strong> levels, consider<strong>in</strong>g that<br />
propionate <strong>production</strong> consumes 2 mol <strong>of</strong> hydrogen for every<br />
2 mol <strong>of</strong> propionate produced (Eq. (1)). The absence <strong>of</strong> HPr may<br />
be attributed to low pH values [32].<br />
C 6 H 12 O 6 þ 2H 2 / 2CH 3 CH 2 COOH þ 2H 2 O (1)<br />
The HAc/SMP and HBu/SMP values obta<strong>in</strong>ed from the R1<br />
(polystyrene) and R2 (expanded clay) <strong>reactors</strong> were compared.<br />
The results <strong>in</strong>dicated that acetate, followed by butyrate, predom<strong>in</strong>ated<br />
over other soluble metabolites <strong>in</strong> R2 (expanded<br />
clay), <strong>in</strong>dicat<strong>in</strong>g superior H 2 <strong>production</strong> <strong>in</strong> this reactor. In this<br />
study, when the HRT <strong>of</strong> R1 (polystyrene) decreased from 8 to<br />
2 h, the HAc/HBu ratio <strong>in</strong>creased from 0.88 to 1.28. However,<br />
when the HRT decreased to 1 h, this ratio fell to 1.15. For R2<br />
(expanded clay), similar behavior was observed; the HAc/HBu<br />
ratio <strong>in</strong>creased from 0.81 to 1.21 when HRT decreased from 8<br />
to 2 h. However, when HRT decreased to 1 h, this ratio<br />
dim<strong>in</strong>ished to 1.08. This phenomenon was also observed <strong>in</strong><br />
other studies that used AFBRs for fermentative H 2 <strong>production</strong><br />
[31,33]. HRT and OLR are important parameters that may<br />
affect the metabolic routes <strong>of</strong> hydrogen <strong>production</strong> [49]. This<br />
relationship is shown <strong>in</strong> Table 3, <strong>in</strong> which the metabolite<br />
proportions differed between the two AFBRs for every HRT<br />
tested.<br />
Table 3 also shows that the optimum HRTs were 2 h for<br />
both R1 (polystyrene) and R2 (expanded clay). Favorable<br />
soluble metabolites were produced <strong>in</strong> greater proportions<br />
dur<strong>in</strong>g operation at these HRTs, which maximized H 2<br />
<strong>production</strong>.<br />
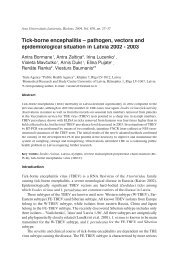
Fig. 4 shows the glucose conversion behavior as a function<br />
<strong>of</strong> HRT. In reactor R1 (polystyrene), glucose conversion
ema<strong>in</strong>ed virtually constant as HRT decreased from 8 to 4 h,<br />
with values rang<strong>in</strong>g between 80.66 and 83.70%. When the HRT<br />
decreased to 2 h and 1 h, glucose conversion rates <strong>in</strong> R1<br />
dropped to 59.54 and 49.11%. Reactor R2 (expanded clay)<br />
showed similar behavior, with glucose conversion values<br />
rang<strong>in</strong>g between 88.20 and 96.30% for HRTs from 8 to 4 h.<br />
These values decreased to 76.30 and 70.50% when HRT was<br />
decreased to 2 h and 1 h, respectively. The higher glucose<br />
conversion rate obta<strong>in</strong>ed <strong>in</strong> R2 re<strong>in</strong>forces the superior<br />
performance <strong>of</strong> this reactor for fermentative H 2 <strong>production</strong>.<br />
The high values <strong>of</strong> substrate conversion achieved are consistent<br />
with comparable studies <strong>in</strong> AFBRs us<strong>in</strong>g glucose [32–35]<br />
and sucrose [31]. These high rates may be attributed to the<br />
high accumulation <strong>of</strong> biomass <strong>in</strong> the system, which is an<br />
advantageous feature <strong>of</strong> adhered-growth systems [50].<br />
Sucrose conversions rang<strong>in</strong>g from 92–99% were obta<strong>in</strong>ed by<br />
L<strong>in</strong> et al. [31] <strong>in</strong> AFBRs us<strong>in</strong>g HRTs decreas<strong>in</strong>g from 8.9 to 2.2 h.<br />
Similar results (glucose conversions <strong>of</strong> 89–98%) were verified<br />
by Amorim et al. [34] and Shida et al. [35] <strong>in</strong> AFBRs us<strong>in</strong>g HRTs<br />
rang<strong>in</strong>g from 8 to 1 h. However, Zhang et al. [32] verified<br />
glucose conversions rang<strong>in</strong>g from 99.47% to 71.44% when HRT<br />
was decreased from 4 to 0.5 h. Although the present study has<br />
also achieved lower glucose conversions, most <strong>of</strong> the<br />
Glucose concentration (mg L<br />
-1<br />
)<br />
3384<br />
<strong>in</strong>ternational journal <strong>of</strong> hydrogen energy 35 (2010) 3379–3388<br />
Table 3 – Production <strong>of</strong> soluble metabolites <strong>in</strong> H 2 <strong>production</strong> under different operat<strong>in</strong>g conditions <strong>in</strong> AFBRs.<br />
Polystyrene (R1)<br />
Expanded clay (R2)<br />
HRT (h)<br />
HRT (h)<br />
8 6 4 2 1 8 6 4 2 1<br />
pH 5.87 5.36 5.68 5.67 5.72 5.42 5.00 4.92 5.59 5.69<br />
TVFA (mM) 13.49 0.34 18.20 0.53 17.78 0.83 17.67 0.39 5.80 0.94 14.60 0.23 21.42 0.47 23.98 0.91 24.13 0.44 18.42 0.88<br />
SMP (mM) 21.91 0.45 26.33 0.62 24.53 0.91 19.62 0.43 7.54 0.98 18.94 0.31 26.85 0.52 26.70 0.93 28.48 0.55 20.70 0.91<br />
Eth/SMP (%) 38.41 30.89 27.53 9.97 23.07 22.95 20.24 10.18 15.27 11.02<br />
HAc/SMP (%) 27.38 34.18 38.22 49.05 38.25 32.99 37.24 46.81 45.06 43.74<br />
HBu/SMP (%) 31.12 31.08 30.40 38.22 33.30 40.49 41.26 41.49 37.30 40.34<br />
HPr/SMP (%) 3.08 3.85 3.86 2.75 5.38 3.57 1.26 1.52 2.37 4.90<br />
HAc/HBu 0.88 1.10 1.26 1.28 1.15 0.81 0.90 1.13 1.21 1.08<br />
HAc: acetate, HBu: butyrate, EtOH: ethanol, TVFA = HAc þ HBu þ HPr, SMP ¼ TVFA þ EtOH, EtOH/SMP: molar ethanol to SMP ratio, HAc/SMP:<br />
molar acetate to SMP ratio, HBu/SMP: molar butyrate to SMP ratio, HAc/HBu: molar acetate to butyrate ratio.<br />
4500<br />
4000<br />
3500<br />
3000<br />
2500<br />
2000<br />
1500<br />
1000<br />
500<br />
Influent glucose - R1<br />
Influent glucose - R2<br />
Glucose conversion - R1<br />
Glucose conversion - R2<br />
0<br />
0<br />
0 1 2 3 4 5 6 7 8 9<br />
HRT (h)<br />
Fig. 4 – <strong>Effect</strong> <strong>of</strong> HRT on the glucose concentration and<br />
glucose conversion <strong>in</strong> the AFBRs conta<strong>in</strong><strong>in</strong>g polystyrene<br />
(R1) and expanded clay (R2).<br />
100<br />
80<br />
60<br />
40<br />
20<br />
Glucose conversion (%)<br />
substrate was channeled to f<strong>in</strong>al product reactions <strong>in</strong>stead <strong>of</strong><br />
bacterial growth and ma<strong>in</strong>tenance [32,35]<br />
3.3. Attached biomass and extracellular polymeric<br />
substances<br />
It is generally believed that hydrogen <strong>production</strong> rates are<br />
closely related to the dom<strong>in</strong>ant microorganisms and environmental<br />
conditions present dur<strong>in</strong>g <strong>anaerobic</strong> fermentation but<br />
are <strong>in</strong>dependent <strong>of</strong> reactor configuration. For example,<br />
a hydrogen yield <strong>production</strong> equivalent to 1.6–2.1 mol H 2 mol 1<br />
glucose was achieved <strong>in</strong> a CSTR reactor [47], a UASB reactor [18]<br />
and a fixed <strong>bed</strong> reactor [48] us<strong>in</strong>g mixed cultures rich <strong>in</strong> Clostridium<br />
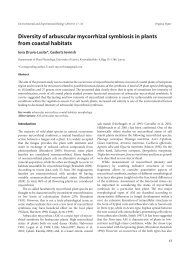
sp. Fig. 5 shows that micro-shaped bacilli resembl<strong>in</strong>g<br />
Clostridium sp. are dom<strong>in</strong>ant <strong>in</strong> the bi<strong>of</strong>ilm. Also, the maximum<br />
HY (2.52 mol H 2 mol 1 glucose) obta<strong>in</strong>ed <strong>in</strong> this study was<br />
similar the maximum obta<strong>in</strong>ed (2.45 mol H 2 mol 1 glucose)<br />
us<strong>in</strong>g a mixed culture rich <strong>in</strong> Clostridium sp. [9]. It seems likely<br />
that the low pH conditions <strong>in</strong>fluenced the efficiency <strong>of</strong> bacterial<br />
hydrogen formation <strong>in</strong> these experiments. In other studies,<br />
maximum HY occurred at an optimum pH range <strong>of</strong> 5.2–5.7, but<br />
decreased significantly when the pH dropped to 4.7 [10,51].<br />
These results can be expla<strong>in</strong>ed by the activity <strong>of</strong> hydrogenase,<br />
an enzyme <strong>in</strong> Clostridium sp. that is <strong>in</strong>hibited by low pH [49],<br />
although Clostridium butyricum activity was noticeable even at<br />
pH 4.0 [52]. Furthermore, additional substrates may be required<br />
to ma<strong>in</strong>ta<strong>in</strong> bacterial growth <strong>in</strong> stressed environments,<br />
result<strong>in</strong>g <strong>in</strong> lower than optimal hydrogen <strong>production</strong>.<br />
The SEM micrographs (Fig. 5) show that particles <strong>of</strong> polystyrene<br />
and expanded clay were appropriate support materials<br />
for biomass immobilization. However, the bi<strong>of</strong>ilms were<br />
not uniformly distributed on the particle surfaces; some<br />
areas were not covered (Fig. 5a, c). The <strong>production</strong> <strong>of</strong> acetic<br />
and butyric acids <strong>in</strong> the study conditions shows that the<br />
microorganisms <strong>in</strong> the <strong>in</strong>oculum were metabolically similar<br />
to Clostridium sp. and Bacillus sp. [9,53,54]. Thepresence<strong>of</strong><br />
these groups is probably related to their morphological use <strong>of</strong><br />
organic acids (such as acetate and butyrate) and to hydrogenotrophic<br />
metabolisms (H 2 /CO 2 ). These f<strong>in</strong>d<strong>in</strong>gs show that<br />
the heat treatment <strong>of</strong> the <strong>in</strong>oculum was important to<br />
<strong>in</strong>crease the conversion efficiency <strong>of</strong> glucose and H 2<br />
<strong>production</strong>.
<strong>in</strong>ternational journal <strong>of</strong> hydrogen energy 35 (2010) 3379–3388 3385<br />
Fig. 5 – SEM micrograph <strong>of</strong> bi<strong>of</strong>ilm attached to support materials: (a, b) polystyrene and (c, d) expanded clay (HRT [ 2h;a,c,<br />
magnification 10003; b, d, magnification 30003).<br />
In general, the proportion <strong>of</strong> EPS <strong>in</strong> bi<strong>of</strong>ilms can vary<br />
between roughly 50 and 90% <strong>of</strong> the total organic matter. The<br />
best-<strong>in</strong>vestigated component <strong>of</strong> EPS is the polysaccharide<br />
moiety. EPSs such as polysaccharides are key compounds for<br />
microbial adhesion. However, the matrix is also composed <strong>of</strong><br />
other components such as prote<strong>in</strong>s, nucleic acids and lipids<br />
[36]. Bi<strong>of</strong>ilm accumulation on a support is a dynamic process<br />
that is the net result <strong>of</strong> growth and detachment. Bi<strong>of</strong>ilm<br />
formation is affected by several external factors, <strong>in</strong>clud<strong>in</strong>g the<br />
composition and the concentration <strong>of</strong> the feed, the velocity <strong>of</strong><br />
the liquid phase (shear stress), the concentration <strong>of</strong> particles,<br />
particle-particle collisions, and particle-wall collisions [55,56].<br />
In addition, the nature and the concentrations <strong>of</strong> substrates<br />
may affect bi<strong>of</strong>ilm growth and composition [55,57].<br />
Under a high substrate load<strong>in</strong>g rate (low HRT), bi<strong>of</strong>ilm<br />
accumulation is higher, which can affect the structures<br />
formed. The amount <strong>of</strong> EPS synthesis with<strong>in</strong> the bi<strong>of</strong>ilm<br />
depends greatly on the availability <strong>of</strong> carbon substrates (both<br />
<strong>in</strong>side and outside the cell) and on the balance between<br />
carbon and other limit<strong>in</strong>g nutrients. The presence <strong>of</strong> excess<br />
available carbon and limitations <strong>in</strong> other nutrients (such as<br />
nitrogen, potassium, or phosphate) may favor EPS <strong>production</strong><br />
over cell formation and consequently the concentration <strong>of</strong><br />
active biomass [55,58].<br />
In this study, the formation <strong>of</strong> EPS was related to the HY <strong>in</strong><br />
AFBRs. Fig. 6 shows the variations <strong>in</strong> total volatile solids (TVS)<br />
content, EPS content <strong>in</strong> the form <strong>of</strong> prote<strong>in</strong>s, and EPS content<br />
<strong>in</strong> the form <strong>of</strong> carbohydrates <strong>in</strong> the biomass attached to<br />
polystyrene and expanded clay particles as a function <strong>of</strong><br />
Support)<br />
-1<br />
g<br />
(mg Carbohydrate<br />
Carbohydrate<br />
Support)<br />
-1<br />
Prote<strong>in</strong> (mg Prote<strong>in</strong> g<br />
0.40<br />
0.32<br />
0.24<br />
0.16<br />
0.08<br />
0.00<br />
0.0<br />
0 1 2 3 4 5 6 7 8 9<br />
HRT (h)<br />
Carbohydrate - R1<br />
Carbohydrate - R2<br />
Prote<strong>in</strong> - R1<br />
Prote<strong>in</strong> - R2<br />
Biomass - R1<br />
Biomass - R2<br />
Fig. 6 – <strong>Effect</strong> <strong>of</strong> HRT on the biomass attached and EPS<br />
content (carbohydrate and prote<strong>in</strong> forms) <strong>in</strong> the AFBRs<br />
conta<strong>in</strong><strong>in</strong>g polystyrene (R1) and expanded clay (R2).<br />
1.4<br />
1.2<br />
1.0<br />
0.8<br />
0.6<br />
0.4<br />
0.2<br />
Support)<br />
-1<br />
attached (mg VTS g<br />
Biomass
3386<br />
<strong>in</strong>ternational journal <strong>of</strong> hydrogen energy 35 (2010) 3379–3388<br />
operat<strong>in</strong>g HRT <strong>in</strong> AFBRs. Attached biomass, EPS prote<strong>in</strong>s, and<br />
EPS carbohydrates were higher for expanded clay particles.<br />
When HRT decreased from 8 h to 2 h, the TVS/expanded clay,<br />
prote<strong>in</strong>/expanded clay, and carbohydrate/expanded clay<br />
ratios <strong>in</strong>creased from 0.711 to 1.100 mg TVS g 1 expanded clay,<br />
from 0.050 to 0.086 mg prote<strong>in</strong> g 1 expanded clay, and from<br />
0.071 to 0.147 mg carbohydrate g 1 expanded clay, respectively.<br />
However, these values dropped to 0.658 mg TVS g 1<br />
expanded clay, 0.070 mg prote<strong>in</strong> g 1 expanded clay, and<br />
0.116 mg carbohydrate g 1 expanded clay, respectively, for an<br />
HRT <strong>of</strong> 1 h.<br />
The same behavior was observed for polystyrene particles.<br />
The TVS/polystyrene, prote<strong>in</strong>/polystyrene, and carbohydrate/<br />
polystyrene ratios <strong>in</strong>creased from 0.519 to 0.805 mg TVS g 1<br />
polystyrene, from 0.031 to 0.061 mg prote<strong>in</strong> g 1 polystyrene, and<br />
from 0.090 to 0.104 mg carbohydrate g 1 polystyrene, respectively,<br />
when HRT decreased from 8 h to 2 h. However, these<br />
values dropped to 0.645 mg TVS g 1 polystyrene, 0.059 mg<br />
prote<strong>in</strong> g 1 polystyrene, and 0.098 mg carbohydrate g 1 polystyrene,<br />
respectively, for an HRT <strong>of</strong> 1 h.<br />
The decreas<strong>in</strong>g TVS/support ratio for polystyrene and<br />
expanded clay particles may have contributed to the reduction<br />
<strong>in</strong> HY values <strong>in</strong> each reactor at the HRT <strong>of</strong> 1 h (Fig. 2). The<br />
<strong>in</strong>creas<strong>in</strong>g OLR (with decreas<strong>in</strong>g HRT) may have <strong>in</strong>creased the<br />
thickness <strong>of</strong> the bi<strong>of</strong>ilm, and therefore attachment to<br />
the support material might have become weaker. As a result,<br />
some bi<strong>of</strong>ilm may have separated from support materials due<br />
to particle–particle collisions, caus<strong>in</strong>g a decrease <strong>in</strong> the<br />
observed values <strong>of</strong> TVS/support, prote<strong>in</strong>/support, and carbohydrate/support<br />
ratios when the highest OLR value was<br />
reached. These effects would subsequently result <strong>in</strong> reduced<br />
HY. Another hypothesis is that once the AFBRs became overloaded,<br />
the systems were limited with respect to glucose<br />
conversion, while the HPR cont<strong>in</strong>ued to <strong>in</strong>crease as the HRT<br />
decreased (OLR <strong>in</strong>creased).<br />
Moreover, the superior performance <strong>of</strong> AFBRs conta<strong>in</strong><strong>in</strong>g<br />
expanded clay (R2) could be credited to the surface characteristics<br />
<strong>of</strong> this support material. The surface roughness <strong>of</strong><br />
expanded clay (18.1%) particles is higher than that <strong>of</strong> polystyrene<br />
(14.6%) particles. Although the polystyrene particles<br />
were previously submitted to chemical treatment to enhance<br />
their surface roughness, the majority <strong>of</strong> their surface area<br />
rema<strong>in</strong>ed smooth. Moreover, expanded clay particles have<br />
more creviced surfaces than polystyrene particles, and these<br />
crevices protect develop<strong>in</strong>g bi<strong>of</strong>ilms from shear forces,<br />
allow<strong>in</strong>g more uniform biomass colonization.<br />
4. Conclusion<br />
Based on the experimental results, we conclude that glucose<br />
fermentation <strong>in</strong> the AFBRs conta<strong>in</strong><strong>in</strong>g polystyrene (R1) and<br />
expanded clay (R2) was adequate for hydrogen <strong>production</strong>. HY<br />
<strong>in</strong>creased <strong>in</strong> R1 and R2 when HRT decreased from 8 h to 2 h.<br />
When HRT decreased to 1 h, the performance <strong>of</strong> the AFBRs<br />
decl<strong>in</strong>ed considerably. R2 had HY values rang<strong>in</strong>g from<br />
1.51–2.52 mol H 2 mol 1 glucose, while the HY values for R1<br />
ranged between 0.90 and 1.90 mol H 2 mol 1 glucose. The<br />
highest hydrogen <strong>production</strong> rate (HPR) values were 0.95 and<br />
1.21 L h 1 L 1 for R1 and R2 with an HRT <strong>of</strong> 1 h. The H 2 content<br />
<strong>in</strong>creased from 16–47% for R1 and from 22–51% for R2 with<br />
decreas<strong>in</strong>g HRT. No methane was detected <strong>in</strong> the biogas<br />
throughout the period <strong>of</strong> operation <strong>of</strong> the AFBRs. It was<br />
possible to verify that larger levels <strong>of</strong> attached biomass and<br />
EPS content on support materials resulted <strong>in</strong> higher HY and<br />
HPR values <strong>in</strong> AFBRs. R2 displayed a more favorable distribution<br />
<strong>of</strong> SMP for hydrogen <strong>production</strong>, with acetic and butyric<br />
acids as the dom<strong>in</strong>ant species. Glucose conversion <strong>in</strong> R2 was<br />
greater than <strong>in</strong> R1, which may be attributed to better surface<br />
characteristics <strong>of</strong> the expanded clay material for biomass<br />
attachment.<br />
Acknowledgments<br />
The authors gratefully acknowledge the f<strong>in</strong>ancial support <strong>of</strong><br />
FAPESP, CNPq and CAPES.<br />
references<br />
[1] Das D, Veziroglu TN. Hydrogen <strong>production</strong> by biological<br />
process: a survey <strong>of</strong> literature. Int J Hydrogen Energy 2001;26:<br />
13–28.<br />
[2] Kapdan IK, Kargi F. Bio-hydrogen <strong>production</strong> from waste<br />
materials. Enzyme Microb Technol 2006;38:569–82.<br />
[3] Lev<strong>in</strong> DB, Pitt L, Love M. <strong>Biohydrogen</strong> <strong>production</strong>: prospects<br />
and limitations to practical application. Int J Hydrogen<br />
Energy 2004;29:173–85.<br />
[4] Lay JJ, Lee YJ, Noike T. Feasibility <strong>of</strong> biological hydrogen<br />
<strong>production</strong> from organic fraction <strong>of</strong> municipal solid waste.<br />
Water Res 1999;33:2579–86.<br />
[5] Mizuno O, D<strong>in</strong>sdale E, Hawkes FR, Hawkes DL, Noike T.<br />
Enhancement <strong>of</strong> hydrogen <strong>production</strong> from glucose by<br />
nitrogen gas sparg<strong>in</strong>g. Bioresour Technol 2000;73:59–65.<br />
[6] Das D, Veziroglu TN. Advances <strong>in</strong> biological hydrogen<br />
<strong>production</strong> processes. Int J Hydrogen Energy 2008;33:6046–57.<br />
[7] Kotay SM, Das D. <strong>Biohydrogen</strong> as a renewable energy<br />
resourcedprospects and potentials. Int J Hydrogen Energy<br />
2008;33:258–63.<br />
[8] Hallenbeck PC. Fundamentals <strong>of</strong> the fermentative<br />
<strong>production</strong> <strong>of</strong> hydrogen. Water Sci Technol 2005;52:21–9.<br />
[9] van G<strong>in</strong>kel S, Sung SW, Lay JJ. <strong>Biohydrogen</strong> <strong>production</strong> as<br />
a function <strong>of</strong> pH and substrate concentration. Environ Sci<br />
Technol 2001;35:4726–30.<br />
[10] Fang HHP, Liu H. <strong>Effect</strong> <strong>of</strong> pH on hydrogen <strong>production</strong> from<br />
glucose by a mixed culture. Bioresour Technol 2002;82:87–93.<br />
[11] Khanal SK, Chen WH, Li L, Sung S. Biological hydrogen<br />
<strong>production</strong>: effects <strong>of</strong> pH and <strong>in</strong>termediate products. Int J<br />
Hydrogen Energy 2004;29:1123–31.<br />
[12] Chen WM, Tseng ZJ, Lee KS, Chang JS. Fermentative<br />
hydrogen <strong>production</strong> with Clostridium butyricum CGS5<br />
isolated from <strong>anaerobic</strong> sewage sludge. Int J Hydrogen<br />
Energy 2005;30:1063–70.<br />
[13] Zhao QB, Yu HQ. Fermentative H 2 <strong>production</strong> <strong>in</strong> an upflow<br />
<strong>anaerobic</strong> sludge blanket reactor at various pH values.<br />
Bioresour Technol 2008;99:1353–8.<br />
[14] Argun H, Kargi F, Kapdan IK, Oztek<strong>in</strong> R. Batch dark<br />
fermentation <strong>of</strong> powdered wheat starch to hydrogen gas:<br />
effects <strong>of</strong> the <strong>in</strong>itial substrate and biomass concentrations.<br />
Int J Hydrogen Energy 2008;33:6109–15.<br />
[15] Wang CH, Chang JS. Cont<strong>in</strong>uous biohydrogen <strong>production</strong><br />
from starch with granulated mixed bacterial micr<strong>of</strong>lora.<br />
Enegy Fuels 2008;22:93–7.
<strong>in</strong>ternational journal <strong>of</strong> hydrogen energy 35 (2010) 3379–3388 3387<br />
[16] L<strong>in</strong> CY, Cheng CH. Fermentative hydrogen <strong>production</strong> from<br />
xylose us<strong>in</strong>g <strong>anaerobic</strong> mixed micr<strong>of</strong>lora. Int J Hydrogen<br />
Energy 2006;31:832–40.<br />
[17] Lo YC, Chen WM, Hung CH, Chen SD, Chang JS. Dark H 2<br />
fermentation from sucrose and xylose us<strong>in</strong>g H 2 -produc<strong>in</strong>g<br />
<strong>in</strong>digenous bacteria: feasibility and k<strong>in</strong>etic studies. Water<br />
Res 2008;42:827–42.<br />
[18] Yu H, Zhu Z, Hu W, Zhang H. Hydrogen <strong>production</strong> from rice<br />
w<strong>in</strong>ery wastewater <strong>in</strong> an upflow <strong>anaerobic</strong> reactor by us<strong>in</strong>g<br />
mixed <strong>anaerobic</strong> cultures. Int J Hydrogen Energy 2002;27:<br />
1359–65.<br />
[19] van G<strong>in</strong>kel SW, Oh SE, Logan BE. <strong>Biohydrogen</strong> gas <strong>production</strong><br />
from food process<strong>in</strong>g and domestic wastewaters. Int J<br />
Hydrogen Energy 2005;30:1535–42.<br />
[20] Ito T, Nakashimada Y, Senba K, Matsui T, Nishi N. Hydrogen<br />
and ethanol <strong>production</strong> from glycerol-conta<strong>in</strong><strong>in</strong>g wastes<br />
discharged after biodiesel manufactur<strong>in</strong>g process. J Biosci<br />
Bioeng 2005;100:260–5.<br />
[21] Yang H, Shao P, Lu T, Shen J, Wang D, Xu Z, et al. Cont<strong>in</strong>uous<br />
bio-hydrogen <strong>production</strong> from citric acid wastewater via<br />
facultative <strong>anaerobic</strong> bacteria. Int J Hydrogen Energy 2006;31:<br />
1306–13.<br />
[22] Mohan SV, Babu VL, Sarma PN. Anaerobic biohydrogen<br />
<strong>production</strong> from dairy wastewater treatment <strong>in</strong> sequenc<strong>in</strong>g<br />
batch reactor (AnSBR): effect <strong>of</strong> organic load<strong>in</strong>g rate. Enzyme<br />
Microb Technol 2007;41:506–15.<br />
[23] Yang P, Zhang R, McGarvey JA, Benemann JR. <strong>Biohydrogen</strong><br />
<strong>production</strong> from cheese process<strong>in</strong>g wastewater by <strong>anaerobic</strong><br />
fermentation us<strong>in</strong>g mixed microbial communities. Int J<br />
Hydrogen Energy 2007;32:4761–71.<br />
[24] Hawkes FR, Hussy I, Kyazze G, D<strong>in</strong>sdale R, Hawkes DL.<br />
Cont<strong>in</strong>uous dark fermentative hydrogen <strong>production</strong> by<br />
mesophilic micr<strong>of</strong>lora: pr<strong>in</strong>ciples and progress. Int J<br />
Hydrogen Energy 2007;32:172–84.<br />
[25] Qureshi N, Annous BA, Ezeji TC, Karcher P, Maddox IS.<br />
Bi<strong>of</strong>ilm <strong>reactors</strong> for <strong>in</strong>dustrial bioconversion processes:<br />
employ<strong>in</strong>g potential <strong>of</strong> enhanced reaction rates. Microb Cell<br />
Fact 2005;4:24.<br />
[26] Hickey RF, Owens RW. Methane generation from highstrength<br />
<strong>in</strong>dustrial wastes with the <strong>anaerobic</strong> biological<br />
<strong>fluidized</strong> <strong>bed</strong>. Biotechnol Bioeng 1981;23:399–413.<br />
[27] Iza J. Fluidized <strong>bed</strong> <strong>reactors</strong> for <strong>anaerobic</strong> wastewater<br />
treatment. Water Sci Technol 1991;24:109–32.<br />
[28] Tavares CRG, Russo C, Sant’anna Jr GL. Aerobic treatment <strong>of</strong><br />
wastewaters <strong>in</strong> a three-phase <strong>fluidized</strong>-<strong>bed</strong> bioreactor:<br />
a comparison <strong>of</strong> two types <strong>of</strong> polymeric supports. Environ<br />
Technol 1994;15:687–93.<br />
[29] Tavares CRG, Sant’anna Jr GL, Capdeville B. The effect <strong>of</strong> air<br />
superficial velocity on bi<strong>of</strong>ilm accumulation <strong>in</strong> a three-phase<br />
<strong>fluidized</strong>-<strong>bed</strong> reactor. Water Res 1995;29:2293–8.<br />
[30] Saucedo-Terán RA, Ramírez-Baca N, Manzanares-<br />
Papayanopoulos L, Bautista-Margulis R, Nevárez-<br />
Moorillón GV. Bi<strong>of</strong>ilm growth and <strong>bed</strong> fluidization <strong>in</strong><br />
a <strong>fluidized</strong> <strong>bed</strong> reactor packed with support materials <strong>of</strong> low<br />
density. Eng Life Sci 2004;4:160–4.<br />
[31] L<strong>in</strong> CN, Wu SY, Chang JS. Fermentative hydrogen <strong>production</strong><br />
with a draft tube <strong>fluidized</strong> <strong>bed</strong> reactor conta<strong>in</strong><strong>in</strong>g siliconegel-immobilized<br />
<strong>anaerobic</strong> sludge. Int J Hydrogen Energy<br />
2006;31:2200–10.<br />
[32] Zhang ZP, Tay JH, Show KY, Yan R, Liang DT, Lee DJ, et al.<br />
<strong>Biohydrogen</strong> <strong>production</strong> <strong>in</strong> a granular activated carbon<br />
<strong>anaerobic</strong> <strong>fluidized</strong> <strong>bed</strong> reactor. Int J Hydrogen Energy 2007;<br />
32:185–91.<br />
[33] Kosk<strong>in</strong>en PEP, Kaksonen AH, Puhakka LA. The<br />
relationship between <strong>in</strong>stability <strong>of</strong> H 2 <strong>production</strong> and<br />
compositions <strong>of</strong> bacterial communities with<strong>in</strong> a dark<br />
fermentation <strong>fluidized</strong>-<strong>bed</strong> bioreactor. Biotechnol Bioeng<br />
2007;97:742–58.<br />
[34] Amorim ELC, Barros AR, Damianovic MHRZ, Silva EL.<br />
Anaerobic <strong>fluidized</strong> <strong>bed</strong> reactor with expanded clay as<br />
support for hydrogen <strong>production</strong> through dark<br />
fermentation <strong>of</strong> glucose. Int J Hydrogen Energy 2009;34:<br />
783–90.<br />
[35] Shida GM, Barros AR, Reis CM, Amorim ELC,<br />
Damianovic MHRZ, Silva EL. Long-term stability <strong>of</strong> hydrogen<br />
and organic acids <strong>production</strong> <strong>in</strong> an <strong>anaerobic</strong> <strong>fluidized</strong>-<strong>bed</strong><br />
reactor us<strong>in</strong>g heat treated <strong>anaerobic</strong> sludge <strong>in</strong>oculum. Int J<br />
Hydrogen Energy 2009;34:3679–88.<br />
[36] Flemm<strong>in</strong>g HC, W<strong>in</strong>gender J. Relevance <strong>of</strong> microbial<br />
extracellular polymeric substances (EPSs) – part I: structural<br />
and ecological aspects. Water Sci Technol 2001;43:1–8.<br />
[37] Ma<strong>in</strong>t<strong>in</strong>guer SI, Fernandes BS, Duarte ICS, Saavedra NK,<br />
Adorno MAT, Varesche MB. Fermentative hydrogen<br />
<strong>production</strong> by microbial consortium. Int J Hydrogen Energy<br />
2008;33:4309–17.<br />
[38] Kim S, Han S, Sh<strong>in</strong> H. <strong>Effect</strong> <strong>of</strong> substrate concentration on<br />
hydrogen <strong>production</strong> and 16S rDNA-based analysis <strong>of</strong> the<br />
microbial community <strong>in</strong> a cont<strong>in</strong>uous fermenter. Process<br />
Biochem 2006;41:199–207.<br />
[39] Leite JAC, Fernandes BS, Pozzi E, Barboza M, Zaiat M.<br />
Application <strong>of</strong> an <strong>anaerobic</strong> packed-<strong>bed</strong> bioreactor for the<br />
<strong>production</strong> <strong>of</strong> hydrogen and organic acids. Int J Hydrogen<br />
Energy 2008;33:579–86.<br />
[40] Barros AR. Evaluation <strong>of</strong> different support materials <strong>of</strong><br />
hydrogen <strong>production</strong> <strong>in</strong> <strong>anaerobic</strong> <strong>fluidized</strong> reactor.<br />
Department <strong>of</strong> Chemical Eng<strong>in</strong>eer<strong>in</strong>g, M.Sc. Thesis,<br />
Federal University <strong>of</strong> São Carlos, Brazil; 2009 [In<br />
Portuguese].<br />
[41] APHA. In: Standard methods for the exam<strong>in</strong>ation for water<br />
and wastewater. 20th ed. Wash<strong>in</strong>gton, DC: American Public<br />
Health Association/American Water Works Association/<br />
Water Environmental Federation; 1998.<br />
[42] Varesche MB, Zaiat M, Vieira LGT, Vazoller RF, Foresti E.<br />
Microbial colonization <strong>of</strong> polyurethane foam matrices <strong>in</strong><br />
horizontal flow <strong>anaerobic</strong> immobilized sludge (HAIS) reactor.<br />
Appl Microbiol Biotechnol 1997;48:534–8.<br />
[43] Chen CY, Chen SD. Bi<strong>of</strong>ilm characteristics <strong>in</strong> biological<br />
denitrification bi<strong>of</strong>ilm <strong>reactors</strong>. Water Sci Technol 2000;41:<br />
147–54.<br />
[44] Lowry OH, Rosebrough NJ, Farr RL, Randall RJ. Prote<strong>in</strong><br />
measurement with the fol<strong>in</strong> phenol reagent. J Biol Chem<br />
1951;193:265–75.<br />
[45] Peterson GL. A simplification <strong>of</strong> the prote<strong>in</strong> assay method <strong>of</strong><br />
Lowry et al. which is more generally applicable. Anal<br />
Biochem 1977;83:346–56.<br />
[46] Dubois M, Gilles KA, Hamilton JK, Rebers PA, Smith F.<br />
Colorimetric method for determ<strong>in</strong>ation <strong>of</strong> sugars and related<br />
substances. Anal Biochem 1956;28:350–6.<br />
[47] Chen CC, L<strong>in</strong> CY. Start-up <strong>of</strong> <strong>anaerobic</strong> hydrogen produc<strong>in</strong>g<br />
<strong>reactors</strong> seeded with sewage sludge. Acta Biotechnol 2001;21:<br />
371–9.<br />
[48] Chang JS, Lee KC, L<strong>in</strong> PJ. <strong>Biohydrogen</strong> <strong>production</strong> with fixed<strong>bed</strong><br />
bio<strong>reactors</strong>. Int J Hydrogen Energy 2002;27:1167–74.<br />
[49] Dabrock B, Bahl H, Gottschalk G. Parameters affect<strong>in</strong>g<br />
solvent <strong>production</strong> by Clostridium pasteurianum. Appl Environ<br />
Microbiol 1992;58:1233–9.<br />
[50] Gavala HN, Skiadas IO, Ahr<strong>in</strong>g BK. Biological hydrogen<br />
<strong>production</strong> <strong>in</strong> suspended and attached growth <strong>anaerobic</strong><br />
reactor system. Int J Hydrogen Energy 2005;31:1164–75.<br />
[51] Lay JJ. Model<strong>in</strong>g and optimization <strong>of</strong> <strong>anaerobic</strong> digested<br />
sludge convert<strong>in</strong>g starch to hydrogen. Biotechnol Bioeng<br />
2000;68:269–78.<br />
[52] Kim IS, Hwang MH, Jang NJ, Hyun SH, Lee ST. <strong>Effect</strong> <strong>of</strong><br />
low pH on the activity <strong>of</strong> hydrogen utiliz<strong>in</strong>g methanogen<br />
<strong>in</strong> bio-hydrogen process. Int J Hydrogen Energy 2004;29:<br />
1133–40.
3388<br />
<strong>in</strong>ternational journal <strong>of</strong> hydrogen energy 35 (2010) 3379–3388<br />
[53] Kraemer JT, Bagley DM. Improv<strong>in</strong>g the yield from fermentative<br />
hydrogen <strong>production</strong>. Biotechnol Lett 2007;29:685–95.<br />
[54] Mu Y, Yu HQ, Wang G. Evaluation <strong>of</strong> three methods for<br />
enrich<strong>in</strong>g H 2 -produc<strong>in</strong>g cultures from <strong>anaerobic</strong> sludge.<br />
Enzyme Microb Technol 2007;40:947–53.<br />
[55] Alves CF, Melo LF, Vieira MJ. Influence <strong>of</strong> the medium<br />
composition on the characteristics <strong>of</strong> a denitrify<strong>in</strong>g bi<strong>of</strong>ilm<br />
formed by Alcaligenes denitrificans <strong>in</strong> a <strong>fluidized</strong> <strong>bed</strong> reactor.<br />
Process Biochem 2002;37:837–45.<br />
[56] Liu Y, Tay JH. The essential role <strong>of</strong> hydrodynamic shear force<br />
<strong>in</strong> the formation <strong>of</strong> bi<strong>of</strong>ilm and granular sludge. Water Res<br />
2002;36:1653–65.<br />
[57] Ribeiro R, Varesche MBA, Foresti E, Zaiat M. Influence <strong>of</strong> the<br />
carbon source on the <strong>anaerobic</strong> biomass adhesion on<br />
polyurethane foam matrices. J Environ Manage 2005;74:<br />
187–94.<br />
[58] Sutherland IW. Bi<strong>of</strong>ilm exopolysaccharides: a strong and<br />
sticky framework. Microbiology 2001;147:3–9.