yearbook 2009.indd - Ministry of Tourism Arts & Culture
yearbook 2009.indd - Ministry of Tourism Arts & Culture
yearbook 2009.indd - Ministry of Tourism Arts & Culture

Create successful ePaper yourself
Turn your PDF publications into a flip-book with our unique Google optimized e-Paper software.
T o u r i s m<br />
Yearbook<br />
2 0 0 9<br />
<strong>Ministry</strong> <strong>of</strong> <strong>Tourism</strong>, <strong>Arts</strong> and <strong>Culture</strong><br />
Republic <strong>of</strong> Maldives
T o u r i s m<br />
Yearbook<br />
2 0 0 9<br />
<strong>Ministry</strong> <strong>of</strong> <strong>Tourism</strong>, <strong>Arts</strong> and <strong>Culture</strong><br />
Republic <strong>of</strong> Maldives
© Copyright <strong>Ministry</strong> <strong>of</strong> <strong>Tourism</strong>, <strong>Arts</strong> and <strong>Culture</strong>, 2009<br />
<strong>Tourism</strong> Yearbook 2009<br />
ISBN 99915-95-45-7<br />
First Print: May 2009<br />
Produced and Published by<br />
Statistics & Research Section<br />
<strong>Ministry</strong> <strong>of</strong> <strong>Tourism</strong> <strong>Arts</strong> and <strong>Culture</strong><br />
6th Floor, ADK Tower<br />
Ameer Ahmed Magu<br />
Male’ 20094<br />
Republic <strong>of</strong> Maldives<br />
Tel: +960 330 4952<br />
Fax: +960 330 4951<br />
E-mail: stat@maldivestourism.gov.mv<br />
Website: www.tourism.gov.mv<br />
Data Compilation & Verification:<br />
Mariyam Sharmeela, Silma Ali, Aishath Yamna<br />
Concept:<br />
Mariyam Sharmeela, Aminath Fazla<br />
Layout & Design:<br />
Mariyam Sharmeela<br />
Editor:<br />
Moosa Zameer Hassan<br />
Cover Photos:<br />
Ahmed Shareef Nafees, Muhamed (Muha), Moosa Easa, Caroline Von Tuemplin, Mohamed Azmeel,<br />
Mohamed Musaaidh, Mohamed Siraj (Sidey)<br />
Inside Photos:<br />
Shazeen Abdul Samad, Andrea Pohlman, Caroline Von Tuemplin, Shaahina Ali<br />
Printed by:<br />
M7 Print Private Limited
Welcome to the <strong>Tourism</strong> Yearbook 2009! It is with great pleasure that I present to you this<br />
annual publication <strong>of</strong> <strong>Ministry</strong> <strong>of</strong> <strong>Tourism</strong>, <strong>Arts</strong> and <strong>Culture</strong>.<br />
Undoubtedly tourism is a very dynamic sector and timely dissemination <strong>of</strong> statistics is<br />
vital due to the significance <strong>of</strong> the industry. With this in mind, the <strong>Tourism</strong> Yearbook is<br />
published with the objective <strong>of</strong> providing comprehensive and latest statistical information<br />
on tourism industry, to the relevant Government authorities as well as private sector,<br />
institutions and individuals. This annual publication highlights key tourism indicators <strong>of</strong><br />
the Maldives for the past five years and provides information on the performance <strong>of</strong> the Maldives tourism<br />
industry in 2008.<br />
Year 2008 had been an eventful year for the Maldives, in terms <strong>of</strong> politics within the country as well as<br />
economic changes in the Maldives and around the world. While the Maldives welcomed a new administration<br />
<strong>of</strong> government, international tourism was being challenged by a deteriorating global economy. Growth in<br />
international tourist arrivals worldwide slowed down drastically during the last half <strong>of</strong> the year. Tourist<br />
arrivals to the Maldives increased by just about 1% showing that the Maldives tourism is highly dependent<br />
on the world economic situation. As the current troubled world economic scenario is expected to continue<br />
well into 2009 and beyond, international tourism is expected to stagnate.<br />
We have witnessed in the past that tourism, regardless <strong>of</strong> its vulnerability towards devastating crisis, manmade<br />
or natural, has shown overwhelming resilience and the ability to bounce back. Such resilience can<br />
be attributed to the determined efforts <strong>of</strong> the Government and the private sector. I am confident that with<br />
continued cooperation by the private sector and the Government, the Maldives tourism can recover and reach<br />
targeted growth levels from the current crisis.<br />
<strong>Tourism</strong> Yearbook 2009 is the result <strong>of</strong> combined efforts <strong>of</strong> many Government authorities, private sector<br />
organizations and the tourism industry <strong>of</strong> the Maldives. I acknowledge, with deep gratitude, the valuable<br />
contribution and support rendered by respective Government and private sector organizations.<br />
I do hope that the readers find this publication a useful source <strong>of</strong> information.<br />
Male’, May 2009<br />
i
Except where otherwise indicated, data used in this publication have been collected from relevant government<br />
agencies and the Maldives tourism industry.<br />
The <strong>Ministry</strong> <strong>of</strong> <strong>Tourism</strong>, <strong>Arts</strong> and <strong>Culture</strong> wishes to express its gratitude to the Department <strong>of</strong> National<br />
Planning, <strong>Ministry</strong> <strong>of</strong> Finance and Treasury, Department <strong>of</strong> Immigration and Emigration, Department <strong>of</strong><br />
Inland Revenue, Maldives Monetary Authority, Maldives Customs Services, Faculty <strong>of</strong> Hospitality and<br />
<strong>Tourism</strong> Studies, Maldives <strong>Tourism</strong> Promotion Board and the Maldives tourism industry for their continued<br />
cooperation and assistance in the compilation <strong>of</strong> this annual publication.<br />
ii
<strong>Tourism</strong> Yearbook 2009, has been produced and published by the Statistics Section <strong>of</strong> the <strong>Ministry</strong> <strong>of</strong><br />
<strong>Tourism</strong>, <strong>Arts</strong> and <strong>Culture</strong>. This publication briefly presents the overall performance <strong>of</strong> the tourism industry<br />
<strong>of</strong> the Maldives through 2004 to 2008. In addition to all the available national tourism statistics for the past<br />
five years (2004-2008), the publication contains major highlights <strong>of</strong> the tourism industry’s performance for<br />
2008.<br />
This publication is divided into 5 main sections<br />
1. Tourist Accommodation<br />
2. Tourist Arrival Trends<br />
3. Airlines Statistics<br />
4. Economic Indicators <strong>of</strong> <strong>Tourism</strong><br />
5. <strong>Tourism</strong> Highlights 2008<br />
Each section provides important data and information. Together, the sections provide a comprehensive picture<br />
<strong>of</strong> the tourism in the Maldives.<br />
iii
Foreword ......................................................................................................................................................... i<br />
Acknowledgements ........................................................................................................................................ ii<br />
Preface ............................................................................................................................................................ iii<br />
TOURIST ACCOMMODATION<br />
Tourist Accommodation in the Maldives ........................................................................................................ 1<br />
Table: 1 Number <strong>of</strong> Accommodation Establishments & their Bed Capacity, 2004 - 2008 ............................ 1<br />
Table: 2 Distribution <strong>of</strong> Resort Beds by Atolls, 2004 - 2008 ..........................................................................2<br />
Table: 3 Tourist Resorts by Type <strong>of</strong> Lease Holders, 2006 - 2008 ................................................................... 3<br />
Table: 4 Tourist Resorts by Type <strong>of</strong> Operators, 2006 - 2008 .......................................................................... 3<br />
Table: 5 Bed Nights, Occupancy Rate & Average Duration <strong>of</strong> Stay, 2004 - 2008.......................................... 4<br />
Table: 6 Monthly Average Occupancy Rates <strong>of</strong> Resorts & Hotels, 2004 - 2008 ............................................ 4<br />
TOURIST ARRIVAL TRENDS<br />
Global Arrival Trends ..................................................................................................................................... 7<br />
Table: 7 International Tourist Arrivals, 2007-2008 ........................................................................................ 7<br />
Tourist Arrivals to the Maldives ..................................................................................................................... 8<br />
Table: 8 Tourist Arrivals to the Maldives by Month, 2004 - 2008 ................................................................. 8<br />
Table: 9 Growth Trends <strong>of</strong> Tourist Arrivals by Month, 2004 - 2008 .............................................................. 8<br />
Major Markets ................................................................................................................................................. 9<br />
Figure: 1 Market Share by Regions, 2004 - 2008 ........................................................................................... 9<br />
Top Ten Markets <strong>of</strong> 2008 ...............................................................................................................................10<br />
Table: 10 Tourist Arrivals and Market Share <strong>of</strong> Top Ten Markets <strong>of</strong> 2008 ...................................................10<br />
Figure: 2 Arrival Growth and Market Share <strong>of</strong> UK Market, 2004 - 2008 .....................................................11<br />
Figure: 3 Monthly Tourist Arrival Trends <strong>of</strong> UK Market, 2004 - 2008 ........................................................ 11<br />
Figure: 4 Arrival Growth and Market Share <strong>of</strong> Italian Market, 2004 - 2008 ................................................12<br />
Figure: 5 Monthly Tourist Arrival Trends <strong>of</strong> Italian, 2004 - 2008 .................................................................12<br />
Figure: 6 Arrival Growth and Market Share <strong>of</strong> German Market, 2004 - 2008 ..............................................13<br />
Figure: 7 Monthly Tourist Arrival Trends <strong>of</strong> German, 2004 - 2008 ..............................................................13<br />
Figure: 8 Arrival Growth and Market Share <strong>of</strong> Russian Market, 2004 - 2008 ..............................................14<br />
Figure: 9 Monthly Tourist Arrival Trends <strong>of</strong> Russian, 2004 - 2008 ..............................................................14<br />
Figure: 10 Arrival Growth and Market Share <strong>of</strong> French Market, 2004 - 2008 ..............................................15<br />
Figure: 11 Monthly Tourist Arrival Trends <strong>of</strong> French, 2004 - 2008 ..............................................................15<br />
Figure: 12 Arrival Growth and Market Share <strong>of</strong> Chinese Market, 2004 - 2008 ............................................16<br />
Figure: 13 Monthly Tourist Arrival Trends <strong>of</strong> Chinese, 2004 - 2008 ............................................................16<br />
Figure: 14 Arrival Growth and Market Share <strong>of</strong> Japanese Market, 2004 - 2008 ..........................................17<br />
Figure: 15 Monthly Tourist Arrival Trends <strong>of</strong> Japanese, 2004 - 2008 ...........................................................17<br />
Figure: 16 Arrival Growth and Market Share <strong>of</strong> Swiss Market, 2004 - 2008 ...............................................18<br />
Figure: 17 Monthly Tourist Arrival Trends <strong>of</strong> Swiss Market, 2004 - 2008 ...................................................18<br />
Figure: 18 Arrival Growth and Market Share <strong>of</strong> Korean Market, 2004 - 2008 .............................................19<br />
Figure: 19 Monthly Tourist Arrival Trends <strong>of</strong> Korean, 2004 - 2008 .............................................................19<br />
Figure: 20 Arrival Growth and Market Share <strong>of</strong> Indian Market, 2004 - 2008 ..............................................20<br />
Figure: 21 Monthly Tourist Arrival Trends <strong>of</strong> Indian Market, 2004 - 2008 ..................................................20<br />
AIRLINE STATISTICS<br />
Table: 11 Passenger Arrivals by Type <strong>of</strong> Carriers, 2004 - 2008 ....................................................................23<br />
Table: 12 Traffic by International Carriers at Male’ & Gan International Airport, 2004 - 2008 ...................23<br />
Table: 13 Traffic by Domestic Carriers at Male’ International Airport, 2004 - 2008 ....................................25
ECONOMIC INDICATORS<br />
<strong>Tourism</strong> and its Role in the Economy <strong>of</strong> the Maldives ..................................................................................29<br />
Table: 14 <strong>Tourism</strong> Contribution to Gross Domestic Product (GDP), 2004 - 2008 ........................................29<br />
Table: 15 <strong>Tourism</strong> Revenue and Tax, 2004 - 2008 ........................................................................................29<br />
Table: 16 Government Expenditure on <strong>Tourism</strong>, 2004 - 2008 ......................................................................30<br />
Table: 17 <strong>Tourism</strong> Receipts, 2004 - 2008 ......................................................................................................30<br />
ADDITIONAL TABLES<br />
Table: 18 Bed Capacity <strong>of</strong> Tourist Resorts, 2004 - 2008 ...............................................................................33<br />
Table: 19 New Islands Leased for Resort/Hotel Development ......................................................................36<br />
Table: 20 Graduates from Faculty <strong>of</strong> Hospitality & <strong>Tourism</strong> Industry, 2004 - 2008 .....................................38<br />
Table: 21 Inbound and Outbound Travel, 2004 - 2008 ..................................................................................38<br />
Table: 22 Seasonal Variation <strong>of</strong> Tourist Arrivals, 2004 - 2008 ......................................................................38<br />
Table: 23 Tourist Arrivals & Market Share by Major Markets, 2004 - 2008 ...............................................39<br />
Table: 24 Growth Trends <strong>of</strong> Major Markets, 2004 - 2008 .............................................................................40<br />
Table: 25 Tourist Arrivals by Nationality - end March 2009 .........................................................................42<br />
Table: 26 Major <strong>Tourism</strong> Indicators - end March 2009 .................................................................................44<br />
TOURISM HIGHLIGHTS 2008<br />
MAP OF THE MALDIVES - illustrating the tourism developments
TOURIST ACCOMMODATION
There are generally four types <strong>of</strong> tourist accommodation commodat<br />
od<br />
atio<br />
in the Maldives. Out <strong>of</strong> which, resorts are the mainly<br />
used form <strong>of</strong> accommodation in the Maldives and the rest include Safari Vessels, Hotels and Guest Houses.<br />
(Refer Table1)<br />
2004 2005 2006 2007 2008<br />
Type <strong>of</strong> Establishment No Beds No Beds No Beds No Beds No Beds<br />
Resorts 87 16,858 88 17,348 89 17,802 92 19,028 94 19,860<br />
Hotels 8 636 8 636 9 713 11 836 13 1,110<br />
Guest Houses 28 425 28 425 21 391 24 400 24 400<br />
Safari Vessels 113 1,676 121 1,789 116 1,599 133 1,923 143 2,094<br />
Total 236 19,595 245 20,198 235 20,505 260 22,187 274 23,464<br />
Source: <strong>Ministry</strong> <strong>of</strong> <strong>Tourism</strong>, <strong>Arts</strong> & <strong>Culture</strong><br />
Tourist resorts, with its unique one island one resort concept, continue to be the most attractive type <strong>of</strong><br />
accommodation in the Maldives. Resorts consist over 85% <strong>of</strong> total bed capacity <strong>of</strong> the country. Over the last<br />
five years, resort bed capacity has been increasing at an average rate <strong>of</strong> 2.5% per year. Number <strong>of</strong> resorts<br />
increased from 87 in 2004 to 94 in 2008. The bed capacity <strong>of</strong> resorts increased from 16,858 in 2004 to 19,704<br />
in 2008.<br />
The second type <strong>of</strong> accommodation in the Maldives is the live-aboard safari vessels, which contribute over<br />
8% to total bed capacity <strong>of</strong> the Maldives. With the increasing popularity <strong>of</strong> this type <strong>of</strong> accommodation, the<br />
bed capacity increased from 1,676 in 2004 to 2,094 in 2008.<br />
Hotels and Guest Houses provide accommodation to tourists visiting Male’, the capital. By the end <strong>of</strong><br />
2008 there were 13 hotels and 24 guest houses with 1,110 beds and 400 beds respectively. Out <strong>of</strong> these 37<br />
establishments, all except two are located in Male’.<br />
1
Atoll<br />
Source: <strong>Ministry</strong> <strong>of</strong> <strong>Tourism</strong>, <strong>Arts</strong> & <strong>Culture</strong><br />
Beds<br />
2004 2005 2006 2007 2008<br />
%<br />
Share<br />
Beds<br />
%<br />
Share<br />
Beds<br />
%<br />
Share<br />
Beds<br />
%<br />
Share<br />
Haa Alifu - - 50 0.3 90 0.5 390 2.0 432 2.2<br />
Noonu - - - - - - - - 400 2.0<br />
Raa 430 2.6 466 2.7 470 2.6 470 2.5 470 2.4<br />
Baa 1,034 6.1 1,034 6.0 1,240 7.0 1,240 6.5 1,240 6.2<br />
Lhaviyani 1,150 6.8 1,180 6.8 1,196 6.7 1,276 6.7 1,294 6.5<br />
Kaafu 8,038 47.7 8,316 47.9 8,450 47.5 8,724 45.8 8,914 44.9<br />
Alifu (North & South) 4,938 29.3 4,978 28.7 5,032 28.3 5,058 26.6 5,240 26.4<br />
Vaavu 294 1.7 350 2.0 350 2.0 350 1.8 350 1.8<br />
Meemu 400 2.4 400 2.3 400 2.2 400 2.1 400 2.0<br />
Faafu 250 1.5 250 1.4 250 1.4 250 1.3 250 1.3<br />
Dhaalu 324 1.9 324 1.9 324 1.8 324 1.7 324 1.6<br />
Seenu - - - - - - 546 2.9 546 2.7<br />
Total 16,858 100.0 17,348 100.0 17,802 100.0 19,028 100.0 19,860 100.0<br />
Beds<br />
%<br />
Share<br />
Since the commencement <strong>of</strong> tourism in the Maldives in 1972, the development <strong>of</strong> resorts concentrated close<br />
to the only international airport in the country. Due to this, most beds in the Maldives are located in Kaafu<br />
Atoll. The difficulty in transferring tourists to far away resorts has been the major reason for Kaafu Atoll<br />
being centralized for resort development. During the Second <strong>Tourism</strong> Master Plan period (1999 - 2006),<br />
Male’ Atoll and Ari Atoll was considered the main tourism zone and the focus <strong>of</strong> tourism development.<br />
However, today, under the new Third <strong>Tourism</strong> Master Plan, the target is to expand tourism to all the atolls<br />
in the Maldives. The Third <strong>Tourism</strong> Master Plan’s vision is to expand and strengthen the Maldives tourism<br />
as an instrument <strong>of</strong> economic and social development in a manner that benefits all Maldivians in all parts <strong>of</strong><br />
the country.<br />
In 2004, Kaafu Atoll resorts consisted 47.7% to the total bed capacity <strong>of</strong> the Maldives. However, by the end<br />
<strong>of</strong> 2008 this percentage dropped by nearly 4% to 44.9%. Under the tourism expansion plan, five new resorts<br />
started operation in 2007 and 2008, two in Haa Alifu Atoll, one in Seenu Atoll and two in Noonu Atoll. It is<br />
expected that by the end <strong>of</strong> 2009, there will be at least one tourist resort in every atoll.<br />
2
2006 2007 2008<br />
Nos<br />
%<br />
Share<br />
Beds<br />
%<br />
Share<br />
%<br />
Change<br />
Nos<br />
%<br />
Share<br />
Beds<br />
%<br />
Share<br />
%<br />
Change<br />
Nos<br />
%<br />
Share<br />
Beds<br />
%<br />
Share<br />
%<br />
Change<br />
Local 68 76.4 13,796 77.5 -0.2 70 76.1 14,716 77.3 6.7 74 78.7 15,882 80.0 7.9<br />
Foreign 7 7.9 922 5.2 28.8 8 8.7 1,122 5.9 21.7 8 8.5 1,086 5.5 -3.2<br />
Joint Venture<br />
(Local / Foreign)<br />
14 15.7 3,084 17.3 9.9 14 15.2 3,190 16.8 3.4 12 12.8 2,892 14.6 -9.3<br />
Total 89 100.0 17,802 100.0 2.6 92 100.0 19,028 100.0 6.9 94 100.0 19,860 100.0 4.4<br />
Source: <strong>Ministry</strong> <strong>of</strong> <strong>Tourism</strong>, <strong>Arts</strong> & <strong>Culture</strong><br />
There were 74 resorts with a total bed capacity <strong>of</strong> 15,882 beds leased to local companies at the end <strong>of</strong> 2008.<br />
(Refer Table:3) While the bed capacity <strong>of</strong> resorts leased to joint venture companies declined by 9.3% over the<br />
year 2007, bed capacity in the resorts leased to foreign companies also declined by 3.2%. With 80% <strong>of</strong> the<br />
total bed capacity, beds in resorts operated by local companies increased by 7.9% in 2008 over 2007.<br />
2006 2007 2008<br />
Nos<br />
%<br />
Share<br />
Beds<br />
%<br />
Share<br />
%<br />
Change<br />
Nos<br />
%<br />
Share<br />
Beds<br />
%<br />
Share<br />
%<br />
Change<br />
Nos<br />
%<br />
Share<br />
Beds<br />
%<br />
Share<br />
%<br />
Change<br />
Local 42 47.2 9,442 53.0 -5.2 44 47.8 10,146 53.3 7.5 44 46.8 10,322 52.0 1.7<br />
Foreign 30 33.7 4,924 27.7 17.9 31 33.7 5,340 28.1 8.4 33 35.1 5,706 28.7 6.9<br />
Joint Venture<br />
(Local / Foreign)<br />
17 19.1 3,436 19.3 7.0 17 18.5 3,542 18.6 3.1 17 18.1 3,832 19.3 8.2<br />
Total 89 100.0 17,802 100.0 2.6 92 100.0 19,028 100.0 6.9 94 100.0 19,860 100.0 4.4<br />
Source: <strong>Ministry</strong> <strong>of</strong> <strong>Tourism</strong>, <strong>Arts</strong> & <strong>Culture</strong><br />
There were a total <strong>of</strong> 44 resorts, 10,322 beds, operated by local operators by the end <strong>of</strong> 2008, which is 52.0%<br />
<strong>of</strong> the total bed capacity <strong>of</strong> the Maldives (refer Table:4). While number <strong>of</strong> resorts operated by joint venture<br />
companies remained constant, resorts operated by foreign companies increased from 31 in 2007 to 33 in<br />
2008, consisting 28.7% <strong>of</strong> the total bed capacity.<br />
3
Year<br />
Tourist Bed Nights<br />
Bed night growth<br />
(%)<br />
Occupancy Rate (%)<br />
Average Duration <strong>of</strong><br />
Stay (days)<br />
2004 5,110,587 8.6 83.9 8.3<br />
2005 3,300,125 -35.4 64.4 8.3<br />
2006 4,826,372 * 46.2 81.4 8.0<br />
2007 5,293,224 9.7 82.8 8.5<br />
2008 5,451,164 3.0 78.0 8.8<br />
Note: * Revised<br />
Source: <strong>Ministry</strong> <strong>of</strong> <strong>Tourism</strong>, <strong>Arts</strong> & <strong>Culture</strong><br />
As shown in Table 5, tourist bed nights have been growing steadily over the years except for the year 2005.<br />
The huge decline <strong>of</strong> 35.4% in 2005 was the result <strong>of</strong> the Asian tsunami. The bed nights had recovered<br />
completely by the end <strong>of</strong> 2007 and surpassed pre-tsunami levels.<br />
Occupancy rate also showed the same pattern as that <strong>of</strong> bed nights. However, it still remains below pretsunami<br />
levels even at the end <strong>of</strong> 2008. The reason for the low occupancy rates maybe due to the increase<br />
in bed capacity over the past two years. The average duration <strong>of</strong> stay remained constant at 8.3 days, through<br />
2003 to 2005, showed a slight decline in 2006 and increased to 8.8 days at the end <strong>of</strong> 2008.<br />
Month 2004 2005 2006 2007 2008<br />
January 100.5 32.6 94.4 94.8 90.0<br />
February 100.8 64.9 96.8 100.1 95.9<br />
March 97.9 73.7 93.7 94.3 96.4<br />
April 90.6 61.9 92.2 92.6 88.2<br />
May 68.0 52.1 67.1 70.4 70.4<br />
June 57.4 46.3 56.7 58.9 54.2<br />
July 73.5 60.7 68.8 72.0 65.3<br />
August 92.3 77.5 86.1 84.4 76.0<br />
September 80.9 68.0 73.1 73.6 66.0<br />
October 83.8 75.3 81.4 81.2 76.2<br />
November 87.0 85.1 84.1 * 85.7 78.7<br />
December 74.5 74.5 82.5 * 85.1 79.1<br />
Annual Average 83.9 64.4 81.4 82.8 78.0<br />
Note: * Revised<br />
Source: <strong>Ministry</strong> <strong>of</strong> <strong>Tourism</strong>, <strong>Arts</strong> & <strong>Culture</strong><br />
4
TOURIST ARRIVAL TRENDS
According cord<br />
to the January<br />
2009 issue sue <strong>of</strong> the UNWTO World <strong>Tourism</strong> Barometer, international tourist arrivals<br />
totaled 924 million worldwide at the end <strong>of</strong> 2008 with an increase <strong>of</strong> 1.8% over 2007. It highlighted that<br />
arrivals had slowed drastically in 2008, under the influence <strong>of</strong> an extremely volatile and unfavorable global<br />
economy. According to the Barometer, after 5% increase in the first half <strong>of</strong> 2008, growth in international<br />
tourist arrivals moved into negative territory in the second half <strong>of</strong> the year with -1%. The UNWTO forecasts<br />
that international arrivals will be flat at best or a few percent down at worst by the end <strong>of</strong> 2009, as there are<br />
no signs that this downward trend will be reversed in the near future.<br />
Tourist Arrivals<br />
(in millions)<br />
2007 2008 * % Change % Share 2008 *<br />
Europe 488 489 0.1 52.9<br />
Asia & the Pacific 185 188 1.6 20.4<br />
Americas 143 148 3.6 16.0<br />
Africa 45 47 4.5 5.1<br />
Middle East 48 53 11.4 5.7<br />
World 908 924 1.8 100.0<br />
Source: <strong>Ministry</strong> <strong>of</strong> <strong>Tourism</strong>, <strong>Arts</strong> & <strong>Culture</strong><br />
Table adapted from UNWTO World <strong>Tourism</strong> Barometer, January 2009 edition<br />
Note: * Data as collected by UNWTO, January 2009<br />
All the regions performed well in 2008 showing positive growth (refer Table 7). While Europe showed the<br />
lowest percentage <strong>of</strong> growth (+0.1%), highest growth occurred in the Middle East with 11%. Africa rose by<br />
5% and Americas by 4%. Asia and the Pacific recorded a 2% rise in arrivals in 2008.<br />
7
Over the last five years tourist arrivals als tothe the Maldives have been increasing ng constantly tly except for the year<br />
2005. The drop in 2005 was due to the impacts <strong>of</strong> the Asian tsunami which affected the whole region.<br />
Over the last five years, monthly arrival trends show similar patterns (refer Table 8). Arrivals to Maldives are<br />
recorded to be at its peak from October to April and the month <strong>of</strong> July is recorded to have the lowest count<br />
in tourist arrivals to the Maldives.<br />
Jan Feb Mar Apr May Jun Jul Aug Sep Oct Nov Dec Total<br />
2004 61,861 59,692 63,855 55,396 42,197 33,835 43,527 55,843 46,838 52,511 56,656 44,505 616,716<br />
2005 18,747 29,391 35,742 29,714 25,309 22,590 29,860 38,366 33,748 40,543 44,461 46,849 395,320<br />
2006 58,332 54,741 54,596 55,983 40,961 33,037 42,776 49,968 44,593 54,721 53,594 58,621 601,923<br />
2007 64,570 65,224 64,491 63,171 46,602 38,457 51,025 53,168 48,468 58,706 56,797 65,210 675,889<br />
2008 64,621 67,963 71,623 62,670 48,764 40,283 47,675 51,824 50,687 56,363 57,961 62,578 683,012<br />
Source: <strong>Ministry</strong> <strong>of</strong> <strong>Tourism</strong>, <strong>Arts</strong> & <strong>Culture</strong><br />
Data provided by: Department <strong>of</strong> Immigration & Emigration<br />
The Year 2007 ended as a record year for the Maldives in terms <strong>of</strong> tourist arrivals with 675,889 visitors.<br />
The growth rate <strong>of</strong> 12.3% for the year was 3.8% higher than expected growth for the year. With this record<br />
achievement, year 2008 started with high expectations and a projected growth for the year was 5.6%. In the<br />
first three months <strong>of</strong> the year, arrivals increased steadily (refer Table 9). However, by the month <strong>of</strong> April,<br />
arrivals started slowing down, reflecting the rise in oil prices and deterioration <strong>of</strong> global economy. In spite<br />
<strong>of</strong> these conditions, the year ended with a 1.1% increase due to excellent performances showed in the first 6<br />
months <strong>of</strong> the year.<br />
Jan Feb Mar Apr May Jun Jul Aug Sep Oct Nov Dec Total<br />
2004 13.5 5.3 13.1 13.7 35.6 25.7 14.3 15.3 4.2 8.6 10.9 -23.6 9.4<br />
2005 -69.7 -50.8 -44.0 -46.4 -40.0 -33.2 -31.4 -31.3 -27.9 -22.8 -21.5 5.3 -35.9<br />
2006 211.2 86.3 52.8 88.4 61.8 46.2 43.3 30.2 32.1 35.0 20.5 25.1 52.3<br />
2007 10.7 19.2 18.1 12.8 13.8 16.4 19.3 6.4 8.7 7.3 6.0 11.2 12.3<br />
2008 0.1 4.2 11.1 -0.8 4.6 4.7 -6.6 -2.5 4.6 -4.0 2.0 -4.0 1.1<br />
Source: <strong>Ministry</strong> <strong>of</strong> <strong>Tourism</strong>, <strong>Arts</strong> & <strong>Culture</strong><br />
Data provided by: Department <strong>of</strong> Immigration & Emigration<br />
8
Europe continues to be the leading generating market to the Maldives (refer Figure 1). Over the last five<br />
years, this region contributed, on an average more than 75% to the total arrivals to the Maldives. However,<br />
European market share has shown a drop from 78.6% in 2003 to 72.8% at the end <strong>of</strong> 2008. Major markets<br />
from this region include, the United Kingdom, Italy, Germany, Russia, France & Switzerland.<br />
Asia is the second leading generating market to the Maldives. With a total <strong>of</strong> 145,494 tourists in 2008, the<br />
region captured a market share <strong>of</strong> 21.3% that year. Over the years, Asia has been growing steadily. In 2003,<br />
Asia shared 17.4%, at the end <strong>of</strong> 2008 it rose by 4%. Main markets from Asia include, China, Japan, Korea<br />
and India.<br />
In 2008, since more than 94% <strong>of</strong> the tourists arrivals to the Maldives was generated from Europe and Asia,<br />
the rest <strong>of</strong> the world contributed just about 6% <strong>of</strong> the arrivals to the Maldives. Market share from the African<br />
region remained almost constant through 2003 to 2008, with the highest recorded share being 0.9% in 2004<br />
and 2005. In 2007 and 2008, market share from Americas stood at 2.1%. This region had shown a steady<br />
increase in its share since 2003, from 1.4% in 2003 to 2.1% at the end <strong>of</strong> 2008. The market share from Oceania<br />
varied between 1.3% and 1.5% through 2003 to 2008. With a total <strong>of</strong> 10,661 tourists, the highest recorded<br />
share from Oceania was 1.6% in 2007. The Middle East, which is considered to be a rapidly growing region<br />
to the Maldives with high potential, captured a market share <strong>of</strong> 1.3% at the end <strong>of</strong> 2008. Arrivals from this<br />
region had been increasing steadily over the years, except for the year 2005, which was the Asian tsunami<br />
year.<br />
100%<br />
90%<br />
80%<br />
70%<br />
60%<br />
50%<br />
40%<br />
30%<br />
Middle East<br />
Oceania<br />
Americas<br />
Africa<br />
Asia<br />
Europe<br />
20%<br />
10%<br />
0%<br />
2004 2005 2006 2007 2008<br />
9
The top ten leading markets to the Maldives during the year 2008 were United Kingdom with a market share<br />
<strong>of</strong> 17.1%, Italy (15.2%), Germany (10.1%), Russia (7.2%), France (7.0%), China (6.1%), Japan (5.6%),<br />
Switzerland (4.0%), Korea (3.1%) and India (2.4%). While Russia made its way to the 4th position in 2008,<br />
Japan, which was the fifth market in 2007, dropped to the 7th position (refer Table 10).<br />
Rank<br />
2008 Country Arrivals<br />
2008 2007<br />
Market<br />
Share (%)<br />
Arrivals<br />
Market<br />
Share (%)<br />
1 United Kingdom 116,821 17.1 125,158 18.5 1<br />
2 Italy 103,824 15.2 117,246 17.3 2<br />
3 Germany 69,240 10.1 72,269 10.7 3<br />
4 Russia 48,978 7.2 31,845 4.7 7<br />
5 France 48,100 7.0 45,301 6.7 4<br />
6 China 41,511 6.1 35,976 5.3 6<br />
7 Japan 38,193 5.6 41,121 6.1 5<br />
8 Switzerland 26,983 4.0 26,183 3.9 8<br />
9 Korea 20,934 3.1 20,976 3.1 9<br />
10 India 16,663 2.4 17,327 2.6 10<br />
Global Total 683,012 675,889<br />
Source: <strong>Ministry</strong> <strong>of</strong> <strong>Tourism</strong>, <strong>Arts</strong> & <strong>Culture</strong><br />
Data provided by: Department <strong>of</strong> Immigration & Emigration<br />
Rank<br />
2007<br />
10
With a total <strong>of</strong> 116,821 tourists and a market share <strong>of</strong> 17.1% the United Kingdom was the number one leading<br />
market to the Maldives in 2008.<br />
30.0<br />
21.3<br />
23.8<br />
20.0<br />
15.9<br />
10.0<br />
18.5<br />
22.1<br />
17.9 18.5 17.1<br />
Percent (%)<br />
0.0<br />
-10.0<br />
2004 2005 2006 2007 2008<br />
-6.7<br />
-20.0<br />
-30.0<br />
-23.4<br />
Market Share<br />
Arrival Growth<br />
Over the last five years, the U.K. market has performed well with the market share varying between 17.1%<br />
and 18.5% (refer Figure 2). In the year 2005, this market showed its lowest decline <strong>of</strong> -23.4% due to Asian<br />
tsunami <strong>of</strong> December 2004. The U.K. market also captured its highest market share <strong>of</strong> 22.1% and became the<br />
number one leading market to the Maldives in 2005. In 2006 its market share dropped to 17.9%. However, in<br />
2007 it regained its market position. Though the market performed with a negative growth <strong>of</strong> 6.7% in 2008,<br />
it still remained as the number one leading market to the Maldives, at the end <strong>of</strong> 2008.<br />
As shown in Figure 3, the monthly performance shows irregular patterns over the last five years. While<br />
arrivals is at its peak in March, its lowest performance is observed in June.<br />
20,000<br />
18,000<br />
16,000<br />
14,000<br />
ival numbers<br />
Arri<br />
12,000<br />
10,000<br />
8,000<br />
6,000<br />
4,000<br />
2,000<br />
0<br />
Jan Feb Mar Apr May Jun Jul Aug Sep Oct Nov Dec Total<br />
2004 9,083 10,746 12,016 10,254 7,642 7,020 8,863 10,983 9,382 9,300 11,322 7,380 113,991<br />
2005 4,470 6,861 7,364 6,339 6,368 6,470 6,952 9,022 7,488 8,811 9,039 8,080 87,264<br />
2006 8,531 9,354 8,659 9,000 8,390 6,648 8,972 9,976 8,739 10,576 9,701 9,449 107,995<br />
2007 10,952 11,913 10,787 10,912 8,599 8,109 11,272 10,783 10,092 11,332 9,719 10,688 125,158<br />
2008 9,638 11,238 12,544 11,150 7,972 8,037 9,136 9,789 10,448 9,541 8,470 8,858 116,821<br />
11
At the end <strong>of</strong> 2008, the Italian market captured a market share <strong>of</strong> 15.2% making it the second most popular<br />
tourist generating market to the Maldives.<br />
30.0<br />
27.0<br />
20.0<br />
Percent (%)<br />
10.0<br />
0.0<br />
-10.0<br />
3.1<br />
11.8 14.1<br />
11.8 10.7 10.11<br />
2004 2005 2006<br />
2.0<br />
2007 2008<br />
-4.2<br />
-20.0<br />
-23.6<br />
Market Share<br />
Arrival Growth<br />
-30.0<br />
The Italian market is one <strong>of</strong> the well established traditional markets to the Maldives. Since 2002, Italian<br />
inbound travel to the Maldives has been stagnant and declined considerably in 2004, and in 2005 arrivals<br />
dropped to an all-time low due to the Asian tsunami. There is a decline in arrivals from Italy for the past 5<br />
years. With an annual average <strong>of</strong> 8.2% from 2003-2008, from over 140,000 in 2003 to less than 104,000 in<br />
2008. Similarly, Italian market share dropped from 25.1% in 2002 to 15.2% in 2008, with an annual average<br />
rate <strong>of</strong> -9.1% from 2003 to 2008.<br />
Unlike U.K., monthly arrivals from Italy show similar patterns over the last five years. The month <strong>of</strong> March<br />
is considered as the peak month and June records the lowest numbers <strong>of</strong> arrivals.<br />
20,000<br />
18,000<br />
16,000<br />
14,000<br />
12,000<br />
numbers<br />
Arrival n<br />
10,000<br />
8,000<br />
6,000<br />
4,000<br />
2,000<br />
0<br />
Jan Feb Mar Apr May Jun Jul Aug Sep Oct Nov Dec Total<br />
2004 15,478 16,181 17,540 12,843 6,536 6,242 6,702 13,714 8,279 8,765 9,833 8,931 131,044<br />
2005 3,039 6,882 8,392 5,602 2,444 2,738 4,175 8,903 4,751 5,649 7,339 10,201 70,115<br />
2006 14,703 12,977 13,866 13,293 5,683 5,020 6,733 11,106 6,718 8,368 8,168 12,294 118,929<br />
2007 15,507 14,323 13,872 13,488 5,455 5,027 6,925 9,555 5,896 7,912 7,034 12,252 117,246<br />
2008 13,473 13,630 14,865 11,246 4,212 3,683 5,432 8,305 5,972 5,579 6,711 10,715 103,824<br />
12
With a total <strong>of</strong> 69,240 tourists, the German market captured a market share <strong>of</strong> 10.1% and remained in the<br />
third position at the end <strong>of</strong> 2008.<br />
80.0<br />
60.0<br />
69.6<br />
40.0<br />
(%)<br />
Percent (<br />
20.0<br />
0.0<br />
-20.0<br />
21.2 17.7 19.8 17.3 15.2<br />
-1.4<br />
2004 -6.6<br />
2005 2006 2007 2008<br />
-11.4<br />
-40.0<br />
-60.0<br />
-46.5<br />
Market Share<br />
Arrival Growth<br />
Though Germany is a well established and leading market to the Maldives, its market share has been on<br />
the decline since 1992. Over the last five years, the market captured a market share <strong>of</strong> 11.7% on an average<br />
(refer Figure 6). The biggest decline <strong>of</strong> over 23% occurred due to the 2005 tsunami, the German market also<br />
showed a decline <strong>of</strong> 4.2% in 2008.<br />
As seen in figure 7, monthly performance <strong>of</strong> this market shows very similar patterns over the last five years.<br />
It increased from January to March, and slows in April and it increases in May, drops to its lowest in June and<br />
from June till November the market grows steadily. In December the German market again starts to decline.<br />
9,000 9000<br />
8,000<br />
7,000<br />
6,000<br />
rivals numbers<br />
Arr<br />
5,000<br />
4,000<br />
3,000<br />
2,000<br />
1,000<br />
0<br />
Jan Feb Mar Apr May Jun Jul Aug Sep Oct Nov Dec Total<br />
2004 5,869 6,446 7,143 6,195 6,788 3,905 4,806 5,791 6,273 7,898 7,181 4,672 72,967<br />
2005 2,373 4,030 5,582 4,329 5,204 3,032 3,665 4,218 5,065 6,251 7,011 5,022 55,782<br />
2006 6,044 6,032 7,170 6,591 6,133 4,293 4,191 5,135 6,026 6,991 6,829 5,395 70,830<br />
2007 5,911 6,186 6,982 6,718 6,930 4,288 4,629 4,790 5,850 7,450 6,829 5,706 72,269<br />
2008 6,000 6,182 7,949 6,015 6,983 3,964 4,163 4,103 5,292 6,647 6,880 5,062 69,240<br />
13
In 2008, the Russian market captured a market share <strong>of</strong> 7.2% and became the 4th leading market to the<br />
Maldives.<br />
60.0<br />
50.0<br />
49.3<br />
50.6<br />
53.8<br />
40.0<br />
45.0<br />
30.0<br />
Percent(%)<br />
20.0<br />
10.0<br />
0.0<br />
-10.0<br />
2.9 3.7 3.6 4.7 7.2<br />
2004 2005 2006 2007 2008<br />
-20.0<br />
-19.3<br />
Market Share<br />
Arrival Growth<br />
-30.0<br />
In 2008, the most significant growth was performed by the Russian market with 53.8%. Russia is considered<br />
to be one <strong>of</strong> the potential and was the fastest growing markets to the Maldives in 2008. Over the last five<br />
years, excluding the tsunami year 2005, the Russian market has performed with an average <strong>of</strong> nearly 52%<br />
growth. The market share increased from 2.1% in 2003 to 7.2% in 2008.<br />
One <strong>of</strong> the factors that contributed to the increase in Russian arrivals to the Maldives was the start <strong>of</strong> charter<br />
flights from Moscow to Male’. The Kras Air which stopped its operation in 2006, restarted in 2007 and<br />
increased its flight movements in 2008. A new airline named Atlant Soyuz also began its charter flights from<br />
Moscow in 2008.<br />
The monthly arrivals from Russia show similar patterns over the last five years. June is recorded to have the<br />
lowest count in arrivals from Russia, while January records the highest number <strong>of</strong> arrivals.<br />
7,000<br />
6,000<br />
5,000<br />
rival numbers<br />
Arr<br />
4,000<br />
3,000<br />
2,000<br />
1,000<br />
0<br />
Jan Feb Mar Apr May Jun Jul Aug Sep Oct Nov Dec Total<br />
2004 2,357 1,136 1,217 1,840 1,485 688 1,024 1,115 1,127 1,784 2,343 1,959 18,075<br />
2005 1,223 828 1,186 1,121 1,002 768 849 1,233 1,160 1,329 2,052 1,831 14,582<br />
2006 2,812 1,553 1,779 2,157 1,348 932 1,431 1,543 1,174 1,889 2,386 2,951 21,955<br />
2007 4,401 2,205 2,696 2,958 1,791 1,257 1,654 2,239 1,932 2,793 3,855 4,064 31,845<br />
2008 5,507 3,339 4,730 4,313 3,345 2,225 2,691 3,511 2,834 3,997 6,397 6,089 48,978<br />
14
The French market captured a market share <strong>of</strong> 7% to and was the 5th top tourist generating market to the<br />
Maldives in 2008.<br />
120.0<br />
100.0<br />
101.6<br />
80.0<br />
60.0<br />
Percent (% %)<br />
40.0<br />
20.0<br />
0.0<br />
-20.0<br />
12.4<br />
3.8 6.2<br />
5.5<br />
7.5<br />
7.2<br />
6.7 7.0<br />
2004 2005 2006 2007 2008<br />
-40.0<br />
-60.0<br />
-53.1<br />
Market Share<br />
Arrival Growth<br />
-80.0<br />
At the end <strong>of</strong> 2008, over 48 thousand tourists visited the Maldives from France with an annual growth rate <strong>of</strong><br />
6.2%. The market share increased from 6.7% in 2007 to 7% in 2008. Even though the French market share<br />
increased in 2008, it lost its 4th position to Russia in that year.<br />
The French market captured a market share <strong>of</strong> 7.3% in 2003, increased by 0.2% in 2004, it declined by 2% in<br />
2005, recovered to 2003 level in 2006, declined again in 2007 but increased its share to 7.0% in 2008 (refer<br />
Figure 10).<br />
Monthly performance <strong>of</strong> the French market shows that its best performance occurs from November to April<br />
(refer Figure 11). Arrivals start to decline in May and records the lowest in June.<br />
8000 8,000<br />
7,000<br />
6,000<br />
rival numbers<br />
Ar<br />
5,000<br />
4,000<br />
3,000<br />
2,000<br />
1,000<br />
0<br />
Jan Feb Mar Apr May Jun Jul Aug Sep Oct Nov Dec Total<br />
2004 5,661 6,193 6,324 5,076 2,277 1,258 2,089 2,718 1,864 3,124 5,170 4,402 46,156<br />
2005 870 2,229 2,170 2,002 1,013 554 982 1,395 1,140 1,932 3,343 4,010 21,640<br />
2006 5,712 6,690 5,605 5,145 2,366 1,069 1,735 2,594 1,927 2,662 3,703 4,419 43,627<br />
2007 6,010 6,678 6,761 4,742 2,076 1,048 1,485 1,977 1,411 2,865 5,030 5,218 45,301<br />
2008 6,784 7,163 6,019 5,801 2,437 1,096 1,455 2,393 1,674 3,295 4,565 5,418 48,100<br />
15
)<br />
The sixth leading market to the Maldives in 2008 was China with a total arrival <strong>of</strong> 61,511 and a market share<br />
<strong>of</strong> 6.1%. The Chinese market was the 6th leading market to the Maldives in 2007 as well. It grew by 15.4%<br />
in 2008 over 2007 and the market share increased from 5.3% in 2007 to 6.1% in 2008 (refer Figure 12).<br />
140.0<br />
120.0<br />
127.4<br />
100.0<br />
80.0<br />
Percent (%)<br />
60.0<br />
40.0<br />
20.0<br />
0.0<br />
-20.0<br />
37.1<br />
36.3<br />
15.4<br />
3.3 2.9 4.4 5.3 6.1<br />
2004 2005 2006 2007 2008<br />
-40.0<br />
-60.0<br />
-43.6<br />
Market Share<br />
Arrival Growth<br />
Apart from Russia, China is also considered to be a market with great potential. It has been increasing on an<br />
average rate <strong>of</strong> 48% over the last five years excluding 2005. It’s market share has been increasing steadily<br />
over the last five years. In 2003, it captured a market share <strong>of</strong> 2.7%, and at the end <strong>of</strong> 2008 it’s share rose to<br />
6.1%. As shown in Figure 13, the months <strong>of</strong> Dec, March and April show low performance throughout the<br />
period 2004-2008.<br />
6,000<br />
5,000<br />
rival numbers<br />
Ar<br />
4,000<br />
3,000<br />
2,000<br />
1,000<br />
0<br />
Jan Feb Mar Apr May Jun Jul Aug Sep Oct Nov Dec Total<br />
2004 4,297 829 913 1,278 2,638 1,037 1,830 1,663 1,490 2,430 1,099 1,095 20,599<br />
2005 146 202 438 631 754 726 1,515 1,482 1,450 1,824 1,071 1,370 11,609<br />
2006 2,852 1,985 1,376 1,479 2,406 1,595 2,230 2,244 2,262 3,090 2,382 2,495 26,396<br />
2007 1,855 4,591 1,647 1,981 3,505 2,722 3,159 3,996 3,450 4,097 2,671 2,302 35,976<br />
2008 2,569 5,638 2,065 2,408 3,631 3,133 3,903 3,440 4,724 4,286 3,101 2,613 41,511<br />
16
)<br />
Japan, which used to be the 4th leading market to Maldives and the largest tourist generating market in Asia,<br />
lost its market position and dropped to the 7th position capturing a market share <strong>of</strong> 5.6% at the end <strong>of</strong> 2008.<br />
80.0<br />
60.0<br />
69.9<br />
40.0<br />
Percent (%)<br />
20.00<br />
0.0<br />
11.5<br />
4.0<br />
7.6 5.9 6.6<br />
6.1<br />
5.6<br />
2004 2005 2006 2007 2008-7.1<br />
-20.0<br />
-40.0<br />
-60.0<br />
-50.4<br />
Market Share<br />
Arrival Growth<br />
The Japanese market declined considerably over the years. In 2004 it captured a market share <strong>of</strong> 7.6% making<br />
it the 4th major market to Maldives. Since then its share has been declining (refer Figure 14). In 2006, Japan<br />
lost its market position to France and fell to the 5th position. In 2008, the Japanese market recorded a decline<br />
<strong>of</strong> more than 7%. The Japanese market performance is at its best during the month <strong>of</strong> August and lowest is<br />
in the month <strong>of</strong> May.<br />
7,000<br />
6,000<br />
5,000<br />
rival numbers<br />
Arr<br />
4,000<br />
3,000<br />
2,000<br />
1,000<br />
0<br />
Jan Feb Mar Apr May Jun Jul Aug Sep Oct Nov Dec Total<br />
2004 3,553 3,206 3,471 3,513 3,040 3,182 4,462 6,031 5,178 3,931 4,377 2,995 46,939<br />
2005 622 1,025 1,472 1,519 1,011 1,385 2,256 2,962 3,037 2,668 2,498 2,814 23,269<br />
2006 2,918 2,238 2,820 2,573 2,167 2,696 3,950 4,003 4,269 4,094 4,225 3,575 39,528<br />
2007 2,586 3,293 3,623 3,173 2,057 2,822 3,554 4,322 4,714 3,913 3,477 3,587 41,121<br />
2008 2,269 2,985 3,088 2,832 2,305 3,062 3,746 3,966 4,288 3,413 3,178 3,061 38,193<br />
17
)<br />
With a market share <strong>of</strong> 4% in 2008, the Swiss market stood at the number 8th position.<br />
40.0<br />
35.9<br />
30.0<br />
20.0<br />
Percent (%)<br />
10.0<br />
0.0<br />
-10.0<br />
3.1<br />
4.7 4.9 4.4 3.9<br />
4.0<br />
-0.3<br />
2004 2005 2006 2007<br />
-5.0<br />
2008<br />
-20.0<br />
-30.0<br />
-40.0<br />
-33.9<br />
Market Share<br />
Arrival Growth<br />
The Swiss market was the sixth leading market to the Maldives in 2005. In 2006 it dropped to the 7th position<br />
with a decline <strong>of</strong> 0.5%. Its market share declined even further in 2007 and fell to the 8th position at the end<br />
<strong>of</strong> 2007 and remained at that position at the end <strong>of</strong> 2008. Though its position remained same the market share<br />
showed a slight increase <strong>of</strong> 0.1%.<br />
While most <strong>of</strong> the major markets showed double digit increase in the year 2004, the Swiss market showed<br />
a decline <strong>of</strong> 5% in that year. After the impact <strong>of</strong> tsunami, it recovered with a 35.9% growth in 2006, with a<br />
slight decline <strong>of</strong> 0.3% in 2007, and showed an increase <strong>of</strong> 3.1% at the end <strong>of</strong> 2008. October till April remain<br />
the best performance period as shown in Figure 17.<br />
4,000<br />
3,500<br />
3,000<br />
rival numbers<br />
Arr<br />
2,500<br />
2,000<br />
1,500<br />
1,000<br />
500<br />
0<br />
Jan Feb Mar Apr May Jun Jul Aug Sep Oct Nov Dec Total<br />
2004 2,861 3,329 3,023 3,402 1,857 1,141 1,697 1,343 1,940 3,134 3,430 2,095 29,252<br />
2005 1,176 1,624 2,076 1,729 1,263 804 1,386 1,213 1,474 2,340 2,321 1,915 19,321<br />
2006 2,758 2,438 2,395 3,169 1,766 866 1,768 973 1,741 2,893 2,801 2,683 26,251<br />
2007 2,551 2,581 2,702 3,731 1,478 956 1,817 904 1,726 2,221 2,792 2,724 26,183<br />
2008 2,815 2,883 3,265 2,933 1,465 1,214 1,459 1,099 1,665 2,544 3,080 2,561 26,983<br />
18
)<br />
Korea is the third market among the Asian markets which made its way to the top ten major market list <strong>of</strong><br />
Maldives. With a market share <strong>of</strong> 3.1% it stayed at the 9th position at the end <strong>of</strong> 2008.<br />
160.0<br />
140.0<br />
146.9<br />
120.0<br />
100.0<br />
80.0<br />
Percent (%)<br />
60.0<br />
40.0<br />
20.0<br />
0.0<br />
-20.0<br />
-40.0<br />
-60.0<br />
14.9<br />
1.6 1.7 2.7 3.1 3.1<br />
-0.2<br />
2004 2005 2006 2007 2008<br />
-32.4<br />
Market Share<br />
29.8<br />
Arrival Growth<br />
The Korean market made its way to the top ten list in 2006 and since then maintained its market position over<br />
the last three years. It’s market share rose from 1.6% in 2004 to 3.1% at the end <strong>of</strong> 2008.<br />
Even though it showed a negative growth <strong>of</strong> 0.2% in 2008, Korea is considered to be one <strong>of</strong> the potential<br />
markets to the Maldives and have been growing steadily over the years.<br />
As shown in Figure 19, the peak month for this market remained same over the years, the lowest performing<br />
months have been varying. From 2004 to 2006, the month <strong>of</strong> January was recorded to have the lowest count<br />
in tourist arrivals from Korea. However, this has changed over the last two years. In 2007, the lowest number<br />
<strong>of</strong> arrivals was in February while in 2008 it was July.<br />
3,500 3500<br />
3,000<br />
2,500<br />
rrival numbers<br />
Ar<br />
2,000<br />
1,500<br />
1,000<br />
500<br />
0<br />
Jan Feb Mar Apr May Jun Jul Aug Sep Oct Nov Dec Total<br />
2004 402 763 856 597 1,351 638 588 466 713 1,351 1,241 706 9,672<br />
2005 79 205 199 398 521 435 575 396 501 1,312 1,105 817 6,543<br />
2006 489 694 760 1,260 1,745 1,248 866 729 1,513 2,207 2,511 2,135 16,157<br />
2007 1,492 862 1,344 1,749 2,484 1,496 1,454 947 1,574 3,019 2,472 2,083 20,976<br />
2008 1,438 1,164 1,632 2,103 2,705 2,001 898 911 1,610 2,879 2,353 1,240 20,934<br />
19
With a total arrivals <strong>of</strong> 16,663 and a market share <strong>of</strong> 2.4%, the Indian market remained at the 10th position<br />
in the top ten market list <strong>of</strong> 2008.<br />
50.0<br />
43.5<br />
40.0<br />
30.0<br />
Market Share<br />
Arrival Growth<br />
Percent (%)<br />
)<br />
20.0<br />
17.7<br />
10.0<br />
0.0<br />
-10.0<br />
1.8 2.6 2.0 2.6 2.4<br />
2004 2005 2006 2007 2008<br />
-3.8<br />
-4.4<br />
-6.7<br />
Arrivals from India increased significantly from 2004 to 2008. It’s market share increased from 1.8% in 2004<br />
to 2.4% at the end <strong>of</strong> 2008.<br />
Indian arrivals to the Maldives have been increasing at an average rate <strong>of</strong> 9% over the last five years. The<br />
highest growth was recorded in 2007 with +43.5%. Arrivals from India is at its peak during the month <strong>of</strong> May<br />
and December and performs steadily in other months.<br />
2,500<br />
2,000<br />
rival numbers<br />
Arr<br />
1,500<br />
1,000<br />
500<br />
0<br />
Jan Feb Mar Apr May Jun Jul Aug Sep Oct Nov Dec Total<br />
2004 994 786 788 871 1,318 925 971 818 875 775 782 1,096 10,999<br />
2005 807 733 843 746 891 821 853 653 840 949 861 1,263 10,260<br />
2006 1,104 889 915 1,089 1,231 901 817 809 816 906 923 1,671 12,071<br />
2007 1,578 1,184 1,156 1,592 2,051 1,275 1,237 1,099 1,159 1,278 1,634 2,084 17,327<br />
2008 1,436 1,313 1,467 1,337 2,001 1,425 1,147 1,231 1,036 1,425 1,037 1,808 16,663<br />
20
AIRLINE STATISTICS
2004 2005 2006 2007 2008<br />
Type <strong>of</strong> Carrier<br />
Arrivals % Share Arrivals % Share Arrivals % Share Arrivals % Share Arrivals % Share<br />
Scheduled 578,147 81.3 419,271 81.6 592,971 80.7 669,219 80.3 694,718 80.8<br />
Charter 133,241 18.7 94,525 18.4 141,762 19.3 164,217 19.7 164,587 19.2<br />
Total 711,388 100.0 513,796 100.0 734,733 100.0 833,436 100.0 859,305 100.0<br />
Source: <strong>Ministry</strong> <strong>of</strong> <strong>Tourism</strong>, <strong>Arts</strong> & <strong>Culture</strong><br />
Data provided by: Department <strong>of</strong> Civil Aviation<br />
In 2008, 859,305 passengers arrived the Maldives by schedule and charter flights. This is a 3.1% increase<br />
compared to the 833,436 passengers that arrived in the year 2007. While more than 80% <strong>of</strong> the passengers<br />
arrived by Schedule flights, Charter flight passengers accounted for 19.2% <strong>of</strong> the total arrivals. As seen in<br />
Table 11, the charter flight passengers has been increasing steadily over the last five years, from 133,241<br />
passengers in 2004 to 164,587 passengers by the end <strong>of</strong> 2008.<br />
Operator<br />
No. <strong>of</strong><br />
Movements<br />
(Take <strong>of</strong>f /<br />
Landing)<br />
2004 2005 2006 2007 2008<br />
Passenger<br />
In<br />
No. <strong>of</strong><br />
Movements<br />
(Take <strong>of</strong>f /<br />
Landing)<br />
Passenger<br />
In<br />
No. <strong>of</strong><br />
Movements<br />
(Take <strong>of</strong>f /<br />
Landing)<br />
Passenger<br />
In<br />
No. <strong>of</strong><br />
Movements<br />
(Take <strong>of</strong>f /<br />
Landing)<br />
Passenger<br />
In<br />
No. <strong>of</strong><br />
Movements<br />
(Take <strong>of</strong>f /<br />
Landing)<br />
Passenger<br />
In<br />
International Schedule 9,074 578,147 7,400 419,271 8,114 592,971 9,414 669,219 9,993 694,718<br />
Aer<strong>of</strong>lot 54 3,320 - - 4 585 - - 26 2,492<br />
Air Europe -Italy 400 48,491 - - - - - - - -<br />
Air Seychelles 384 5,343 44 785 - - - - - -<br />
Air Sahara 66 1,680 264 8,575 - -<br />
Austrian Airlines 206 11,379 130 7,368 158 11,482 110 7,827 42 3,342<br />
Bangkok Airways 50 1,333 26 359 18 741 224 9,142 256 8,872<br />
China Eastern Airlines 280 7,075 217 7,690<br />
Condor 228 25,695 220 23,060 260 27,431 258 28,512 252 27,949<br />
Czech Airlines 4 19 28 147 - - - - - -<br />
Emirates 1,656 99,045 1,390 74,411 1,336 103,911 1,242 109,713 1,234 128,053<br />
Eur<strong>of</strong>ly 446 52,974 372 39,317 444 50,049 487 50,476 522 52,787<br />
Island Aviation Corporation - - - - - - - - 991 25,028<br />
Indian Airlines 734 42,036 736 45,678 820 52,433 1,258 68,425 1,326 63,836<br />
Krasair - - 12 772 - - - - - -<br />
Jazeera Airways 38 641 30 498<br />
L. T. U 340 39,858 306 29,068 310 38,206 314 37,859 258 29,896<br />
Lauda Air - Italy / Livingston 98 9,365 98 10,700 190 23,268 190 23,219 138 13,209<br />
Lauda Air - Vienna - - - - - - - - - -<br />
Malaysia Airlines 208 14,090 288 16,822 312 21,984 333 15,297 422 27,162<br />
Martin Air - - 18 802 152 4,616 56 1,229 - -<br />
Mihin Lanka - - - - - - 208 10,229 116 4,603<br />
Qatar Airways 740 31,409 722 31,768 734 52,202 736 65,891 732 62,263<br />
Singapore Airlines 540 62,699 404 35,916 540 63,893 730 90,472 735 83,569<br />
Srilankan Airlines 2,500 131,091 2,176 102,298 2,184 140,276 1,893 132,406 2,252 153,469<br />
Viva Macau - - - - 6 214 70 2,231 - -<br />
Srilankan Airlines (Cargo) 296 0 350 0 388 0 186 0 4 0<br />
Expo Aviation (Cargo) 190 0 80 0 192 0 537 0 440 0<br />
23
2004 2005 2006 2007 2008<br />
Operator<br />
No. <strong>of</strong><br />
Movements<br />
(Take <strong>of</strong>f /<br />
Landing)<br />
Passenger<br />
In<br />
No. <strong>of</strong><br />
Movements<br />
(Take <strong>of</strong>f /<br />
Landing)<br />
Passenger<br />
In<br />
No. <strong>of</strong><br />
Movements Passenger<br />
(Take <strong>of</strong>f / In<br />
Landing)<br />
No. <strong>of</strong><br />
Movements<br />
(Take <strong>of</strong>f /<br />
Landing)<br />
Passenger<br />
In<br />
No. <strong>of</strong><br />
Movements<br />
(Take <strong>of</strong>f /<br />
Landing)<br />
Passenger<br />
In<br />
International Charter 1,972 133,241 1,725 94,525 2,356 141,762 3,231 164,217 3,508 164,587<br />
Air 2000/First Choice<br />
Airways<br />
58 7,168 62 7,053 169 19,502 - - - -<br />
Air Italy - - 2 212 38 3,263 72 7,723 8 925<br />
Air Luxor 2 0 - - - - - - - -<br />
Air Plus Comet 36 3,130 - - - - - - - -<br />
Air Slovakia 46 1,455 - - - - - - - -<br />
Atlant Soyuz - - - - - - - - 34 2,927<br />
Belair 52 5,269 24 1,662 20 1,509 52 4,430 78 5,899<br />
Blue Panorama Airlines 38 3,555 12 733 98 9,186 84 9,317 96 9,339<br />
Britannia Airways/<br />
Thomson Fly<br />
50 6,358 50 6,528 34 4,913 18 2,001 76 9,106<br />
Cathay Pacific 14 1,126 - - - - - - - -<br />
Condor - - - - - - - - 24 781<br />
Corse Air International 40 4,850 20 3,194 38 8,543 - - - -<br />
Domodedovo Airlines 12 530 4 234 - - - - - -<br />
Eagle Aviation 14 729 - - - - - - - -<br />
Edelweiss 166 19,779 122 14,447 158 20,403 156 18,194 158 18,956<br />
First Choice - - - - - - 210 25,172 180 21,406<br />
Kras Air 51 1,225 20 535 - - 40 3,575 131 13,463<br />
Malev - Hungarian<br />
Airlines<br />
12 798 4 139 20 1,376 18 937 - -<br />
Monarch Airlines 264 41,523 214 35,945 158 27,433 226 33,728 190 30,243<br />
My Travel Airways 52 7,957 16 2,139 38 4,194 72 8,558 - -<br />
Neos Spa 6 225 96 10,732 162 18,600 78 7,950 82 9,099<br />
Star Airlines/XL Airways 56 9,179 4 623 56 7,431 110 16,651 110 16,000<br />
Transaero Airlines 122 10,019 92 8,531 80 11,262 140 14,746 122 15,406<br />
Travel Services 32 1,044 - - - - 2 45 8 410<br />
Tuifly Nordic - - - - - - - - 10 1,394<br />
Vaso Airlines - - - - - - 7 303 - -<br />
Volare - - - - 4 189 40 3,785 60 4,070<br />
Other Internationals 849 7,322 983 1,818 1,283 3,958 1,906 7,102 2,141 5,163<br />
Total 11,046 711,388 9,125 513,796 10,470 734,733 12,645 833,436 13,501 859,305<br />
Source: <strong>Ministry</strong> <strong>of</strong> <strong>Tourism</strong>, <strong>Arts</strong> & <strong>Culture</strong><br />
Data provided by: Department <strong>of</strong> Civil Aviation<br />
At the end <strong>of</strong> 2008, international scheduled flight movements increased by 6.2% and charter flights increased<br />
by 8.6%. Aer<strong>of</strong>lot restarted its scheduled flights in 2008. Three Airliners, namely, Air Sahara, Martin Air and<br />
Viva Macau stopped its scheduled flights in 2008.<br />
The major highlight for the year 2008 was the beginning <strong>of</strong> charter flights from Atlant Soyuz, a Russian<br />
Airliner. With a total flight movements <strong>of</strong> 34, it brought in 2,927 passengers to the Maldives in 2008. The<br />
Condor flight, also operated charter flights to the Gan International Airport, the second international airport<br />
opened in the Maldives in 2007.<br />
24
2004 2005 2006 2007 2008<br />
Operator<br />
No. <strong>of</strong><br />
Movements Passenger<br />
(Take <strong>of</strong>f / In<br />
Landing)<br />
No. <strong>of</strong><br />
Movements<br />
(Take <strong>of</strong>f /<br />
Landing)<br />
Passenger<br />
In<br />
No. <strong>of</strong><br />
Movements<br />
(Take <strong>of</strong>f /<br />
Landing)<br />
Passenger<br />
In<br />
No. <strong>of</strong><br />
Movements<br />
(Take <strong>of</strong>f /<br />
Landing)<br />
Passenger<br />
In<br />
No. <strong>of</strong><br />
Movements Passenger<br />
(Take <strong>of</strong>f / In<br />
Landing)<br />
Domestic<br />
Air Equator 256 3,076 175 2,263 - - - - - -<br />
Island Aviation<br />
Services<br />
Maldivian Air<br />
Taxi<br />
Trans Maldivian<br />
Airways (Scheduled)<br />
Trans Maldivian<br />
Airways<br />
Other Domestic<br />
*<br />
4,535 45,754 5,470 55,694 7,378 72,272 9,139 93,244 9,311 90,557<br />
34,762 163,048 25,150 136,569 35,859 186,522 38,959 195,361 39,570 204,413<br />
- - - - - - - - 1,538 21,408<br />
21,186 109,144 14,753 63,950 22,152 96,221 26,798 109,825 25,856 101,624<br />
1,347 0 1,443 0 2,028 0 - - - -<br />
Total 62,086 321,022 46,991 258,476 67,417 355,015 74,896 398,430 76,275 418,002<br />
Source: <strong>Ministry</strong> <strong>of</strong> <strong>Tourism</strong>, <strong>Arts</strong> & <strong>Culture</strong><br />
Data provided by: Department <strong>of</strong> Civil Aviation<br />
Even though there has not been any major increase in domestic flight movements, the passenger arrivals from<br />
domestic carriers showed nearly a 5% growth over 2007. While the Maldivian Air Taxi and Trans Maldivian<br />
Airways, mainly cater to the tourism sector <strong>of</strong> the Maldives, flight movements as well as passenger traffic,<br />
increased in 2008, Island Aviation Services showed a decline in passenger movements in 2008 compared to<br />
2007.<br />
25
ECONOMIC INDICATORS
Economic growth <strong>of</strong> the Maldives has been largely driven by the tourism sector. <strong>Tourism</strong> is the leading<br />
industry and a range <strong>of</strong> tertiary activities have grown to support tourism.<br />
Year GDP GDP Growth % <strong>Tourism</strong> Contribution<br />
% Share <strong>of</strong> <strong>Tourism</strong><br />
Contribution<br />
2004 8,312.30 9.5 2,688.80 32.3<br />
2005 7,927.50 -4.6 1,798.50 22.7<br />
2006 9,442.60 19.1 2,559.70 _/ 27.4 _/<br />
2007 10,067.40 6.6 2,816.60 27.9<br />
2008 10,607.30 5.4 2,884.95 27.2<br />
Note: _/ Revised fi gures<br />
Source: <strong>Ministry</strong> <strong>of</strong> <strong>Tourism</strong>, <strong>Arts</strong> & <strong>Culture</strong><br />
Data provided by: Department <strong>of</strong> National Planning<br />
From mid 80’s till early 2000’s tourism has contributed over 30% to the GDP <strong>of</strong> the Maldives. Though<br />
the percentage contribution nearly dropped by 10%, after the impact <strong>of</strong> Asian Tsunami <strong>of</strong> 2004, it started<br />
recovering in 2006. In 2007, tourism contribution stood at 27.9% and 2008 it showed a slight decline -0.7%.<br />
The decline in 2008 was due to the slow down in tourist arrivals in 2008 as a result <strong>of</strong> world economic<br />
recession.<br />
Year<br />
Government<br />
Revenue<br />
<strong>Tourism</strong> Revenue<br />
% Share <strong>of</strong> <strong>Tourism</strong><br />
Revenue<br />
<strong>Tourism</strong> Tax<br />
% Share <strong>of</strong><br />
<strong>Tourism</strong> Tax to<br />
<strong>Tourism</strong> Revenue<br />
2004 3,351.80 921.47 27.5 409.50 44.4<br />
2005 3,788.30 911.80 24.1 346.50 _/ 37.8<br />
2006 5,286.70 1,776.90 33.6 495.70 27.9<br />
2007 _// 6,669.40 2,525.07 37.9 544.25 21.7<br />
2008 7,054.43 1,969.72 27.9 566.55 28.8<br />
Note: _/ Revised fi gures, _// Provisional estimates<br />
Source: <strong>Ministry</strong> <strong>of</strong> <strong>Tourism</strong>, <strong>Arts</strong> & <strong>Culture</strong><br />
Data provided by: Department <strong>of</strong> Inland Revenue<br />
Over the last five years, tourism contribution to the government revenue has been increasing steadily. In 2004<br />
tourism contributed about 28% to the government revenue. In 2008, total Government Revenue was 7,054.43<br />
million Rufiyaa out <strong>of</strong> which 1,969.72 million came from tourism. The percentage share <strong>of</strong> tourism revenue<br />
to the total government revenue in 2008 was 27.9%.<br />
29
Year Government Expenditure <strong>Tourism</strong> Expenditure<br />
% Share <strong>of</strong><br />
<strong>Tourism</strong> Expenditure<br />
2004 3,779.10 56.30 1.5<br />
2005 5,775.40 57.40 1.0<br />
2006 _/ 7,066.20 100.80 1.4<br />
2007 9,036.30 111.80 1.2<br />
2008 10,801.76 170.80 1.6<br />
Note: _/ Revised fi gures,<br />
Source: <strong>Ministry</strong> <strong>of</strong> <strong>Tourism</strong>, <strong>Arts</strong> & <strong>Culture</strong><br />
Data provided by: <strong>Ministry</strong> <strong>of</strong> Finance & Treasury<br />
Even though the tourism revenue has been increasing at a steady rate over the years, the share <strong>of</strong> government<br />
expenditure on tourism is very low (refer Table 16). From 2005 to 2006 tourism expenditure almost doubled<br />
as a result <strong>of</strong> the extra activities that had to be carried out to recover from the impacts <strong>of</strong> Asian tsunami <strong>of</strong><br />
2004.<br />
In 2008, a total <strong>of</strong> 170.80 million Rufiyaa were spent on tourism, which is 1.6 <strong>of</strong> total government<br />
expenditure.<br />
Year<br />
<strong>Tourism</strong> Receipts Growth Rate (%) Exports, FOB Imports, CIF<br />
2004 470.87 17.27 122.40 639.30<br />
2005 286.64 -39.13 103.80 742.00<br />
2006 512.45 _/ 78.78 135.07 922.92<br />
2007 602.37 17.55 107.80 1,092.02<br />
2008 696.30 * 15.59 125.87 1,382.11<br />
Note: _/ Revised fi gures, * Provisional estimates<br />
Source: <strong>Ministry</strong> <strong>of</strong> <strong>Tourism</strong>, <strong>Arts</strong> & <strong>Culture</strong><br />
Data provided by: Maldives Monetary Authority<br />
Maldives Customs Services<br />
<strong>Tourism</strong> Receipts, which is calculated in United States Dollars, has been increasing over the years (refer<br />
Table 17). In 2004 a total <strong>of</strong> 470.87 million US Dollars was received as tourism receipts. In 2008 tourism<br />
receipts totalled 692.32 million dollars. This was an increase <strong>of</strong> 15% over 2007.<br />
30
ADDITIONAL TABLES
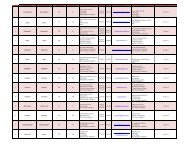
Name <strong>of</strong> the Resort<br />
Atoll & Island Name<br />
Airport<br />
Distance<br />
(Km)<br />
Year <strong>of</strong> Initial Initial Bed<br />
Operation Capacity<br />
2004 2005 2006 2007 2008<br />
1Adhaaran Club Bathala A.A. Bathala 48.3 1983 20 90 90 90 90 90<br />
2Adhaaran Club Rannaalhi K. Rannalhi 2.0 1978 34 232 232 232 232 256<br />
3Adhaaran Select Hudhuranfushi K. Lhohifushi 22.5 1979 40 274 274 274 354 354<br />
4Adhaaran Select Meedhupparu R. Meedhupparu 130.3 2000 430 430 466 470 470 470<br />
5Alimatha Aquatic Resort V. Alimatha 48.0 1975 20 204 260 260 260 260<br />
6Anantara Resort & Spa Maldives K. Dhigufinolhu 40.0 1980 24 200 200 220 220 220<br />
7Angaaga Island Resort and Spa A.Dh. Angaga 85.0 1989 100 140 140 140 140 140<br />
8Angsana Resort & Spa Maldives, Ihuru K. Ihuru 17.0 1978 20 90 90 90 90 90<br />
9Angsana Resort and Spa Maldives - Velavaru Dh. Velavaru 125.0 1998 50 168 168 168 168 168<br />
10Asdhu Sun Island K. Asdhu 32.0 1981 36 60 60 60 60 60<br />
11Athurugau Island Resort A.Dh. Athurugau 90.0 1990 79 98 98 98 98 98<br />
12Bandos Island Resort and Spa K. Bandos 8.0 1972 220 450 450 450 450 450<br />
13Banyan Tree Maldives Vabbinfaru K. Vabbinfaru 12.0 1977 24 96 96 96 96 96<br />
14Baros Holiday Resort K. Baros 16.0 1973 56 150 150 150 150 150<br />
15Biyaadhu Island Resort K. Biyaadhoo 18.0 1982 192 192 192 192 192 192<br />
16Chaaya Lagoon Hakuraa Huraa M. Hakuraa Huraa 128.7 1999 72 160 160 160 160 160<br />
17Cinnamon Island Alidhoo H.A. Alidhoo 300.0 2007 66 - - - 200 200<br />
18Club Faru, Farukolhufushi K. Farukolhufushi 2.0 1973 112 304 304 304 304 304<br />
19Club Med Kanifinolhu K. Kanifinolhu 19.3 1978 18 378 378 444 444 444<br />
20Coco Palm Boduhithi K. Boduhithi 29.0 1979 50 206 206 206 206 206<br />
21Coco Palm Dhunikolhu B. Dhunikolhu 124.0 1998 192 200 200 200 200 200<br />
22Coco Palm Kudahithi K. Kudahithi 27.4 1984 12 14 14 14 14 14<br />
23Cocoa Island K. Makunufushi 30.0 1981 12 60 70 70 70 70<br />
24Conrad Maldives Rangali Island A.Dh. Rangalifinolhu 96.6 1992 80 304 304 304 304 304<br />
25Diva Maldives A.Dh. Dhidhdhufinolhu 104.0 1988 180 282 282 282 282 394<br />
26Dhiggiri Tourist Resort V. Dhiggiri 32.0 1982 50 90 90 90 90 90<br />
27Chaaya Island Dhonveli K. Kanuoiy Huraa 13.0 1981 20 92 128 176 292 292<br />
28Dream Island Maldives K. Villivaru 29.0 1981 120 120 120 120 120 120<br />
29Ellaidhu Tourist Resort A.A., Ellaidhoo 54.0 1985 32 156 156 156 176 224<br />
30Emboodhu Village K. Emboodhu 8.0 1979 44 236 236 236 236 236<br />
31Eriyadhu Island Resort K. Eriyadhu 40.0 1982 40 114 114 114 114 114<br />
32Fihalhohi Island Resort K. Fihaalhohi 28.0 1981 90 300 300 300 300 300<br />
33Filitheyo Island Resort F. Filitheyo 120.7 1999 250 250 250 250 250 250<br />
34Four Seasons Resort Maldives at Kuda Huraa K. Kuda Huraa 12.9 1977 32 212 212 212 212 212<br />
35Four Seasons Resort Maldives at Landaa Giraavaru B. Landaa Giraavaru 120.0 2006 206 - - 206 206 206<br />
36Full Moon Beach Resort K. Furanafushi 5.6 1973 112 312 312 312 312 312<br />
33
Name <strong>of</strong> the Resort<br />
Atoll & Island Name<br />
Airport<br />
Distance<br />
(Km)<br />
Year <strong>of</strong> Initial<br />
Operation<br />
Initial Bed<br />
Capacity<br />
2004 2005 2006 2007 2008<br />
37Fun Island Resort K. Bodufinolhu 38.0 1980 44 200 200 200 200 200<br />
38Gangehi Island Resort A.A. Gangehi 77.2 1987 50 50 50 50 50 72<br />
39Gasfinolhu Island Resort K. Gasfinolhu 23.0 1980 18 80 80 80 80 80<br />
40Giraavaru Tourist Resort K. Giraavaru 11.3 1980 40 132 132 132 132 132<br />
41Halaveli Holiday Village A.A. Halaveli 36.0 1982 30 112 112 112 112 112<br />
42Helengeli Island Resort K. Helengeli 46.7 1979 20 100 100 100 100 100<br />
43Handhufushi S. Herethere 480.0 2007 106 - - - 546 546<br />
44Holiday Island A.Dh. Dhiffushi 93.0 1994 284 284 284 284 284 284<br />
45Huvafenfushi K. Nakatchafushi 25.7 1979 80 102 102 102 102 102<br />
46Irufushi Beach and Spa Resort N. Medhafushi 238.0 2008 200 - - - - 300<br />
Island Hideaway at Dhonakulhi<br />
47 H.A. Dhonakulhi 250.0 2005 50 - 50 90 90 90<br />
Maldives, Spa Resort & Marina<br />
48Island <strong>of</strong> Bolifushi K. Bolifushi 12.0 1982 64 110 110 110 110 110<br />
49Kandooma Tourist Resort K. Kandoomafushi 27.4 1985 98 204 204 204 204 322<br />
50Kihaadhuffaru Resort B. Kihaadhuffaru 104.6 1999 200 200 200 200 200 200<br />
51Komandoo Maldive Island Resort Lh. Komandoo 128.7 1998 90 90 120 120 120 120<br />
52Kudarah Island Resort A.Dh. Kudarah 88.5 1991 50 60 60 60 60 60<br />
53Kuramathi Tourist Resort A.A. Kuramathi 56.3 1977 48 580 580 580 580 580<br />
54Kuredhdhu Island Resort Lh. Kuredhdhu 128.7 1978 18 660 660 660 740 746<br />
55Kurumba Maldives K. Vihamanaafushi 3.2 1972 60 362 362 362 362 362<br />
56Laguna Maldives K. Velassaru 11.3 1974 90 258 258 258 258 258<br />
57Lily Beach Resort A.Dh. Huvahendhoo 85.0 1994 168 170 170 170 170 170<br />
58Maayafushi Tourist Resort A.A. Maayafushi 63.0 1983 48 134 150 150 150 150<br />
59Machchafushi Island Resort A.Dh. Machchafushi 95.0 1992 96 128 128 128 128 128<br />
60Madoogali Resort A.A. Madoogali 77.2 1989 70 112 112 112 112 112<br />
61Makunudhoo Island K. Makunudhu 38.6 1983 58 74 74 74 74 74<br />
62Medhufushi Island Resort M. Medhufushi 128.7 2000 240 240 240 240 240 240<br />
63Meeru Island Resort K. Meerufenfushi 37.0 1978 128 454 518 518 570 570<br />
64Mirihi Island Resort A.Dh. Mirihi 112.6 1989 36 72 72 72 72 72<br />
65Mo<strong>of</strong>ushi Island Resort A.Dh. Mo<strong>of</strong>ushi 80.0 1990 84 120 124 124 124 124<br />
66Naladhu K. Veligandu Huraa 27.0 1986 32 112 112 112 138 138<br />
67Nika Island Resort A.A. Kudafolhudhu 69.2 1983 30 56 76 76 76 76<br />
68Olhuveli Beach & Spa Resort K. Olhuveli 51.5 1979 36 250 268 268 268 268<br />
69One & Only Kanuhura, Maldives Lh. Kanuhuraa 125.5 1999 200 200 200 200 200 200<br />
70One & Only Reethi Rah, Maldives K. Medhufinolhu 64.4 1979 24 120 264 264 264 264<br />
71Palm Beach Island Lh. Madhiriguraidhoo 128.7 1999 200 200 200 216 216 228<br />
72Paradise Island Resort & Spa K. Lankanfinolhu 9.6 1979 24 520 520 520 520 568<br />
34
Name <strong>of</strong> the Resort<br />
Atoll & Island Name<br />
Airport<br />
Distance<br />
(Km)<br />
Year <strong>of</strong> Initial<br />
Operation<br />
Initial Bed<br />
Capacity<br />
2004 2005 2006 2007 2008<br />
73Ranveli Village A.Dh. Villingilivaru 77.0 1991 112 112 112 112 112 112<br />
74Reethi Beach Resort B. Fonimagoodhoo 104.6 1998 200 200 200 200 200 200<br />
75Rihiveli Beach Resort K. Mahaanaelhi Huraa 40.2 1980 40 100 100 100 100 100<br />
76Royal Island Resort & Spa B. Horubadhoo 110.0 2001 304 304 304 304 304 304<br />
77Soneva Fushi By Six Senses B. Kunfunadhoo 104.6 1983 50 130 130 130 130 130<br />
78Soneva Gili By Six Senses K. Lankanfushi 9.7 1980 12 88 94 94 94 94<br />
79Summer Island Village K. Ziyaaraifushi 35.0 1983 58 216 216 216 216 216<br />
80Sun Island Resort & Spa A.Dh. Nalaguraidhoo 99.8 1998 700 852 852 852 852 852<br />
81Taj Coral Reef Resort K. Hembadhoo 32.2 1982 68 132 132 132 132 132<br />
82Taj Exortica Resort & Spa Maldives K. Embudhu Finolhu 12.9 1983 20 128 128 128 128 128<br />
83 The Beach House at Manafaru Maldives H.A Manafaru 337.0 2007 100 - - - 100 142<br />
84Thulhaagiri Island Resort K. Thulhaagiri 11.0 1980 44 138 138 138 138 138<br />
85Thundufushi Island Resort A.Dh. Thundufushi 80.5 1990 74 94 94 94 94 94<br />
86Twin Island Resort A.Dh. Maafushivaru 54.7 1991 60 94 94 94 98 98<br />
87Vaadhu Island Resort K. Vaadhu 8.0 1978 18 66 66 66 66 66<br />
88Vakarufalhi Island Resort A.Dh. Vakarufalhi 90.0 1994 100 100 100 100 100 100<br />
89Velidhoo Island Resort A.A. Velidhoo 80.5 1989 22 200 200 200 200 200<br />
90Veligandu Island A.A. Veligandu 51.0 1984 34 146 146 146 148 148<br />
91Vilamendhoo Island Resort A.Dh. Vilamendhoo 48.3 1994 200 282 282 282 282 282<br />
92Villu Reef Beach & Spa Resort Dh. Meedhuffushi 128.7 1998 136 156 156 156 156 156<br />
93W. Retreat & Spa Maldives A.A. Fesdhu 72.4 1982 90 110 110 164 164 164<br />
94 Zitahli Resort & Spa, Kudafunafaru N. Kudafunafaru 180.0 2008 100 - - - - 100<br />
Total 16,858 17,348 17,802 19,028 19,860<br />
Source: <strong>Ministry</strong> <strong>of</strong> <strong>Tourism</strong>, <strong>Arts</strong> & <strong>Culture</strong><br />
35
No. Name <strong>of</strong> the Island / Land<br />
Atoll<br />
No. Beds to be<br />
Developed<br />
Estimated Opening Date<br />
(as at end March 2009)<br />
11 Islands Leased in 2004<br />
1 Dholhiyadhoo Shaviyani Atoll 200 Nov - 2009<br />
2 Funamudua Gaafu Alifu Atoll 100<br />
3 Hadahaa Gaafu Alifu Atoll 100 Dec - 2009<br />
4 Hondaafushi Haa Dhaalu Atoll 200 Jul - 2010<br />
5 Kalhufahalafushi Thaa Atoll 200 NA<br />
6 Konotta Gaafu Dhaalu Atoll 100 Dec - 2009<br />
7 Lonudhuahuttaa Gaafu Dhaalu Atoll 100 Jan - 2010<br />
8 Maavelaavaru Noonu Atoll 100 Dec - 2009<br />
9 Olhuveli Laamu Atoll 200 Oct - 2009<br />
10 Randheli Noonu Atoll 100 Jun - 2010<br />
Rent Open Islands Leased in 2006 (Phase 1)<br />
11 Gazeera Gaafu Dhaalu Atoll 44 Dec - 2009<br />
12 Lundhufushi Raa Atoll 40 NA<br />
13 Meradhoo Gaafu Alifu Atoll 44 Dec - 2009<br />
14 Munandhuvaa Gaafu Alifu Atoll 48 NA<br />
15 Vagaru Shaviyani Atoll 70 Dec - 2009<br />
Rent Controlled Islands Leased in 2006 (Phase 1)<br />
16 Male’Fushi Thaa Atoll 100 Dec - 2009<br />
17 Kudamuraidhoo Haa Dhaalu Atoll 250 May - 2010<br />
18 Vatavarrehaa Gaafu Dhaalu Atoll 150 Nov - 2009<br />
Rent Open Islands Leased in 2006 (Phase 2)<br />
19 Naridhoo Haa Alifu Atoll 100 NA<br />
20 Maanenfushi Raa Atoll 150 NA<br />
21 Dhekunu Boduveli, Gasveli, Kudausfushi Meemu Atoll 60 Jul - 2010<br />
22 Mahadhdhoo Gaafu Alifu Atoll 100 Dec 2009<br />
23 Kaishidhoo Gaafu Dhaalu Atoll 60 NA<br />
Rent Controlled Islands Leased in 2006 (Phase 2)<br />
24 Kanbaalifaru Shaviyani Atoll 200 Dec 2009<br />
25 Gaakoshibee Shaviyani Atoll 200 Jan - 2010<br />
26 Kanifushi Lhaviyani Atoll 300 Dec - 2010<br />
27 Elaa Thaa Atoll 280 Dec 2009<br />
Hotels to be Developed in Regional Airports<br />
28 Hanimaadhoo Haa Dhaalu Atoll 200 May - 2010<br />
29 Kaadedhdhoo Gaafu Dhaalu Atoll 200 NA<br />
30 Kadhdhoo Laamu Atoll 200 NA<br />
Population Consolidation Resorts<br />
31 Berinmadhoo Haa Alifu Atoll 200 Feb - 2010<br />
32 Eththigili Raa Atoll 200 NA<br />
33 Falhumaafushi Gaafu Alifu Atoll 200 May 2010<br />
34 Vakkaru Baa Atoll 200 Jan - 2010<br />
36
No. Name <strong>of</strong> the Island / Land<br />
Atoll<br />
No. Beds to be<br />
Developed<br />
Estimated Opening Date<br />
(as at end March 2009)<br />
Islands Leased to AIM (Associated with an Airport)<br />
35 Farukolhu - North (Transit Hotel) Shaviyani Atoll 200 NA<br />
36 Farukolhu - South Shaviyani Atoll 200 NA<br />
37 Kudahuvadhoo (Transit Hotel) Dhaalu Atoll 200<br />
38 Maafushi Dhaalu Atoll 200 NA<br />
39 Maavedhdhoo (Transit Hotel) Gaafu Dhaalu Atoll 200 NA<br />
40 Odegalla Gaafu Dhaalu Atoll 200 NA<br />
41 Olhugiri Thaa Atoll 200 NA<br />
42 Raaverehaa (Transit Hotel) Gaafu Alifu Atoll 200<br />
43 Thimarafushi (Transit Hotel) Thaa Atoll 200 NA<br />
44 Ufulandhoo Raa Atoll 200<br />
Other Tourist Establishments Associated with an Airport<br />
45 Dharavandhoo (Transit Hotel) Baa Atoll 200 NA<br />
46 Dhigurah Gaafu Alifu Atoll 200 NA<br />
47 Huvandhumaavattaru Resort Noonu Atoll 200 NA<br />
48 Maafaru (Transit Hotel) Noonu Atoll 200 NA<br />
49 Mudhdhoo Baa Atoll 200 NA<br />
Islands Leased to MTDC<br />
50 Ekulhivaru Noonu Atoll 180 Sep - 2010<br />
51 Embudhufuhi & Olhuveli Dhaalu Atoll 220 Sep - 2010<br />
52 Kihavah Huravalhi Baa Atoll 110 Sep - 2010<br />
53 Kondeymatheelaabadhu Gaafu Alifu Atoll 100 Sep - 2010<br />
54 Magudhdhuvaa Gaafu Dhaalu Atoll 200 Sep - 2010<br />
55 Naagoashi Haa Dhaalu Atoll 600 Sep - 2010<br />
56 Uligamu (City Hotel) Haa Alifu Atoll 100 Sep - 2010<br />
57 Vodamulaa Gaafu Alifu Atoll 300<br />
Other Islands + City Hotels<br />
58 Hankede Seenu Atoll 160 NA<br />
59 Fuvahmulah Gnayiyani Atoll 120 NA<br />
60 Hudhufushi Lhaviyani Atoll 400 N A<br />
61 Male’ Hotel Kaafu Atoll 200 NA<br />
62 Villingili Seenu Atoll 396 Sep - 2009<br />
Lagoon Resorts<br />
63 Kaashidhuffaru Kaafu Atoll 200<br />
64 Kelaa Haa Alifu Atoll 200 NA<br />
Training Resorts<br />
65 Bodufinolhu & Gasgan’du finolhu Laamu Atoll 150 Sep 2010<br />
66 Gan Laamu Atoll 150<br />
67 Nolhivaranfaru Haa Dhaalu Atoll 200 NA<br />
Source: <strong>Ministry</strong> <strong>of</strong> <strong>Tourism</strong>, <strong>Arts</strong> & <strong>Culture</strong><br />
37
Full Time Courses Other Courses Grand<br />
Total<br />
Year Male Female Total Male Female Total<br />
2004 122 18 140 182 225 407 547<br />
2005 90 28 118 104 110 214 332<br />
2006 70 25 95 151 26 177 272<br />
2007 63 16 79 104 71 175 254<br />
2008 75 49 124 64 13 77 201<br />
Total 282 71 556 437 361 1,050 1,606<br />
Source: <strong>Ministry</strong> <strong>of</strong> <strong>Tourism</strong>, <strong>Arts</strong> & <strong>Culture</strong><br />
Data provided by: Faculty <strong>of</strong> Hospitality & <strong>Tourism</strong> Studies<br />
Year Arrivals % change Departure % change<br />
2004 66,503 53.9 60,930 38.2<br />
2005 72,831 9.5 76,977 26.3<br />
2006 82,243 12.9 74,348 -3.4<br />
2007 100,575 22.3 101,842 37.0<br />
2008 121,287 20.6 123,008 20.8<br />
Source: <strong>Ministry</strong> <strong>of</strong> <strong>Tourism</strong>, <strong>Arts</strong> & <strong>Culture</strong><br />
Data provided by: Department <strong>of</strong> Immigration & Emigration<br />
Year Jan Feb Mar Apr May Jun Jul Aug Sep Oct Nov Dec Seasonality<br />
Ratio<br />
2004 120 116 124 108 82 66 85 109 91 102 110 87 1.2<br />
2005 57 89 108 90 77 69 91 116 102 123 135 142 1.4<br />
2006 116 109 109 112 82 66 85 100 89 109 107 117 1.2<br />
2007 115 116 114 112 83 68 91 94 86 104 101 116 1.2<br />
2008 114 119 126 110 86 71 84 91 89 99 102 110 1.3<br />
Source: <strong>Ministry</strong> <strong>of</strong> <strong>Tourism</strong>, <strong>Arts</strong> & <strong>Culture</strong><br />
Data provided by: Department <strong>of</strong> Immigration & Emigration<br />
Note<br />
Seasonal Index = (monthly arrivals x 100) / annual average arrivals<br />
Seasonality Ratio = highest monthly index / 100<br />
38
By Nationality 2004 2005 2006 2007 2008<br />
Europe 475,707 306,856 457,535 495,371 497,565<br />
(77.1) (77.6) (76.0) (73.3) (72.8)<br />
Austria 13,059 9,358 14,100 13,673 13,462<br />
(2.1) (2.4) (2.3) (2.0) (2.0)<br />
Belgium 3,085 1,595 3,990 3,552 3,368<br />
(0.5) (0.4) (0.7) (0.5) (0.5)<br />
Czech Republic 2,433 1,433 2,295 2,766 3,811<br />
(0.4) (0.4) (0.4) (0.4) (0.6)<br />
Denmark 1,256 1,095 1,499 1,819 1,834<br />
(0.2) (0.3) (0.2) (0.3) (0.3)<br />
Finland 788 357 518 789 865<br />
(0.1) (0.1) (0.1) (0.1) (0.1)<br />
France 46,156 21,640 43,627 45,301 48,100<br />
(7.5) (5.5) (7.2) (6.7) (7.0)<br />
Germany 72,967 55,782 70,830 72,269 69,240<br />
(11.8) (14.1) (11.8) (10.7) (10.1)<br />
Greece 2,949 1,703 3,584 4,850 4,926<br />
(0.5) (0.4) (0.6) (0.7) (0.7)<br />
Hungary 3,568 1,124 2,661 2,568 2,052<br />
(0.6) (0.3) (0.4) (0.4) (0.3)<br />
Ireland 2,202 1,452 2,648 3,148 2,884<br />
(0.4) (0.4) (0.4) (0.5) (0.4)<br />
Israel 747 567 846 1,308 1,588<br />
(0.1) (0.1) (0.1) (0.2) (0.2)<br />
Italy 131,044 70,115 118,929 117,246 103,824<br />
(21.2) (17.7) (19.8) (17.3) (15.2)<br />
Netherlands 6,639 4,151 8,050 6,479 5,595<br />
(1.1) (1.1) (1.3) (1.0) (0.8)<br />
Norway 1,331 1,141 1,613 1,808 2,596<br />
(0.2) (0.3) (0.3) (0.3) (0.4)<br />
Poland 1,366 1,019 1,844 2,659 3,325<br />
(0.2) (0.3) (0.3) (0.4) (0.5)<br />
Portugal 3,608 2,238 3,655 4,188 4,150<br />
(0.6) (0.6) (0.6) (0.6) (0.6)<br />
Russia 18,075 14,582 21,955 31,845 48,978<br />
(2.9) (3.7) (3.6) (4.7) (7.2)<br />
Slovakia 1,936 501 944 1,469 1,916<br />
(0.3) (0.1) (0.2) (0.2) (0.3)<br />
Slovenia 755 569 796 1,204 1,372<br />
(0.1) (0.1) (0.1) (0.2) (0.2)<br />
Spain 7,561 3,510 6,678 8,798 8,217<br />
(1.2) (0.9) (1.1) (1.3) (1.2)<br />
Sweden 2,482 1,318 1,800 2,149 3,542<br />
(0.4) (0.3) (0.3) (0.3) (0.5)<br />
Switzerland 29,252 19,321 26,251 26,183 26,983<br />
(4.7) (4.9) (4.4) (3.9) (4.0)<br />
Turkey 2,610 869 2,044 2,442 3,235<br />
(0.4) (0.2) (0.3) (0.4) (0.5)<br />
Ukraine 1,316 1,060 2,427 3,545 5,399<br />
(0.2) (0.3) (0.4) (0.5) (0.8)<br />
United Kingdom 113,991 87,264 107,995 125,158 116,821<br />
(18.5) (22.1) (17.9) (18.5) (17.1)<br />
Other Europe 4,531 3,092 5,956 8,155 9,482<br />
(0.7) (0.8) (1.0) (1.2) (1.4)<br />
Asia 112,491 69,498 117,055 144,363 145,494<br />
(18.2) (17.6) (19.4) (21.4) (21.3)<br />
Bangladesh 667 643 1,050 1,284 455<br />
(0.1) (0.2) (0.2) (0.2) (0.1)<br />
China 20,599 11,609 26,396 35,976 41,511<br />
(3.3) (2.9) (4.4) (5.3) (6.1)<br />
India 10,999 10,260 12,071 17,327 16,663<br />
(1.8) (2.6) (2.0) (2.6) (2.4)<br />
Indonesia 622 520 625 943 581<br />
(0.1) (0.1) (0.1) (0.1) (0.1)<br />
Japan 46,939 23,269 39,528 41,121 38,193<br />
(7.6) (5.9) (6.6) (6.1) (5.6)<br />
Korea 9,672 6,543 16,157 20,976 20,934<br />
(1.6) (1.7) (2.7) (3.1) (3.1)<br />
Malaysia 2,908 2,366 2,915 2,999 3,137<br />
(0.5) (0.6) (0.5) (0.4) (0.5)<br />
Pakistan 1,529 940 1,119 1,013 1,191<br />
(0.2) (0.2) (0.2) (0.1) (0.2)<br />
Philippines 499 565 666 982 871<br />
(0.1) (0.1) (0.1) (0.1) (0.1)<br />
Singapore 3,016 3,258 4,255 4,456 4,956<br />
(0.5) (0.8) (0.7) (0.7) (0.7)<br />
Sri Lanka 8,351 7,165 7,954 9,654 9,752<br />
(1.4) (1.8) (1.3) (1.4) (1.4)<br />
Taiwan 1,842 685 1,281 2,018 2,233<br />
(0.3) (0.2) (0.2) (0.3) (0.3)<br />
Thailand 3,289 1,114 2,251 3,663 3,952<br />
(0.5) (0.3) (0.4) (0.5) (0.6)<br />
Other Asia 1,559 561 787 1,951 1,065<br />
(0.3) (0.1) (0.1) (0.3) (0.2)<br />
39
By Nationality<br />
2004 2005 2006 2007 2008<br />
Africa 5,325 3,460 4,169 4,846 5,694<br />
(0.9) (0.9) (0.7) (0.7) (0.8)<br />
South Africa 3,846 2,392 2,973 3,293 3,732<br />
(0.6) (0.6) (0.5) (0.5) (0.5)<br />
Other Africa 1,479 1,068 1,196 1,553 1,962<br />
(0.2) (0.3) (0.2) (0.2) (0.3)<br />
Americas 9,390 7,244 10,813 14,198 14,480<br />
(1.5) (1.8) (1.8) (2.1) (2.1)<br />
Brazil 533 429 564 708 1,327<br />
(0.1) (0.1) (0.1) (0.1) (0.2)<br />
Canada 2,069 1,426 2,196 2,851 2,966<br />
(0.3) (0.4) (0.4) (0.4) (0.4)<br />
U.S.A 5,999 4,833 7,150 9,348 8,853<br />
(1.0) (1.2) (1.2) (1.4) (1.3)<br />
Other Americas 789 556 903 1,291 1,334<br />
(0.1) (0.1) (0.2) (0.2) (0.2)<br />
Oceania 9,286 5,858 7,979 10,661 10,574<br />
(1.5) (1.5) (1.3) (1.6) (1.5)<br />
Australia 8,216 5,087 6,892 9,406 9,368<br />
(1.3) (1.3) (1.1) (1.4) (1.4)<br />
New Zealand 993 697 1,006 1,142 1,184<br />
(0.2) (0.2) (0.2) (0.2) (0.2)<br />
Other Oceania 77 74 81 113 22<br />
(0.0) (0.0) (0.0) (0.0) (0.0)<br />
Middle East 4,517 2,404 4,372 6,450 9,205<br />
(0.7) (0.6) (0.7) (1.0) (1.3)<br />
Kuwait 573 290 668 1,004 1,340<br />
(0.1) (0.1) (0.1) (0.1) (0.2)<br />
Lebanon 438 238 402 660 1,139<br />
(0.1) (0.1) (0.1) (0.1) (0.2)<br />
Saudi Arabia 1,872 691 1,530 1,940 2,747<br />
(0.3) (0.2) (0.3) (0.3) (0.4)<br />
United Arab Emirates 406 230 492 807 1,394<br />
(0.1) (0.1) (0.1) (0.1) (0.2)<br />
Other Middle East 1,228 955 1,280 2,039 2,585<br />
(0.2) (0.2) (0.2) (0.3) (0.4)<br />
Global Total 616,716 395,320 601,923 675,889 683,012<br />
Source: <strong>Ministry</strong> <strong>of</strong> <strong>Tourism</strong>, <strong>Arts</strong> & <strong>Culture</strong><br />
Data provided by: Department <strong>of</strong> Immigration & Emigration<br />
By Nationality 2004 2005 2006 2007 2008<br />
Europe 7.4 -35.5 49.1 8.3 0.4<br />
Austria 5.4 -28.3 50.7 -3.0 -1.5<br />
Belgium 10.4 -48.3 150.2 -11.0 -5.2<br />
Czech Republic 25.7 -41.1 60.2 20.5 37.8<br />
Denmark 17.1 -12.8 36.9 21.3 0.8<br />
Finland 28.3 -54.7 45.1 52.3 9.6<br />
France 12.4 -53.1 101.6 3.8 6.2<br />
Germany 3.1 -23.6 27.0 2.0 -4.2<br />
Greece 28.9 -42.3 110.5 35.3 1.6<br />
Hungary 40.3 -68.5 136.7 -3.5 -20.1<br />
Ireland 30.8 -34.1 82.4 18.9 -8.4<br />
Israel 36.3 -24.1 49.2 54.6 21.4<br />
Italy -6.6 -46.5 69.6 -1.4 -11.4<br />
Netherlands 31.5 -37.5 93.9 -19.5 -13.6<br />
Norway 34.9 -14.3 41.4 12.1 43.6<br />
Poland 39.1 -25.4 81.0 44.2 25.0<br />
Portugal 6.8 -38.0 63.3 14.6 -0.9<br />
Russia 49.3 -19.3 50.6 45.0 53.8<br />
Slovakia 24.7 -74.1 88.4 55.6 30.4<br />
Slovenia 14.2 -24.6 39.9 51.3 14.0<br />
Spain 19.6 -53.6 90.3 31.7 -6.6<br />
40
By Nationality 2004 2005 2006 2007 2008<br />
Europe 7.4 -35.5 49.1 8.3 0.4<br />
Sweden 27.9 -46.9 36.6 19.4 64.8<br />
Switzerland -5.0 -33.9 35.9 -0.3 3.1<br />
Turkey 6.9 -66.7 135.2 19.5 32.5<br />
Ukraine 32.3 -19.5 129.0 46.1 52.3<br />
United Kingdom 21.3 -23.4 23.8 15.9 -6.7<br />
Other countries 15.9 -31.8 92.6 36.9 16.3<br />
Asia 14.6 -38.2 68.4 23.3 0.8<br />
Bangladesh 113.1 -3.6 63.3 22.3 -64.6<br />
China 37.1 -43.6 127.4 36.3 15.4<br />
India -4.4 -6.7 17.7 43.5 -3.8<br />
Indonesia 9.9 -16.4 20.2 50.9 -38.4<br />
Japan 11.5 -50.4 69.9 4.0 -7.1<br />
Korea 14.9 -32.4 146.9 29.8 -0.2<br />
Malaysia 29.2 -18.6 23.2 2.9 4.6<br />
Pakistan -21.3 -38.5 19.0 -9.5 17.6<br />
Philippines 32.7 13.2 17.9 47.4 -11.3<br />
Singapore -35.2 8.0 30.6 4.7 11.2<br />
Sri Lanka 14.5 -14.2 11.0 21.4 1.0<br />
Taiwan 100.0 -62.8 87.0 57.5 10.7<br />
Thailand 9.3 -66.1 102.1 62.7 7.9<br />
Other countries 109.8 -64.0 40.3 147.9 -45.4<br />
Africa 33.7 -35.0 20.5 16.2 17.5<br />
South Africa 31.3 -37.8 24.3 10.8 13.3<br />
Other countries 40.2 -27.8 12.0 29.8 26.3<br />
Americas 22.5 -22.9 49.3 31.3 2.0<br />
Brazil 19.2 -19.5 31.5 25.5 87.4<br />
Canada 25.5 -31.1 54.0 29.8 4.0<br />
U.S.A 19.9 -19.4 47.9 30.7 -5.3<br />
Other countries 39.9 -29.5 62.4 43.0 3.3<br />
Oceania 31.8 -36.9 36.2 33.6 -0.8<br />
Australia 34.5 -38.1 35.5 36.5 -0.4<br />
New Zealand 31.7 -29.8 44.3 13.5 3.7<br />
Other countries -57.5 -3.9 9.5 39.5 -80.5<br />
Middle East 24.2 -46.8 81.9 47.5 42.7<br />
Kuwait 7.5 -49.4 130.3 50.3 33.5<br />
Lebanon 28.1 -45.7 68.9 64.2 72.6<br />
Saudi Arabia 44.4 -63.1 121.4 26.8 41.6<br />
United Arab Emirates 12.8 -43.3 113.9 64.0 72.7<br />
Other countries 11.1 -22.2 34.0 59.3 26.8<br />
Global Total 9.4 -35.9 52.3 12.3 1.1<br />
Source: <strong>Ministry</strong> <strong>of</strong> <strong>Tourism</strong>, <strong>Arts</strong> & <strong>Culture</strong><br />
Data provided by: Department <strong>of</strong> Immigration & Emigration<br />
41
Region / Nationality Jan-Mar ‘08 Jan-Mar ‘09<br />
% Change ‘09/’08<br />
(Jan-Mar)<br />
% Share ‘09<br />
(Jan-Mar)<br />
Europe 161,916 143,221 -11.5 78.6<br />
Austria 5,308 4,837 -8.9 2.7<br />
Belgium 1,224 1,136 -7.2 0.6<br />
Czech Republic 1,401 1,402 0.1 0.8<br />
Denmark 722 621 -14.0 0.3<br />
Finland 325 419 28.9 0.2<br />
France 19,966 19,913 -0.3 10.9<br />
Germany 20,131 16,951 -15.8 9.3<br />
Greece 651 671 3.1 0.4<br />
Hungary 1,099 1,005 -8.6 0.6<br />
Ireland 687 506 -26.3 0.3<br />
Israel 259 166 -35.9 0.1<br />
Italy 41,968 34,644 -17.5 19.0<br />
Netherlands / Holland 1,349 1,452 7.6 0.8<br />
Norway 722 707 -2.1 0.4<br />
Poland 969 1,046 7.9 0.6<br />
Portugal 601 625 4.0 0.3<br />
Romania 315 348 10.5 0.2<br />
Russia 13,576 13,640 0.5 7.5<br />
Slovakia 693 815 17.6 0.4<br />
Slovenia 388 366 -5.7 0.2<br />
Spain 1,650 1,267 -23.2 0.7<br />
Sweden 903 1,391 54.0 0.8<br />
Switzerland 8,963 8,292 -7.5 4.6<br />
Turkey 702 539 -23.2 0.3<br />
Ukraine 1,395 1,459 4.6 0.8<br />
United Kingdom 33,420 26,297 -21.3 14.4<br />
Other Europe 2,529 2,706 7.0 1.5<br />
Asia 33,394 30,825 -7.7 16.9<br />
Bangladesh 144 74 -48.6 0.0<br />
China 10,272 10,957 6.7 6.0<br />
India 4,216 3,596 -14.7 2.0<br />
Indonesia 143 107 -25.2 0.1<br />
Japan 8,342 8,261 -1.0 4.5<br />
Korea 4,234 2,278 -46.2 1.3<br />
Malaysia 688 657 -4.5 0.4<br />
Pakistan 263 172 -34.6 0.1<br />
Philippines 202 183 -9.4 0.1<br />
Singapore 1,038 971 -6.5 0.5<br />
Sri Lanka 2,235 1,864 -16.6 1.0<br />
Taiwan 535 506 -5.4 0.3<br />
Thailand 738 782 6.0 0.4<br />
Other Asia 344 417 21.2 0.2<br />
42
Region / Nationality Jan-Mar ‘08 Jan-Mar ‘09<br />
% Change ‘09/’08<br />
(Jan-Mar)<br />
% Share ‘09<br />
(Jan-Mar)<br />
Africa 1,105 907 -17.9 0.5<br />
South Africa 720 502 -30.3 0.3<br />
Other Africa 385 405 5.2 0.2<br />
Americas 3,881 3,546 -8.6 1.9<br />
Brazil 257 224 -12.8 0.1<br />
Canada 848 781 -7.9 0.4<br />
U.S.A. 2,444 2,213 -9.5 1.2<br />
Other Americas 332 328 -1.2 0.2<br />
Oceania 2,182 1,984 -9.1 1.1<br />
Australia 1,921 1,728 -10.0 0.9<br />
New Zealand 259 253 -2.3 0.1<br />
Other Oceania 2 3 50.0 0.0<br />
Middle East 1,729 1,695 -2.0 0.9<br />
Kuwait 532 291 -45.3 0.2<br />
Lebanon 134 164 22.4 0.1<br />
Saudi Arabia 421 552 31.1 0.3<br />
United Arab Emirates 229 269 17.5 0.1<br />
Other Middle East 413 419 1.5 0.2<br />
Total Tourist Arrivals 204,207 182,178 -10.8 100.0<br />
Source: <strong>Ministry</strong> <strong>of</strong> <strong>Tourism</strong>, <strong>Arts</strong> & <strong>Culture</strong><br />
Data provided by: Department <strong>of</strong> Immigration & Emigration<br />
43
Year January February March Jan - Mar<br />
TOURIST ARRIVALS<br />
Total<br />
Frontier Arrivals 2008 64,621 67,963 71,623 204,207<br />
2009 61,531 58,520 62,127 182,178<br />
Growth % -4.8 -13.9 -13.3 -10.8<br />
Surface Arrivals 2008 274 326 879 1,479<br />
2009 113 169 13 295<br />
Growth % -58.8 -48.2 -98.5 -80.1<br />
BED NIGHTS<br />
Total<br />
Resorts 2008 521,888 520,331 551,335 1,593,554<br />
2009 507,912 456,697 481,336 1,445,945<br />
Growth % -2.7 -12.2 -12.7 -9.3<br />
Hotels 2008 15,503 15,906 16,620 48,029<br />
2009 15,428 12,854 13,628 41,910<br />
Growth % -0.5 -19.2 -18.0 -12.7<br />
Total 2008 537,391 536,237 567,955 1,641,583<br />
2009 523,340 469,551 494,964 1,487,855<br />
Growth % -2.6 -12.4 -12.9 -9.4<br />
REGISTERED CAPACITY 2009 (RESORTS, HOTELS & SAFARI VESSELS)<br />
Average<br />
Number <strong>of</strong> Resorts 94 94 94 94<br />
Resort Bed Capacity 19,882 19,886 19,886 19,885<br />
Number <strong>of</strong> Hotels 13 13 13 13<br />
Hotel Bed Capacity 1,110 1,110 1,110 1,110<br />
Number <strong>of</strong> Safari Vessels 143 144 144 144<br />
Safari Vessel Bed Capacity 2,135 2,137 2,133 2,135<br />
Number <strong>of</strong> Guest Houses 28 28 28 28<br />
Guest House Bed Capacity 578 578 578 578<br />
Total No. 278 279 279 279<br />
Beds 23,705 23,711 23,707 23,708<br />
OPERATIONAL CAPACITY (RESORTS & HOTELS)<br />
Average<br />
No. <strong>of</strong> Resorts 2008 85 85 84 85<br />
2009 82 82 82 82<br />
Resort Bed Capacity 2008 18,238 18,250 17,974 18,154<br />
2009 18,412 18,416 18,498 18,442<br />
Number <strong>of</strong> Hotels 2008 12 12 12 12<br />
2009 13 13 13 13<br />
Hotel Bed Capacity 2008 1,030 1,030 1,030 1,030<br />
2009 1,110 1,110 1,110 1,110<br />
Total No. 2008 97 97 96 97<br />
2009 95 95 95 95<br />
Total Beds 2008 19,268 19,280 19,004 19,184<br />
2009 19,522 19,526 19,608 19,552<br />
44
Year January February March Jan - Mar<br />
OCCUPANCY RATE (%)<br />
Average<br />
Resorts 2008 92.3 101.8 98.9 97.7<br />
2009 89.0 88.6 84.0 87.2<br />
Change -3.3 -13.3 -15.0 -10.5<br />
Hotels 2008 48.6 55.2 52.1 51.9<br />
2009 44.8 41.4 39.6 41.9<br />
Change -3.7 -13.8 -12.4 -10.0<br />
Total 2008 90.0 99.3 96.4 95.2<br />
2009 86.5 85.9 81.5 84.6<br />
Change -3.5 -13.4 -14.9 -10.6<br />
AVG. DURATION OF STAY (RESORTS & HOTELS) 2008 8.3 7.9 7.9 8.0<br />
(Days) 2009 9.4 8.7 8.6 8.9<br />
Change 1.0 0.8 0.6 0.8<br />
Source: <strong>Ministry</strong> <strong>of</strong> <strong>Tourism</strong>, <strong>Arts</strong> & <strong>Culture</strong><br />
45
TOURISM HIGHLIGHTS 2008
During the course <strong>of</strong> the year 2008, the <strong>Ministry</strong> <strong>of</strong> <strong>Tourism</strong> greeted three new ministers. The first change<br />
had been when Dr. Abdulla Mausoom was appointed as the Minister <strong>of</strong> <strong>Tourism</strong> & Civil Aviation on 15 July<br />
2008. His appointment came following Dr. Mahmood Shaugee’s resignation as the Minister <strong>of</strong> <strong>Tourism</strong> &<br />
Civil Aviation.<br />
In 29 September 2008, Mr. Abdulla Yameen was appointed as the Minister <strong>of</strong> <strong>Tourism</strong> & Civil Aviation,<br />
while Dr. Mausoom was appointed as the Minister <strong>of</strong> Environment, Energy and Water.<br />
In 11 November 2008, after the presidential election and with the change <strong>of</strong> the government, <strong>Ministry</strong> <strong>of</strong><br />
<strong>Tourism</strong> & Civil Aviation was renamed as <strong>Ministry</strong> <strong>of</strong> <strong>Tourism</strong>, <strong>Arts</strong> and <strong>Culture</strong>. Dr. Ahmed Ali Sawad was<br />
appointed as the Minister <strong>of</strong> <strong>Tourism</strong>, <strong>Arts</strong> and <strong>Culture</strong> under the new administration <strong>of</strong> government.<br />
The “2nd UNWTO Asia/Pacific Executive Training Program<br />
on <strong>Tourism</strong> Policy and Strategy” was held in Paradise Island<br />
Resort and Spa, Maldives from 19-25 May 2008. The training<br />
program was organized by the United Nations World <strong>Tourism</strong><br />
Organization (UNWTO) in collaboration with the <strong>Ministry</strong> <strong>of</strong><br />
<strong>Tourism</strong> and Civil Aviation <strong>of</strong> Maldives, with financial support<br />
from the Government <strong>of</strong> the Republic <strong>of</strong> Korea.<br />
The aim <strong>of</strong> the program was to provide a platform for high level policy makers to get together for brainstorming<br />
<strong>of</strong> contemporary tourism issues.<br />
A total <strong>of</strong> 39 delegates from 20 different countries, including Maldives, participated in this program. In<br />
addition to the training, delegates also visited some <strong>of</strong> the resorts and inhabited islands in the vicinity, on a<br />
one day technical tour to experience “one island one resort” policy.<br />
A seminar on the management <strong>of</strong> human resources, organized<br />
by the <strong>Ministry</strong> <strong>of</strong> <strong>Tourism</strong> and Civil Aviation, was held on 2nd<br />
June 2008 to discuss various issues faced by stakeholders and<br />
employees in the tourism sector. The main purpose <strong>of</strong> this seminar<br />
was to draft a proposal on strategic human resource solutions that<br />
would address the human resources issues <strong>of</strong> the tourism industry<br />
<strong>of</strong> the Maldives.<br />
Key issues discussed included the significant lack <strong>of</strong> women<br />
participating in the tourism industry, the lack <strong>of</strong> awareness with<br />
regard to career opportunities in the tourism industry, and the fact that there are relatively few locals being<br />
employed at managerial positions in the hospitality sector.<br />
Brainstorming sessions were also held to identify ways to motivate locals to work in the tourism sector, and to<br />
discuss which jobs are more suited for expatriates and locals as well as to increase the number <strong>of</strong> Maldivians<br />
at managerial positions in the tourism industry.<br />
49
A survey was carried out in February 2008, to find out the factors that motivate locals for resort employment.<br />
The survey was undertaken by a private company named, Laurel Maldives Pvt Ltd at the request <strong>of</strong> the<br />
<strong>Ministry</strong> <strong>of</strong> <strong>Tourism</strong> & Civil Aviation. A total <strong>of</strong> 310 local employees from 5 resorts were interviewed through<br />
a questionnaire. The five resorts selected for the survey were the resorts with highest percentage <strong>of</strong> local<br />
employees in them.<br />
According to the findings <strong>of</strong> the survey, locals are motivated to work in resorts where they are treated well<br />
and paid fairly. They have noted in order <strong>of</strong> preference freedom, food, sports, accommodation, salary,<br />
environment (resort culture), job security, training, good management, and proximity to Male’ or home island<br />
as factors motivating locals. The local employees have also noted poor accommodation, inadequate rules,<br />
discrimination, job insecurity, unavailability <strong>of</strong> leave, and low pay as some <strong>of</strong> the factors that keep locals<br />
away from resort employment.<br />
First meeting <strong>of</strong> the Sri-Lanka Maldives joint task force technical team was held in Sri Lanka Institute <strong>of</strong><br />
<strong>Tourism</strong> & Hotel Management, Colombo on 28th March 2008. The possibility <strong>of</strong> sending tour operators to<br />
Maldives on an observation tour was discussed in the meeting. The task force was formed in 6 May 2003.<br />
The main objective <strong>of</strong> the task force is, recognising the development <strong>of</strong> economic and cultural relations as<br />
well as for the imrovement <strong>of</strong> mutual understanding between their peoples and thereby further strengthening<br />
the friendly relations between the Maldives and Sri Lanka.<br />
A regulation on the operation <strong>of</strong> Tourist Guest Houses in the Maldives came to effect from 1 January 2008.<br />
The regulation was compiled and made public during December 2007.<br />
On 25 November 2007, the revised regulation on Tourist Safari Vessels in the Maldives was released. This<br />
regulation also came into effect from 1 January 2008.<br />
The Foreign Tourist Vessels Regulation, which was released on 3 December 2008, came into effect from<br />
1 January 2008. Under this regulation, Bed Tax will be collected for the first time, from foreign tourist<br />
vessels.<br />
Under the population consolidation project, 3 islands were announced for tender for resort development in<br />
2008. The three islands were, Vakkaru in Baa Atoll, Ehthigili from Raa Atoll and Falhumaafushi <strong>of</strong> Gaaf Alif<br />
Atoll. Out <strong>of</strong> these three islands, Vakkaru and Flahumaafushi lease agreements were signed during the month<br />
<strong>of</strong> February 2008.<br />
50
The Airport Representatives’ Association <strong>of</strong> Maldives (ARAM), a newly registered association, was<br />
introduced to industry stakeholders by the <strong>Ministry</strong> <strong>of</strong> <strong>Tourism</strong> and Civil Aviation. The association was<br />
formed to represent airport representatives and express their views on industry issues. Some <strong>of</strong> the pressing<br />
issues highlighted were customer care and training opportunities for the representatives. ARAM works<br />
in collaboration with the industry players and the Faculty <strong>of</strong> Hospitality and <strong>Tourism</strong> Studies (FHTS), to<br />
organize training courses for their representatives.<br />
The <strong>Ministry</strong> <strong>of</strong> <strong>Tourism</strong> & Civil Aviation, in association<br />
with Maldives National Defence Force Coast Guard and the<br />
Divers Association <strong>of</strong> Maldives held a one day seminar on<br />
Diving and Water Sports Safety during the month <strong>of</strong> June<br />
2008. The objectives <strong>of</strong> this seminar include, discussing<br />
and identifying safety issues in the dive industry, formulate<br />
possible amendments to the Maldives Recreational Diving<br />
Regulation, discuss and identify safety issues related to water<br />
sports, identify areas that need to be addressed in formulation<br />
<strong>of</strong> Water Sports Regulations and identify and strengthen selfregulatory<br />
aspects related to Dive & Water sports safety.<br />
Participants <strong>of</strong> this seminar include, tourist resorts and safari operators in the Maldives. Also among the<br />
participants were the Live-aboard Association <strong>of</strong> Maldives (LAM), Maldives Association <strong>of</strong> <strong>Tourism</strong> Industry<br />
(MATI), Surf Association <strong>of</strong> Maldives (SAM), Life Guard Association <strong>of</strong> Maldives as well as some <strong>of</strong> the<br />
Dive School operators in the Maldives.<br />
The <strong>Ministry</strong> <strong>of</strong> <strong>Tourism</strong>, <strong>Arts</strong> and <strong>Culture</strong> conducted a survey in Male’ International Airport, among<br />
international tourists departing from the Maldives during the month <strong>of</strong> December 2008 for a period <strong>of</strong> one<br />
week. The purpose <strong>of</strong> this survey was to compile a tourist pr<strong>of</strong>ile and to understand visitor’s perception <strong>of</strong><br />
the quality <strong>of</strong> experience in the Maldives. Questionnaires were prepared in English, Italian, German, French,<br />
Japanese and Chinese.<br />
51
A number <strong>of</strong> activities had been carried out by the Maldives <strong>Tourism</strong> Promotion Board, during the year<br />
2008. Some <strong>of</strong> the activities include, participating in international tourism fairs and road shows, conducting<br />
familiarization trips, advertisement through print media as well as broadcast media.<br />
In order to compile the Maldives <strong>Tourism</strong> Marketing Plan for 2009, a workshop was held to discuss and<br />
get ideas and opinions from the tourism industry <strong>of</strong> Maldives. A total <strong>of</strong> 88 participants from 54 companies<br />
participated in this one day workshop held in July 2008.<br />
The main purpose workshop, which was organized by the Maldives <strong>Tourism</strong> Promotion Board, was to discuss<br />
marketing activities that could be carried out in the near future to promote Maldives tourism.<br />
Australasia’s Association <strong>of</strong> Surfing Pr<strong>of</strong>essionals organized a world<br />
class surfing competition in collaboration with Maldives <strong>Tourism</strong><br />
Promotion Board which was held from 9-15 June 2008. This event<br />
was sponsored by Maldives <strong>Tourism</strong> Promotion Board, Sri Lankan<br />
Airlines, Dhiraagu Pvt. ltd, Chaaya Island Dhonveli, Bank <strong>of</strong> Maldives,<br />
Inner Maldives Holidays, Atoll Travel and Atoll Adventures. This<br />
competition was held in Male’ Atoll’s Chaaya Island Dhonveli resort’s<br />
surfing area at the South West <strong>of</strong> the island called ‘Pasta Point’. A total<br />
<strong>of</strong> 144 surfers participated in the competition.<br />
Maldives participated as the ‘guest country’ (main sponsor) in the FESPO fair which took place in Zurich,<br />
Switzerland during the period 31st January to 1st February 2008. Participants <strong>of</strong> this fair include 10 companies<br />
working in the tourism sector <strong>of</strong> the Maldives, tour operators and airline operators. In this fair the Maldives’<br />
stand was designed in a way which it portrayed the cultural aspects <strong>of</strong> the Maldives. Likewise, Maldivian<br />
handicrafts such as lacquer work and Maldivian meals were made available. In addition to this, a cultural<br />
dance was performed by ‘Harubee’ dance group. Dr. Mahmood Shaugee, the then Minister <strong>of</strong> <strong>Tourism</strong> and<br />
Civil Aviation was the head <strong>of</strong> the Maldivian delegation.<br />
52
The Maldives participated at the World’s Leading Travel Trade Show,<br />
ITB which was held in Berlin, Germany from 5-9 March 2008. More<br />
than 180,000 visitors attended the fair amongst which 108,000 were<br />
trade visitors. There were over 10,000 exhibitors from 180 countries<br />
exhibited at the fair this year. Maldives was represented at a two storey<br />
stand custom built to portray an island resort. 155 Representatives<br />
from 67 companies were present at the Maldives stand. The then<br />
Minister <strong>of</strong> <strong>Tourism</strong> & Civil Aviation, Dr. Mahmood Shaugee was the<br />
head <strong>of</strong> Maldivian delegation.<br />
Maldivian Night which is renowned to be one <strong>of</strong> the most popular events during ITB was held on Wednesday,<br />
9th March 2008 at the Maritim ProArte Hotel, Berlin. The main idea <strong>of</strong> the function is for networking and for<br />
thanking the tourism industry for their continued support. About 650 industry partners attended the function<br />
this year.<br />
The Maldives participated in the B.I.T fair which took place from<br />
21st to 24th February 2008 in Milan, Italy. Parties working in the<br />
Maldives tourism industry took part in this fair and discussed business<br />
strategies and transactions. The Deputy Minister <strong>of</strong> <strong>Tourism</strong> and Civil<br />
Aviation Dr. Abdullah Mausoom, who lead the Maldivian delegation<br />
met with heads <strong>of</strong> important tour operators and airline operators <strong>of</strong><br />
Italy gave information regarding the activities taking place in order to<br />
expand the tourism industry <strong>of</strong> the Maldives. In this fair, information<br />
about the tourism industry in Maldives was also given to the Italian<br />
media and travel magazines.<br />
A cocktail evening was held in the stand on the night <strong>of</strong> 22nd February. A total <strong>of</strong> 200 people from parties<br />
working in the tourism industry from Italy and other countries and also people from the media participated<br />
in this event.<br />
The Maldives Promotion Board and 16 parties working in the tourism industry <strong>of</strong> the Maldives participated<br />
in Asia’s largest travel exhibition, JATA World Travel Fair which was held in Tokyo, Japan from 14-16<br />
September 2008. The then Minister <strong>of</strong> <strong>Tourism</strong> and Civil Aviation, Dr. Abdullah Mausoom was the head <strong>of</strong><br />
the Maldivian delegation. JATA world congress also took place during the fair. The Maldivian ambassador<br />
for Japan H.E. Abdul Hameed Zakariyya, Island Aviation Services’ Managing Director Mr. Bandhu Ibrahim<br />
Saleem and people from the Maldives <strong>Tourism</strong> Promotion Board also joined the congress. After the congress,<br />
a news conference was held with Japan’s media to deliver information about tourism in the Maldives.<br />
On 19th September 2008, a special evening was held in “Nikko” hotel, Tokyo, Japan. People from the<br />
Japanese tourism industry and media joined this event. ‘Tropical Paradise Guide 2009” book was launched<br />
in this evening by Minister Dr. Abdulla Mausoom.<br />
53
The World Travel Market (WTM) is the largest travel fair held in United<br />
Kingdom, and Maldives exhibited at the fair which was held from 10th<br />
to 13th November 2008 in London. The Maldives <strong>Tourism</strong> Promotion<br />
Board along with 70 companies working in the tourism industry <strong>of</strong> the<br />
Maldives participated in this event. This fair which was targeted for<br />
people in the international tourism industry received 50000 visitors.<br />
Information about the Maldivian tourism industry and the action being<br />
taken to further develop the industry were given to the media. A video<br />
commercial <strong>of</strong> Maldives was shown in the fair’s main stage and Main Boulevard’s wall. The stand design<br />
<strong>of</strong> the stand showed the developments in Maldives tourism. Comments and opinions <strong>of</strong> the visitors were<br />
collated regarding the new stand design.<br />
Apart from the stated fairs, Maldives also participated in the following fairs.<br />
NAME OF THE FAIR CITY, COUNTRY DATE<br />
Vakantiebeurs, Utrecht, Netherlands 8-13 Jan 2008<br />
Reiseliv, Oslo, Norway 10-13 Jan 2008<br />
Ferien Messe Vienna, Austria 17-20 Jan 2008<br />
Matca Finland 17-20 Jan 2008<br />
The Holiday & Travel Show Belfast, Ireland 18-20 Jan 2008<br />
Boot Dusseldorf, Germany 19-27 Jan 2008<br />
B.T.L Lisbon, Portugal 21-25 Jan 2008<br />
Fitur Madrid, Spain 28 Jan - 1 Feb 2008<br />
The Bride Show Abu Dhabi, UAE 5-8 Feb 2008<br />
Holiday World Paraguay, Czech Republic 14-17 Feb 2008<br />
C.B.R Munich, Germany 14-18 Feb 2008<br />
The New York Times Travel Show New York, USA 29 Feb - 2 Mar 2008<br />
LIDS London, UK 8-9 Mar 2008<br />
Globe Rome, Italy 13-15 Mar 2008<br />
Maps Paris, France 13-17 Mar 2008<br />
MITT Moscow, Russia 19-22 Mar 2008<br />
Marine Dive Fair Tokyo, Japan 4-6 Apr 2008<br />
Emirates Holiday World Dubai., UAE 2-4 May 2008<br />
Arabian Travel Market Dubai., UAE 6-9 May 2008<br />
Korea World Travel Fair Seoul, South Korea 5-8 June 2008<br />
I.T.E Hong Kong 12-15 June 2008<br />
Asia Luxury Travel Market Shanghai, China 16-19 June 2008<br />
Getaway Show Johannesburg, South Africa 29-31 Aug 2008<br />
Top Resa Deauville, France 16-19 Sep 2008<br />
I.T.B Asia Singapore 22-24 Oct 2008<br />
T.T.G Rimini, Italy 24-26 Oct 2008<br />
C.I.T.M Shanghai, China 20-23 Nov 2008<br />
I.L.T.M Cannes, France 3-6 Dec 2008<br />
54
The Maldives has been receiving international recognitions, awards and honors by international travel<br />
magazines and other travel related agencies. In the year 2008, the destination received four major international<br />
awards. Following are the details.<br />
The Maldives won the best island destination award for 2008 chosen by UK’s travel trade magazine Conde<br />
Nast Traveler. Conde Nast Traveler magazine is one <strong>of</strong> the fastest selling magazines in the UK with a<br />
circulation <strong>of</strong> over 85,000.<br />
The Maldives was chosen as the Ultra Award’s Best Holiday Destination World Wide by a famous daily<br />
magazine in the UK called The Daily Telegraph’s travel edition “Ultra Travel”. The Maldives was chosen<br />
as the best destination by competing with world famous destinations such as Australia, South Africa, New<br />
Zealand and Thailand.<br />
The Maldives won the Best <strong>Tourism</strong> Publicity Award in the Korea World Travel Fair, which was held in<br />
Seoul, South Korea in June 2008.<br />
At the World Travel Awards, the Maldives won Indian Oceans Leading Destination award from the Asia and<br />
Indian Ocean region. The ceremony was held at Shanghai, China in June 2008.<br />
The Maldives won World’s number one Long Haul Destination Award 2007, chosen by the world famous<br />
tour operator, Kouni Travels.<br />
55
Explanatory notes and definitions in this publication are used as per United Nation’s World <strong>Tourism</strong> Organization’s<br />
(UNWTO) recommendations. However, some <strong>of</strong> the terminologies are specific to the use <strong>of</strong> data provided in this<br />
publication itself.<br />
Following are some <strong>of</strong> the UNWTO definitions.<br />
<strong>Tourism</strong> comprises the activities <strong>of</strong> persons travelling to and staying in places outside their usual environment for not<br />
more than one consecutive year for leisure, business and other purposes.<br />
International visitor refers to any person traveling to a country other than the one in which he/she has his/her usual<br />
residence, but outside his/her usual environment, for less than 12 consecutive months and whose main purpose <strong>of</strong> trip is<br />
other than the exercise <strong>of</strong> an activity remunerated from within the place visited.<br />
Tourist (overnight visitor) is a visitor who stays at least one night in a collective or private accommodation in the<br />
country visited.<br />
Nationality <strong>of</strong> a visitor is that <strong>of</strong> the government issuing his/her passport or other identification document, even if he/<br />
she normally resides in another country.<br />
Tourist accommodation refers to any facility that regularly or occasionally provides overnight accommodation for<br />
tourists.<br />
Occupancy rate refers to the proportion <strong>of</strong> the rooms or bed-places in a collective tourism establishment that is occupied<br />
over some period <strong>of</strong> time, such as night, month or year.<br />
Duration <strong>of</strong> stay refers to the time spent during a visit measured from the stand point <strong>of</strong> the receiving country or<br />
place.<br />
<strong>Tourism</strong> receipts are defined as expenditures <strong>of</strong> international inbound visitors including their payments to national<br />
carriers for international transport. They also include any other prepayments or payments afterwards made for good and<br />
services received in the destination country.<br />
Apart from the above UNWTO definitions, the following definitions from the Maldives <strong>Tourism</strong> Act (Law No. 2/99) are<br />
adopted for this publication.<br />
Tourist resort refers to an island or a designated area <strong>of</strong> an island that has been developed to accommodate tourists and<br />
to provide board and lodging facilities for them.<br />
Tourist hotel refers to an establishment, other than a tourist resort or a tourist guesthouse, that has been developed to<br />
provide board and lodging or [only] lodging for tourists for a payment decided at a certain rate per day <strong>of</strong> stay.<br />
Tourist guesthouse refers to an establishment, other than a tourist hotel, that has been developed, in compliance with<br />
standards determined by the <strong>Ministry</strong> <strong>of</strong> <strong>Tourism</strong>, to provide board and lodging or [only] lodging for tourists for a<br />
payment decided at a certain rate per day <strong>of</strong> stay.<br />
Tourist vessel (safari vessel) refers to seagoing vessel that has been developed, in compliance with standards determined<br />
by the <strong>Ministry</strong> <strong>of</strong> <strong>Tourism</strong>, to provide board and lodging for tourists for a payment decided at a certain rate per day <strong>of</strong><br />
stay on board such vessel.<br />
Marina refers to harbors developed for anchoring yachts and such vessels and to provide various services to those<br />
vessels
<strong>Ministry</strong> <strong>of</strong> <strong>Tourism</strong>, <strong>Arts</strong> and <strong>Culture</strong><br />
First Floor, Ghazee Building, Ameer Ahmed Magu, Male’ 20094, Republic <strong>of</strong> Maldives<br />
Tel: +960 332 3224, Fax: +960 332 2512<br />
Email: info@maldivestourism.gov.mv, Website: http://www.tourism.gov.mv<br />
ISBN 99915-95-45-7