DIFFERENTIAL IMPEDANCE ANALYSIS OF CONDUCTIVITY AND ...
DIFFERENTIAL IMPEDANCE ANALYSIS OF CONDUCTIVITY AND ...
DIFFERENTIAL IMPEDANCE ANALYSIS OF CONDUCTIVITY AND ...

You also want an ePaper? Increase the reach of your titles
YUMPU automatically turns print PDFs into web optimized ePapers that Google loves.
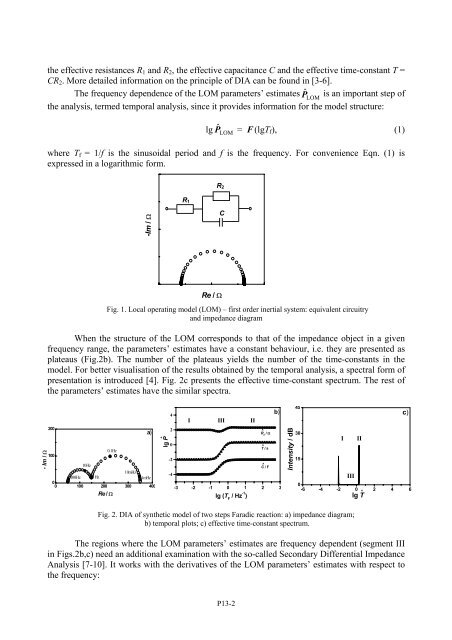
the effective resistances R 1 and R 2 , the effective capacitance C and the effective time-constant T =<br />
CR 2 . More detailed information on the principle of DIA can be found in [3-6].<br />
The frequency dependence of the LOM parameters’ estimates ˆP LOM<br />
is an important step of<br />
the analysis, termed temporal analysis, since it provides information for the model structure:<br />
lg ˆP LOM = F (lgT f ), (1)<br />
where T f = 1/f is the sinusoidal period and f is the frequency. For convenience Eqn. (1) is<br />
expressed in a logarithmic form.<br />
R 2<br />
R 1<br />
-Im / Ω<br />
C<br />
Re / Ω<br />
Fig. 1. Local operating model (LOM) – first order inertial system: equivalent circuitry<br />
and impedance diagram<br />
When the structure of the LOM corresponds to that of the impedance object in a given<br />
frequency range, the parameters’ estimates have a constant behaviour, i.e. they are presented as<br />
plateaus (Fig.2b). The number of the plateaus yields the number of the time-constants in the<br />
model. For better visualisation of the results obtained by the temporal analysis, a spectral form of<br />
presentation is introduced [4]. Fig. 2c presents the effective time-constant spectrum. The rest of<br />
the parameters’ estimates have the similar spectra.<br />
- Im / Ω<br />
200<br />
a)<br />
0.1Hz<br />
100<br />
10Hz<br />
10mHz<br />
100Hz 1Hz<br />
1mHz<br />
0<br />
0 100 200 300 400<br />
Re / Ω<br />
lg P^<br />
4<br />
2<br />
0<br />
-2<br />
-4<br />
I III II<br />
^<br />
T / s<br />
^<br />
C / F<br />
b)<br />
-3 -2 -1 0 1 2 3<br />
lg (T / Hz -1 )<br />
F<br />
^<br />
R 2 / Ω<br />
Intensity / dB<br />
45<br />
30<br />
15<br />
I<br />
III<br />
c)<br />
0<br />
-6 -4 -2 0 2 4 6<br />
lg T^<br />
II<br />
Fig. 2. DIA of synthetic model of two steps Faradic reaction: a) impedance diagram;<br />
b) temporal plots; c) effective time-constant spectrum.<br />
The regions where the LOM parameters’ estimates are frequency dependent (segment III<br />
in Figs.2b,c) need an additional examination with the so-called Secondary Differential Impedance<br />
Analysis [7-10]. It works with the derivatives of the LOM parameters’ estimates with respect to<br />
the frequency:<br />
P13-2